Page 1
Interfacial Energetics of Protein Adsorption to a Hydrophobic Solid-Water Surface
A Contribution from the Hematology at Biomaterial Interfaces Research Group
By
Anandi Krishnan,† Yi-Hsiu Liu,‡ Paul Cha,‡ David Allara,‡♦ and Erwin A. Vogler∗†‡
Departments of Bioengineering,† Chemistry,♦ Materials Science and Engineering‡ Materials Research Institute‡ and Huck Institute of Life Sciences†‡
The Pennsylvania State University University Park, PA 16802
* Author to whom correspondence should be addressed [email protected]
Key words: Protein Adsorption, solid-water surface, blood proteins, air-water surface, interface, interphase, liquid-vapor, solid-liquid, SAM, self-assembled monolayer, Gibbs’ Excess Running title: Interfacial Energetics of Protein Adsorption
Page 2
Abstract
Adsorption isotherms of nine (9) globular proteins with molecular weight (MW) spanning 10-1000
kDa confirm that interfacial energetics of protein adsorption to a hydrophobic solid-water (solid-
liquid, SL) surface are not fundamentally different than adsorption to the water-air (liquid-vapor,
LV) surface. Isotherms constructed from concentration-dependent advancing contact angles aθ of
buffered protein solutions on methyl-terminated, self-assembled monolayer surfaces show that
maximum advancing spreading pressure, , falls within a relatively narrow
mN/m band characteristic of all proteins studied, mirroring results obtained at the LV surface.
Furthermore, isotherms exhibited a ‘Traube-rule-like’ progression in similar to the
ordering observed at the LV surface wherein molar concentration required to reach a specified
spreading pressure decreased with increasing MW. Finally, neither Gibbs’ surface excess
quantities [
maxaΠ max10 20a< Π <
aΠ MW
aΠ
]sl svΓ − Γ nor varied significantly with protein MW and lvΓ[ ]sl sv
lv
⎧ ⎫Γ − Γ⎨ ⎬Γ⎩ ⎭
~ 1 implying
and that chemical activity of protein at SL and LV surfaces was identical. These results are
collectively interpreted to mean that water controls protein adsorption to hydrophobic surfaces and
that the mechanism of protein adsorption can be understood from this perspective for a diverse set of
proteins with very different composition.
0svΓ ∼
Page 3
1. Introduction
It is our contention that contemporary mechanisms of protein adsorption to surfaces do not properly
account for the role of water in the process and, in so doing, fail to discern unifying trends in protein
adsorption.1-4 For example, literature illustrations depict protein and adsorbent surfaces without
juxtaposing hydration layers, one layer for protein and one for surface, and do not contemplate how
these layers are displaced or coalesced as protein and surface come into close contact. Many modern
computational models probing protein interactions with surfaces regard water as a complicating
feature that can be ignored for the sake of reasonable computational time (see refs. 5-7 and citations
therein). When water is included in such models, it is usually only those molecules directly adjacent
to the protein that comprise the ‘bound-water layer’, classically measured by δ in grams-water-per-
gram-protein8-10 (δ ~ 0.35 g/g is found to be a representative average value).10 This protein-bound
water layer falls well short of the volume that must be displaced when a protein molecule approaches
a hydrated adsorbent surface. That is to say, since two objects cannot occupy the same space at the
same time, a volume of interfacial water at least equal to the partial specific volume of the
adsorbing protein must move ( 0.70 cm3/g protein).11 Some or all of this interfacial
water is bound to the adsorbent surface to an extent that varies with surface energy (water
wettability).12,13 Consequently, protein adsorption is found to scale with water wettability,14-16
underscoring need to incorporate surface hydration explicitly into protein adsorption models.
Indeed, accounting for water in protein adsorption has become a significant preoccupation of quartz
crystal microbalance (QCM) practitioners because QCM measures not only adsorbed protein mass
but also “trapped”17 or “intra-layer”18 or “hydrodynamically coupled”19 water.
ov
0.75ov≤ ≤
1
Page 4
We have made use of a simplified ‘core-shell’ model of globular proteins in which spheroidal
molecules are represented as a packed core surrounded by a hydration shell. The core has a radius
that scales with molecular weight ( ) and the hydration shell has a thickness such that the
ensemble radius
vr1/ 3MW
vR rχ= equals the hydrodynamic radius;1 where χ is a generic factor for all
proteins. Calibration to human serum albumin (FV HSA) dimensions reveals that R = 1.3 (30%
larger than ) and contains about 0.9 g water/g protein.20 Hence, the hydration layer accommodated
by this model is ~ 3X greater than
vr
vr
δ . At surface-saturating protein concentrations (as measured by
neutron reflectometry or tensiometry, for examples), this model suggests that protein packs in a
hydrophobic surface region to nearly face-centered-cubic (FCC) concentrations wherein hydration
shells touch but do not overlap.1 We propose that osmotic repulsion among hydrated protein
molecules limits interphase capacity. Stated another way, protein adsorption is limited by the extent
to which the hydrophobic interface can be dehydrated through displacement of interfacial water by
adsorbing protein. Accordingly, protein adsorption is more about solvent than protein itself.
This water-oriented perspective on protein adsorption presents a considerable simplification of the
protein-adsorption process and, as a result, a tractable quasi-thermodynamic theory can be sketched
out for a phenomenon that would otherwise be overwhelmingly complex for more than just a few
proteins in solution. We find that this theory naturally explains the experimentally-observed
‘Traube-rule progression’ in which molar concentrations required to fill the liquid-vapor (LV)
surface follow a homology in protein size, consistent with packing hydrated spheroidal molecules
within this space.1 A relatively straightforward set of “mixing rules” follow directly, stipulating both
concentration and weight-fraction distribution of proteins adsorbed to the LV surface from multi-
component aqueous solutions such as blood plasma or serum at equilibrium.3 These mixing rules
2
Page 5
rationalize the long-known-but-otherwise-unexplained observations that (i) LV interfacial tension
lvγ of blood plasma and serum is nearly identical, in spite of the fact that serum is substantially
depleted of coagulation proteins such as fibrinogen; and (ii) lvγ of plasma and serum derived from
human, bovine, ovine, and equine blood is practically identical, even though there are substantial
differences in plasma proteome among these species.4
This paper discloses results of an investigation of protein adsorption to a well-defined, hydrophobic
solid-water (solid-liquid, SL) interface. Methyl-terminated, self-assembled thiol monolayers
(SAMs) on gold-coated semiconductor-grade silicon wafers exhibiting water contact angles
are used as test substrata. Time-and-concentration-dependent contact angles measure
adsorption energetics of (globular) proteins spanning 3 decades in MW in a manner parallel to the
above-cited studies of protein adsorption to the LV surface. We find that the basic pattern observed
at the LV surface is repeated at the hydrophobic SL surface, supporting our contention that water is
the significant controller of protein adsorption to surfaces.
110oaθ ∼
2. Materials and Methods
Purified Proteins and Synthetic Surfactants: Table 1 compiles pertinent details on proteins and
surfactants used in this work. Protein purity was certified by the vendor to be no less than the
respective values listed in Column 4 of Table 1, as ascertained by electrophoresis (SDS-PAGE or
IEP). Mass, concentration, and molecular weights supplied with purified proteins were accepted
without further confirmation. Issues associated with protein purity, especially contamination with
surfactants, and the potential effect on measured interfacial tensions were discussed in detail in
ref. 2. The single value given in Table 1 (Column 5) for physiological concentration of human
3
Page 6
proteins applied in this work was middle of the range listed by Putnam.21 Serial dilutions of protein
stock solutions (usually 10 mg/mL) were performed in 96-well microtiter plates by (typically) 50:50
dilution in phosphate buffered saline solution (PBS) prepared from powder (Sigma Aldrich) in
distilled-deionized (18.2 MΩ-cm) water using procedures detailed in ref. 2 (interfacial tension of
PBS and water was checked periodically by Wilhelmy-balance tensiometry). Between 24-30
dilutions were prepared in this manner, covering a dynamic range between 10-10 to 1 % (w/v), taking
care to mix each dilution by repeated pipette aspiration and avoiding foaming of concentrated
solutions.
Surfaces: Methyl-terminated, self-assembled monolayer surfaces (SAMs) were prepared according
to standard methods of surface engineering.22-26 Briefly, silicon wafers were pre-cleaned in hot 1:4
H2O2 (30%)/H2SO4 followed by rinsing with distilled-deionized H2O and absolute ethanol. Gold-
coated wafers were prepared by vapor deposition of chromium and gold (99.99% purity), from
resistively-heated tungsten boats, onto clean 3-in. diameter silicon wafers at about 1 x 10⁻⁸ torr base
pressure in a cryogenically pumped deposition chamber. The sample was not allowed to rise above
~40oC during the evaporation. Film thicknesses, monitored with a quartz crystal oscillator, were
typically 15nm and 200nm for chromium and gold, respectively. Chromium was deposited prior to
gold to enhance adhesion to the substrate. After deposition, the chamber was backfilled with
research-grade nitrogen. Gold-coated samples were removed and immersed in 1mM solutions of 1-
hexadecanethiol (CH3(CH2)15SH) in ethanol, contained in glass jars at ambient temperature, for at
least 3 days. The alkanethiol (Aldrich Chemical Co., Milwaukee, WI) and ethanol (commercial
reagent-grade) were used as-received, without further purification. Samples were stored in the thiol
solution until use, and were rinsed with ethanol just prior to an experiment.
4
Page 7
Tensiometry & Goniometry: Liquid-vapor interfacial tensions required by this work were
measured by Pendant Drop Tensiometry (PDT) as described in refs. 1-4. Tilting-plate goniometry
(TPG) was performed using a commercial-automated goniometer (First Ten Angstroms Inc.,
Portsmouth, VA). Advancing contact angles ( aθ ) applied in this work have been verified to be in
statistical agreement with those obtained by Wilhelmy balance tensiometry (WBT) and Captive-drop
goniometry (CDG), as detailed in ref. 27. Receding angles ( rθ ) were shown to be not as reliable as
aθ . Consequently, only aθ was analyzed in this work. The tilting-plate goniometer (TPG)
employed a Tecan liquid-handling robot to aspirate 12 µL of solutions contained in a 96-well
microtiter plate prepared by the serial-dilution protocol mentioned above. The robot was used to
reproducibly transfer the tip with fluid contents into a humidified (99+ % RH) analysis chamber and
dispense 10 µL drops of protein solution onto the surface of test substrata (see below) held within the
focal plane of a magnifying camera. These and all other aspects of TPG were performed under
computer control. Proprietary algorithms supplied by the vendor were used to deduce contact angles
from drop images captured at a programmed rate by a frame grabber. Typically, 600 images were
captured at a rate of 1 image every 6 sec following 0.25 sec delay to permit vibrations of the
expelled drop to dampen. Drop evaporation rates within the humidified chamber deduced from
computed-drop volumes (based on image analysis) were observed to vary with solute concentration,
generally ranging from approximately 25 nL/min for pure water to 10 nL/min for solute solutions >
0.1% w/v. The impact of this evaporation rate over the 60 min time frame of the experiment was
apparently negligible, as gauged from the behavior of purified surfactants discussed in the results
section. Precision of aθ was about 0.5o based on repeated measurement of the same drop. The
analysis chamber was thermostated to a lower-limit of 25±1 oC by means of a computer-controlled
resistive heater. Upper-temperature limit was not controlled but rather floated with laboratory
5
Page 8
temperature, which occasionally drifted as high as 29 oC during summer months. Thus, reported aθ
values were probably not more accurate than about 1o on an inter-sample basis considering the small,
but measurable, variation of water interfacial tension with temperature. This range of accuracy was
deemed adequate to the conclusions of this report which do not strongly depend on more highly
accurate aθ that is difficult to achieve on a routine basis. Instead, veracity of arguments raised
herein depend more on a breadth of reliable measurements made across the general family of human
proteins.
Test substrata were held on a rotating, tilting-plate platform driven by stepper motors under
computer control. Substrata were allowed to come to equilibrium within the sample-chamber
environment for no less than 30 min before contact angle measurements were initiated. The
platform was programmed to tilt at 1o/sec from horizontal to 25o after the drop was deposited on the
surface by the robot. The optimal (incipient rolling) tilt angle was found to be 25o and 15o for
solutions of proteins and surfactants respectively. The first 120 sec (20 images) monitored evolution
of the advancing angle. At the end of the 1 hr aθ measurement period, the platform was programmed
to return to horizontal and rotate 15o to the next analysis position along the periphery of the
semiconductor wafer. This process was repeated for all dilutions of the protein under study so that
results reported for each protein were obtained on a single test surface, eliminating the possibility of
substratum variation within reported results.
Computation and Data Representation: Computational, statistical, and theoretical methods used
in this work have been discussed in detail elsewhere.1,2,14,15,28,29 Briefly, time-dependent aθ data
corresponding to protein dilutions (see above) were recovered from TPG files and correlated with
6
Page 9
concentrations, leading to a matrix of results with row values representing concentration and time (in
sec) as column values. It was generally observed that aθ isotherms were sigmoidal in shape when
plotted on logarithmic-concentration axes,14,28 with well-defined low-concentration asymptote oaθ
and high-concentration asymptote 'aθ (see Fig. 1). Successive non-linear least-squares fitting of a
four-parameter logistic equation '
'/ 21 (ln / ln )
[ a aa M
B BC Cθ θ ]aθ θΘ
−=
++ to contact angle isotherms data for
each time within the observation interval quantified parameters oaθ and '
aθ with a measure of
statistical uncertainty. Fitting also recovered a parameter measuring concentration-at-half-maximal-
change in aθ , / 2 max max 'ln (where / 2 1/2 and )BC a aθ θΘ Θ = Θ Θ ≡ − , as well as a parameter M that
measured steepness of the sigmoidal curve. This multi-parameter fitting to concentration-dependent
aθ data was a purely pragmatic strategy that permitted quantification of best-fit protein and
surfactant characteristics but is not a theory-based analysis.14,15,28 Three-dimensional (3D)
representations of time-and-concentration-dependent aθ data were created in Sigma Plot (v8) from
the data matrix discussed above and overlain onto fitted-mesh computed from least-squares fitting.
Two-dimensional (2D) representations were created from the same data matrices at selected
observation times. Measured aθ were converted to advancing adhesion tension coslva aτ γ= θ for
general interpretation;28 where lvγ was the interfacial tension of the contact-angle fluid. Adhesion
tensions, coslv
o oa
oaτ γ= θ '
a (pure saline) and ' ' coslvaτ γ= θ (at the minimum contact angle observed '
aθ )
were computed with fitted parameters lv
γ and 'lv
γ reported in refs. 1,2 for the proteins under
investigation. Smoothed adhesion-tension isotherms ( aτ vs. l ) were computed from smoothed n BC
aθ using smoothed lvγ values computed from best-fit parameters reported in refs. 1,2. Likewise,
7
Page 10
smoothed spreading pressure isotherms ( aΠ vs. ) were computed from smoothed ln BC aτ curves,
where ( )a a aτ τΠ ≡ − .
3. Theory
Adsorption Isotherms: Adsorption of surface-active solutes (surfactants, where the term includes
both synthetic detergents and proteins) can affect liquid-vapor (LV), solid-vapor (SV), or solid-
liquid (SL) interfacial tensions, thus producing a change in measured contact angles θ as given by
the Young equation coslv sv slτ γ θ γ γ≡ = − ; where τ is adhesion tension and γ is the interfacial
tension at the interface denoted by subscripts. Thus, contact angles can be used to monitor
adsorption to solid surfaces.14,15 Contact-angle isotherms are graphical constructions plotting
advancing contact angles aθ against ln (see Fig. 1 for examples); where surfactant bulk-phase
concentrations range from 10-10 to 1 % (w/v, see Materials and Methods). Contact-angle
isotherms were sequentially interpreted in terms of adhesion tension (
BC
BC
aτ vs. ) and spreading
pressure ( vs. ) isotherms; where
ln BC
aΠ ln BC coslva aτ γ θ≡ , ( )o
a a aτ τΠ = − , lvγ is the LV interfacial
tension of the fluid at , and BC oaτ is the adhesion tension of pure buffer ( .
We monitored time dependence of all three isotherm forms but herein interpret only steady-state
(equilibrium) measurements. Secure interpretation of measured
71.97mN/m @ 25 )lv
o Cγ =
aθ in terms of aτ depends on
accurate knowledge of lvγ at the bulk-phase surfactant concentration in equilibrium with SL and LV
interfaces. Thus, solute depletion of the bulk phase by adsorption can require significant correction
of as-prepared bulk-phase concentration . In the case of protein adsorption, however, solute
depletion is not a serious issue as can be readily deduced from the following calculation. Adopting 2
BC
8
Page 11
mg/m2 as a nominal protein concentration adsorbed to the surface of a hypothetical 10 µL spherical
drop (2.2X10⁻⁵ m2 surface area) from a surface-saturating 3 mg/mL bulk-phase composition (e.g.
albumin adsorbed to the LV surface as determined by neutron reflectometry),1,30 it is evident that
only 47 ng or about 0.15% of bulk-phase protein is removed by adsorption. Thus, it can be
concluded that protein adsorbed from a contact-angle droplet onto a hydrophobic surface does not
significantly deplete the bulk fluid phase and no correction of bulk-phase concentrations is required.
Gibbs’ Excess: Practical use of concentration-dependent contact angles as a measure of adsorption
to the solid-liquid (SL) interface has been discussed at length elsewhere (see, for examples, refs.
14,15,28 and citations therein). Briefly, for the purposes of this paper, the amount of solute
adsorbed to SV and SL interfaces is measured by the Gibbs’ surface excess quantities svΓ and slΓ ,
respectively, in units of moles/area (the subscript “a” specifying advancing contact angles is not
carried in symbology for the sake of notational compactness). The difference [Γ ]sl svΓ − Γ (but not
separate excess parameters) can be computed from data comprising contact-angle isotherms using
Eq. (1):
[ ] [ ] [sl
sincos
lnlv a a
sv lv aB
dRT d C
γ θ θ ]θ⎧ ⎫⎛ ⎞⎪Γ − Γ = − + Γ⎨ ⎜ ⎟⎪ ⎪⎝ ⎠⎩ ⎭
⎪⎬
B
(1)
where / lnad d Cθ is the slope of a contact-angle isotherm. 1ln
lvlv
B
dRT d C
γ⎛ ⎞Γ = − ⎜
⎝ ⎠⎟ is the surface
excess at the LV interface determined from separate measurement of concentration-dependent lvγ of
the solute under study.1 It is important to stress that [ ]sl svΓ − Γ and lvΓ values obtained without
correcting concentration for solute activity are “apparent” surface excess values that can BC
9
Page 12
substantially deviate from actual surface excess calculated from ( )/ad dθ µ and lvdd
γµ
⎛⎜⎝ ⎠
⎞⎟ ; where
µ is activity-corrected chemical potential.1,31,32 However, previous work suggests that the
discrepancy between apparent and actual lvΓ is roughly constant for the proteins of this study and
apparent surface excess was about 56X larger than actual surface excess.1 We assume that apparent
[ ]sl svΓ − Γ is also ~56X larger than actual, activity-corrected surface excess because the ratio
[ ]sl sv
lv
⎧ ⎫Γ − Γ⎨ Γ⎩ ⎭
⎬ ~1 (see below) and comparison to instrumental measures of adsorption confirms this
factor (see Table 3, Results section).
For relatively hydrophobic surfaces exhibiting aθ > 60o and under experimental conditions that
avoid inadvertent mechanical deposition of solute at the (SV) interface, as through drop movement
on the surface or evaporation for examples, it is has been shown that svΓ ~ 0 and
[ ]sl slsvΓ − Γ → Γ .14,15,28 Under the additional restrictions that (i) solute activities at SL and LV
interfaces are approximately equal and (ii) slΓ ~ lvΓ , it can be expected that [ ]sl sv
lv
⎧ ⎫Γ − Γ⎨ ⎬Γ⎩ ⎭
~ 1.
Remarkably, experimental results confirm that these stringent physical conditions prevail and it is
therefore concluded that apparent [ ]sl slsvΓ − Γ Γ∼ for proteins reported herein.
Theory of Protein Adsorption: Previous work disclosed a theory of protein adsorption to the LV
surface1 that appears to be directly applicable to adsorption to the SL surface with little-or-no
modification because apparent [ ]sl svΓ − Γ can be directly interpreted in terms of , as discussed
above. This protein-adsorption theory was based on two related experimental observations and
slΓ
10
Page 13
implications thereof; namely, (i) a surprisingly slight variation in concentration dependence of lvγ
among the same diverse globular proteins studied herein (Tables 1,2) and (ii) a substantially
constant, MW-independent value of the apparent Gibbs’ surface excess lvΓ = 179 ± 27
picomoles/cm2. This work demonstrates parallel behavior at the hydrophobic SL surface with (i)
only modest variation in isotherms (Tables 1,2) and (ii) a substantially constant value of the
apparent Gibbs’ surface excess [
aΠ
]sl svΓ − Γ = 175 ± 33 picomoles/cm2 (Table 3, Fig. 5). Protein
adsorption theory asserts that these experimental observations are outcomes of a relatively constant
partition coefficient that entrains protein within a 3D interphaseP separating surface regions from
bulk phases (bulk-solution from bulk-vapor for the LV surface or bulk-solution from bulk-solid for
the SL surface). This “Guggenheim” interphase treatment, which is especially relevant to the
adsorption of large solutes such as proteins, is to be contrasted with the more usual 2D interface
“Langmuir” paradigm in which the surface is construed to be a planar area with negligible thickness
(see ref. 12 for more discussion). This interphase is proposed to thicken with increasing protein size
because volume occupied by adsorbed-protein molecules scales in proportion to MW according to
the well-known relationships among MW, solvent-exposed area, volume, and packing density.33 As
a consequence, molar interphase concentrations of larger proteins are lower than that of smaller
proteins at constant
IC
I
B
CP C≡ . In fact, is shown to vary inversely with MW and this leads
directly to the Traube-rule-like ordering for proteins mentioned in the Introduction. These principal
assertions, coupled with a packing model for adsorbed protein, provide analytical relationships that,
when fitted to experimental data, yield scaling relationships for protein adsorption relating molecular
size to interfacial energetics. Theory development will be repeated here only in so far as is
IC
11
Page 14
necessary to introduce Eq. (3) that relates protein to the bulk-phase protein concentration
at which limiting spreading pressure is achieved.
MW maxBC
maxaΠ
Oblate-spheroid, globular-protein molecules are approximately spherical in aqueous solution34,35 and
are consequently modeled as spheres with radius (packing-volume radius in cm
for MW expressed in kDa; see ref. 33 for a review of literature up to 1977 and refs. 36-41 for
subsequent work regarding spherical dimensions and molecular packing proteins). Thus, we assume
that spherical dimensions apply approximately to proteins with 10 < MW < 1000 kDa, although we
have no specific evidence for this other than the above-cited literature and the extent to which the
derived model simulates or fits experimental data. With these molecular dimensions, the highest
conceivable solution concentration of protein corresponds to face-centered-cubic (FCC, or
equivalently hexagonal) close packing of spheres with radius . Such a close-packed unit cell
contains eight ⅛ spheres and six ½ spheres (total of 4 spheres) residing within a cubic volume
-8 1/ 3=6.72X10 MWvr
vr
3(2 2)vr and hence the FCC protein concentration 34 /(2FCC vC molecules r= 2) . Using HSA as an
example protein with MW = 66.3 kDa and calculated = 2.7 nm, = 14.6 mMvr FCCC (or about 24X
physiological concentration;21,42 l = 23.4 in pMn FCCC ). Such high concentrations are not at all
likely in either bulk solution or within the interphase. However, it seems reasonable to propose that
the maximal interphase concentration is proportional to through a packing-efficiency
parameter
maxIC FCCC
ε that effectively measures how close protein spheres can pack, such that .
We assume that packing within an aqueous interphase is limited by repulsion of hydrated spheres43
and, as a consequence, regard
maxI FC Cε= CC
ε as a generic factor independent of protein (sphere) size that is
approximately constant for all globular proteins discussed herein. Calibration to HSA hydrodynamic
12
Page 15
radius or measured by neutron reflectometry reveals that maxIC 0.45ε = .1 If sphere repulsion is
uniform and symmetric, then effectively results from packing spheres with radius maxIC vR rχ= ;
where χ is a factor measuring the excluded volume surrounding each molecule. Given that
34 /(2FCC vC molecules r= 2) and max 34 /(2 2)I FC molecules R Cε= CC= , it follows that χ = ε-⅓.
Hence, molecular dimensions ( differ from the characteristic dimensions 2 )vr1/32 2v vr rδ χ ε −= = .
Eq. (2) combines the notion of with the MW-dependent radius of spherical proteins, where
experimentally-convenient dimensions of picomolarity (10-12 moles/L) have been introduced:
maxIC
( )( ) ( ) ( )11
max3 38 1/ 3
4 0.177 9.68 10
6.72 102 2I
v
molecules molecules X picomoleC LMWX MWr
ε ε ε−
= = = (2)
It is apparent from Eq. (2) that maximal interphase protein concentration varies inversely with
protein size ( ), with higher concentrations for low-MW proteins and sharply-lower
concentrations for higher-MW proteins. Interphase saturation occurs at and must therefore
correspond to the bulk concentration at which the limiting adhesion tension
MW
maxIC
maxBC '
aτ is achieved
(i.e. the concentration at maximum spreading pressure ( )max ' oa a aτ τΠ = − ). can be estimated
from concentration-dependent
maxBC
aθ curves (see Appendix 7.1) and is related to through the
partition coefficient . Eq. (3) states this relationship as a logarithmic expression that
is convenient to apply to concentration-dependent
maxIC
max max/I BP C C≡
aθ data:
( ) ( ) ( )max
max 11ln ln ln 9.68 10 ln ln / ln 27.6 ln /IB
CC X MW P MWP ε ε⎛ ⎞= = − + = − + + P⎡ ⎤⎜ ⎟ ⎣ ⎦⎝ ⎠ (3)
13
Page 16
Assuming that / Pε is constant for all proteins within this study (as discussed in ref. 1), Eq. (3)
predicts a linear relationship between and maxln BC ln MW with a slope of –1. A value for the
unknown ratio / Pε can be extracted from the intercept (see Results section).
4. Results
SAM Stability: Pure water contact angles on SAMs were observed to monotonically decrease with
observation time while interfacial tension lvγ (measured by PDT) remained constant, as shown in
Fig. 2. Specifically, it was observed that oaθ of a pure water droplet slowly decreased with time
from the initial value of 108º< oaθ <106º at t = 0 to 104º< o
aθ <102º at t = 1 hr; where oaθ is the pure
water contact angle. The range of reported results corresponds to all of the 17 methyl-terminated
SAM surfaces analyzed during the course of this work. We attribute this systematically-varying
wettability to slow “hydration” of SAM surfaces but have no specific proof this was the cause. This
same phenomenon apparently affects measurement of protein-solution contact angles because we
observed that the whole contact angle isotherm ( aθ vs. concentration) slowly shifted lower with time
(see Fig. 1, annotation in Panel B). We do not believe this slight but apparently unavoidable
attribute of SAMs on silicon wafers negatively affects the veracity of conclusions drawn herein
which were based on final, steady-state measurements made at ~ 1 hr analysis time. Note that this
effect was not evident in isotherms because spreading pressure normalizes to aΠ oaτ (i.e.
( )oa a aτ τΠ = − ).
General Aspects of the Data: Table 2 compiles quantitative results of this work. Replicate protein
preparations were studied for Ub, FV HSA, FXII, IgM and α2-macroglobulin. Different vendors
14
Page 17
were used as a means of controlling for discrepancies that might arise from sourcing (Table 1).
Contact angle parameters oaθ , '
aθ , and M listed in cols 2-5 of Table 2 are the mean fitted
values corresponding to final 25
/ 2ln BCΘ
aθ curves recorded within the 60-minute time frame of the TPG
experiment. Listed error is standard deviation of this mean. Corresponding adhesion tensions aτ
and 'aτ (Columns 6, 7) were computed from o
aθ and 'aθ values, respectively, with uncertainty
estimates computed by propagation of error in aθ and lvγ measurements (Materials and Methods).
Maximum “spreading pressure” ( )max 'a a aτ τΠ ≡ − (Column 8) was computed directly from
aforementioned aτ values and associated uncertainty again estimated by propagation of error. Only
computed estimates of aτ , 'aτ and parameters are provided for FXII since the requiredmax
aΠ lvγ
values were graphical estimates (see refs. 1-4). Parameters for ubiquitin and α2-macroglobulin are
also graphical estimates from the steady-state, concentration-dependent aθ curve since surface
saturation was not reached within solubility limits for these proteins at the SL interface (as discussed
in Appendix 7.3). Therefore, firm values could not be ascertained by statistical-fitting procedures
described in Materials and Methods section.
Contact-angle isotherms: Time-and-concentration-dependent aθ for the nonionic surfactant
Tween-20 (MW= 1226Da), and purified proteins, prothrombin (FII; MW = 72kDa) and IgM (MW
=1000kDa) are compared in Fig. 1 in both three-dimensional (3D, aθ as a function of time and
concentration) and two-dimensional (2D, aθ as a function of concentration at specified times)
representations. Note that the logarithmic-solute-concentration ordinate ln in Fig. 1 is expressed
in picomolarity units (pM
BC
, 10-12 moles solute/L solution; see Materials and Methods section for
15
Page 18
computational and data representation details). Examining first 3D and 2D representations of
Tween-20 interfacial activity (Fig. 1A) which serves as a reference compound, it was observed that
the aθ curve was sigmoidal in shape, with a well-defined low-concentration asymptote oaθ and a
high-concentration asymptote 'aθ . In this latter regard, Tween-20 exhibited concentration-limiting
behavior that is typically interpreted as achievement of a critical micelle concentration (CMC), at
least for surfactants. This paper provides no evidence of micelles, for either proteins or surfactants,
and so only acknowledges a limiting behavior at which further increase in solute concentration did
not measurably change aθ . Smooth curves through the data of Fig. 1 result from least-squares fitting
of the four-parameter logistic equation described in Materials and Methods.
Results for the proteins FII and IgM (Fig. 1B and 1C, respectively) were similar to Tween-20 in that
sigmoidal-shaped aθ isotherms connected low- and high-concentration asymptotes. Significantly
more pronounced time dependence in aθ was observed for proteins, however, especially for
intermediate concentrations. Dynamics were undoubtedly due to rate-limiting, mass-transfer and
adsorption steps that slowly brought large macromolecules to LV and SL interfaces relative to the
small-molecule reference compound Tween-20 for which only limited dynamics were observed.
Observation of time-dependence was important in this particular work only in so far as data
demonstrate that aθ dynamics dampen within the time frame of experimentation and achieved
steady-state (equilibrium) within the 1 hr observation window. In fact, data collected in Table 2
refers only to steady-state measurements. The bulk-solution concentration at which the limiting 'aθ
occurs ( ) is of theoretical interest in this work and was estimated from fitted parameters
compiled in Table 2, as described in the Appendix 7.1.
maxln BC
16
Page 19
Adhesion Tension and Spreading Pressure Isotherms: Fig. 3 traces sequential interpretation of
steady-state (1 hr drop age), concentration-dependent aθ data (Panel A) in terms of concentration-
dependent aτ (Panel B) and spreading pressure aΠ (Panel C) for human serum albumin (FV HSA).
Smooth curves through the data serve as guides to the eye. Steady-state (equilibrium) spreading
pressure isotherms were used as the basis of comparison of protein adsorption for the
compounds listed in Table 1. Fig. 4 collects
aΠ
aΠ isotherms for selected proteins spanning the
molecular weight range 10 < MW < 1000 kDa showing only smoothed curves for the sake of
clarity, but representative aθ , aτ , and aΠ isotherms with authentic data are amply illustrated in Figs.
1, 3. The dynamic range of ~ 20 mN/m was similar to that observed for these proteins at the LV
surface (15 < < 30 mN/m)1 and fell within a relatively narrow 5 mN/m band for the
diverse set of proteins studied. Furthermore, the same ‘Traube-rule’ ordering of protein adsorption
observed at the LV interface was repeated at the SL interface in that high-MW proteins reduce
aΠ
lvΠ maxaΠ
aΠ
to any arbitrary value at lower molarity than low-MW proteins, as suggested by the horizontal arrow
annotation on Fig. 4.
Apparent Gibbs’ Surface Excess: Adsorption to the solid-liquid (SL) interface was measured
through the apparent Gibbs’ excess parameter [ ]sl svΓ − Γ computed using Eq. (1) applied to contact-
angle isotherms (see Appendix 7.2 for example calculations). As noted in the Theory Section, the
term “apparent” alerts the reader to the fact that casual application of Gibbs’ adsorption isotherm
using instead of activity treats solutes (proteins and surfactants) as isomerically-pure, non-
ionized polyelectrolytes31 at infinite dilution with unit activity coefficients.32 Table 3 collects results
for proteins and the small-molecule surfactant standards SDS and Tween-20. used in calculation
BC
lvΓ
17
Page 20
of [ ]sl svΓ − Γ and [ ]sl sv
lv
⎧ ⎫Γ − Γ⎨ Γ⎩ ⎭
⎬ for surfactant standards was 342±10 and 455±17 for SDS and
Tween-20, respectively, and were measured specifically for this work (by PDT; see refs. 1,2).
[ ]sl svΓ − Γ for proteins were computed using the grand average lvΓ = 179 ± 27 picomoles/cm2
previously reported to be characteristic of the proteins listed in Table 1.1 Table 3 also lists results of
independent measures of adsorption, slC , for a few of the compounds listed in Table 3 to be
compared to apparent [ ]sl svΓ − Γ measured by TPG. Note that results for small molecule surfactants
SDS and TWN20 were in good agreement with TPG (i.e. [ ]sl sv
slC⎧ ⎫Γ − Γ⎨ ⎬⎩ ⎭
~0.99±0.01; rows 10, 11
column 6), but results for proteins (rows 1-9, column 6) were in substantial disagreement (i.e.
[ ]sl sv
slC⎧ ⎫Γ − Γ⎨⎩ ⎭
⎬ = 62.5±14.9). Fig. 5 shows that dependence of apparent [MW ]sl svΓ − Γ (panel A)
and (panel B) as well as the ratio lvΓ[ ]sl sv
lv
⎧ ⎫Γ − Γ⎨ ⎬Γ⎩ ⎭
(panel C) was flat for proteins listed in Table 1
yielding [ ]sl ~ 1sv
lv
⎧ ⎫Γ − Γ⎨ Γ⎩ ⎭
⎬ (see Theory section).
A Traube-Rule-Analog for Protein Adsorption and Partition Coefficient: Fig. 6 plots
data compiled in Table 2 for proteins at the solid-liquid (SL) interface (panel A), and compares with
results from the liquid-vapor (LV) interface (panel B, see refs. 1-4) on natural logarithmic
coordinates compatible with Eq. (3) of the Theory section (data corresponding to ubiquitin was
estimated as described in the Appendix 7.3). Protein data fell within a monotonically-decreasing
band generally consistent with the anticipation of a unit slope and positive intercept
maxln BC
18
Page 21
max 2[ln ( 1.3 0.2) ln (19.8 1.0); 78%]BC MW R= − ± + ± = Comparison to Eq. (3) revealed that
from the nominal intercept value and, by assuming 4/ ~ 4.1 10Pε −× ε ~ 0.45 (as discussed in the
Theory section), estimated ~ 1,100.P
5. Discussion
Accuracy of Measured Contact Angles and SAM Stability: aθ measurements by TPG employed
in this work was verified against Wilhelmy-balance tensiometry (WBT) as described in ref. 27.
However, rθ measurements by TPG were found to be systematically offset from the benchmark
WBT and exhibited greater variability. This work has not pursued the cause of unreliable rθ further,
choosing rather to construct contact-angle isotherms using aθ measurements that have been certified
by comparison to WBT. It is worthwhile mentioning in this context that WBT itself is inappropriate
for studies of protein adsorption at the SL interface (at least as applied herein) because (i) the
technique requires thin plates that are difficult to two-side coat with gold for thiol-SAM preparation,
(ii) WBT generally requires high solution volumes (~ 10 mL) that greatly exceed availability of
purified proteins and (iii) the moving three-phase line deposits solute (protein or surfactant) at the
SV interface making interpretation of the Gibbs’ surface excess parameter [ ]sl svΓ − Γ highly
ambiguous.28 Overall, we have found the tilting-plate method applicable to measuring adsorption, at
least for hydrophobic surfaces,14,15 and suitable for 1 hr equilibration times if a humidified chamber
is used to control evaporation.
Adsorption Isotherms: Adsorption isotherms constructed from concentration-dependent contact
angles ( aθ , aτ , and , see Figs. 1,3 and 4) for the proteins studied herein exhibited many aΠ
19
Page 22
similarities to concentration-dependent lvγ reported previously.1 Maximum spreading pressure,
, fell within a relatively narrow maxaΠ max10 20a< Π < mN/m band characteristic of all proteins
studied, just as observed at the LV surface. Furthermore, aΠ isotherms exhibited the ‘Traube-rule-
like’ progression in MW observed at the LV surface wherein the molar concentration required to
reach a specified value decreased with increasing MW. Bearing in mind the great range in MW
spanned by proteins in Fig. 4, it is reasonable to conclude that commensurate variability in protein
composition did not confer widely-varying SL interfacial activity; at least not in comparison to the
full range available to ordinary surfactants. The inference taken from the Traube-rule-like
progression is that protein concentration required to reduce
aΠ
aΠ to a specified value decreases with
in a manner loosely consistent with the addition of a generic amino-acid-building-block having
an “average amphilicity” that increases but does not radically change protein amphilicity.
Otherwise, if increased by addition of amino-acid-building-blocks with highly-variable
amphilicity, then would be expected to be a much stronger function of protein than is
observed. Thus, it appears that molar variability in
MW
MW
MW
aΠ MW
aΠ is achieved by aggregating greater mass of
similar amphiphilic character, as opposed to accumulating greater amphilicity with increasing . MW
Apparent Gibbs’ Surface Excess: Adsorption measurements by concentration-dependent contact
angles were in good agreement with literature values for the surfactant standards SDS and
Tween-20, as listed in Table 3. Close agreement between apparent [ ]sl svΓ − Γ and slC from
alternative methods suggests that (i) assumptions of purity and unitary activity coefficients were
reasonable for these small molecules and (ii) solute deposition at the SV interface was negligible
(see Theory section). However, [ ]sl svΓ − Γ for proteins were quite different than values drawn from
20
Page 23
comparable literature sources, as was observed for apparent lvΓ .1 No doubt proteins violate
assumptions of ideality and unitary activity coefficients,48,49 causing apparent [ ]sl svΓ − Γ to deviate
substantially from real, activity-corrected surface excess. Previous work showed that apparent and
real for proteins were different by a factor of about 56 and that apparent was approximately
constant across the span of protein MW studied.1 Apparent
lvΓ lvΓ
[ ]sl svΓ − Γ was found to differ from
independent measures by a factor of 62.5±14.9, as inferred from the mean [ ]sl sv
slC⎧ ⎫Γ − Γ⎨⎩ ⎭
⎬ ratio for
proteins (see column 6, rows 1-9, Table 3), consistent with estimates from the LV interface above.
Fig. 5 plots apparent [ ]sl svΓ − Γ and lvΓ , and the ratio [ ]sl sv
lv
⎧ ⎫Γ − Γ⎨ ⎬Γ⎩ ⎭
as a function of MW showing
that ~ [lvΓ ]sl svΓ − Γ and that, as a consequence, [ ]sl sv
lv
⎧ ⎫Γ − Γ⎨ ⎬Γ⎩ ⎭
~ 1. We thus conclude that
[ ]sl svΓ − Γ ~ slΓ ~ for the globular proteins studied herein. Interestingly, lvΓ[ ]sl sv
lv
⎧ ⎫Γ − Γ⎨ Γ⎩ ⎭
⎬ =3.8±0.1
for TWN20 (row 11, column 4) suggesting nearly 4X concentration at the SL interface over LV,
consistent with results reported for Tween-80 at silanated glass surfaces.28
A Traube-Rule-Analog for Protein Adsorption and Partition Coefficient: A flat trend in lvΓ
and slΓ with is consistent with an interphase concentration (in units of moles/cm3) scaling
inversely with and an interphase thickness
MW IC
MW Ω (in units of cm) that scales directly with .
This is because (when the partition coefficient )1 and dependence cancels. In
other words, the interphase thickens as adsorbed proteins become larger and the effective volume
interrogated by Gibbs’ isotherm becomes larger (Gibbs’ dividing plane descends deeper into the
MW
ICΓ = Ω 1P >> MW
21
Page 24
surface region).14,15,28 Interpreted in terms of the theory of protein adsorption briefly outlined in the
Theory section, hydrated spheroidal protein molecules with net radius R scaling as a function of
pack into the interphase to a concentration limited by osmotic repulsion between
molecules. Or stated equivalently, is limited by the extent to which the interphase can be
dehydrated by protein displacement of interfacial water. Interphase dehydration is more related to
the properties of water than the proteins themselves and so the partition coefficient
1/ 3MW maxIC
maxIC
I
B
CP C≡ is
approximately constant among the proteins investigated.
Fig. 6A plots data compiled in Table 2 on logarithmic coordinates compatible with Eq. (3) of
the Theory section. Proteins fell within a monotonically-decreasing band roughly consistent with the
anticipation of a unit slope and positive intercept
. A similar trend was observed for protein
adsorption at the LV surface, shown in Fig. 6B. Interpretation of these results must take into account
that the highly-simplified model of adsorption treats proteins as uniform hard spheres and does not
attempt to account for structural complexities of real molecules, or unfolding (denaturation) that may
occur upon packing within the surface region. Hence failure of data to quantitatively adhere to Eq.
(3) is hardly surprising. Even so, results for Ub were significantly off the trend obtained at the LV
surface (compare to Figs 6A, B), possibly signaling that this small protein does not retain a spherical
geometry at the SL surface. Clearly, more work is required to further test such speculation and
expand the range of proteins explored. However, even in light of scatter in the data of Fig. 6A, it is
of interest to estimate
maxBC
max 2[ln ( 1.3 0.2) ln (19.8 1.0); 78%]BC MW R= − ± + ± =
4/ ~ 4.1 10Pε −× from the nominal intercept value and, by assuming ε ~ 0.45
(see Theory section), estimate ; which is within an order-of-magnitude of the 1,100P ∼ 150P ∼
22
Page 25
estimate from analysis of protein adsorption to the LV surface and from neutron
reflectometry of albumin adsorption to the LV surface.1 Clearly, goniometry is not a good method
for deducing partition coefficients, but it is of continued interest to compute protein adsorption
energetics based on these rough estimates. With , the free energy of protein adsorption
to the hydrophobic surface is very modest, lying within the
range
5000P ∼
210 10P< < 3
P
4
lnoadsG RT∆ = −
7 oadsRT G RT− < ∆ < − . This is consistent with estimates for lysozyme, myoglobin, and α-
amylase adsorption to hydrophobic surfaces measured by hydrophobic interaction chromatography
( ).50 Thus, a conclusion that can be drawn, in spite of rather poor estimates of , is
that adsorption of proteins to a hydrophobic surface is energetically favorable by only small
multiples of thermal energy RT and apparently does not vary significantly among proteins.
5oadsG∆ −∼ RT P
According to Eq. (3) and Fig. 6, low-MW proteins require greater bulk-phase concentrations to
saturate the SL (or LV) interphase than higher-MW proteins. Given that values plotted in
Fig. 6 approach 1 % w/v, it is reasonable to anticipate that extrapolated values for yet-lower-
MW proteins must equal or exceed protein-solubility limits. As a consequence, surface saturation
and the related limiting is not expected for low-MW proteins at fixed . In this regard, it is
noteworthy that isotherms for low-MW proteins such as ubiquitin (10.7 kDa) fail to achieve a
limiting at any concentration below the solubility limit, as was observed for concentration-
dependent
maxBC
maxBC
maxaΠ P
aΠ
maxaΠ
lvγ .
23
Page 26
6. Conclusions
Interfacial energetics of protein adsorption from aqueous-buffer solutions to hydrophobic methyl-
terminated SAM surfaces are strikingly similar to the interfacial energetics of protein adsorption to
the hydrophobic air-water surface. The observed ‘Traube-rule-like’ progression in interfacial-
tension reduction ( lvγ and aτ ), invariant partition coefficient , and constant Gibbs’ surface excess
( and
P
lvΓ slΓ ) for globular proteins spanning 3 decades in all occur because water controls the
energetics of the adsorption process. Hence, protein adsorption to hydrophobic surfaces has more to
do with water than the proteins themselves. A relatively straightforward theory of protein adsorption
predicated on the interfacial packing of hydrated spherical molecules with dimensions scaling as a
function of accounts for the essential physical chemistry of protein adsorption and rationalizes
significant experimental observations. From this theory it is evident that displacement of interfacial
water by hydrated proteins adsorbing from solution places an energetic cap on protein adsorption to
hydrophobic surfaces (
MW
MW
7 oads 4RT G R− < ∆ < − T ). This phenomenon is generic to all proteins. Thus,
protein adsorption is not found to significantly vary among diverse protein types. Variations from
this general trend may reflect deviations in protein geometry from simple spheres and/or tendency of
some proteins to adopt a more spread/compact configuration in the adsorbed state.
24
Page 27
7. Appendix
7.1. Estimation of maxBC
maxBC was calculated from the slope of an advancing contact angle aθ isotherm ln
a
BCθ∆
∆ and
fitted data (Table 2) by evaluating Eq. A1 at half-maximal change in aθ , which occurs at a bulk-
phase composition / 2 max max 'ln (where / 2 1/2 and )B aC aθ θΘ Θ = Θ Θ ≡ − :
( )/ 2 / 2
''
' *
max max
maxmax / 2
2ln ln ln ln ln
ln ln2
a aa
a aa
BB B B B
B B
RTSC C C C C
C CRTS
θ θθθ θθ
Θ Θ
Θ
⎛ ⎞⎛ ⎞+−⎜ ⎟⎜ ⎟− ⎝ ⎠∆ ⎝ ⎠= − = =∆ ⎡ ⎤ ⎡ ⎤− −⎣ ⎦ ⎣ ⎦
Θ⇒ = +
………..…….. Eq. A1
where the terms 1ln
a
B
SRT C
θ∆⎛ ⎞≡ −⎜ ⎟ ∆⎝ ⎠, and / 2* measured at lna a BCθ θ Θ≡ max '
a aθ θΘ ≡ − . All of the
parameters in the RHS of Eq. A1 are derived from non-linear, least-squares fitting of aθ isotherms to
the four-parameter logistic equation described in the Materials and Methods section. Confidence in
values listed in Table 2 and plotted in Fig. 6 was computed by propagation of the standard
errors in best-fit parameters through Eq. A1, as given by Eq. A2. In consideration of all sources of
experimental error, we conclude that estimates are no better than about 20%.
maxBC
maxln BC
( )max '
2
2'2 2 2 2
2 2ln ln
14B a aB
a aSC C SRTS θ θ
θ θ 2σ σ σ σΘ °
°
σ⎡ ⎤⎛ ⎞−⎢ ⎥= + − −⎜ ⎟⎢ ⎥⎝ ⎠⎣ ⎦
………….......Eq. A2
25
Page 28
where σ ’s represent standard errors in and the best-fit parameters ,maxln BC / 2ln BCΘaθ , '
aθ and as
denoted by subscripts.
S
7.2. Estimation of [ ]sl svΓ − Γ
The apparent Gibbs’ surface excess [ ]sl svΓ − Γ was computed from Eq. 1 of the Theory section for
each of the proteins and surfactants listed in Table 3. The following steps illustrate surface excess
calculations for FV HSA (preparation 1, Table 2) at the solid-liquid (SL) interface. Fit of aθ
isotherm data plotted in Fig. 3 yielded , , , 103.3 0.8oaθ = ± ' 88.3 0.8aθ = ± / 2ln 15.9 0.3BCΘ = ±
and . Inflections in the 14.1 5.7M = − ± aθ curve were located at 1 13.7X = and
(dimensionless), yielding a slope estimate from the finite difference with calculated
uncertainty as
2 10.9X = 'S
' 2.95 0.04deg 0.050 0.007radaSXθ∆
≡ = − ± = − ±∆
;
where 2 1
2and X = X -Xa a aX Xθ θ θ∆ = − ∆ 1 . Values for aθ were calculated from the characteristic
parameters above, conveniently evaluated at where the logistic equation simplifies to / 2ln lnB BC CΘ=
'*
2aa a
aθ θθ θ
⎛ ⎞+= = ⎜ ⎟
⎝ ⎠. Thus, * *103.3 88.3 95.8 ;sin 0.99;cos 0.10
2a aθ θ *aθ+
= = = = − . The required
term lvγ was calculated from a comparable logistic equation for lvγ isotherms, using LV fitted
parameters,1,2 but evaluated at as / 2ln ln 11.7B BC CΘ= =7.3
70.8 46.246.2 61.1mN/m
1 (12.4 /11.7)[ ]lvγ
−
−= +
+= .
Using determined from ref. 1, Eq. 1 was computed as 2179pmol/cmlvΓ =
[ ] [ ] [ ]2
2sl 7 12
61.1sin 95.8 /( 0.05) 179cos95.8 145 /
(8.31 10 )(298.15)(10 ) /sv
ergs cmpmol cm
ergs pmol−
⎧ ⎫⎪ ⎪Γ − Γ = − − + =⎨ ⎬×⎪ ⎪⎩ ⎭
26
Page 29
Uncertainty in [ ]sl svΓ − Γ was computed by propagation of error into [ ]sl sv∆Γ = Γ − Γ as:
'
2 2 22 2 2 2sin sin
cos sin cosln ln lv
a a lv a lv aa lv a S
B B
d dRT d C RT d C RTγ θ
θ θ γ θ γ θ 2 2aσ σ θ θ σ σ σ
∆Γ Γ= + + Γ + +⎡ ⎤ ⎡ ⎤ ⎡ ⎤⎢ ⎥ ⎢ ⎥ ⎢ ⎥⎣ ⎦⎣ ⎦ ⎣ ⎦
θ
……………….Eq. A3
where '
lna
B
dSd C
θ≡ .The σ terms for , and lv a Sγ θ ′were computed from
'2 2
2
4lv lv
lvγ
γ γσ σ
σ+
= and '
2 22
4a
a
aθ θθ
σ σσ
+= ; where ', and ,lv lv a a
'γ γ θ θ are fitted parameters from lvγ and
aθ isotherms; as described above. Uncertainty in slope '
'
2 22
2a
S Xaθ θ
σ σσ
+=
∆. Thus, uncertainty in ∆Γ is
given by:
2 2
2 22 2
2
2
5 2
5
sin 95.8 61.1sin 95.8(27) cos
(2.48 10 ) (2.48 10 )
61.1cos95.8 179sin 95.8
(2.48 10 )
( 0.05) (1.88) (5.1 10 ) 95.82
( 0.05) (9.8 10 ) 324.95
18.02
σ
σ
∆Γ
∆Γ
− −
−
−
−
= + +× ×
+×
⎡ ⎤ ⎡ ⎤− ×⎢ ⎥ ⎢ ⎥⎣ ⎦ ⎣ ⎦
⎡ ⎤+ − × =⎢ ⎥⎣ ⎦=
where 7 12 2(8.31 10 )(298.15)(10 ) 2.48 10 /RT − ergs pmol−= × = × .
Thus, [ ] 2sl 145 18 /sv pmol cmΓ − Γ = ± as reported in Table 3 (row 4 column 2).
7.3. Estimation of parameters for Ubiquitin and α2-macroglobulin
Parameters for ubiquitin and α2-macroglobulin listed in Tables 2-3 and shown in Figs. 4-6 were
graphical estimates from the steady-state, concentration-dependent aθ curve. Firm values could not
be ascertained by statistical-fitting procedures described in Materials and Methods because surface
saturation was not reached within solubility limits for this protein. Thus, well-defined high
27
Page 30
concentration asymptotes, 'aθ were not achieved at physically-realizable concentrations. Hence, aθ
measured at the highest-concentration studied was used as an estimate for 'aθ . Adhesion tensions
were computed accordingly, with graphical estimates from lvγ isotherm as coslv
o oa a
oτ γ= θ
coslva
and
' ' 'aτ γ θ= / 2ln BCΘ. and
lna
B
dd C
θ parameters were estimated by graphical location of inflection
points on the aθ curve. These estimates were used in the calculation of and [maxBC ]sl svΓ − Γ
parameters, as described in Appendix 7.1 and 7.2.
Acknowledgments
This work was supported, in part, by the National Institute of Health PHS 1 R01 HL 69965-01, and
by Johnson &Johnson through the Focused Giving Grant Program. Authors appreciate additional
support from the Materials Research Institute and Departments of Bioengineering and Materials
Science and Engineering, Penn State University. Authors gratefully acknowledge the assistance of
Dr. Roger Woodward in instrument design and implementation.
28
Page 31
List of Figure Legends
Figure 1: Advancing contact angle isotherms in 3D ( aθ as a function of analysis time (drop age)
and logarithmic (natural) solution concentration ) and 2D (BC aθ as a function of logarithmic
solution concentration at selected times) formats comparing Tween-20 (Panel A ,TWN20, Table
2), prothrombin (Panel B, FII, Table 2), and immunoglobulin-M (Panel C, IgM, preparation 2, Table
2) adsorption to a methyl-terminated SAM surface. In each case, solute concentration is
expressed in picomoles/L (pM
BC
BC
) on a natural logarithmic scale. Symbols in 2D panels represent time
slices through 3D representations (filled circle = 0.25 sec, open circle = 900 sec, filled triangles =
1800 sec, and open triangles = 3594 sec; annotations in Panel A indicate maximum and half-
maximum contact angle reduction, maxa
θ and max12 a
θ respectively. Notice that adsorption kinetics
dominated IgM adsorption whereas steady-state was achieved within about 1000 sec for FII, and
nearly no adsorption kinetics is detected for TWN20. Note also decrease in aθ with time, attributed
to slow hydration of the SAM surface (Panel B, arrow annotation; see Results section for more
discussion).
Figure 2: Advancing water contact angles aθ (right axis, open circles, using TPG) on 1-hexadecane
thiol SAMs on gold decreased monotonically with observation time while liquid-vapor interfacial
tension, lvγ (left axis, closed circles, using PDT) remained constant, suggesting time-dependent
“hydration” of the SAM surface. Note effect on aθ isotherms shown in Fig. 1(arrow annotation,
Panel B)
29
Page 32
Figure 3: Sequential interpretation of a steady-state (3600 sec drop age) contact angle adsorption
isotherm for human serum albumin (FV HSA, preparation 2, Table 2); Panel A, advancing contact
angles, aθ ; Panel B, advancing adhesion tension, aτ ; Panel C, advancing spreading pressure aΠ .
Smoothed curves through the data serve as guides to the eye. Annotations identify low- and high-
concentration asymptotes for contact angles ( aθ , 'aθ ), adhesion tensions ( aτ , '
aτ ) and maximum
spreading pressure that are used to characterize isotherms (Table 2). maxaΠ
Figure 4: Comparison of steady-state spreading pressure aΠ isotherms for selected proteins
spanning three decades in molecular weight (Table 1). Smooth curves are guides to the eye (see
Figs. 1 and 3 for similar plots including authentic data and Table 2 for statistics of fit). Molar
scaling reveals an ordering among diverse proteins, similar to the ‘Traube-rule’ observed for proteins
at the liquid-vapor interface wherein molar concentration required to reach a specified value
decreased with increasing MW (arrow).
aΠ
Figure 5: Apparent Gibbs’ surface excess scaled by protein at the solid-liquid (SL)
([
MW
]sl svΓ − Γ , panel A) and the liquid-vapor (LV) interfaces ( lvΓ , panel B) for multiple protein
preparations (open circle = preparation 1, filled circle = preparation 2, filled triangle = preparation 3;
see Tables 1, 3). Panel C plots the ratio of the surface excess parameters yielding [ ]sl ~ 1sv
lv
⎧ ⎫Γ − Γ⎨ ⎬Γ⎩ ⎭
.
Insets expand region and dashed lines represent arithmetic mean of the respective surface
excess values listed in Table 3 (see Appendix 7.2 for sample calculations). Apparent (panel B) is
reproduced from ref. 1 for comparison to
low-MW
lvΓ
[ ]sl svΓ − Γ . Apparent surface excess [ ]sl svΓ − Γ and lvΓ ,
30
Page 33
as well as the ratio [ ]sl sv
lv
⎧ ⎫Γ − Γ⎨ Γ⎩ ⎭
⎬ , were found to be independent of protein (see Theory and
Discussion sections).
MW
Figure 6: Relationship between the surface-saturating bulk solution concentration and protein
(natural logarithmic scale) at the solid-liquid (SL, panel A) and liquid-vapor interfaces (LV,
panel B) for multiple protein preparations (open circle = preparation 1, filled circle = preparation 2,
filled triangle = preparation 3). Error bars represent uncertainty computed by propagation of
experimental errors into compiled values (see Table 2, Appendix 7.1 for representative
calculations). Panel B is reproduced from ref. 1 for the purpose of comparing the LV and SL
interfaces. Linear regression through the SL data yielded
compared to
for the LV interface, consistent with the
expectation of unit slope and a positive intercept (see Theory and Discussion sections). Note that
low-MW proteins require greater bulk-phase concentrations to saturate the interphase than higher-
MW proteins.
maxBC
MW
maxln BC
max 2[ln ( 1.3 0.2) ln (19.8 1.0); 78%]BC MW R= − ± + ± =
max 2[ln ( 1.4 0.2) ln (21.8 1.3); 72%]BC MW R= − ± + ± =
31
Page 34
Citations
(1) Krishnan, A.; Siedlecki, C.; Vogler, E. A. Langmuir 2003, 19, 10342.
(2) Krishnan, A.; Sturgeon, J.; Siedlecki, C. A.; Vogler, E. A. J. Biomed. Mat. Res. 2004,
68A, 544.
(3) Krishnan, A.; Siedlecki, C. A.; Vogler, E. A. Langmuir 2004, 20, 5071.
(4) Krishnan, A.; Wilson, A.; Sturgeon, J.; Siedlecki, C. A.; Vogler, E. A. Biomaterials
2004, in press.
(5) Vasquez, M.; Nemethyt, G.; Scheraga, H. A. Chem. Rev. 1994, 94, 2183.
(6) Head-Gordon, T.; Hura, G. Chem. Rev. 2002, 102, 2651.
(7) Cramer, C. J.; Truhlar, D. G. Chem. Rev. 1999, 99, 2161.
(8) Garcia de la Torre, J. Biophysical Chemistry 2001, 93, 159.
(9) Harding, S. E. Biophysical Chemistry 2001, 93, 87.
(10) Durchschlag, H.; Zipper, P. Biophys. Chem. 2001, 93, 141.
(11) Chalikian, T. V.; Breslauer, K. J. Biopolymers 1996, 39, 619.
(12) Vogler, E. A. Adv. Colloid and Interface Sci. 1998, 74, 69.
(13) Vogler, E. A. How Water Wets Biomaterials. In Water in Biomaterials Surface
Science; Morra, M., Ed.; John Wiley and Sons: New York, 2001; pp 269.
(14) Vogler, E. A. Langmuir 1992, 8, 2005.
(15) Vogler, E. A. Langmuir 1992, 8, 2013.
(16) Vogler, E. A.; Martin, D. A.; Montgomery, D. B.; Graper, J. C.; Sugg, H. W.
Langmuir 1993, 9, 497.
(17) Hook, F.; Kasemo, B. Anal. Chem. 2001, 73, 5796
(18) Hook, F.; Rodahl, M.; Brzezinski, P.; Kasemo, B. Langmuir 1998, 14, 729.
32
Page 35
(19) Hook, F.; Voros, J.; Rodahl, M.; Kurrat, R.; Boni, P.; Ramsden, J. J.; Textor, M.;
Spencer, N. D.; Tengvall, P.; Gold, J.; Kasemo, B. Colloids and Surfaces B:
Biointerfaces 2002, 24, 155.
(20) The core-shell model assumes that the total protein volume 343totalV Rπ= is comprised
of a core volume 343core vV rπ= and a surrounding hydration shell volume
( ) ( )3 3 214 1 1.52 103shell total core vV V V r X Mπ χ −= − = − = W in cm3 per molecule protein if
protein MW is expressed in kDa. The moles of water within the shell in g/molecule
protein ; where 238.4 10shell shellm V X Mρ −= = Wρ ρ is the density of water in g/cm3
within the hydration shell. The specific mass of water (g HOH/g protein) is
3/ x10 0.9shell Am N MW ρ= ; which is ~ 0.9 g HOH/g protein, assuming . 31 /g cmρ ∼
(21) Putnam, F. W. Alpha, Beta, Gamma, Omega - The Roster of the Plasma Proteins. In
The Plasma Proteins: Structure, Function, and Genetic Control; Putnam, F. W., Ed.;
Academic Press: New York, 1975; Vol. 1; pp 58.
(22) Porter, M. D.; Bright, T. B.; Allara, D. L.; Chidseyi, C. E. D. J. Am. Chem. Soc 1987,
109, 3559.
(23) Nuzzo, R. G.; Dubois, L. H.; Allara, D. L. J. Am. Chem. SOC 1990, 112, 558.
(24) Nuzzo, R. G.; Fusco, F. A.; Allara, D. L. J. Am. Chem. Soc. 1987, 109, 2358.
(25) Nuzzo, R. G.; Allara, D. L. J. Am. Chem. Soc 1983, Vol. 105, 4481.
(26) Allara, D. L.; Nuzzo, R. G. Langmuir 1985, Vol. 1, 52.
(27) Krishnan, A.; Liu, Y.-H.; Cha, P.; Allara, D. L.; Vogler, E. A. Langmuir submitted
2004.
33
Page 36
(28) Vogler, E. A. Interfacial Chemistry in Biomaterials Science. In Wettability; Berg, J.,
Ed.; Marcel Dekker: New York, 1993; Vol. 49; pp 184.
(29) Krishnan, A.; Liu, Y.-H.; Cha, P.; Allara, D. L.; Vogler, E. A. J. Biomed. Mater. Res.
in review.
(30) Lu, J. R.; Su, T. J.; Penfold, J. Langmuir 1999, 15, 6975.
(31) Frommer, M. A.; Miller, I. R. J. Phys. Chem. 1968, 72, 2862.
(32) Strey, R.; Vilsanen, Y.; Aratono, M.; Kratohvil, J. P.; Yin, Q.; Friberg, S. E. J. Phys.
Chem. B. 1999, 103, 9112.
(33) Richards, F. M. Ann. Rev. Biophys. Bioeng. 1977, 6, 151.
(34) Tanford, C. Protein Science 1997, 6, 1358.
(35) Teller, D. Nature 1976, 260, 729.
(36) Chothia, C. Nature 1975, 254, 304.
(37) Miller, S.; Lesk, A.; Janins, J.; Chothia, C. Nature 1987, 328, 834.
(38) Miller, S.; Janin, J.; Lesk, A.; Chothia, C. J. Mol. Biol. 1987, 196, 641.
(39) Tsai, J.; Taylor, R.; Chothia, C.; Gerstin, M. J. Mol. Bio. 1999, 290, 253.
(40) Gerstein, M.; Chothia, C. Proc. Natl. Acad. Sci. 1996, 93, 10167.
(41) Miller, S.; Janin, J.; Leak, A. M.; Clothia, C. J. Mol. Biol. 1987, 196, 641.
(42) Anderson, N. L.; Anderson, N. G. Molecular and Cellular Proteomics 2002, 1, 845.
(43) Werner, P.; Caflisch, A. J. Am. Chem. Soc. 2003, 125, 4600.
(44) Lander, L. M.; Siewierski, L. M.; Brittain, W. J.; Vogler, E. A. Langmuir 1993, 9,
2237.
(45) Sauer, B. B.; Carney, T. E. Langmuir 1990, 6, 1002.
(46) Gennes, P. G. d. Rev. Mod. Phys. 1985, 57, 827.
34
Page 37
(47) Woodward, J. T.; Gwin, H.; Schwartz, D. K. Langmuir 2000, 16, 2957.
(48) Wills, P. R.; Comper, W. D.; Winzor, D. J. Archives of Biochem. and Biophys. 1993,
300, 206.
(49) Knezic, D. Thermodynamic Properties of Supersaturated Protein Solutions. Ph. D.,
Polytechnic University, 2002.
(50) Wen-Yih Chen, H.-M. H., Chien-Chen Lin, Fu-Yung Lin, and Yu-Chia Chan.
Langmuir 2003, 19, 9395.
(51) Sheller, N. B.; Petrash, S.; Foster, M. D. Langmuir 1998, 14, 4535.
(52) Zhou, C.; Friedt, J.-M.; Angelova, A.; Choi, K.-H.; Laureyn, W.; Frederix, F.;
Francis, L. A.; Campitelli, A.; Engelborghs, Y.; Borghs, G. Langmuir 2004, ASAP
Article 10.1021/la036251d S0743-7463(03)06251-6.
(53) Sigal, G. B.; Mrksich, M.; Whitesides, G. M. Langmuir 1997, 13, 2749.
35
Page 38
Table 1: Purified Proteins & Surfactants
NAME OF PROTEIN/SURFACTANT
(acronym)
MOLECULAR WEIGHT
(kDa)
AS-RECEIVED
FORM (mg/mL)
PURITY (electrophoresis)
or ACTIVITY
PHYSIOLOGIC CONCENTRATION
mg/100mL (nominal value)
VENDOR
Prep 1 98% Sigma Aldrich
UBIQUITIN (Ub)
Prep 2
10.7 Powder
95%
10-20 (15)
EMD Biosciences
THROMBIN (FIIa) 35.6 Powder 1411 NIH units/mg N/A Sigma Aldrich
Prep 1 Powder 98% HUMAN SERUM ALBUMIN Fraction V (FV HSA) Prep 2
66.3
Powder 98%
3500-5500 (4500)
MP Biomedicals
PROTHROMBIN (FII) 72 Powder 7.5 units/mg protein 5-10 (7.5)
Sigma Aldrich
Prep 1 Solution (2.1)
FACTOR XII (FXII)
Prep 2
78
Solution (5.5)
95% (4) Hematologic Technologies
HUMAN IgG (IgG) 160 Powder 97% 800-1800 (1300)
Sigma Aldrich
COMPLEMENT COMPONENT C1q (C1q)
400 Solution (1.1)
Single band by immunoelectrophoresis
10-25 (17.5)
Sigma Aldrich
Prep 1 Sigma Aldrich
Prep 2 Sigma Aldrich
α2-MACROGLOBULIN
(αmac)
Prep 3
725
Powder
98% 150-350 (250)
MP Biomedicals
Prep 1 Solution (0.8)
98% Sigma Aldrich
HUMAN IgM (IgM)
Prep 2
1000
Solution (5.1)
Single band by immunoelectrophoresis
60-250 (155)
MP Biomedicals
SODIUM DODECYL SULFATE (SDS)
0.28 Powder N/A N/A Sigma Aldrich
TWEEN 20 (TWN20) 1.23 Neat N/A N/A Sigma Aldrich
Page 39
TABLE 2: STEADY-STATE PROTEIN ADSORPTION PARAMETERS
NAME OF PROTEIN/SURFACTANT (acronym) aθ
(degrees)
'aθ
(degrees)
/ 2ln BCΘ PPT (pM)
M (dimension-
less)
aτ (mN/m)
'aτ
(mN/m)
maxaΠ
(mN/m)
maxln BC (pM)
Prep 1 100.9±0.5 75 19(17)
- -14 7 21 19UBIQUITIN (Ub)*
Prep 2 102.2±0.9 75 19(17)
- -15 12 27 19
THROMBIN (FIIa) 99.8±0.5 84.6±0.9 17.5±0.2 (13.9±0.2)
17.5±0.2 (13.9±0.2)
-12.3±0.6 4.5±0.7 16.7±0.9 15.1±0.2
Prep 1
15.9±0.3 (11.7±0.3)
15.9±0.3 (11.7±0.3)
15.9±0.3 (11.7±0.3)
-14.1±5.7 -16.3±0.9 1.4±0.6 17.7±1.2 13.6±0.3HUMAN SERUM
ALBUMIN
FV HSA
Prep 2
15.7±0.3 (11.5±0.3)
15.7±0.3 (11.5±0.3)
15.7±0.3 (11.5±0.3)
-11.6±3.0 -17.7±0.9 1.2±.5 18.9±1.1 13.7±0.3
PROTHROMBIN (FII) 100.6±0.5 86.5±0.9 15.1±0.4 (10.8±0.4)
15.1±0.4 (10.8±0.4)
-12.9±0.6 2.6±0.7 15.6±0.9 13.2±0.4
Prep 1 102.9±0.5 94.8±1.0
15.6±0.5 (11.3±0.5)
-17.9±1.2 -15.6 -3.1 12.5 12.7±0.5FACTOR XII*
Prep 2 102.0±0.4 88.2±0.8 15.7±0.4(11.3±0.4)
-10.9±3.3 -14.6 1.2 15.8 13.6±0.4
HUMAN IgG (IgG) 103.7±0.7 94.9±1.4 15.1±0.9(10.1±0.9)
15.1±0.9 (10.1±0.9)
-16.8±0.9 -4.4±1.3 12.4±1.5 13.3±0.9
COMPLEMENT COMPONENT C1q (C1q)
102.6±0.4 95.3±0.7 15.6±0.4(9.6±0.4)
15.6±0.4 (9.6±0.4)
-15.6±0.5 -5.0±0.7 10.6±0.8 11.4±0.4
Prep 1 101.9±0.5 Prep 2 100.2±0.9
α2-MACROGLOBULIN* (α mac)
Prep 3 103.2±0.5
86
19 (13)
-
-15
4
19
17
Prep 1 102.7±0.6 91.3±1.6 15.5±0.5(8.7±0.5)
-7.4±2.9 -15.7±0.7 -1.1±1.4 14.6±1.6 11.3±0.5HUMAN IgM (IgM)
Prep 2 102.4±0.6 87.8±2.0 15.9±0.6(9.2±0.7)
-4.9±1.6 -15.4±0.7 1.9±1.7 17.3±1.9 12.6±0.8
SODIUM DODECYL SULFATE (SDS) 100.1±1.9 56.0±2.3 17.7±0.4(18.9±0.4)
17.7±0.4 (18.9±0.4)
-12.5±2.3 18.7±1.1 31.2±2.6 21.4±0.4
TWEEN 20 (TWN20) 97.1±0.6 65.1±0.7 16.4±0.3(16.2±0.1)
-23.4±3.3 -8.9±0.8 14.6±0.5 23.5±0.6 17.8±0.1
Notes: * Parameters are graphical estimates of fitted parameters. See Results section.
Page 40
TABLE 3: GIBBS’ SURFACE EXCESS
Apparent Surface Excess†
(picomoles/cm2) Comparison to Literature values NAME OF PROTEIN/SURFACTANT
(acronym)
SL SV[ ]Γ − Γ
LVΓ
SL SV[ ]Γ − Γ
ΓLV
⎧ ⎫⎨ ⎬⎩ ⎭
SLC
(picomoles/cm2) SL SV
SL
[
CΓ − Γ ]
Technique [Citation #]
Prep 1 224 1.3 UBIQUITIN (Ub)*
Prep 2 193 1.1 THROMBIN (FIIa) 308±34 1.7±0.3
-
-
-
Prep 1
145±18 0.8±0.2 60 HUMAN SERUM ALBUMIN
FV HSA Prep 2
196±21 1.1±0.2
2.4
80
XR [51]
PROTHROMBIN (FII) 146±17 0.8±0.2 - - - Prep 1 136 0.8 FACTOR XII*
Prep 2 153 0.9 - - -
4.5
44 QCM [52]
HUMAN IgG (IgG) 198±37
1.1±0.3 2.9
66 SAW [52]
COMPLEMENT COMPONENT C1q (C1q)
117±28 0.7±0.2 - - -
Prep 1 Prep 2
α2-MACROGLOBULIN* (α mac)
Prep 3
130
0.7
-
-
-
Prep 1 222±42 1.2±0.3 HUMAN IgM (IgM) Prep 2 101±27
179±27
0.6±0.2 - - -
SODIUM DODECYL SULFATE (SDS) 276±14 342±10 1.2±0.2 280
0.98 SPR [53]
TWEEN 20 (TWN20) 120±16 455±17 3.8±0.1 120
1.00 SPR [53]
Notes:* Parameters are graphical estimates of fitted parameters. See Results section † Apparent or Γ is computed without activity correction (see Theory section).
SL SV[ ]Γ − Γ
LV
Page 41
2 4 6 8 10 12 14 16 18
θ a (d
egre
es)
80
85
90
95
100
105
110
6 8 10 12 14 16 18 20 22 24 26
θ a (d
egre
es)
60
70
80
90
100
110
2 4 6 8 10 12 14 16 18 20
θ a (d
egre
es)
80
85
90
95
100
105
110
adsorption time
A
C
B
lnCB ( CB in pM)
aθ
'aθ
maxaθ
max1
2 aθ
/ 2ln BCΘ
hydration time
lnCB ( CB in pM)
lnCB ( CB in pM)
Page 42
Time ( seconds)
0 1000 2000 3000 4000
γ lv (m
N/m
)
60
62
64
66
68
70
72
74
θ a (d
egre
es)
90
92
94
96
98
100
102
104
106
108
110
Page 43
ln CB (CB in pM)
2 4 6 8 10 12 14 16 18 20 22
Πa
(mN
/m)
0
5
10
15
20
τ a (m
N/m
)
-15
-10
-5
0
5
θ a (d
egre
es)
80
85
90
95
100
105
110
aθ
'aθ
'aτ
aτ
max 'a a aτ τΠ = −
A
B
C
Page 44
lnC B (C B in pM )
2 4 6 8 10 12 14 16 18 20 22
Πa (m
N/m
)
0
5
10
15
20U bFV H SA
C 1q
FII
IgMIgG
Page 45
0 200 400 600 800 1000
[ΓSL
- ΓSV
]
Γ L
V
0.5
1.0
1.5
2.0
2.5
IgG
C1q α-mac
IgM
0 20 40 60 800.0
0.5
1.0
1.5
2.0
2.5
3.0
Ub
FIIa
FVHSA FII
UbFIIa
FVHSA FAF HSA
FII
IgG
C1q α-mac IgM
Γ LV
100
200
300
400
0 40 8050
100
150
200
250
300
30 40 50 60 70 80-100
0
100
200
300
[ΓSL
- Γ S
V]
100
200
300
400
IgG
C1q α-mac
IgM
0 20 40 60 80100
150
200
250
300
350
FIIFV HSA
FIIa
Ub
A
B
C
FXII
1.0±0.2
179±27
175±33
FXII
MW (kDa)
App
aren
t Sur
face
Exc
ess (
pico
mol
es/c
m2 )
Page 46
Solid
-Liq
uid
Inte
rpha
se
lnC
Bm
ax (p
M)
10
12
14
16
18
2 3 4 5 6 7
10
12
14
16
18
Liqu
id-V
apor
Inte
rpha
se
lnC
Bm
ax (p
M)
lnMW (MW in kDa)
FVHSA
FAFHSA
FII
IgG
IgM
C1q
α-mac
FIIaUb
FVHSA
IgG
IgM
C1q
FIIa
Ub
FII FXII
A
B
Page 47
Glossary of Symbols
BC Bulk solution concentration (moles/volume) maxB
C Bulk solution concentration at limiting interfacial tension or contact angle (moles/volume)
FCCC Face-Centered-Cubic close packing concentration (moles/volume)
IC Interphase concentration (moles/volume) maxIC Maximal interphase concentration (moles/volume)
/ 2BCΘ Bulk solution concentration at half-maximal-change in contact angle (moles/volume)
slC Independent measure of protein adsorption χ Proportionality constant, / vR rχ ≡ ε Packing efficiency
oadsG∆ Free energy of protein adsorption
lvγ Liquid-vapor (LV) interfacial tension (mN/m)
slγ Solid-liquid (SL) interfacial tension (mN/m)
svγ Solid-vapor (SV) interfacial tension (mN/m)
lvγ Low-concentration asymptote of a concentration-dependent lvγ curve (mN/m)
'lv
γ High-concentration asymptote of a concentration-dependent lvγ curve (mN/m)
lvΓ Apparent Gibbs’ surface excess calculated at the liquid-vapor (LV) interface (moles/area)
[ ]sl svΓ − Γ Apparent Gibbs’ surface excess calculated at the solid-liquid (SL) interface (moles/area)
M Parameter fitted to concentration-dependent lvγ or aθ curve µ Activity-corrected chemical potential P
Partition coefficient, I
B
CP C≡
aΠ Advancing spreading pressure (mN/m) maxaΠ Maximum advancing spreading pressure (mN/m)
vr Protein radius (cm)
R Effective radius (cm), vR rχ≡ RT Product of Universal gas constant and Kelvin temperature (ergs/mol) S
Parameter computed from slope of aθ isotherm; 1
lna
B
SRT C
θ∆−=
∆ (moles/ergs. degrees)
S ′ Parameter corresponding to slope of aθ isotherm;
lna
B
SCθ∆′ =
∆ (degrees)
aτ Advancing adhesion tension (mN/m) oaτ Low-concentration asymptote of a concentration-dependent aτ curve (mN/m); cos
lv
o oa a
oτ γ θ= 'aτ High-concentration asymptote of a concentration-dependent aτ curve (mN/m); ' ' cos
lva a'τ γ θ=
aθ Advancing contact angle (degrees)
aθ Low-concentration asymptote of a concentration-dependent aθ curve (degrees) 'aθ High-concentration asymptote of a concentration-dependent aθ curve (degrees) *aθ
Advancing contact angle at half-maximal change in aθ isotherm '
* (degrees)2
a aa
θ θθ⎛ ⎞+
= ⎜ ⎟⎝ ⎠
Ω Total interphase thickness (cm)
Page 48
TABLE OF CONTENTS GRAPHIC
2 4 6 8 10 12 14 16 18 20
θ a (d
egre
es)
80
85
90
95
100
105
110
lnCB ( CB in pM)


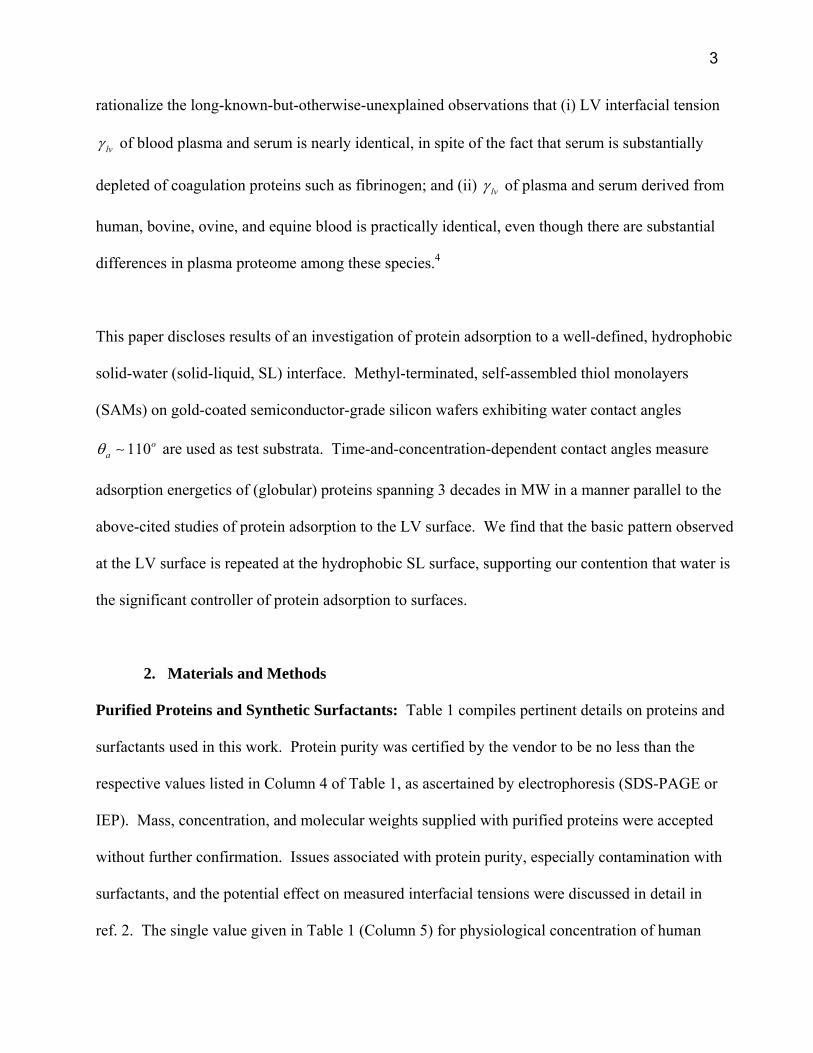

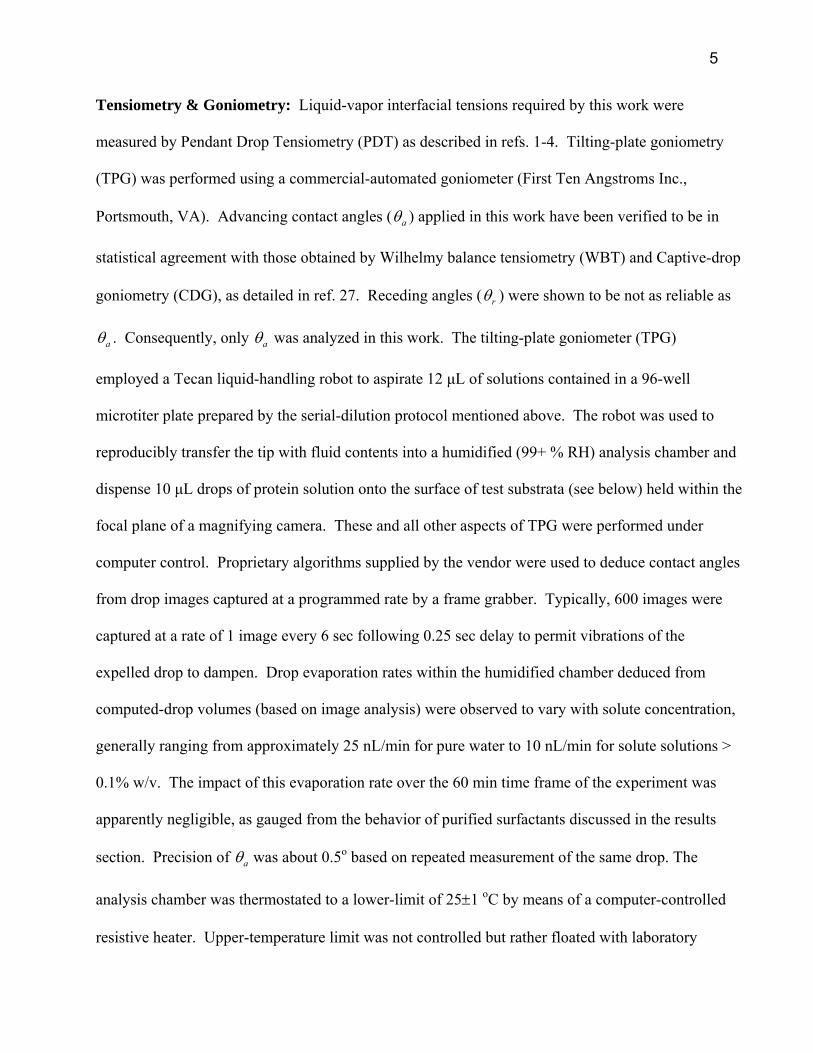


![1 Interfacial Rheology System. 2 Background of Interfacial Rheology Interfacial Shear Stress Interfacial Shear Viscosity = [ ]](https://static.documents.pub/doc/80x56/56649d1f5503460f949f3d29/1-interfacial-rheology-system-2-background-of-interfacial-rheology-interfacial.jpg)


![Journal of Electroanalytical Chemistry and Interfacial Electrochemistry Volume 252 issue 2 1988 [doi 10.1016%2F0022-0728%2888%2980226-2] Fernando Silva; Salomé Rodrigues -- The adsorption](https://static.documents.pub/doc/80x56/55cf9c50550346d033a966e0/journal-of-electroanalytical-chemistry-and-interfacial-electrochemistry-volume-565c6027c2c0f.jpg)


