Page 1
UNIVERSITÉ LIBRE DE BRUXELLES
Faculté des Sciences
Service de Chimie Analytique et Chimie des Interfaces
Interfacial study of a sensing platform for MDM2,
based on the self-assembly of a p53 peptide on a
gold electrode
Triffaux Eléonore
THESIS SUBMITTED FOR THE DEGREE
OF DOCTOR IN SCIENCES
Supervisor: Pr. Claudine Buess-Herman
Co-supervisor: Dr. Thomas Doneux
September 2015
Page 3
Remerciements
Je tiens à exprimer ma profonde reconnaissance à Madame le Professeur Claudine Buess-
Herman pour m’avoir accueillie au sein du Service de Chimie Analytique et Chimie des
Interfaces et pour l’intérêt qu’elle a porté à mon travail de rechercher au cours de ces années de
thèse. La confiance que vous m’avez témoigné tant sur mon travail de recherche que pour
l’enseignement des travaux pratiques m’ont permis de sortir de cette thèse grandie.
Je tiens également à remercier chaleureusement Thomas pour son aide inestimable. Tes
connaissances scientifiques, ta disponibilité, ta pédagogie, ta patience et les idées jaillissant
sans cesse de ton cerveau ont largement contribué à l’achèvement de ce travail. Ton humour
parfois très personnel et le cliquetis de la cuillère dans la tasse carrée auront rythmé cette thèse.
Un immense merci!
I also would like to thank Professor Dan Bizzotto from the University of British Columbia
for the three months I had the privilege to spend in his lab. I really enjoyed this stay both in a
scientific and personal perspective. I am sure that the maple leaves cookies helped me through
this work.
Je tiens également à remercier les personnes qui m’ont accompagnée au cours de ma thèse,
le Professeur François Reniers, le Professeur Jean-Michel Kauffmann et le Professeur Michele
Sferrazza. Leurs remarques judicieuses ont fait avancer ce travail.
J’exprime ma profonde gratitude à François Reniers pour les diverses opportunités qu’il
m’a offertes. Ma rencontre avec George Whitesides reste l’un des plus beaux souvenir de ma
thèse. Merci!
Un merci tout particulier à Philippe Leclère de l’Université de Mons pour toute l’aide
apportée lors des mesures AFM. Ta gentillesse et ta bonne humeur ont fait de ces journées des
moments très agréables!
Je me dois bien évidemment de remercier l’ensemble de mes collègues du laboratoire
CHANI qui ont rendu ces journées de labo mémorables. Votre bonne humeur et votre soutien
pendant la rédaction m’ont beaucoup aidée: Nico, Karim, Greg, Steph V., Quentin, Alp, Perrine,
Jonathan, Sami, Jennifer, Roman, Jérika, Francis, Phuong, Anne, Emile, Bernard, Jérémy,
Joffrey, Aurore, Titi, Dédé, Julie, Denis, François D., Steph C., Caro, Thomas B., Qiang et
Qirong
I also want to thank my colleagues from UBC: Amanda, Jannu and Landis. Thanks a lot
for your help!
Merci à Philippe De Keyser et à MacAlbert pour toute l’aide technique fournie et à Sandhya
Labouverie pour le support administratif.
Ma thèse ayant été étroitement liée à l’enseignement des travaux pratiques de chimie
analytique je tiens à remercier l’ensemble des étudiants que j’ai côtoyés au cours de ces six
années. Cette expérience a été pour moi une immense source de satisfaction et
d’enrichissement personnel! Ces journées l’auraient paru beaucoup plus longues sans mes
collègues de TP que je remercie vivement : Denis, Jennifer, Clément, Steph C. et Yannick.
Page 4
En parlant de TP, il y a une personne qui m’a énormément apporté… Eric, voilà six années
je débarquais comme jeune assistante, peu sûre de moi, dans l’envers du décor des labos. Grâce
à toi, je me suis adaptée rapidement et m’y suis sentie comme à la maison. Les petits déjeuners,
les chocolats, les morceaux de tarte autour d’une tasse de café, nos longues discussions, tous
ces moments partagés ont fait de toi, non plus un collègue, mais un ami. Tu as été un soutien
sans faille dans les moments plus difficiles et je ne t’en remercierai jamais assez.
Les filles, tout un programme, qu’est-ce qu’on a ri! Vous m’avez toujours soutenue et
comprise. Perrine, Julie, Steph et Dédé, j’ai beaucoup de chance de vous avoir rencontré et j’ai
hâte que nous continuions à partager de nouvelles aventures! Les boys, Titi et Sami, que dire si
ce n’est que votre présence a également illuminé les journées de labo et autres.
Et les vieux de la vieille alors ? Les chimistes des premières heures… Maxence et ton
humour douteux, Lionel soulignant ce même humour douteux, Yannick et Steven et leur
bienveillance légendaire. La chimie nous a réunis, l’amitié se charge de préserver cette union.
Léo, j’ai toujours pu compter sur toi au long de ces années. Je ne pourrai jamais assez te
remercier pour tout ce que tu m’as apporté.
Andrea et Morgane, vous êtes mes valeurs refuges, ma base. A chaque étape, vous êtes
présents, jamais vous n’avez failli. Des amis comme vous, il y en a peu et je mesure la chance
de vous avoir et le bonheur de pouvoir encore partager tant de moments précieux à vos côtés.
The « best of MCC », qui aurait cru que la valeur ajoutée d’un master complémentaire en
gestion en horaire décalé aurait été aussi élevée sur le plan amical. Steph M., Marine, Emilie,
Astrid, Elodie, Bryan, Nico et Daniel, grâce à vous le poste immobilisations incorporelles de
mon compte de résultats a explosé !
Maman, Papa, Emily, Matthieu, Pèpère et Mèmère aucun mot ne sera suffisant pour vous
exprimer ma gratitude. Maman, merci pour ton écoute et tout le réconfort que tu m’as apporté.
Mimi et Matt, vous êtes toujours là pour relativiser et me faire rire. Papa, les livres d’or que tu
nous lisais m’ont peut-être inconsciemment menée vers cette thèse. Pèpère, tu es parti trop tôt,
mais je sais que là où tu es, tu dois être fier. Je vous aime. Maarten, tu es officiellement entré il
y a peu dans le clan mais tu t’y es vite intégré. Merci pour ton aide avec les figures. Loulou, ta
venue au monde, le jour de mon dépôt de thèse a rendu cette journée inoubliable.
Julius, tu as dû faire preuve de beaucoup de patience depuis que nous nous sommes
rencontrés. Je n’ai pas toujours été disponible mais tu t’es montré très compréhensif, mieux tu
m’as encouragé à persévérer dans mes ambitions. Tu arrives à me faire sortir de ma zone de
confort et tu fais de moi une personne meilleure. Tu m’acceptes dans toute ma complexité.
Merci d’être là.
Page 7
Table of Contents
Chapter 1. Introduction…………………………...............…………………………………1
1.1 Scope …..….......………………………………………….………………………….......1
1.2 Aim of the work…………………….…………………….…………………………...…3
1.3 Immobilisation of the probe on the transducer surface ……………………………...…..4
1.3.1 Covalent coupling ........................................................................................................ 6
1.3.2 Direct immobilisation of the thiolated probe ............................................................... 9
1.4 Electrochemical detection of the recognition event ……………………………………11
1.4.1 Label-based electrochemical detection ...................................................................... 12
1.4.2 Label-free electrochemical detection ......................................................................... 16
1.5 Organisation of the biomolecules monolayers …….......………………………………21
1.6 Strategy………………………………………………………………….……….…..…25
1.6.1 Presentation of the considered system ....................................................................... 25
1.6.1.1 The p53 tumour protein and the Murine Double Minute 2 oncoprotein ........... 25
1.6.1.2 Formation of the MDM2-p53 complex ............................................................. 27
1.6.1.3 Electrochemical sensing of MDM2 .................................................................... 29
1.6.2 Choice of the electrode material ................................................................................ 32
1.6.3 Selection of the sequence .......................................................................................... 33
1.6.4 Working plan ............................................................................................................. 34
Chapter 2. Experimental ....................................................................................................... 35
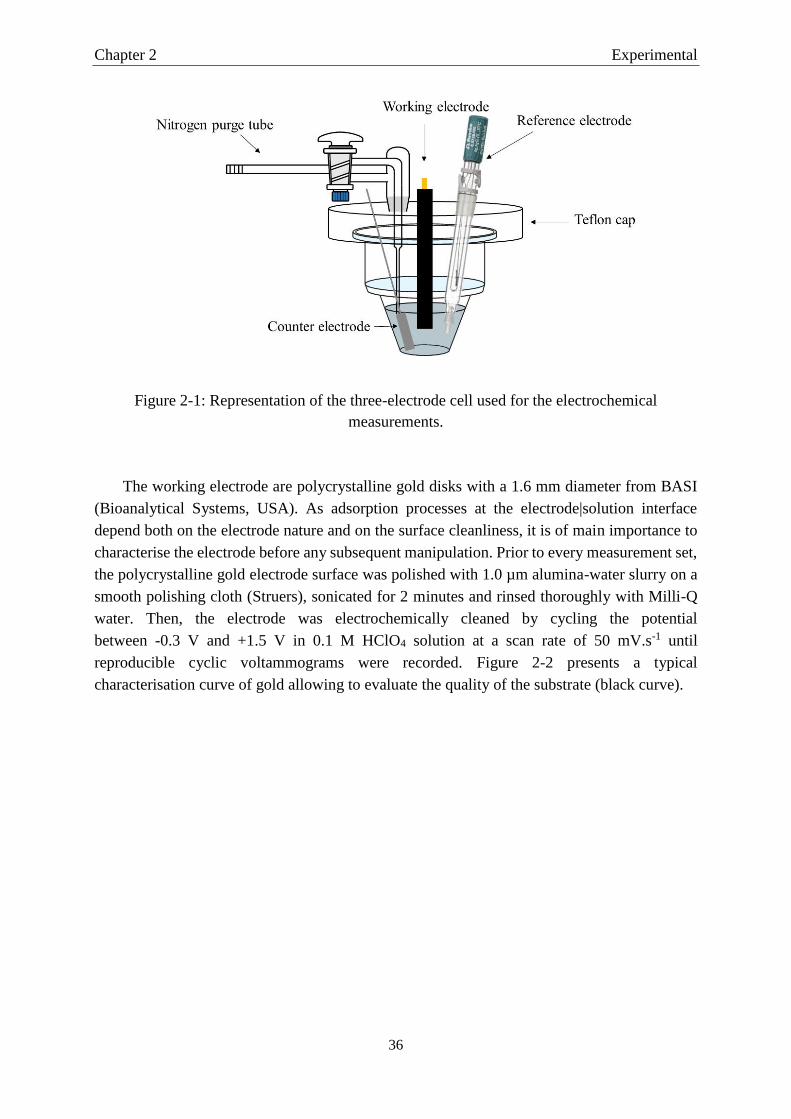
2.1 Electrochemical techniques…………………………………………………….…….....35
2.1.1 The electrochemical cell ............................................................................................. 35
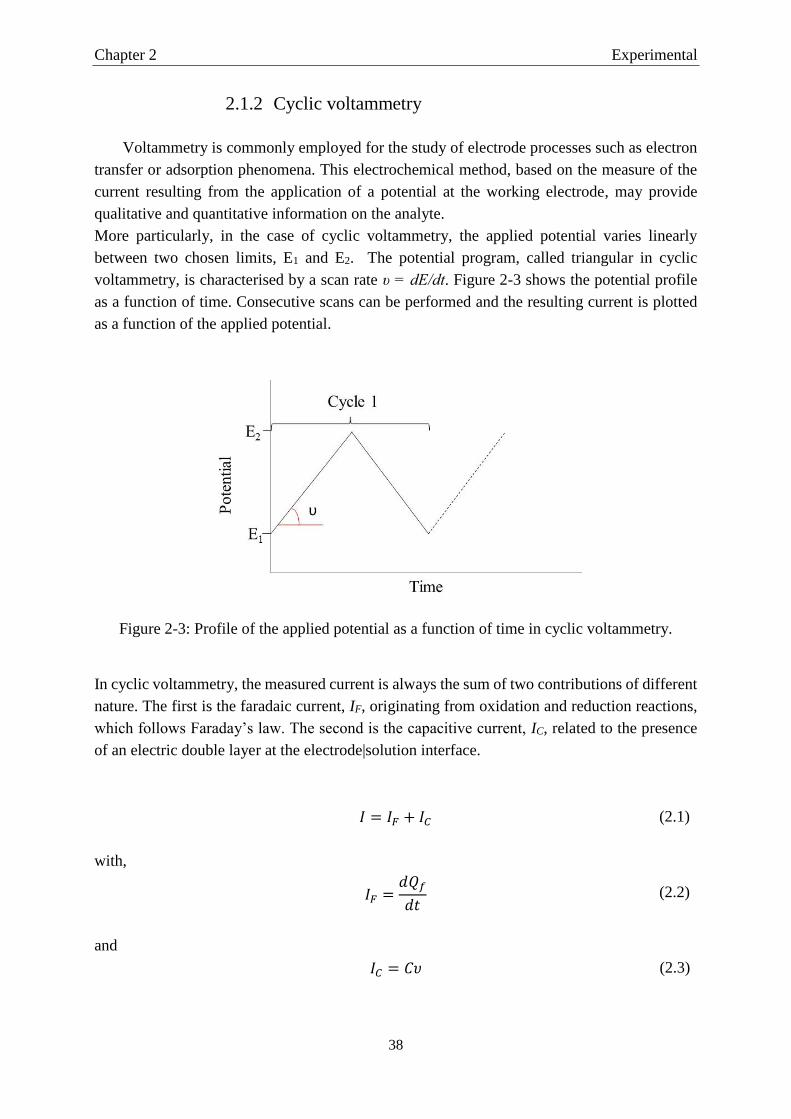
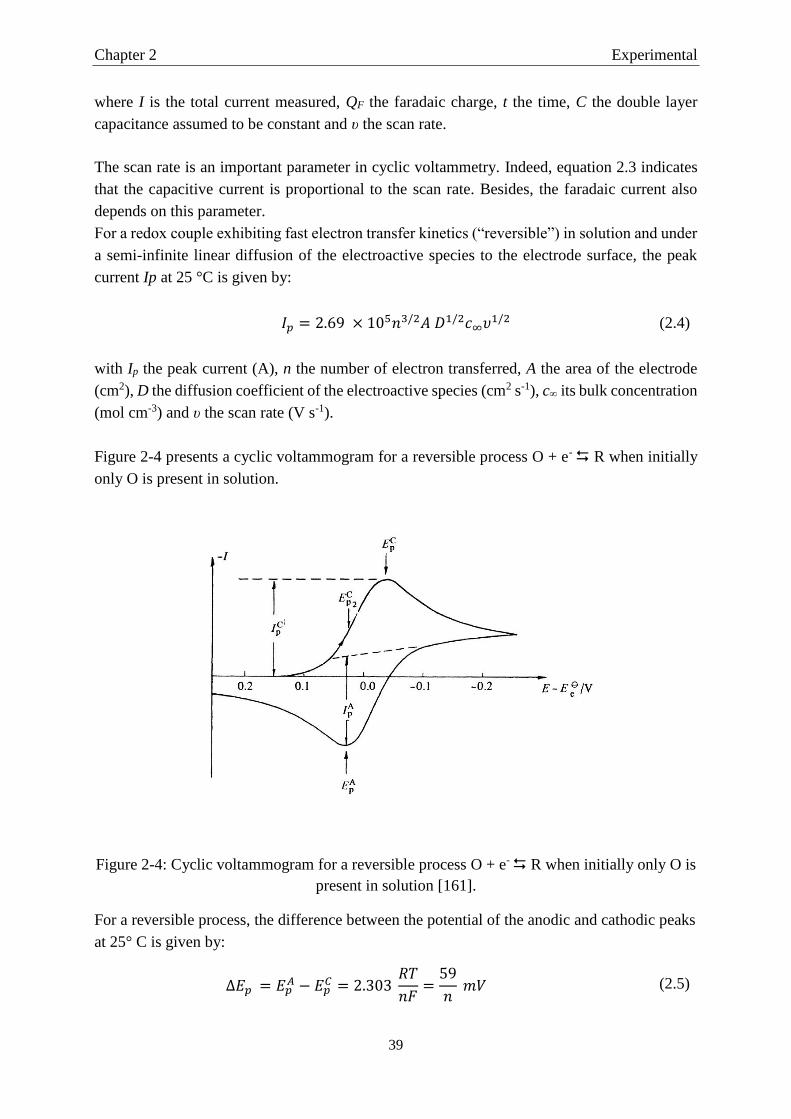
2.1.2 Cyclic voltammetry .................................................................................................... 38
2.1.3 Chronoamperometry and chronocoulometry .............................................................. 42
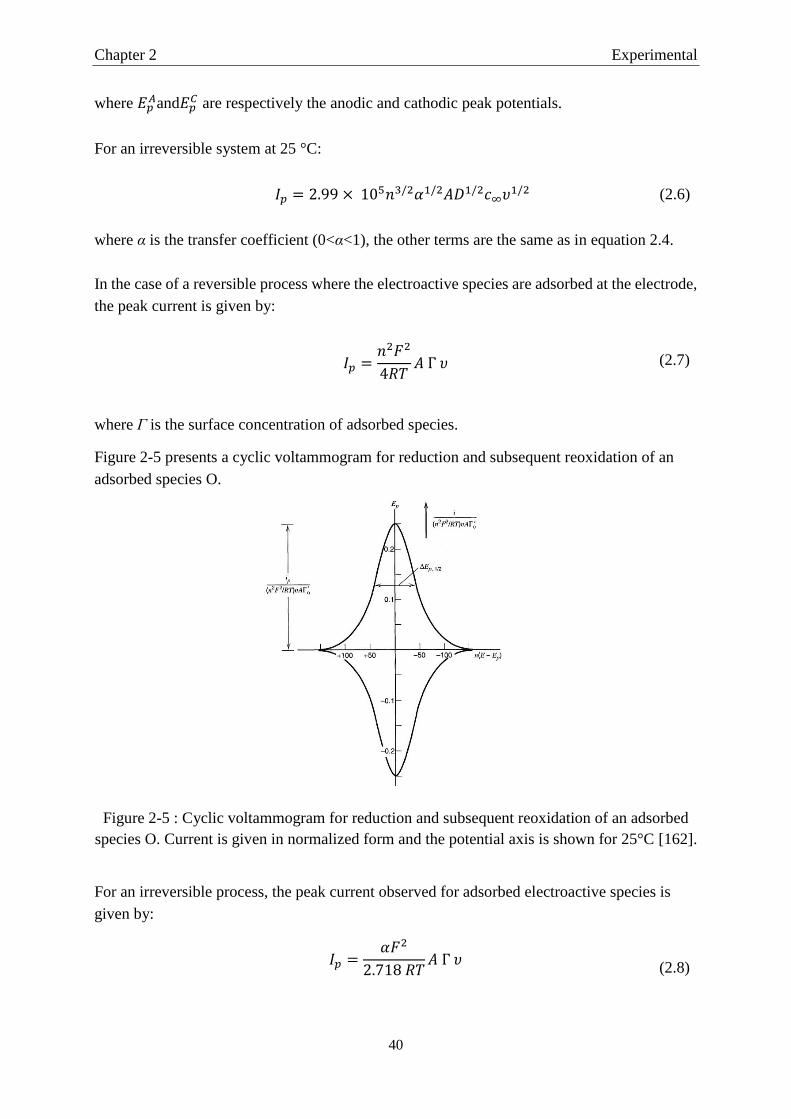
2.1.4 Electrochemical Impedance Spectroscopy ................................................................. 43
2.2 Quartz Crystal Microbalance ........................................................................................... 46
2.3 Atomic Force Microscopy ............................................................................................... 48
2.4 In situ fluorescence microscopy ....................................................................................... 49
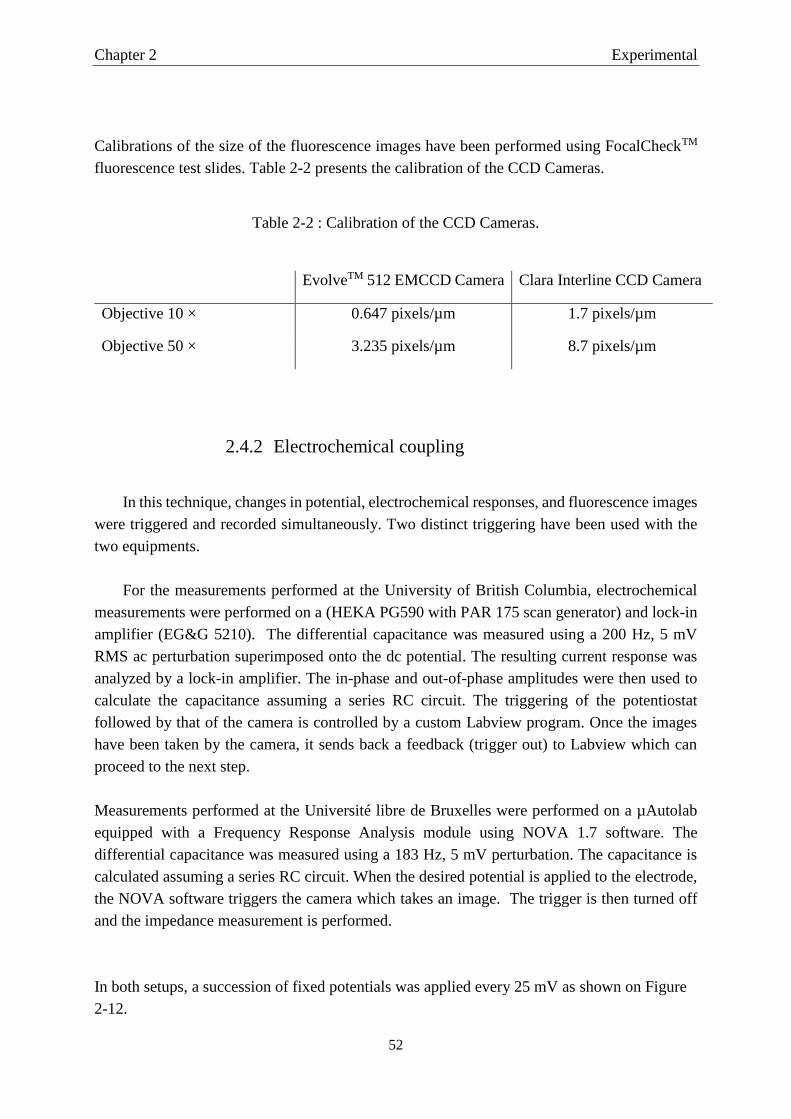
2.4.1 Experimental setup ..................................................................................................... 49
2.4.2 Electrochemical coupling ........................................................................................... 52
Page 8
2.5 Chemicals ......................................................................................................................... 54
Chapter 3. Electrochemical characterisation of the immobilisation of the peptide
aptamer probe on gold………………………………………………………... 56
3.1 Formation of the self-assembled monolayers ……………………………….................56
3.2 Evidence of the immobilisation of the thiolated molecules……………………………..58
3.3 Interaction between the [Ru(NH3)6]3+ complex and the peptide probe…………………61
3.3.1 Evidence of the interaction between the complex and the peptide probe ................. 61
3.3.2 Influence of the immobilisation procedure on the [Ru(NH3)6]3+ concentration
adsorbed at the electrochemical interface……………………………..…………….68
3.4 Electrochemical behaviour of the redox couple [Fe(CN)6]3-/4- in presence of the
monolayers .................................................................................................................... 71
Chapter 4. Elaboration of a p53 peptide-based transducer for the detection of the
protein MDM2…...…...….………………………………………………………..72
4.1 Principle of the detection method ……………..…………………………….................72
4.2 Influence of the contact of the protein MDM2 with the peptide layer on the charge
transfer resistance..……….………………..……………………………………………76
4.3 Behaviour of the MDM2 protein on gold and at p53-modified electrodes………….....80
4.4 Quartz crystal microbalance measurements ……………..…………………………….84
4.5 Analytical performance ……………...………..…………………………….................88
4.5.1 Impact of the concentration of MDM2 on the signal…………………………...….88
4.5.2 Negative controls………………..………..…………………….…………………...90
Chapter 5. Fluorescence microscopy study of self-assembled monolayers of the peptide
aptamer probe on gold………..………………………………………………...94
5.1 Fluorescence spectroscopy ……………..…………..………………….........................94
5.1.1 General principles……………………………………………...…………………….94
5.1.2 Fluorescence quenching……………………………………..………….…………...96
5.1.3 Förster Resonance Energy Transfer……….……………..…..……………………...98
5.1.4 Fluorescence near metal surface…….….…………………...……………….………99
5.1.5 Fluorescence microscopy………….……………………..………………….……..104
5.2 Modification of the peptide probe for fluorescence purposes ……………..................108
5.3 Interfacial behaviour of the peptide monolayers under polarisation………….............109
5.4 Definition of the regions of interest ……………..………………………………....…115
5.5 Reductive desorption behaviour of mixed layers …………….....................................118
Page 9
5.5.1 Case of an electrode modified by a two-step adsorption procedure……..……....…118
5.5.2 Case of an electrode modified by a one-step coadsorption procedure……………..122
5.6 Interfacial behaviour of a single component layer composed of peptide …………….125
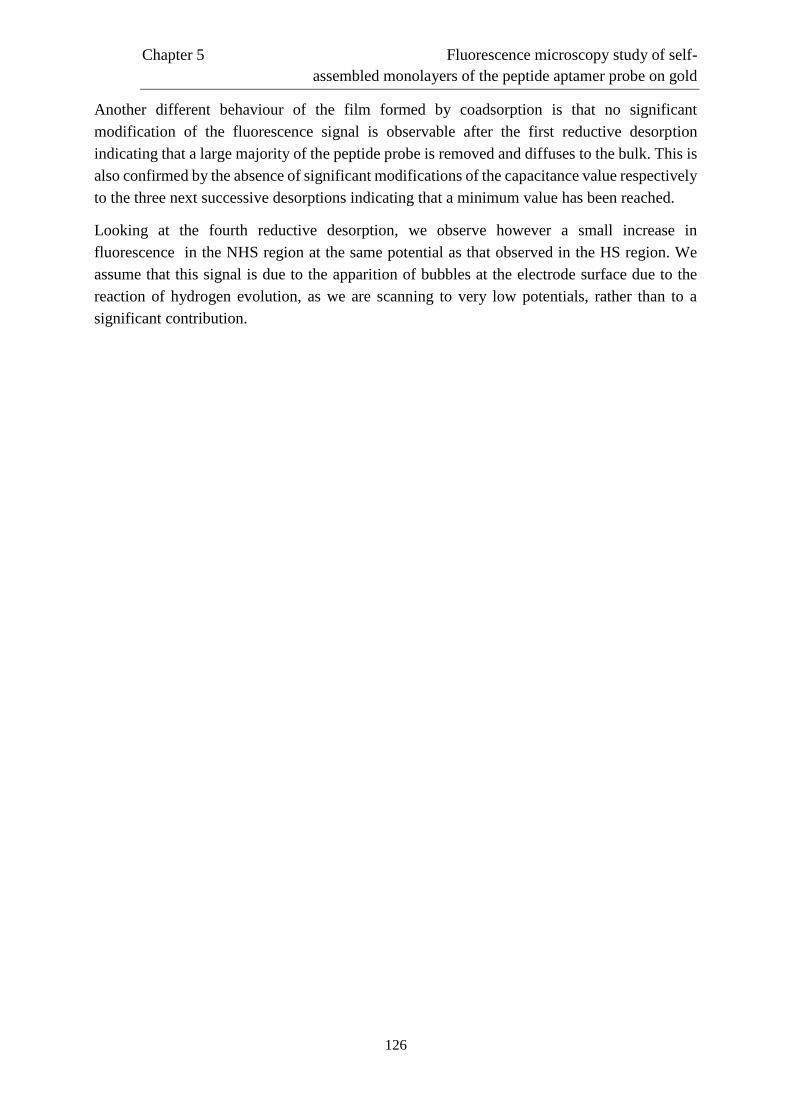
5.7 Study of the heterogeneities of the SAMs ………………………..………..................130
5.8 AFM characterisation of the peptide SAMs …………….............................................134
Chapter 6. Conclusions…………………………………………………………..………...139
6.1 General conclusions……………………………………………………. …………….139
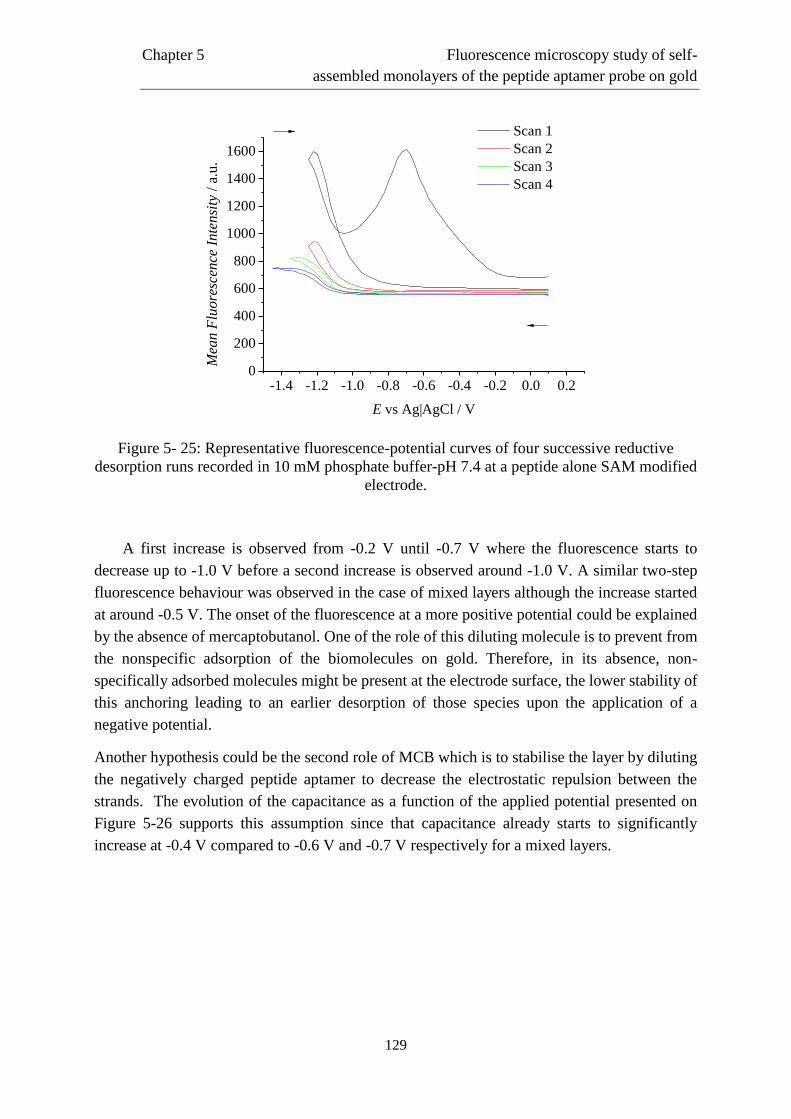
6.2 Prospects ………………………..……….....................................................................141
Page 11
Abstract
This work focuses on the electrochemical and in situ fluorescence microscopy study of the
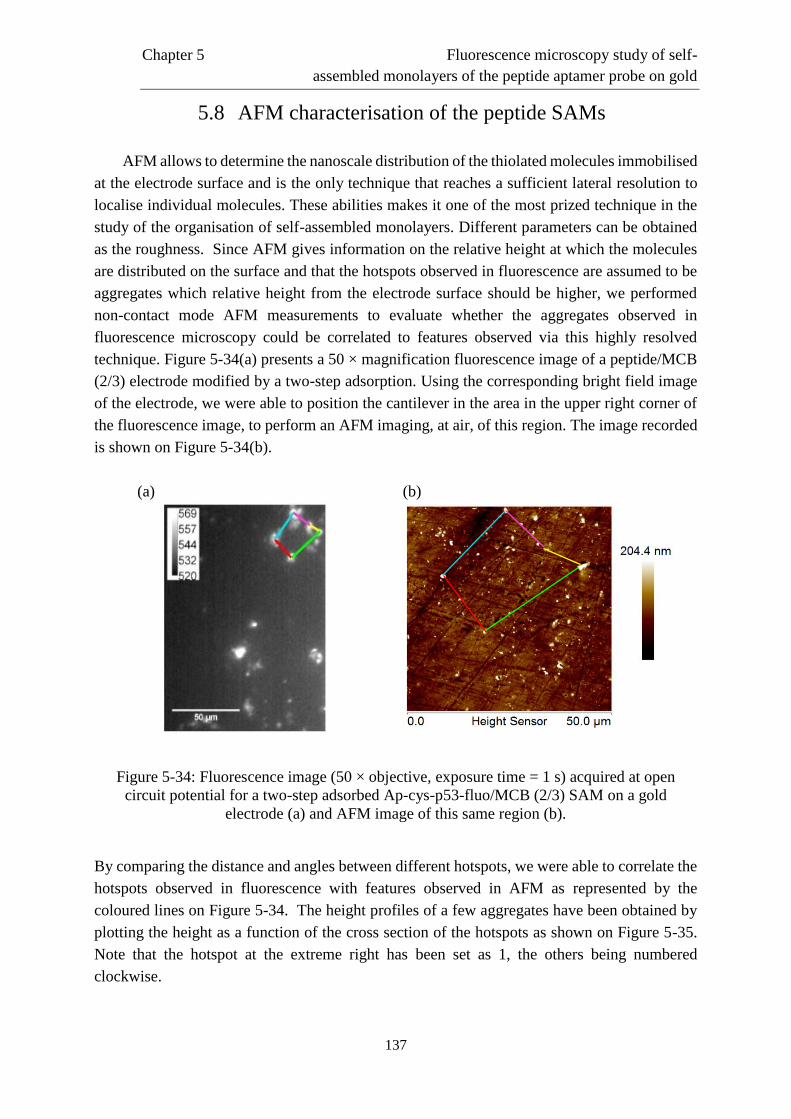
self-assembly, on gold electrodes, of monolayers of peptide aptamers of the p53 protein for the
detection of the protein MDM2. The use of new recognition probes for the molecular
recognition such as peptide aptamers has been considered as an alternative to the use of
antibodies. Peptide aptamers are synthetic peptide sequences binding the target protein with
high affinity and specificity.
The first part of this work consisted in the electrochemical study of the modified interface
resulting from different immobilisation procedures. Measurements in the presence of the
[Ru(NH3)6]3+ redox marker have evidenced the immobilisation of the peptide probe at the gold
electrode and allowed the relative quantification of the density of probe adsorbed at the
electrode with respect to the considered immobilisation procedure. Besides, measurements in
the presence of the redox couple [Fe(CN)6]3-/4- showed a dramatic inhibition of the electron
transfer in the case of monolayers exclusively composed of the peptide.
In a second time, we focused on the detection of the protein MDM2. Three modified
interfaces were considered, namely two mixed layers of peptide and 4-mercaptobutan-1-ol, the
latter playing the role of diluent, adsorbed in one or two step(s), and a monolayer exclusively
composed of the peptide. The use of electrochemical impedance spectroscopy in the presence
of the redox couple [Fe(CN6)]3-/4- as detection method evidenced the relevance of this latter
interface for the detection. Indeed, the inhibition of the electron transfer previously identified
is highly lowered via the interaction with the target protein. A detection range extending from
~1 to 60 ng mL-1 and a limit of detection of 0.69 ng mL-1 have been obtained. This performance
can be compared to the commercially available ELISA kits. The reliability and specificity of
the response have been tested via negative controls performed on three proteins, namely the
fibrinogen, the cytochrome c and the bovine serum albumin and validated through
complementary quartz crystal microbalance measurements.
The third part of this work is dedicated to the in situ fluorescence microscopy study of the
organisation of monolayers resulting from the three pre-cited immobilisation procedures. These
measurements evidenced a heterogeneous distribution of the probe density and more
particularly the presence of aggregates. These features cannot be desorbed from the electrode
surface via very negative potentials (-1.450 V vs Ag|AgCl). The influence of different
parameters such as the structure of the electrode, the presence of urea or the absence of an
anchoring function on the probe have been studied. Finally, atomic force microscopy
measurements have completed this study.
Page 13
Résumé
Ce travail porte sur l’étude électrochimique et par microscopie de fluorescence in situ de
l’auto-assemblage, sur électrode d’or, de monocouches d’aptamères peptidiques de la protéine
p53 en vue de la détection de la protéine MDM2. L’utilisation de nouvelles sondes de
reconnaissance moléculaire telles que les aptamères peptidiques a été considérée en tant
qu’alternative à l’utilisation d’anticorps. Les aptamères peptidiques sont des séquences
synthétiques de peptide se liant à la protéine cible avec une affinité et une spécificité élevées.
La première partie de ce travail porte sur l’étude électrochimique de l’interface modifiée
résultant de diverses procédures d’immobilisation. Des mesures en présence du marqueur rédox
[Ru(NH3)6]3+ ont démontré l’immobilisation de la sonde peptidique à la surface d’or et ont
permis l’évaluation relative de la densité de sondes adsorbées à la surface respectivement à la
méthode d’immobilisation considérée. Par ailleurs, des mesures en présence du couple rédox
[Fe(CN)6]3-/4- ont mis en évidence une inhibition drastique du transfert d’électron dans le cas
de monocouches composées exclusivement du peptide.
Dans un second temps, nous nous sommes intéressés à la détection de la protéine MDM2.
Trois interfaces modifiées ont été envisagées soit deux monocouches mixtes de peptide et de 4-
mercaptobutan-1-ol, ce dernier jouant le rôle de diluant, adsorbés en une ou en deux étape(s),
et une monocouche uniquement composée de peptide. L’utilisation de la spectroscopie
d’impédance électrochimique en présence du couple rédox [Fe(CN)6]3-/4- comme méthode de
détection a mis en exergue la pertinence de cette dernière interface pour la détection. En effet,
l’inhibition du transfert d’électron préalablement identifiée est fortement amoindrie suite à
l’interaction avec la protéine cible. Une gamme de détection s’étendant de ~1 à 60 ng mL-1 et
une limite de détection de 0,69 ng mL-1 ont été obtenues. Cette performance est comparable à
celle des kits ELISA commerciaux. La fiabilité et la spécificité de la réponse ont été vérifiées
par le biais de contrôles négatifs sur trois protéines, en l’occurrence le fibrinogène, le
cytochrome c et l’albumine de sérum bovin, et validées par des mesures complémentaires de
microbalance à cristal de quartz.
La troisième partie de ce travail est consacrée à l’étude, par microscopie de fluorescence
in situ, de l’organisation de la monocouche résultant des trois procédures d’auto-assemblage
précitées. Ces mesures ont permis la mise en évidence d’une distribution hétérogène de la
densité en sondes, et plus particulièrement la présence d’agrégats. Ceux-ci ne peuvent être
désorbés de la surface par l’application de potentiels même très négatifs (-1,450 V vs Ag|AgCl).
L’influence des différents paramètres tels que l’état de surface, la présence d’urée ou l’absence
de fonction d’ancrage sur la sonde a été étudiée. Enfin des mesures de microscopie de force
atomique ont complété cette étude.
Page 15
“This I believe: That the free, exploring mind of the individual
human is the most valuable thing in the world. And this I would
fight for: the freedom of the mind to take any direction it wishes,
undirected.”
John Steinbeck
Page 17
Chapter1 Introduction
1
Chapter 1. Introduction
1.1 Scope
The growing interest in point-of-care testing and the need of specific, reliable, fast, cost-
effective and easy-to-use detection devices for clinical, biochemical and environmental analytes
in various complex media has led to the development and elaboration of many types of sensors
based on a wide range of probes such as antibodies, oligonucleotides, aptamers,… The interest
in biological sensors is a very active area in analytical research [1-10]. Many of these biosensing
related studies discuss the importance of an interdisciplinary approach involving a variety of
fields such as biochemistry, material sciences, analytical chemistry…
A biosensor is a small device composed of a biological recognition element assembled on a
transducer which transforms the biological event into a signal that can be directly measured. A
variety of combinations of recognition elements and transducers can be found in the literature.
Considering the increasing interest for biosensors, the International Union of Pure and Applied
Chemistry (IUPAC) proposed the following definition [11]:
“An electrochemical biosensor is a self-contained integrated device, which is
capable of providing specific quantitative or semi-quantitative analytical
information using a biological recognition element (biochemical receptor) which
is retained in direct spatial contact with an electrochemical transduction
element”.
Although this definition focuses on electrochemical biosensing, it can be extended to other
principles of signal transduction. Figure 1-1 presents a typical scheme of a biosensor.
Page 18
Chapter1 Introduction
2
Figure 1-1: Schematic principle of a biosensor [2].
Biosensors can be classified according to the selected signal transduction method. Among
these, electrochemical, optical and piezoelectric-based transduction are the most commonly
considered. Electrochemical sensors, in which an electrode is used as the transduction element,
indisputably attract the most interest due to some advantages: they are easy to design since no
strict geometry, shape or size are required, they present low costs and are prospects to
miniaturization. Up to now, developments have been performed in a wide range of applications
such as clinical, environmental and agricultural analyses.
Biosensors can also be discriminated on the basis of the type of biorecognition element and the
signal nature: enzymatic biosensors, based on the immobilisation of enzymes and, affinity
biosensors, based on immunoreagents as antibodies or antigens, DNA derivatives as
oligonucleotides sequences or aptamers and protein receptors.
In the case of enzymatic sensors, the signal reflects the rate of the substrate conversion or
enzymatic activity. For example, electrochemistry of immobilised proteins has been used for
the detection of electroactive species. Cytochrome c modified electrodes have been used for the
analysis of superoxide as well as haemoglobin modified electrodes for nitric oxide detection
[12-16] Metal binding properties of proteins have also been used for metal ion analysis [17-20].
Affinity-based biosensors, on the other hand, exploit reversible biochemical interactions as
antigen-antibody, DNA-DNA or DNA-protein [7]. Among these, immunosensors based on
antibodies or antigen as bioreceptor are the most widespread. The high affinity and specificity
of an antibody for its antigen allows a selective binding of the analyte in the nano- to picomolar
range in the presence of hundreds of other substances, even if they exceed the analyte
concentration by 2-3 orders of magnitude. Furthermore, antibodies present a wide versatility in
nature and are commercially available. Their use as recognition elements in bioanalytical assays
can be traced back to the late 1950s [21]. Since then, a lot of work has been devoted to the
development and understanding of these devices [22-29]. Nowadays, the most popular
immunosensor is the enzyme-linked immunosorbent assay (ELISA) allowing the detection of
an antibody or antigen in a complex sample.
Page 19
Chapter1 Introduction
3
Besides antibodies, other proteins and peptides show the biorecognition properties required for
the specific detection of biological targets. These alternative probes will be considered in this
work.
The working principle of a biosensor rely on the selective interaction between an immobilised
probe and a target protein. Electrochemical techniques allow the conversion of the formation
of the duplex between a target in solution and the probe immobilised on a solid support
(transducer) into an electric signal.
The conception of an electrochemical biosensor for the detection of biomolecules requires three
key steps:
1. The immobilisation of the probe on the transducer surface
2. The biorecognition with the target protein
3. The electrochemical detection of the recognition
Two approaches of electrochemical detection can be distinguished:
a labelled approach consisting in the modification of the probe or the target protein via
the attachment of a redox centre aimed at providing a binding-sensitive electrochemical
signal
a label-free approach in which no modifications of the target or the probe, aimed at
providing an electrochemical response, are involved
Although, the biosensing strategies presented in this work will be classified according to these
definitions, it should be underlined that there is no consensus about it, indeed, the modification
of the probe is also often referred to as unlabelled.
Each of these three steps has to be optimised to guarantee a high-performance sensor. A wide
variety of substrates as carbon, mercury, platinum, gold and conducting polymers can be used
[30-34].
Page 20
Chapter1 Introduction
4
1.2 Aim of the work
In the context of this thesis, we will focus on the elaboration of an electrochemical affinity-
based biosensor and more particularly on the immobilisation of peptides for the electrochemical
detection of proteins. Indeed, although antibodies are one of the key tools used in biological
sciences for the identification of other molecules, it is known that they presents quite a number
of drawbacks. Among these, there is the batch-to-batch variability which can produce
dramatically different results [35-37]. Besides, difficulties have been reported regarding their
ability to achieve efficient interfacial architectures. The random orientation of these asymmetric
molecules on surfaces can reduce their accessibility or even induce a loss of biological activity
upon immobilisation [38, 39]. The rather big size (M>150 kDa) of these biomolecules can also
cause some issues in terms of sensitivity. As biosensors are miniaturised devices, the use of
smaller recognition elements could help overcome this problem.
Recently, a new biological tool, the peptide aptamer has emerged. Peptide aptamers, from
the Latin aptus meaning “fitting”, consist of a short variable peptide domain presented in the
context of a supporting protein scaffold [40]. Therefore, they resemble antibodies, in which a
variable antigen-binding domain is exposed from a rigid backbone. Their ability to bind their
target with high affinity and specificity both in vitro and in vivo makes them excellent
candidates for protein analysis [41]. Conventionally, peptide aptamers are isolated from
combinatorial expression libraries by screening systems based on the “yeast two-hybrid
technology” developed by Stanley Fields et al. [42]. In the screening process, their coding
sequence are isolated together with the aptamers, giving immediate availability and unlimited
amount of the binding molecule. In an extended view, the word “aptamer” is also used for
natural small peptides able to bind a specific target molecule. In the context of this work, we
propose to work with this natural class of aptamers. More particularly, we propose to use a
peptide based on the natural sequence of interaction of the p53 protein with the protein MDM2
as recognition element. Its in vitro synthesis will reduce the variability. Besides the smaller size
of these biomolecules (< 35 kDa) which allows an improved sensitivity since a higher density
of probe can be achieved, the modification of the peptide sequence with a cysteine residue at
the N-terminal position should allow a better control of the orientation.
Regarding these considerations, we propose to contribute to the study of the immobilisation on
a gold electrode of a peptide of the p53 tumour suppressor protein for the recognition of the
oncoprotein MDM2.
As the stability of the layer and the accessibility of the probe are key issues in the
elaboration of an efficient sensor, electrochemical detection of biomolecules requires a deep
understanding of the surface chemistry. Therefore, this study comes within the wider scope of
the elaboration and comprehension of molecular self-assembly. The study of the organisation
of the biomolecular probe at the electrode surface resulting from the adsorption procedure and
more precisely of the homogeneity the self-assembled monolayers is of major importance.
Page 21
Chapter1 Introduction
5
As a result, we will focus on three key axis, which are the immobilisation of probe, the
electrochemical detection of the recognition event and the organisation of the biomolecules.
1.3 Immobilisation of the probe on the transducer surface
As mentioned earlier, the study of the molecular interactions occurring between two
partners, the target contained in solution and the probe immobilised on the surface of a
transducer, is often performed via the immobilisation of peptides and proteins on a surface
transducer.
The key requirements for a sensor surface are:
1. Providing an optimal binding capacity of the probe
2. Retaining the biological activity of the probe since proteins tend to unfold when
immobilised on a support [43]
3. Preserving the accessibility of the probe for the target
4. Minimising the non-specific adsorption
Obviously, surface chemistry is the initial key issue in the immobilisation of a protein or peptide
probe [44, 45]. Contrary to negatively charged oligonucleotides, proteins are amphipathic
molecules. Therefore, a high degree of adsorption, related to electrostatic and van der Waals
forces, hydrophobic effect or conformational changes as well as a restricted lateral diffusion in
the vicinity of the surface is observed. From one biomolecule to the other, the type and the
extent of these interactions with the surface varies, complicating the achievement of zero-
fouling surface.
Although physical adsorption represents the easiest process for probe immobilisation, it is
not suitable in the context of biosensing since it is almost impossible to control. Indeed, a close
proximity of the recognition site to the surface can suppress the affinity for the target.
Furthermore, in the presence of a mixture of proteins in solutions, the adsorbed proteins may
exchange with those present in solution whereas stringent washing can destabilise the protein
attachment [46, 47]. This indicates that none of the key requirements presented above is
fulfilled. Therefore, in the context of this work, we will consider a covalent binding of the
probe.
Page 22
Chapter1 Introduction
6
1.3.1 Covalent coupling
The immobilisation of proteins, such as antibodies, on a surface is often performed through
covalent binding with reactive groups on the support. As peptides present similar chemical
functionalities as proteins, for example, -SH (cysteine), -NH2 (lysine, arginine), -COOH
(asparagine, glutamine), -OH (serine), imidazole (histidine) on the side chains of their
backbone, it is possible to immobilise them using the chemistry developed for antibodies such
as chemical coupling reactions with prepared SAMs. To take advantage of the naturally
available functional groups, the surface must be specifically tailored to achieve the highest
efficiency of covalent binding and optimise the homogeneity of the population of immobilised
proteins.
Many types of organic reactions can be considered to covalently bind proteins to modified
surfaces such as nucleophilic substitutions, esterification, acylation and nucleophilic addition
methods [48].
Stine et al. recently reviewed on the various bioconjugation reactions for covalent coupling
of proteins to gold surfaces [45]. The conjugation can occur through the amine group of the
lysine residue side chain via its reaction with an activated modified surface as 1-ethyl-3-[3-
dimethylaminopropyl]carbodiimide (EDC or EDAC) and N-hydroxysuccinimide (NHS), or
with SAMs terminated with aldehyde groups, or with epoxide functionalized surfaces.
Similarly, cysteine residues are also often used for immobilisation through their thiol side
group. They can react with epoxides or conjugate addition to α, β-unsaturated carboxyl groups,
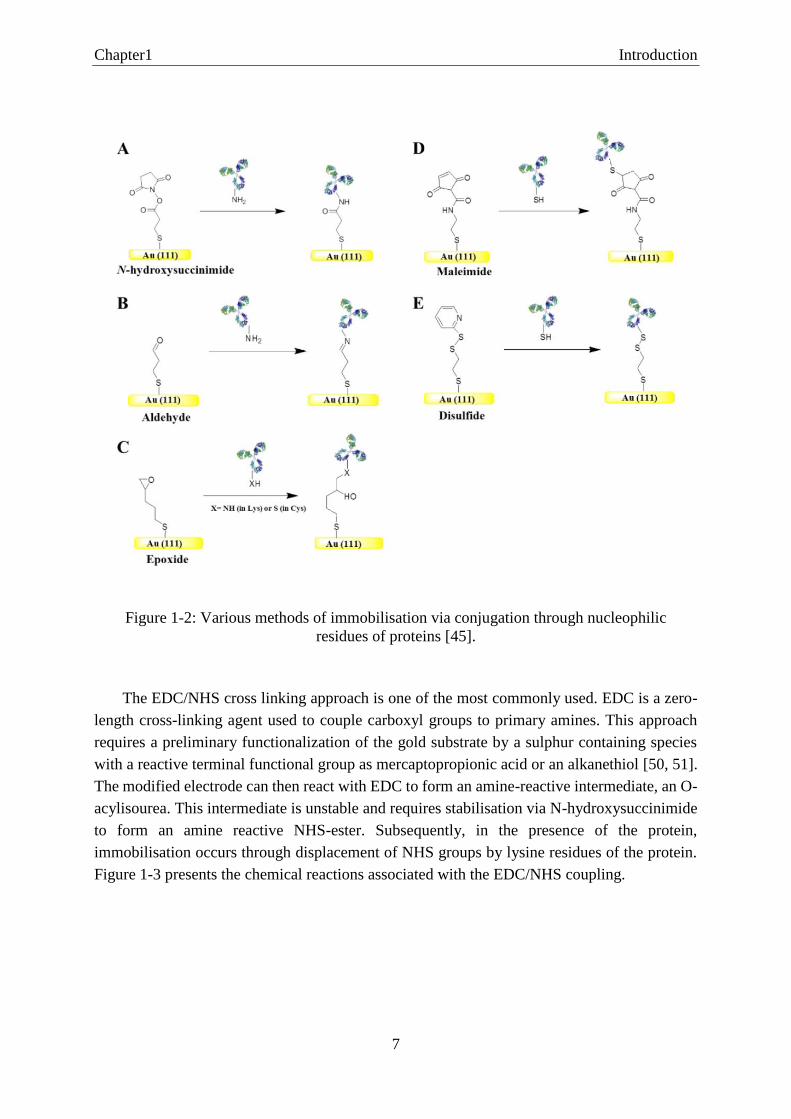
such as maleimides to form thioester bonds. Figure 1-2 presents different ways of
immobilisation via conjugation through nucleophilic residues.
Fernandez-Lafuerte et al. proposed a way of immobilisation based on the activation of the
carboxyl groups of aspartic acid and glutamic acid by reaction with a carbodiimide [49].
Page 23
Chapter1 Introduction
7
Figure 1-2: Various methods of immobilisation via conjugation through nucleophilic
residues of proteins [45].
The EDC/NHS cross linking approach is one of the most commonly used. EDC is a zero-
length cross-linking agent used to couple carboxyl groups to primary amines. This approach
requires a preliminary functionalization of the gold substrate by a sulphur containing species
with a reactive terminal functional group as mercaptopropionic acid or an alkanethiol [50, 51].
The modified electrode can then react with EDC to form an amine-reactive intermediate, an O-
acylisourea. This intermediate is unstable and requires stabilisation via N-hydroxysuccinimide
to form an amine reactive NHS-ester. Subsequently, in the presence of the protein,
immobilisation occurs through displacement of NHS groups by lysine residues of the protein.
Figure 1-3 presents the chemical reactions associated with the EDC/NHS coupling.
Page 24
Chapter1 Introduction
8
Figure 1- 3: Mechanism for protein immobilisation via EDC/NHS coupling [45].
Wang et al. used binary mixed SAMs composed of protein resistant oligoethylene glycol thiol
and N-hydroxysuccinimide terminated thiol for covalent attachment of proteins via lysine
residues onto the surface and systematically studied isolated single molecules on surface
through AFM measurements [52].
Suri et al., also used a cross linking approach as they modified gold surfaces using a
homobifunctionnal cross-linker, the dithiobissuccinimide proprionate (DSP) for protein A
immobilisation [53]. Indeed, protein A can then play the role of a linker to immobilise
antibodies in a uniform, stable and accessible way. Figure 1-4 presents this cross-linking
approach.
Page 25
Chapter1 Introduction
9
Figure 1-4: DSP cross-linking approach for protein immobilisation on gold [45].
1.3.2 Direct immobilisation of the thiolated probe
Besides covalent coupling, it is also possible to directly covalently immobilise a peptide
probe on gold. Indeed, a cysteine residue, containing a thiol group on its side chain, can be used
as an anchoring group on gold.
The formation of self-assembled monolayers (SAMs) of thiolated molecules on gold
surfaces is well known. Already in the 80s, Nuzzo et al. reported on the formation of organised
layers of thiolated molecules on gold [54, 55]. These early studies focused on the
immobilisation of three types of organosulfur compounds; alkanethiols, alkyl disulphides and
dialkyl sulphides, with different alkyl chain lengths [56-60]. Since then, a massive amount of
work has been dedicated to the understanding of the kinetics and thermodynamics associated
with the organisation of these layers and many types of substrates (gold, palladium, silver,
copper, platinum, carbon, mercury) and adsorbed molecules have been considered [61-69].
Although, alkanethiols monolayers on gold remain the most highly characterised.
Well-organised and compact self-assembled monolayers can be obtained via simple
immersion of the substrate in a diluted solution containing the thiolated molecules. The high
affinity of thiols for gold allows a fast adsorption, although it has been shown that many hours
are required to obtain well organised layers [70, 71]. From these considerations, it is possible
to immobilise molecules of biological interest containing a thiolated group through direct
adsorption on gold. Therefore, the modification of a peptide probe by the addition of a cysteine
residue in N-terminal position allows its direct immobilisation on gold.
The immobilisation of peptide or protein probes, via the thiol side chain of a cysteine
residue, has already been studied and is known as a suitable way to self-assemble peptide
sequences on gold [72-76]. It is known that peptides and proteins, as it is the case for DNA,
also tend to non-specifically adsorb on gold and this can significantly reduce the performance
of a sensor.
Page 26
Chapter1 Introduction
10
To circumvent non-specific adsorption, biomolecules are often coadsorbed with small
alkanethiols as 4-mercaptobutan-1-ol or 6-mercaptohexan-1-ol playing the role of diluent.
Various ways of direct immobilisation of biomolecules in the presence of a diluent on gold are
considered in the literature. Among these, a two-step adsorption, proposed by Tarlov et al.,
consisting of the immobilisation of the biomolecule probes, followed by the passivation of the
surface with an alkanethiol diluent is commonly used [77, 78]. This type of immobilisation
allows a better accessibility of the probe and prevents non-specific adsorption as it has been
shown with oligonucleotides SAMs. Indeed, the molecules, only covalently anchored through
the sulphur-gold bonding, straighten up which favours the access for the target molecules.
Figure 1-5 illustrates the effect of the passivation with an alkanethiol on a gold electrode
previously modified with a peptide.
Figure 1-5: Illustration of the formation of a self-assembled monolayer by consecutive
adsorption of a thiolated biomolecule and an alkanethiol.
Another common approach is the simultaneous adsorption of the biomolecule and the diluting
thiol.
Electrochemical measurements, carried out on oligonucleotides directly immobilised on
gold, have shown that the ionic strength of the immobilisation solution has a significant
influence on the amount of DNA immobilised on the surface [79, 80]. As DNA which is
negatively charged, peptides also carry charges, therefore, electrostatic repulsions between the
strands tend to decrease the amount of immobilised biomolecules. This effect can be circumvent
using a high ionic strength solution for the immobilisation step. Accordingly, high ionic
strength solutions have been used to prevent charge effects during immobilisation and achieve
densely packed layers.
Page 27
Chapter1 Introduction
11
1.4 Electrochemical detection of the recognition event
The analysis of proteins at electrode surfaces has been performed via various
electrochemical methods. Among these, we can cite, for instance, the work of Brabec and
Palecek investigating the presence of proteins at carbon electrodes, via differential pulse
voltammetry or potentiometric stripping analysis [81-83]; the analysis relying on the oxidation
peaks of tryptophan at about 0.70 V and/or tyrosine at 0.55 V vs Ag|AgCl reference electrode.
However, no selectivity was endowed by the surface. Therefore, more complex interfaces, such
as affinity-based sensors had to be considered.
The selectivity of an electrode for a target protein is based on the immobilisation of a
specific ligand at the surface, acting as biorecognition element. Among these, we mostly find
antibodies but we mentioned earlier a new class of ligands, called aptamers, composed of
synthetic single-stranded nucleic acids or peptides presenting a high affinity for proteins has
emerged. Peptide ligands were initially developed as research tools to dissect protein function
within complex molecular regulatory networks [41, 40]. Their ability to bind the target protein
with high affinity and specificity, and their smaller size compared to antibodies makes them
powerful alternatives for the detection of proteins. Besides a good selectivity, a sensor has to
offer a high sensitivity. In this context, electrochemical methods are often considered.
Therefore, we will focus on the detection of biomolecules through the elaboration of
electrochemical peptide-based sensors. As mentioned previously, two approaches of
electrochemical detection can be considered, a label-based detection and a label-free detection.
In the two following sections, we will present a state of the art of the studies dealing with label-
based and label-free electrochemical peptide-based sensors.
Page 28
Chapter1 Introduction
12
1.4.1 Label-based electrochemical detection
The label-based detection, which is the most widely used, consists in the modification of
the probe or the target protein via the attachment of a redox centre aimed at providing a binding-
sensitive electrochemical signal. The covalent linkage of a redox group to the probe extremity
is one of the common transduction means considered.
Practically, the electrochemical response of the probe-modified electrode, which can be a
current, as in cyclic voltammetry, differential pulse voltammetry or square wave voltammetry,
or a charge transfer resistance for impedance spectroscopy, is recorded in the absence of the
target protein. Afterwards, upon interaction with the target protein, a “conformational change”
induces a variation in the electron transfer rate between the redox group and the electrode,
resulting in a modification of the electrochemical signal. Both positive (current increase) and
negative (current decrease) variations have been reported. This probably arises from the fact
that the monitored signal is a differential one and is therefore very sensitive to the structure of
the peptide-modified electrode.
Gerasimov and Lai developed an electrochemical peptide-based sensing platform for the
detection of HIV anti-p24 antibodies based on the use of methylene blue (MB) as a reporter of
the interaction [84, 85]. They immobilised an antigenic epitope from the HIV-1 capsid protein,
p24, with the sequence EAAEWDRVHP, modified at the N-terminus with an 11-carbon thiol
to allow the anchoring on the gold substrate and at the C-terminus with an MB redox label via
the side chain of an added lysine residue. The redox signal was measured by AC voltammetry.
Upon binding with the target, a suppression of the electron transfer rate to the methylene blue
reporter is observed. Figure 1-6 illustrates this approach.
Page 29
Chapter1 Introduction
13
(A)
(B)
Figure 1-6: (A) Illustration of the labelled electrochemical peptide-based sensing approach
developed by Gerasimov and Lai. (B) AC Voltammograms for the electrochemical peptide
based sensor in the presence of various concentrations of anti-p24 antibodies and calibration
curve showing the percentage of change in signal with increasing the target concentration [84,
85].
Two hypothesis explaining this change in the electron transfer have been formulated. While the
first one assumed that the dynamics of the probe was modified upon binding, lowering the rate
at which the redox label collides with the surface, the second explored the possibility of an
envelopment of the label by the HIV-p24 antibodies, obstructing the electron transfer process.
Li R. et al. also developed a peptide-based sensor, as shown on Figure 1-7, relying on the
electron transfer from a ferrocene (Fc) moiety attached on the peptide probe for the detection
of epidermal growth factor receptor (EGFR) [86]. The immobilised 12-mer Fc-modified ligand
shows a voltammetric signal due to the one-step reduction of the ferrocenyl group. Upon
recognition with EGFR, an enhanced signal is detected. The amplitude of the current increases
and presents a linear relationship with the logarithm of EGFR concentration. Li H. et al. used a
similar approach for the detection of amyloid 1-42 soluble oligomers although a “signal off”
was recorded [87].
Page 30
Chapter1 Introduction
14
(A)
(B)
Figure 1-7: (A) Illustration of the electrochemical peptide-based sensor for EGFR developed
by Li et al. (B) Evolution of the current of the modified electrode incubated with increasing
concentrations of EGFR (10-10 g L-1 to 10-6 g L-1) [86].
Puiu et al. reported on a modular electrochemical peptide-based sensor for the detection of
anti-deamidated gliadin peptide (DGP) antibody [88]. The immobilisation of a short helical
support peptide on the surface of a gold electrode is followed by its labelling with a methylene
blue redox marker. The tagged support peptide is further modified with a recognition peptide,
an alpha-2 deamidated gliadin peptide (DGP), a 33-mer peptide containing the residues 56-88
of alpha gliadin from gluten. It has been shown that relatively low surface densities of support
peptide allowed the achievement of a highest labelling yield. The recognition of the target, the
anti-DGP IgG monoclonal antibody, leads to a signal decrease. Indeed, the electrochemical
signal recorded in the absence of the target antibody is due to electron transfer through the
support peptide and through a collisional mechanism due to the relative flexibility of the support
peptide that allows the MB to collide to the surface and transfer electrons with good efficiency
[89]. Upon recognition the flexibility of the anchored entity and the electron transfer are
modified, suppressing the signal. Figure 1-8 presents this strategy.
Page 31
Chapter1 Introduction
15
Figure 1-8: Illustration of the principle of the peptide-based sensor developed by Puiu et al.
[88].
Sugawara et al. based their sensor for ovalbumin detection on a peptide involved in the
lysozyme [90]. They immobilised, on a glassy carbon electrode, the peptide corresponding on
the amino acids 112 to 123 on the C-terminal side of lysozyme which selectively combines with
ovalbumin. An electroactive label, the daunomycin, was introduced as reporter at the N-
terminal side of the peptide, using a cross-linking reagent, the ethylene
glycobis(sulfosuccinimidyl)succinate. Using the oxidation wave of daunomycin, they observed
a decrease in the electrode response as the concentration of ovalbumin increased.
Page 32
Chapter1 Introduction
16
1.4.2 Label-free electrochemical detection
In a label-free detection method, no modifications of the target or the probe, aimed at
providing an electrochemical response, are involved. However, with the notable exception of
double layer capacitance measurements, the addition of a redox active molecules is needed.
The most popular redox marker is the ferri/ferrocyanide redox couple [Fe(CN)6]3-/4- [26-28] .
The apparent electron transfer rate of the redox couple is strongly dependent on the accessibility
of the redox molecule to the electrode surface. Therefore, upon modification of the interface by
binding of the target protein to the probe, a variation of the electrochemical signal is recorded.
Among the different electrochemical methods which can be used to measure the modification
of the electron transfer rate, impedance spectroscopy, from which the electron transfer
resistance is easily extracted, is generally selected. Depending on how the binding affects the
charge of the modified electrode and its accessibility, the rate constant can increase or decrease.
Estrela et al. achieved a label-free detection of protein interactions with peptide aptamers
with and without addition of a redox marker [91]. They were able to monitor the protein
detection both by open circuit potential measurements in absence of redox marker and, by
following variations of the charge transfer resistance by means of electrochemical impedance
spectroscopy in the presence of [Fe(CN)6]3-/4-. Figure 1-9 presents some of the data obtained.
They used peptide aptamers, recognising specific protein partners of the cyclin-dependent
kinase (CDK) family, co-immobilised with PEG as a backfiller.
Figure 1-9: OCP measurements in 100 mM PB - pH 7.4(-150 to -200 mV vs Hg|Hg2SO4) and
EIS signal obtained in 100 mM PB - pH 7.2 in the presence of 10 mM [Fe(CN)6]3-/4- 1/1
(Frequency range: 10 kHz to 100 mHz; Edc= 195 mV vs Hg|Hg2SO4) for the detection of
rCDK2 based on the elaboration of a peptide aptamer based sensor [91].
Page 33
Chapter1 Introduction
17
It can be seen on Figure 1-9 (left) that upon injection of rCDK2, the OCP follows a binding
curve attributed to the interaction of the protein with the aptamer. Upon rinsing, non-
specifically bound rCDK2 is removed from the surface and the OCP follows a dissociation
curve reaching a stable value. Looking at the impedance data (right), an increase of 40 % of the
charge transfer resistance is observed upon interaction. This rise is probably due to a combined
effect of a larger amount of negative charges in the biolayer and further blocking of the surface
hindering the redox process.
Miao et al. elaborated an electrochemical peptide-based sensor to evaluate apoptosis. The
peptide probe was designed to contain the sequence recognising externalized
phosphatidylserine (PS) on apoptotic cells and capture them on the surface of the gold substrate
[92]. Indeed, upon apoptosis, PS translocates from the inner layer of the cell membrane to the
outer layer. The selected peptide probe was based on the original sequence of the PS-binding
site in PS decarboxylase and was co-immobilised with MCH as a backfiller. Figure 1-10
outlines the principle of the sensing mechanism for the apoptosis evaluation.
Figure 1-10: Illustration of the peptide-based approach for apoptosis evaluation developed by
Miao et al. [92].
The incubation of the peptide-modified gold electrode in H2O2-treated cells allowed the capture
of apoptotic cells through specific recognition of the peptide and externalized PS on the cell
membrane. Differential pulse voltammetry measurements were carried in the presence of the
redox couple [Fe(CN)6]3-/4-. Before recognition, the positively charged peptide electrostatically
interacts with the negatively charged redox couple [Fe(CN)6]3-/4- and a large signal is recorded.
Once the apoptotic cells have been captured, the positive charges of the peptide can be hidden
Page 34
Chapter1 Introduction
18
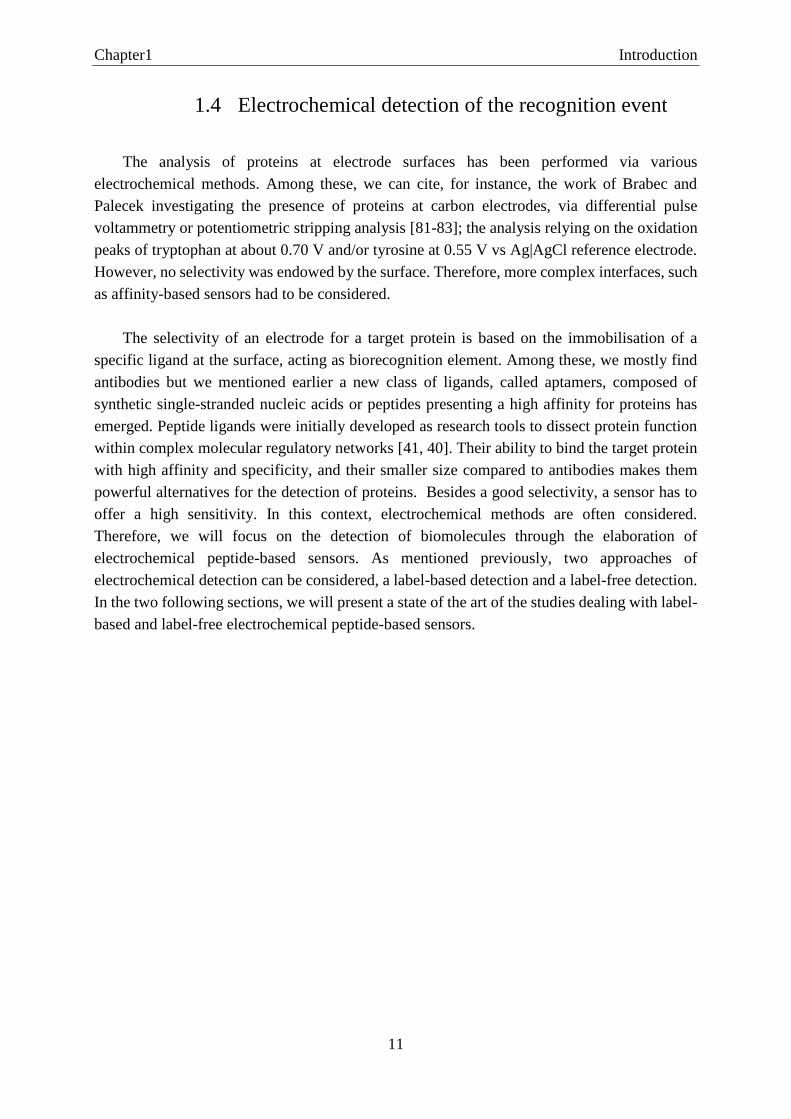
and a drop of the electrochemical signal is observed. Experimental results indicated that a
higher level of H2O2 induced a higher number of apoptotic cells. Figure 1-11 presents the results
obtained.
Figure 1-11: (A) Differential pulse voltammograms for apoptosis evaluation. The top line
corresponds to the peptide modified electrode whereas the other curves are recorded after
incubated with cells previously treated with H2O2 (0, 25, 50, 80, 100 μM from top to bottom)
(B) Calibration plot of the modified electrode incubated with increasing concentrations of
H2O2 [92].
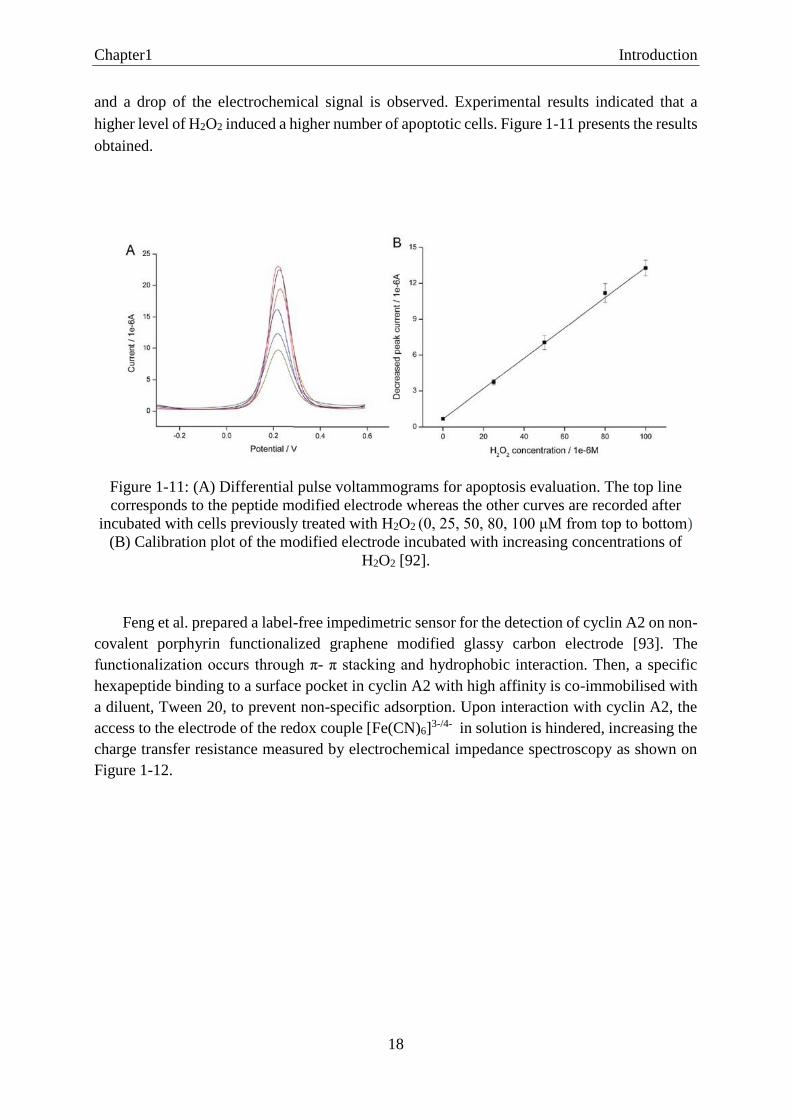
Feng et al. prepared a label-free impedimetric sensor for the detection of cyclin A2 on non-
covalent porphyrin functionalized graphene modified glassy carbon electrode [93]. The
functionalization occurs through π- π stacking and hydrophobic interaction. Then, a specific
hexapeptide binding to a surface pocket in cyclin A2 with high affinity is co-immobilised with
a diluent, Tween 20, to prevent non-specific adsorption. Upon interaction with cyclin A2, the
access to the electrode of the redox couple [Fe(CN)6]3-/4- in solution is hindered, increasing the
charge transfer resistance measured by electrochemical impedance spectroscopy as shown on
Figure 1-12.
Page 35
Chapter1 Introduction
19
Figure 1-12: Illustration of the impedimetric peptide-based sensing approach developed by
Feng (up) and evolution of the electron transfer of the redox couple [Fe(CN)6]3-/4-for (a) bare
GCE; (b) TCPP/CCG modified GCE; (c) peptide linked to the TCPP/CCG modified GCE; (d)
incubated in Tween 20 solution; (e) after addition 100 nM cyclin A2 protein on the modified
electrode (down) [93].
Kerman et al. elaborated an electrochemical peptide-based sensor for the measurement of
the activity of protein kinase [94]. They immobilised a peptide probe specific for CDK2 via a
lipoic acid-succinimide ester and passivated the surface with PEG to prevent from non-specific
adsorption of protein on the sensor. Adenosine 5’-γ-[ferrocene triphosphate] (Fc-ATP) was
used as a reporter, since it enables the kinase-catalysed transfer of a redox active γ-phosphate-
Fc to a hydroxyamino acid of the immobilised peptide. Immersing the sensor in a solution
containing CDK2 and Fc-ATP into HeLa cell lysates, they managed to follow the
phosphorylation of the immobilised peptide using square wave voltammetry of the surface-
confined Fc molecules. Figure 1-13 illustrates this strategy.
Page 36
Chapter1 Introduction
20
Figure 1-13: Illustration of the peptide-based sensing approach developed by Kerman to
evaluate the activity of protein kinase [94].
Martic et al. proposed an “on chip” detection of sarcoma protein kinase and HIV-1 reverse
transcriptase based on the immobilisation of two distinct peptides on gold [95]. They were able
to simultaneously monitor two separate biochemical events using electrochemistry by both a
label-free and a label-based approach. Their strategy is illustrated on Figure 1-14.
Figure 1-14: Illustration of the dual peptide-based sensor for the detection of sarcoma protein
kinase and HIV 1 reverse transcriptase developed by Martic et al. [95].
Indeed, the detection of the sarcoma protein kinase is based on the same approach as that used
by Kerman et al. using ferrocene-labelled adenosine triphosphate (Fc-ATP) that has been
presented above whereas the detection of HIV 1 reverse transcriptase protein is based on the
Page 37
Chapter1 Introduction
21
modulation of the current density of the immobilised ferrocene-labeled peptide upon binding.
This strategy combines both a “signal on” and a “signal off” detection method.
It is interesting to note that, although label-free approaches have been widely used in DNA or
antibodies-based sensors, very few work has been done, up to now, on peptide-based sensors
compared to labelled approaches.
1.5 Organisation of the biomolecules monolayers
As already mentioned in this work, the stability of the layer and the accessibility of the
probe are key issues in the elaboration of an efficient sensor. Therefore, the organisation of the
monolayers resulting from the adsorption procedure has gained a lot of interest. In the context
of DNA-based sensors, different groups tried to understand the influence of the immobilisation
procedure on the organisation of the biomolecular probe at the electrode surface and more
precisely on the homogeneity of the resulting self-assembled monolayer.
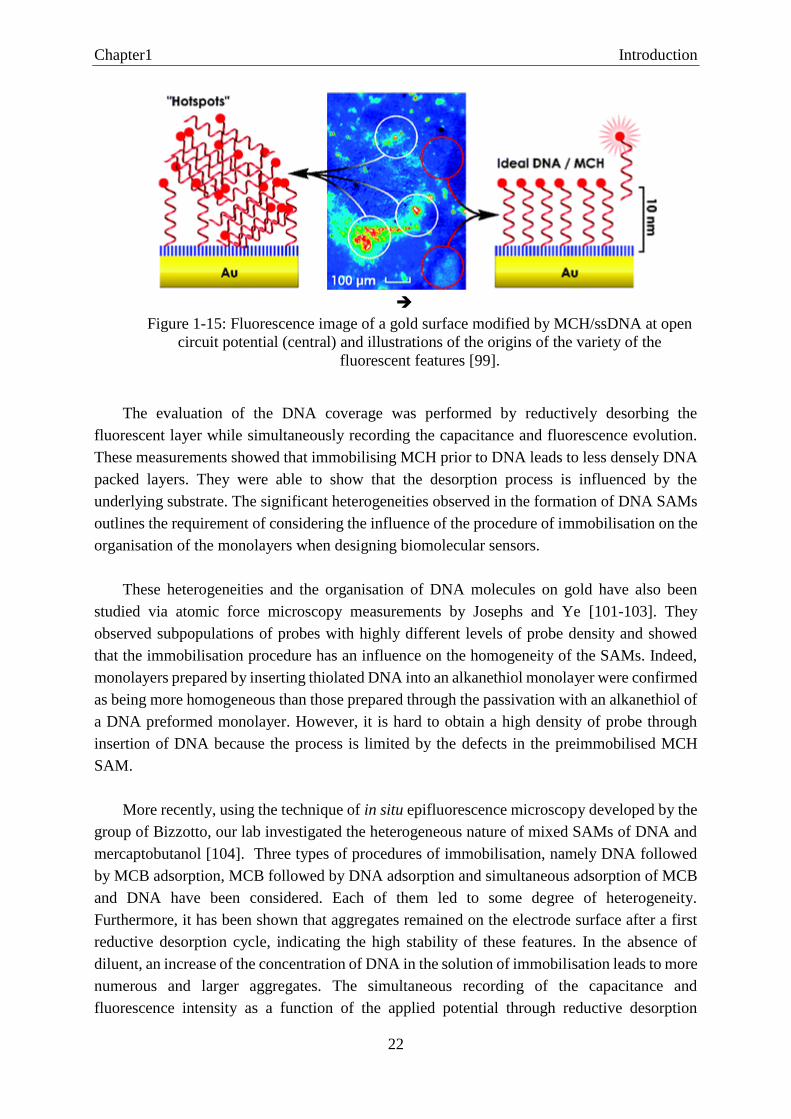
The group of Bizzotto, from the University of British Columbia, studied the organisation
of self-assembled monolayers of various molecules such as alkanethiols, lipids, or DNA
strands, using in situ epifluorescence microscopy under potential control [96-100]. In their work
on DNA, they compared two procedures of immobilisation of mixed SAMs of mercaptohexanol
and fluorescently labelled DNA. The first immobilisation procedure was based on the
traditional Tarlov method where the DNA modified electrode is passivated by MCH
(DNA/MCH SAM). The second immobilisation procedure consisted of the immobilisation of
MCH followed by DNA (MCH/DNA SAM) [99]. Fluorescence images recorded at open circuit
potential showed a non-uniform distribution of fluorescent DNA, with small local areas of high
intensity which suggests a similar heterogeneity in DNA packing density for both
immobilisation procedures although much more homogeneous layers were obtained with the
second procedure. These measurements are based on the non-radiative energy transfer from the
excited dye molecule, attached to the DNA’s top end, to the metal. These brighter areas, named
as “hotspots”, corresponding to 10 to 30 % of the surface in the Tarlov immobilisation
procedure, were explained by the formation of aggregates with a significant amount located far
from the surface, meaning not covalently bound or non-specifically adsorbed. The central image
presented on Figure 1-15 corresponds to a fluorescence image of a gold surface modified by
MCH/ssDNA at open circuit potential and the associated sketches illustrate the presumed
origins of the heterogeneous fluorescent features observed.
Page 38
Chapter1 Introduction
22
Figure 1-15: Fluorescence image of a gold surface modified by MCH/ssDNA at open
circuit potential (central) and illustrations of the origins of the variety of the
fluorescent features [99].
The evaluation of the DNA coverage was performed by reductively desorbing the
fluorescent layer while simultaneously recording the capacitance and fluorescence evolution.
These measurements showed that immobilising MCH prior to DNA leads to less densely DNA
packed layers. They were able to show that the desorption process is influenced by the
underlying substrate. The significant heterogeneities observed in the formation of DNA SAMs
outlines the requirement of considering the influence of the procedure of immobilisation on the
organisation of the monolayers when designing biomolecular sensors.
These heterogeneities and the organisation of DNA molecules on gold have also been
studied via atomic force microscopy measurements by Josephs and Ye [101-103]. They
observed subpopulations of probes with highly different levels of probe density and showed
that the immobilisation procedure has an influence on the homogeneity of the SAMs. Indeed,
monolayers prepared by inserting thiolated DNA into an alkanethiol monolayer were confirmed
as being more homogeneous than those prepared through the passivation with an alkanethiol of
a DNA preformed monolayer. However, it is hard to obtain a high density of probe through
insertion of DNA because the process is limited by the defects in the preimmobilised MCH
SAM.
More recently, using the technique of in situ epifluorescence microscopy developed by the
group of Bizzotto, our lab investigated the heterogeneous nature of mixed SAMs of DNA and
mercaptobutanol [104]. Three types of procedures of immobilisation, namely DNA followed
by MCB adsorption, MCB followed by DNA adsorption and simultaneous adsorption of MCB
and DNA have been considered. Each of them led to some degree of heterogeneity.
Furthermore, it has been shown that aggregates remained on the electrode surface after a first
reductive desorption cycle, indicating the high stability of these features. In the absence of
diluent, an increase of the concentration of DNA in the solution of immobilisation leads to more
numerous and larger aggregates. The simultaneous recording of the capacitance and
fluorescence intensity as a function of the applied potential through reductive desorption
Page 39
Chapter1 Introduction
23
measurements evidenced two successive signal increases which have been correlated to the
substrate crystallinity confirming the observation made by the group of Bizzotto.
Although the major part of these studies focuses on DNA layers, some work has also been
dedicated to the formation of peptide SAMs. While some interactions of the peptides with an
electrode surface, including the ability of sulphur to covalently bind to various metal surfaces
are of major interest since it allows the formation of stable self-assembled monolayers, others,
commonly referred to as “fouling”, are often not desired. In many applications, as medical
implants or biosensors, near-zero fouling monolayers present a high interest. In this context,
many works have been devoted to the immobilisation of peptides allowing ultra-low fouling.
For example, surface plasmon resonance (SPR) measurements realised by Bolduc et al. on 3-
mercaptopropyl-amino acid monolayers have allowed them to characterise the tendency of
serum proteins to non-specifically adsorb on gold according to the composition in amino acids
of the immobilised peptide [51, 105, 106]. They showed that monolayers with polar and ionic
amino acids with the shortest chain length were the most effective in reducing non-specific
adsorption, regardless of the packing of the SAMs. Nowinski et al., also achieved a non-fouling
and packed monolayer through the immobilisation of a peptide formed by alternating negatively
charged glutamic acids and a positively charged lysine attached onto gold through an additional
linker composed of four proline residues and a cysteine residue [107]. Chen et al. also focused
their attention on the ability to form low-fouling peptide surfaces through the immobilisation
of peptides based on glutamic acid, aspartic acid and lysine, either alternated or randomly
mixed. They achieved a high resistance to non-specific protein adsorption (< 0.3 ng cm-2)
comparable to that achieved by poly(ethylene glycol) (PEG)-based materials [108].
Boncheva and Vogel [72], also considered the self-assembly of pure peptide layers which
were either constituted of amphipathic or hydrophobic helices. They were able to control the
orientation of the helices by choosing a particular adsorption procedure. While Langmuir-
Blodgett transferred monolayers were oriented parallel to the gold surface, self-assembled one
were oriented perpendicularly. Selecting the appropriate amino acid sequence, it is possible to
create tailor-made peptide layers of predefined conformation, α-helix or β-strand, orientation
and flexibility. Once a suitable sequence has been chosen, the molecular orientation of the
peptides at the interface may be controlled by mutual interactions between hydrophilic and
hydrophobic neighbouring peptides and the interfacial region, namely, the surface of a solid
support. The direction of the molecule at the surface can be controlled by the choice of a specific
binding group such as sulphur for anchoring on gold or silver. This statement was confirmed
by STM measurements performed by Davis et al. [75]. Using SPR and reflection-absorption
FTIR they were also able to study the molecular density of the peptide layers and their
molecular conformation and orientation on a solid support. They showed the influence of the
interface on the orientation of the polypeptide by comparing the behaviour of peptide
monolayers on water and after LB transfer to a hydrophilic gold surface. At the air/water
interface, both the hydrophobic and amphipathic helices were oriented parallel to the interface.
The absence of re-orientation of the hydrophobic peptide indicates that the conformation and
Page 40
Chapter1 Introduction
24
interfacial orientation of the peptides can be preserved upon LB transfer to the gold substrate.
Upon self-assembly, the hydrophobic peptide adopted a perpendicular orientation whereas the
amphipathic peptide kept its parallel orientation. The facts demonstrate the influence of the
choice of the peptide sequence for molecular orientation. It was also shown that the more
densely packed layers were obtained by self-assembly compared to LB transferred films.
Gatto et al. also studied self-assembled monolayers formed by helical peptides. The use of
Cα-tetrasubstituted amino acids allowed them to obtain rigid helical oligopeptides able to form
densely packed layers [109, 110]. Using helix-helix macrodipole interactions, they were able
to form bicomponent peptide self-assembled monolayers. They showed that antiparallel
conformation of peptide chains minimised the energy of interaction between the helix dipoles,
allowing a stabilisation of the layer. This observation had already been reported by Fujita et al.
[111], who showed that an antiparallel helix packing was significantly more favourable than a
parallel one, suggesting that the SAM structure was regulated by dipolar interactions between
helical peptides. STM and fluorescence measurements showed a rather homogeneous layer
without one-component segregated regions.
Duchesne et al. designed a proximity probe based on chemical cross-linking to evaluate
whether peptides are randomly distributed or if they self-reorganise to form supramolecular
domains [112]. The probe was a peptide-capped gold nanoparticle covered with a binary peptide
SAM composed of a matrix peptide and a longer functional peptide. Two reactive groups able
to cross-link together or with a reactive group of another functional peptide were attached to
each peptide. Depending on the proximity of other peptides, it will form an intramolecular bond
or cross-link to another peptide. The inter vs intramolecular cross-linking allows the evaluation
of the organisation of the peptide on the gold nanoparticle. They were able to show by
comparing experimental results with a probabilistic model that peptides were not randomly
distributed at the surface of the nanoparticle bur rather self-organised into supramolecular
domains.
The effect of the length of the polypeptide on the assembled surface structure and of the
molecular orientation within the self-assembled monolayer have been investigated by Sakurai
et al. on Au (111) via AFM and FT-IR RAS measurements using three polypeptides PLLn-SH,
with n= 4,10, 30.They were able to show that α-helical PLL30-SH formed a homogeneous layer
with a 50° tilt angle towards the substrate whereas PLL4-SH and PLL10-SH formed β-sheet-
type SAMs arranged in small domains [76].
Considering the increasing attention paid to the formation of well-organised and
homogeneous layers, we decided to focus part of this work on the organisation of peptide
monolayers resulting from a series of immobilisation procedures using in situ fluorescence
microscopy.
Page 41
Chapter1 Introduction
25
1.6 Strategy
1.6.1 Presentation of the considered system
1.6.1.1 The p53 tumour suppressor protein and the Murine
Double Minute 2 oncoprotein
The p53 tumour suppressor protein is a transcriptional factor that plays a central role in the
regulation of the cell cycle as it maintains the integrity of the cell by coordinating the cellular
response to DNA damages via cycle arrest, DNA repair or apoptosis [113-116]. This 393 amino
acids protein was identified in 1979 [117-119]. It can bind to specific DNA sequences and
activate gene expression and this activity seems to be central to its function since tumour-
derived mutants are defective in DNA binding. In 50 % of cancer, p53 is inactivated by
mutations or other genomic alterations [120]. In other cancers, p53 is functionally inactivated
by its primary cellular inhibitor, the murine double minute 2 protein (MDM2 or HDM2 in
humans). Loss or malfunction of p53 is thought to contribute to the development of half of all
cancers, including skin, breast and colon cancers.
MDM2 is an oncoprotein which was first evidenced by its overexpression in a
spontaneously transformed mouse cell line [121, 122]. This ubiquitin E3 ligase binds to the N-
terminal transactivation domain of p53 through its N-terminal domain. A ubiquitin E3 ligase is
an enzyme involved in the conjugation of a ubiquitin protein to a substrate in order to promote
its degradation by the proteasome. In tumours, gene amplifications and other alterations can
result in elevated MDM2 and lead to the consecutive inhibition of p53. Amplification of MDM2
has been observed in more than one-third of soft tissue sarcomas and less often in glioblastomas,
leukaemia, oesophageal carcinomas and breast carcinomas [123-129].
The ability of MDM2 to inactivate p53 relies on a direct physical interaction between the
two proteins. The regulation of the levels of MDM2 and p53 in the cell proceeds via a negative
feedback loop where p53 induces MDM2 expression whereas MDM2 represses p53 activity.
This cycle is considered as a central mechanism for modulating p53 activity in normal cells, in
absence of stress. Under normal conditions, low cellular levels of p53 are ensured through
MDM2 ubiquitination and associated degradation. In response to cellular stress, p53
degradation is reduced, and p53 is accumulated in the cell. Once its mission has been completed,
p53 transcriptionally activates the production of MDM2. The E3 ubiquitin ligase will then form
a tight complex with p53 to inhibit its transcriptional activity and promote p53 degradation via
multi-ubiquitination events on multiple p53 lysine residues. Once an appropriate level of p53
is reached in the cell, MDM2 proceeds to an auto-ubiquitination and is sent to the degradation
path. As a result, overexpression of MDM2 results in lower levels of p53, suppressing its
protective tumour activity. Binding of MDM2 to p53 is essential for this effect as the use of
inhibitors revealed that p53 is targeted for degradation by the proteasome. The analysis of
different human cancers in tumour samples indicates that MDM2 is overexpressed in 5 to 10 %
Page 42
Chapter1 Introduction
26
of human cancers [130-133]. Figure 1-16 presents the regulatory feedback cycle governing the
activity of p53 and MDM2.
Figure 1-16: Illustration of the regulatory negative feedback loop of p53 and MDM2 [134].
Other proteins are also involved in the feedback loop as illustrated on Figure 1-16. The
ARF protein (Alternate Reading Frame) binds to MDM2 and prevents degradation of p53 by
inhibiting its ubiquitination. It is also know to inhibit MDM2 degradation. MDMX is a
structural homolog of MDM2. It is able to increase both the levels of MDM2 and p53 through
interaction with them. As homolog, it can compete with MDM2 for binding with p53. Besides,
direct interaction between MDM2 and MDMX might interfere with the E3 activity of MDM2.
The protein TSG 101 (Tumour Susceptibility Gene) interacts with both MDM2 and p53. It
increase the half-time of MDM2 with consequent decrease of p53 level.
As it has been mentioned above, the ability of MDM2 to inactivate p53 relies on a direct
interaction between them. It has been shown that p53 binds to MDM2 via its transactivation
domain. Figure 1-17 presents the location of the structural features of p53 and human MDM2.
Page 43
Chapter1 Introduction
27
Figure 1-17: Structural features of p53 and human MDM2 (NLS: nuclear localized sequence,
NES: nuclear export sequence) [134].
1.6.1.2 Formation of the MDM2-p53 complex
Many studies have been dedicated to the identification of the structure of MDM2 and p53
and to the understanding of the formation of the MDM2-p53 complex [135-144]. A
combination of deletion and mutation analyses preformed on p53 and MDM2 allowed the
determination of the approximate boundaries of the interacting regions of the two proteins[145-
147]. A highly conserved (71 to 91 % across 5 species) 12 kDa structural domain, extending
from residues 17 to 125, has been evidenced at the NH2-terminal portion of MDM2. This region
has been shown as necessary and sufficient to bind to p53 and is assumed to contain the p53
binding site. For p53, MDM2 binding has been evidenced as being dependent on a short linear
sequence of 11 amino acids, extending from residues 17 to 26. This region is also highly
conserved and is responsible for transactivation. Kussie et al. resolved the structure of the
complex [137].
Upon interaction, the MDM2 N-terminal domain forms a twisted trough, presenting a cleft
of about 25 Å long, 10 Å wide and 10 Å deep, lined with hydrophobic amino acids. The sides
of the cleft are formed by two helices whereas two shorter helices constitute the bottom. A pair
of three-stranded β sheets cover each end. Figure 1-19 illustrates the formation of the cleft.
When the p53 interaction sequence approaches MDM2, it forms an amphipathic α helix of about
2.5 turns, followed by 3 residues. The interaction of this α helix of p53 with the hydrophobic
cleft of MDM2 constitutes the primary contact.
Page 44
Chapter1 Introduction
28
Figure 1-18: Diagram of the secondary structure elements constituting the MDM2 cleft [137].
Three amino acids of the p53 peptide are essential for the interaction. This invariant triad
across species is composed of the hydrophobic and aromatic amino acids Phe19, Trp23 and Leu26
which insert into the MDM2 cleft. The interaction mainly relies on van der Waals and steric
complementarity between the MDM2 cleft and the hydrophobic face of p53 helix since only
two hydrogen bonds stabilise the complex. Figure 1-19 illustrates the p53-MDM2 complex.
Figure 1-19: Structure of the p53 peptide (yellow) and MDM2 cleft (blue) complex [137].
.
Page 45
Chapter1 Introduction
29
1.6.1.3 Electrochemical sensing of MDM2
The negative regulator role played by MDM2 against the tumour suppressor protein p53
and the resulting loss of activity of p53 in case of overexpression of MDM2, makes MDM2 an
interesting prognostic tool in many human tumours [148, 149]. MDM2 overexpression is
supposed to increase the risk of distant metastasis, inducing a worse prognostic for the patient
[124, 150, 151]. In many cell lines and in several tumour samples, it has been shown that
overexpression of MDM2 can be correlated with a decreased response to both chemotherapy
and radiotherapy. A simple explanation of the inhibition of therapeutic benefits of cytotoxic
drugs and radiation has been found in the degradation role of MDM2 towards p53. Indeed, p53
is up-regulated by DNA-damaging agents, like chemotherapy and radiation, therefore the level
of MDM2 increases as a result of its role in feedback control. The degradation of p53 increases,
thus preventing cell cycle arrest and apoptosis.
Different detection strategies of the MDM2 protein have already been considered, such as
immunohistochemistry which involves the labelling of proteins in a tissue sample with enzymes
or with fluorescent tags, fluorescence in situ hybridisation on tumour tissue, using a fluorescent
labelling of specific DNA sequences or chromosomes in a tissue sample to identify gene
mutations or deletions [152-154]. More recently, the elaboration of electrochemical MDM2
sensors has been reported [155, 156].
The group of Zourob has elaborated a label-free impedimetric immunosensor for the
detection of MDM2 in brain tissue [155]. The detection implies the formation of a cysteamine
self-assembled monolayer on gold, further functionalised with MDM2 antibody using a
homobifunctional 1,4-phenylene diisothiocyanate linker. The recognition event was followed
by electrochemical impedance spectroscopy in the presence of [Fe(CN)6]3-/4-. Upon recognition,
the charge transfer resistance gradually increases with the concentration of MDM2 indicating
that the binding of MDM2 to the antibody-modified electrode blocks the electron transfer
between the redox probe and the electrode surface. A detection limit of 0.29 pg mL-1 was
reached. Figure 1-20 illustrates their approach and obtained data.
Page 46
Chapter1 Introduction
30
Figure 1-20: Top: Immobilisation steps for the fabrication of the MDM2 immunosensor
developed by Zourob et al. Bottom: Evolution of the charge transfer resistance as a function
of the concentration of MDM2 [155].
Li et al. also prepared an electrochemical sensor for the detection of MDM2 but with a
rather different approach [156]. They used a peptide, selected by combinatorial screening
(MUA-TSFAEYWNLLSP), able to bind to a low molecular weight probe. This molecule,
designed as an initiator of a signal amplification process, more precisely a photo-catalyst, binds
the peptide without interfering in the protein-peptide binding affinity. Their strategy is
illustrated at Figure 1-21.
Page 47
Chapter1 Introduction
31
Figure 1-21: Illustration of the principle of the electrochemical immunosensor for the protein
MDM2 developed by Li et al. [156].
Initially, the complex probe selectively binds the MDM2-free peptides immobilised on a gold
substrate via host-guest interaction with the aromatic side chain of the peptide. Under potential
control, the photo-catalytic probe is released in solution and, under UV excitation, catalyses the
cleavage of a dsDNA immobilised on a second gold electrode via the generation of hydroxyl
free radicals. The binding of the target protein can then be quantified via the remainder of
dsDNA immobilised on the second electrode after photo-cleavage using methylene blue as
redox marker. Indeed, as the amount of dsDNA initially immobilised is fixed, and as the
amount of probes bound with the MDM2-free peptides is inversely proportional to the amount
of MDM2, the amount of remaining dsDNA after cleavage is proportional to the amount of
MDM2. Figure 1-22 illustrates square wave voltammetry data obtained at the dsDNA modified
electrode for the measurement of MDM2 concentration.
Page 48
Chapter1 Introduction
32
Figure 1-22: Evolution of the current as a function of the concentration in MDM2 [156].
These two electrochemical approaches of detection of the protein MDM2 are the only
reported to date. However, both methods are very complex and require many steps to achieve
detection. In this work, we will present a simpler electrochemical procedure relying on the
direct immobilisation of a peptide probe on a gold electrode. The selection of the sequence is
based on the sequence of interaction of the protein p53 with MDM2. The recognition event will
be detect by electrochemical impedance spectroscopy in the presence of the redox marker
[Fe(CN)6]3-/4.
1.6.2 Choice of the electrode material
This study has been performed on a polycrystalline gold electrode. The ideally polarisable
domain of the gold | aqueous solution system is limited by the reduction of the protons from the
solution at negative potentials and by the oxidation of gold at positive potentials. Due to its
wide electrochemical window, over 1 volt, gold is a model for the study of adsorption processes.
Furthermore, obtaining reproducible surfaces free from impurities, an essential criterion in the
study of these processes, can easily be achieved with gold as the stability of the electrode allows
it to be flamed and/or electrochemically cleaned in solution [157, 158].
Another interesting aspect of gold is its ability to bind thiols with high affinity in order to form
self-assembled monolayers [54]. Furthermore, it does not undergo any unusual reactions with
thiols namely the formation of a substitutional sulfide interface as it can be observed on
palladium [64]. The high affinity of thiols for gold also allows the displacement of non-
specifically adsorbed species. Finally, since gold is one of the most studied substrate for the
formation of self-assembled monolayer, it will allows us to confront our results with literature.
Page 49
Chapter1 Introduction
33
1.6.3 Selection of the sequence
The peptide aptamer sequence, selected for this study, is based on the transactivation
domain of the p53 tumour suppressor protein and, is composed of the amino acids 12 to 26
containing the catalytic triad Phe19, Trp23 and Leu26 which, as presented earlier, are essential in
the interaction with the oncoprotein MDM2. Schon et al. investigated the kinetics and
thermodynamics of the p53-MDM2 interaction using a set of peptides based on residues 15-29
of p53 to understand the influence of the modification of the amino acids sequence on the
binding [159]. They investigated the effect of the peptide length as well as natural and non-
natural amino acid substitutions to define the specific amino acids residues required for the
interaction.
They showed that p53(15-29) binds MDM2 with a dissociation constant of 580 nM. By
modifying the 15-29 residue sequence they evidenced the influence of these changes on the
binding efficiency. For instance, a 13-fold increased affinity was observed for the p53(17-26)
sequence whereas further truncation to residues 19-26 supressed binding. Some explanation can
be found in the mechanism of phosphorylation of the transactivation domain of p53 which is
known to regulate the MDM2-p53 interaction. Indeed, phosphorylation at S15, T18 and S20 is
thought to disrupt the interaction of p53 with MDM2. Therefore they evaluated the impact of
phosphorylation of T18, a highly conserved residue particularly in mammalian p53 and
evidenced a weakened binding to Mdm2 by about an order of magnitude. Although this residue
does not directly interact with MDM2, its substitution showed its importance for binding. As a
matter of fact a radical change in the peptide-binding behaviour was monitored when T18 was
deleted. Truncation of T18 completely abolished the binding. From these observation, Schon et
al., reached the conclusion that truncation at residue T18 might represent the minimal peptide
length for MDM2 binding. As a matter of fact, the minimal length for a tight-binding peptide
was reached with p53(18-26) that presented a dissociation constant of 70 nM. Furthermore,
following Kussie et al., T18 is involved in the formation of an intramolecular hydrogen bond
with D21 by stabilizing it in the α-helical conformation [137]. The importance of this residue
is supported by the fact that phosphorylation of S15 and S20 did not affect binding.
They also showed that shorter p53-derived peptides present tighter binding. The peptide
p53(17-26) binds MDM2 ten times more tightly (Kd=46 nM) than the wild type p53(15-29)
(580 nM).
From the considerations above, a probe composed of the amino acid residues 12-26 has
been selected in this work. The truncation at residue 26 has been chosen from the higher binding
constant obtained by Schon et al. for shorter peptides. Residues 12 to 16 have been retained to
keep the residues 17-26 away from the electrode surface, enabling a better accessibility of the
target during the recognition process. Although this three amino acids elongation might reduce
the binding constant compared to the p53(15-29), we don’t expect it to suppress the affinity.
Page 50
Chapter1 Introduction
34
For immobilisation purpose, the sequence has been modified by a cysteine residue at the N-
terminal to allow the formation of a Au-S covalent bond with the substrate.
1.6.4 Working plan
In a first part of this thesis, we propose a label-free detection method of the protein MDM2
relying on the immobilisation of an aptamer of the protein p53 on gold. This method is based
on electrochemical impedance spectroscopy measurements in the presence of the redox couple
[Fe(CN)6]3-/4-. Negative controls will be considered in order to assess the selectivity and
specificity of the sensor whereas quartz crystal microbalance measurements will be used to
validate the electrochemical signal as originating from the interaction between the target and
the probe.
The sensor performances directly depend on the monolayer properties. It is, therefore,
essential to obtain a detailed characterisation of the monolayer. For this purpose, we will, as a
second part of this thesis, focus on the formation and characterisation of the peptide-based
recognition layer alone or co-assembled with 4-mercaptobutan-1-ol, immobilised on gold
electrodes via self-assembly. A first, a standard electrochemical characterisation, in the
presence and absence of redox markers, of the various films formed has been performed,
allowing a preliminary study of the influence of the immobilisation procedure on the resulting
layer. A close collaboration with Professor Bizzotto from the University of British Columbia,
allowed us to implement, at the Université Libre de Bruxelles, a unique in situ epifluorescence
microscopy technique, he had elaborated. This implementation has been performed, thanks to
the access to an epifluorescence microscope located in the laboratory of Professor Michele
Sferrazza, of the Physics Department, at ULB. This technique, based on the simultaneous record
of electrochemical data and fluorescence images, in a specifically designed electrochemical
cell, will allow us to obtain a localised information of the organisation of our peptide layers.
This information constitute a very interesting complement to electrochemical data, which only
gives us an average information of what is happening on the surface. Atomic Force Microscopy
measurements performed in collaboration with Dr Philippe Leclère, from the Université de
Mons, will complete the characterisation of the organisation of the layers achieved through self-
assembly.
Page 51
Chapter 2 Experimental
35
Chapter 2. Experimental
2.1 Electrochemical techniques
2.1.1 The electrochemical cell
Electrochemical experiments are performed in a three-electrode cell at room temperature.
Data are recorded using an Autolab PGSTAT30 (Eco Chemie, The Netherlands) potentiostat
controlled by GPES 4.9, FRA 4.9 or NOVA software.
Prior to every measurement, supporting electrolytes are purged with nitrogen for at least 15
minutes to remove any trace of oxygen which can easily be reduced under polarization and
might interfere with electrochemical measurements. During measurements, the solutions are
kept under nitrogen to prevent dissolution of oxygen from the atmosphere.
The electrochemical cell, shown on Figure 2-1 is equipped with a Teflon lid with five openings
allowing the introduction of the electrodes, the nitrogen stream and the addition of a reagent
during the experiment if necessary.
Page 52
Chapter 2 Experimental
36
Figure 2-1: Representation of the three-electrode cell used for the electrochemical
measurements.
The working electrode are polycrystalline gold disks with a 1.6 mm diameter from BASI
(Bioanalytical Systems, USA). As adsorption processes at the electrode|solution interface
depend both on the electrode nature and on the surface cleanliness, it is of main importance to
characterise the electrode before any subsequent manipulation. Prior to every measurement set,
the polycrystalline gold electrode surface was polished with 1.0 µm alumina-water slurry on a
smooth polishing cloth (Struers), sonicated for 2 minutes and rinsed thoroughly with Milli-Q
water. Then, the electrode was electrochemically cleaned by cycling the potential
between -0.3 V and +1.5 V in 0.1 M HClO4 solution at a scan rate of 50 mV.s-1 until
reproducible cyclic voltammograms were recorded. Figure 2-2 presents a typical
characterisation curve of gold allowing to evaluate the quality of the substrate (black curve).
Page 53
Chapter 2 Experimental
37
-0.4 -0.2 0.0 0.2 0.4 0.6 0.8 1.0 1.2 1.4 1.6-14
-12
-10
-8
-6
-4
-2
0
2
4
i /
µA
E vs Ag|AgCl / V
Figure 2-2 : Cyclic voltammograms of a polycrystalline gold electrode in 0.1 M HClO4
starting from -0.3 V until +1.40 V ( ) and +1.50 V ( ); υ=50 mV s-1.
On the forward scan, while sweeping to more positive potentials, the oxidation of the gold
electrode to the state Au (III) results in an intense peak around +1.1 V followed by a lower
intensity. The reduction of the gold oxides occurs on the backward scan and is evidenced by an
intense peak at +0.9 V. Comparing the experimental voltammograms to those found in literature
witnesses the quality of the substrate [157, 158].
The roughness of the electrode has been taken into account by normalising every
electrochemical data to the real electrode area. It has been estimated based on the gold
voltammograms recorded to +1.4 V, potential at which a monolayer of gold oxide is assumed
to be formed. The cathodic charge associated with the reduction of a monolayer of oxide is
estimated at 400 µC cm-2 [160]. After characterisation, the gold electrode was rinsed with Milli-
Q water and dried under a nitrogen stream.
The counter electrode, consisting in a large area platinum grid, was cleaned by heating in
a flame to red glow. The reference electrode was a Ag|AgCl|sat. KCl (XR 300 from Radiometer
or 6.0726.110 from Metrohm). In this work, all potentials are referred to this reference
electrode.
Page 54
Chapter 2 Experimental
38
2.1.2 Cyclic voltammetry
Voltammetry is commonly employed for the study of electrode processes such as electron
transfer or adsorption phenomena. This electrochemical method, based on the measure of the
current resulting from the application of a potential at the working electrode, may provide
qualitative and quantitative information on the analyte.
More particularly, in the case of cyclic voltammetry, the applied potential varies linearly
between two chosen limits, E1 and E2. The potential program, called triangular in cyclic
voltammetry, is characterised by a scan rate υ = dE/dt. Figure 2-3 shows the potential profile
as a function of time. Consecutive scans can be performed and the resulting current is plotted
as a function of the applied potential.
Figure 2-3: Profile of the applied potential as a function of time in cyclic voltammetry.
In cyclic voltammetry, the measured current is always the sum of two contributions of different
nature. The first is the faradaic current, IF, originating from oxidation and reduction reactions,
which follows Faraday’s law. The second is the capacitive current, IC, related to the presence
of an electric double layer at the electrode|solution interface.
𝐼 = 𝐼𝐹 + 𝐼𝐶 (2.1)
with,
𝐼𝐹 =𝑑𝑄𝑓
𝑑𝑡 (2.2)
and
𝐼𝐶 = 𝐶𝜐 (2.3)
Page 55
Chapter 2 Experimental
39
where I is the total current measured, QF the faradaic charge, t the time, C the double layer
capacitance assumed to be constant and υ the scan rate.
The scan rate is an important parameter in cyclic voltammetry. Indeed, equation 2.3 indicates
that the capacitive current is proportional to the scan rate. Besides, the faradaic current also
depends on this parameter.
For a redox couple exhibiting fast electron transfer kinetics (“reversible”) in solution and under
a semi-infinite linear diffusion of the electroactive species to the electrode surface, the peak
current Ip at 25 °C is given by:
𝐼𝑝 = 2.69 × 10⁵𝑛3/2𝐴 𝐷1/2𝑐∞𝜐1/2 (2.4)
with Ip the peak current (A), n the number of electron transferred, A the area of the electrode
(cm2), D the diffusion coefficient of the electroactive species (cm2 s-1), c∞ its bulk concentration
(mol cm-3) and υ the scan rate (V s-1).
Figure 2-4 presents a cyclic voltammogram for a reversible process O + e- R when initially
only O is present in solution.
Figure 2-4: Cyclic voltammogram for a reversible process O + e- R when initially only O is
present in solution [161].
For a reversible process, the difference between the potential of the anodic and cathodic peaks
at 25° C is given by:
∆𝐸𝑝 = 𝐸𝑝𝐴 − 𝐸𝑝
𝐶 = 2.303 𝑅𝑇
𝑛𝐹=
59
𝑛 𝑚𝑉 (2.5)
Page 56
Chapter 2 Experimental
40
where 𝐸𝑝𝐴and𝐸𝑝
𝐶 are respectively the anodic and cathodic peak potentials.
For an irreversible system at 25 °C:
𝐼𝑝 = 2.99 × 10⁵𝑛3/2𝛼1/2𝐴𝐷1/2𝑐∞𝜐1/2 (2.6)
where α is the transfer coefficient (0<α<1), the other terms are the same as in equation 2.4.
In the case of a reversible process where the electroactive species are adsorbed at the electrode,
the peak current is given by:
𝐼𝑝 =
𝑛2𝐹2
4𝑅𝑇𝐴 Γ 𝜐 (2.7)
where Γ is the surface concentration of adsorbed species.
Figure 2-5 presents a cyclic voltammogram for reduction and subsequent reoxidation of an
adsorbed species O.
Figure 2-5 : Cyclic voltammogram for reduction and subsequent reoxidation of an adsorbed
species O. Current is given in normalized form and the potential axis is shown for 25°C [162].
For an irreversible process, the peak current observed for adsorbed electroactive species is
given by:
𝐼𝑝 =
𝛼𝐹2
2.718 𝑅𝑇𝐴 Γ 𝜐
(2.8)
Page 57
Chapter 2 Experimental
41
According to the dependence of the peak current on the scan rate, it is possible to discriminate
whether an electron transfer process is controlled by the adsorption or diffusion of the
electroactive species. Indeed, one can note that, when the redox process is controlled by
diffusion, the intensity of the peak current evolves as a function of the square root of the scan
rate whereas a control by adsorption induces a linear dependence on the scan rate.
Page 58
Chapter 2 Experimental
42
2.1.3 Chronoamperometry and chronocoulometry
Chronoamperometry consists in the application of a potential step from an initial value E1,
generally being in a region where no faradaic reaction occurs, to a final value E2 chosen in a
region where the process of interest takes place. The relaxation of the system following the
potential perturbation is recorded as a measure of the current I(t) versus time during a defined
time period.
The integration of the I(t) curve over time provides the charge Q(t) as a function of time. The
integrated analogue of chronoamperometry is chronocoulometry. In some cases, relevant to the
present work, it offers the advantage of a better separation of the contributions, originating from
the electric double layer and, the faradaic responses involving adsorbed or diffusing species.
Figure 2-6 presents the profile of the imposed potential jump (a) and the associated responses
in current (b) and in charge (c).
Figure 2-6: (a) Potential progamming in chronoamperometry; (b) corresponding current
transient curve; (c) charge transient curve resulting from the integration of the current
transient.
The data presented in this work result from chronoamperometry measurements. The charge has
been obtained by subsequent integration.
Page 59
Chapter 2 Experimental
43
2.1.4 Electrochemical Impedance Spectroscopy
The electrochemical techniques described previously, impose relatively large perturbations
to the system, either via a potential sweep or a potential step, to study the reactions occurring
at the electrode surface.
Electrochemical Impedance Spectroscopy is based on a different approach. An alternating
potential (ac) of small amplitude, Eac, is superimposed to the dc potential, E, applied at the
working electrode. The resulting alternating current is then followed, at a fixed potential E, as
a function of the frequency of the ac perturbation [163].
The alternating potential is expressed by:
𝑒𝑎𝑐 = 𝐸𝑎𝑐sin (𝜔𝑡) (2.9)
The alternating current is given by:
𝑖𝑎𝑐 = 𝐼𝑎𝑐sin (𝜔𝑡 + 𝜙) (2.10)
where ω=2πf is the angular frequency, f is the frequency expressed in Hz and Φ is the phase
angle.
The alternating current and potential can be represented as separated phasors, �̇� and 𝐼,̇ rotating
at the same frequency as shown on Figure 2-7.
Figure 2-7 : Phasor diagram showing the relationship between alternating current and voltage
signals at frequency ω [162].
Page 60
Chapter 2 Experimental
44
The two separate phasors, �̇� and 𝐼,̇ are generally not in phase and are separated by a phase angle
Φ. �̇� is usually taken as a reference signal and Φ is measured with respect to it. This latter is
constant since the relationship between two phasors remains constant as they rotate at the same
frequency. Therefore, phasors are usually plotted as vectors having a common origin and
separated by the appropriate angle.
The alternating voltage and current phasors are linked by the general equation:
�̇� = 𝐼�̇� (2.11)
where Z is the impedance of the system which can be represented in the complex notation by:
𝑍 = 𝑍′ − 𝑖𝑍′′ (2.12)
where Z’ and Z’’ are the real and imaginary parts of the impedance. The magnitude of the
impedance, |Z| is given by:
|𝑍|2 = (𝑍′)2 + (𝑍′′)2 (2.13)
and the phase angle Φ is given by:
𝜙 = 𝑡𝑎𝑛−1 (
𝑍′′
𝑍′) (2.14)
The variation of the impedance of a system as a function of the perturbation frequency can be
represented in different ways. The most commonly used representation is the Nyquist plot
displaying Z’ as a function of -Z’’ for different frequencies. Another frequently used
representation is the Bode plot presenting both log|Z| and Φ as a function of log f.
Equivalent circuits are used to model electrochemical systems in order to extract a
maximum of information on the electrode processes. They are composed of a combination of
resistances and capacitors or other components allowing to explain the observed phenomena
(Warburg impedance, Constant Phase Element, inductance,…).
A frequently used circuit is the Randles equivalent circuit presented on Figure 2-8. It models
interfacial electrochemical reactions with a semi-infinite linear diffusion of electroactive
species at electrodes.
Page 61
Chapter 2 Experimental
45
Figure 2-8: Randles equivalent circuit.
The resistance Rs is associated with the resistance of the solution, Cdl with the double layer
capacitance, Rct is the charge transfer resistance and ZW is the Warburg impedance. Depending
on the system, variations of the circuit can be observed such as the replacement of the double
layer capacitance by a constant phase element Qdl which will be defined in section 4.1.
Page 62
Chapter 2 Experimental
46
2.2 Quartz Crystal Microbalance
Quartz crystal microbalance (QCM) is a sensitive device able to measure variations in mass
at the electrode surface based on small variations of the resonance frequency of a piezoelectric
crystal. The method is based on the converse piezoelectric effect corresponding to the
occurrence of a mechanical deformation upon application of an external electric field through
a crystal without center of symmetry, the resonator.
The quartz crystal is cut in such a way that a mechanical strain creates a permanent dipole
moment. The application of a periodic perturbation (oscillating electric field), to the edge of the
solid, results in an oscillating elastic deformation. The latter travels through the solid as a
transversal acoustic wave, which is reflected at its ends.
The quartz is a crystal presenting both mechanical, electrical, chemical and thermal properties
allowing a mechanical deformation upon electrical stress. The wave propagation mode depends
on the cut of the crystal. Although a variety of crystals are suitable for quartz crystal
microbalance measurements, AT-cut are the most commonly used. They present a cut angle of
35.25 ° to the z-axis with the advantage that, between 0 and 50 °C, they exhibit a negligible
frequency drift as a function of temperature. As a result, this cut is well-suited for QCM sensing.
When the wavelength of the acoustic wave is twice the thickness of the quartz crystal, the
eigenfrequency is reached. In these conditions, the resonance frequency of the acoustic wave
can be expressed by equation 2.15:
𝑓0 =𝜐𝑄
2𝑡𝑄 (2.15)
with f0 the resonance frequency, υQ the velocity of the sound in the crystal (3.34 × 10⁴ m s-1 for
an AT cut quartz crystal) and tQ the thickness of the crystal.
Upon deposition of a layer of material on top of the crystal, the path of the acoustic wave
is modified and, accordingly the resonance frequency. This variation of the resonance frequency
can be related to the variation in mass via the Sauerbrey equation assuming a few hypotheses
regarding the characteristics of the deposited layer. The validity of this equation is restricted to
thin uniform rigid layers presenting a density similar to that of the crystal. According to these
assumptions we have:
∆𝑓 =
−2𝑓02 ∆𝑚
𝐴√µ𝑄𝜌𝑄
= −𝑆∆𝑚 (2.16)
where Δf is the variation of the frequency, f0 the resonance frequency, Δm the mass variation, A
the electrode area (cm2), µQ the shear modulus of the quartz (2.947 1011 g s-2 cm-1), ρQ the quartz
density (2.648 g cm-3) and S the Sauerbrey constant [164].
Page 63
Chapter 2 Experimental
47
For QCM measurements, only one side of the gold coated crystal was modified with the
peptide layer and put in contact with the buffer. A gold crystal with a resonance frequency of
10 MHz and an area of 0.205 cm2 was used. Microbalance measurements were performed on a
Gamry instrument with the flow cell as shown on Figure 2-9. Electrochemical coupling allowed
the characterisation of the crystal surface prior to immobilisation.
(a) (b) (c)
Figure 2-9 : (a) Quartz crystal microbalance; (b) flow cell; (c) gold coated quartz crystal.
Page 64
Chapter 2 Experimental
48
2.3 Atomic Force Microscopy
Atomic force microscopy (AFM) is a scanning probe technique providing surface
information on the nanoscale by measuring repulsive and attractive forces between a probe and
a surface. The principle is based on the short distance interactions between the sample and the
sharp probe supported on a flexible cantilever. The motion of the probe across the surface
sample is controlled by a piezoelectric crystal. A laser beam is reflected by the cantilever
towards a photodiode that detects the deflection of the probe as sketched in Figure 2-10.
Figure 2-10 : Schematic principle of AFM.
There are various mode of imaging in AFM, among which three are the most common:
1) The contact mode where the tip remains in contact with the sample and the deflection
of the cantilever is recorded based on repulsive forces.
2) The tapping mode in which the cantilever oscillates at its resonance frequency. When
there is a topographic change at the surface, the oscillation is disturbed and the
piezoelectric needs to adapt to maintain the oscillation amplitude constant. The
movement of the piezoelectric as a function of x,y gives the sample topography.
3) The non-contact mode where the probe is not in contact with the sample but oscillates
above the surface based on the attractive forces with the sample.
The image resolution depends on the interaction between the tip and the sample but also on the
tip size and the tip-to-sample distance. The image is then constituted of a series of parallel lines
composed of pixels characterised by their position (x,y) and height (z).
In this work, AFM measurements were operated in a non-contact mode with a silicon
nitride tip using a multimode microscope equipped with a Nanoscope V controller from Veeco
Instruments Inc.
Page 65
Chapter 2 Experimental
49
2.4 In situ Fluorescence Microscopy under polarisation
The technique of in situ fluorescence under polarisation, coupling electrochemistry with
fluorescence constitutes a major part of this work. We decided to develop the theoretical
considerations latter in this manuscript, along with the presentation and discussion of
experimental results. In this section, we will focus only on the equipment and on the description
of the coupling between the potentiostat and camera.
2.4.1 Experimental setup
Every fluorescence measurement was performed in a specially designed and manufactured
electrochemical cell, shown on Figure 2-11. This cell was obtained thanks to the courtesy of
Professor Bizzotto and built by Brian Ditchburn, the glassblower of the Chemistry Department
of the University of British Columbia, Vancouver, Canada.
Figure 2-11: Representation of the three-electrode cell used for in situ epifluorescence
microscopy.
The electrochemical cell, arranged in a typical three-electrode setup, presents a 250 µm-
thick glass at its bottom optical window. It contains 7 entrances, one of them being connected
to a glass tube allowing nitrogen purge of the electrolyte and another to maintain the solution
under nitrogen during the experiments. A third port is used to insert the counter electrode which,
in this work, is a platinum wire. An integrated salt bridge allows the introduction of the
Page 66
Chapter 2 Experimental
50
reference electrode, a KCl-saturated Ag|AgCl electrode, minimizing the contamination of the
electrolyte with the ions contained in the reference. Each potential given in this work refers to
this reference. The main port is centred and used to place the working electrode in the cell. The
remaining ports are closed with stoppers.
The working electrode is a polished polycrystalline gold bead prepared by melting the
extremity of a gold wire in a methane/oxygen flame. Prior to modification with the peptide,
each gold electrode was annealed in a methane/gas flame, cooled down for a few seconds in
air, and then quickly quenched in pure water. The beads were then electrochemically
characterised by cycling the potential between -0.3 V and +1.5 V in 0.1 M HClO4 until
reproducible cycles were obtained to ensure the quality of the substrate. For in situ fluorescence
microscopy measurements under potential control, the gold bead, connected to a copper wire
sealed in a glass tube, was placed in contact with the electrolyte solution using the hanging
meniscus technique. Only the flat surface of interest of the electrode was thus in contact with
the electrolyte. This specific configuration of the cell is adapted to the use of an inverted
microscope in which the sample is analysed from the bottom rather than from the top, looking
up at the surface of the electrode. The microscope is connected to a CCD digital camera
allowing the recording of images. The coupling between electrochemistry and fluorescence,
which will be described in the following section, is operated via triggering.
Two different setups including different microscopes, filter cubes, objectives and CCD
camera were used in this work, because part of the experiments (namely the characterisation of
the mixed layers of peptide and MCB prepared in one and two-step adsorption) were performed
in the lab of Professor Bizzotto at the University of British Columbia and the others
measurements at the Université libre de Bruxelles. Table 2-1 summarises the equipment used
respectively at UBC and ULB.
Page 67
Chapter 2 Experimental
51
Table 2-1 : Description of the equipment used for in situ fluorescence measurements.
UBC ULB
Microscope Olympus IX70 Eclipse Ti, Nikon
Lamp EXFO X-Cite eXacte
Mercury Lamp
HBO 103W/2 Mercury
Lamp
Objective 10 ×
Olympus LM PlanFl
(NA 0.25; WD 21 mm)
Nikon CFI Plan Fluor DIC L
(NA 0.30; WD 16 mm)
Objective 50 × Olympus LM Plan-Fl
(NA 0.5 ; WD10.6 mm)
Nikon CFI LU Plan EPI
ELWD
(NA 0.55 ; WD 10.1 mm)
Fluorescence Filter Cube WIBA cube
Excitation: 450-490
Dichroic mirror: 505
Emission: 510-550
Nikon B2A
Excitation:450-490
Dichroic mirror: 505
Emission: 520 LP
CCD Camera EvolveTM 512 EMCCD
Camera,
Photometrics
Clara Interline CCD
Camera,
model DR-328G-C01-SIL,
Andor Technology
Softwares Labview program Andor Solis Software +
NOVA
The numerical aperture (NA) describes the acceptance cone of an objective and hence, its ability
to collect light. Usually, bigger NA are preferred because resolution is inversely proportional
to the numerical aperture as expressed in equation 2.17.
𝑅 =
𝜆
2𝑁𝐴 (2.17)
where R is the resolution, λ is the illuminating wavelength and NA numerical aperture.
Therefore, the bigger the numerical aperture, the best the resolution. The selected objectives
present quite small numerical aperture. However, our experiments require objectives
characterised by long working distances (WD). This parameter, defined as the distance from
the front lens element of the objective to the closest surface of the sample for which this latter
is in focus, has to be increased considering the electrochemical setup. Therefore, a compromise
has to be made between the two parameters, R and WD. Some objectives as the 50 × CFI LU
Plan EPI ELWD are specially designed to present a high numerical aperture compared to the
working distance. The acronym ELWD stands for “extra long working distance”. This type of
objective is often used on reflected light and inverted microscopes.
Page 68
Chapter 2 Experimental
52
Calibrations of the size of the fluorescence images have been performed using FocalCheckTM
fluorescence test slides. Table 2-2 presents the calibration of the CCD Cameras.
Table 2-2 : Calibration of the CCD Cameras.
EvolveTM 512 EMCCD Camera Clara Interline CCD Camera
Objective 10 × 0.647 pixels/µm 1.7 pixels/µm
Objective 50 × 3.235 pixels/µm 8.7 pixels/µm
2.4.2 Electrochemical coupling
In this technique, changes in potential, electrochemical responses, and fluorescence images
were triggered and recorded simultaneously. Two distinct triggering have been used with the
two equipments.
For the measurements performed at the University of British Columbia, electrochemical
measurements were performed on a (HEKA PG590 with PAR 175 scan generator) and lock-in
amplifier (EG&G 5210). The differential capacitance was measured using a 200 Hz, 5 mV
RMS ac perturbation superimposed onto the dc potential. The resulting current response was
analyzed by a lock-in amplifier. The in-phase and out-of-phase amplitudes were then used to
calculate the capacitance assuming a series RC circuit. The triggering of the potentiostat
followed by that of the camera is controlled by a custom Labview program. Once the images
have been taken by the camera, it sends back a feedback (trigger out) to Labview which can
proceed to the next step.
Measurements performed at the Université libre de Bruxelles were performed on a µAutolab
equipped with a Frequency Response Analysis module using NOVA 1.7 software. The
differential capacitance was measured using a 183 Hz, 5 mV perturbation. The capacitance is
calculated assuming a series RC circuit. When the desired potential is applied to the electrode,
the NOVA software triggers the camera which takes an image. The trigger is then turned off
and the impedance measurement is performed.
In both setups, a succession of fixed potentials was applied every 25 mV as shown on Figure
2-12.
Page 69
Chapter 2 Experimental
53
Figure 2-12 : Illustration of the potential programming and associate triggering used during in
situ fluorescence microscopy measurements
Page 70
Chapter 2 Experimental
54
2.5 Chemicals
The water, used as solvent is Milli-Q water (Millipore). It is free from organic traces and
presents a resistivity > 18.2 MΩ cm.
The nitrogen (purity > 99.9 %), supplied from Air Liquide, used to remove oxygen from the
solutions, contains less than 0.0005 % oxygen.
The salts used to prepare the Tris buffer are purchased from Alfa Aesar:
Tris(hydroxymethyl)aminomethane hydrochloride, 99+% Tris(hydroxymethyl)amino-
methane, ACS, 99.8-100%
The salt used to prepare the phosphate buffer; Na2HPO4.2H2O and NaH2PO4.H2O, are of pro
analysi grade and supplied from Merck.
The perchloric acid 70 % is purchased from Merck and is of Suprapur quality.
The potassium hexacyanoferrate (III) and potassium hexacyanoferrate (II) trihydrate are of
European Pharmacopoeia Reagent grade and supplied from Merck.
The hexaammineruthenium(III) chloride is an Alfa Aesar product from Johnson Matthey
GmbH company (Ru 32.1 % min).
The 4-mercaptobutan-1-ol (MCB) purchased from Fulka presented a 97 % purity and was
stored at 4 °C.
The peptide aptamer sequences have been synthesised and purified by Eurogentec S.A. Europe.
Purifications have been performed by high performance liquid chromatography. The selected
peptide aptamers are based on the amino acids sequence of the protein p53 involved in the
interaction with the protein MDM2. For anchoring on a gold substrate the sequence has been
modified with a cysteine residue and for fluorescence measurements, the sequence has been
elongated with three amino acids and labelled with a 5-carboxyfluorescein tag. Table 2-3
summarises the peptide aptamer sequences used in this work.
Table 2-3 : Selected peptide aptamer sequences of the protein p53.
Peptide aptamer sequences
Ap-cys-p53 H2N-CPPLSQETFSDLWKLL-COOH
Ap-cys-p53-fluo H2N-CPPLSQETFSDLWKLLPAK(5-FAM)-CONH2
Ap-p53-fluo H2N-PPLSQETFSDLWKLLPAK(5-FAM)-CONH2
Page 71
Chapter 2 Experimental
55
The MDM2 human recombinant target protein (expressed in E. coli) has been purchased from
Sigma-Aldrich and supplied as a liquid solution whose solvent was composed of 20 mM Tris-
HCl pH 8, 20 % glycerol, 100 mM KCl, 1 mM DTT, 0.2 mM EDTA. To prevent interferences
of these additionnal compounds, particularly DTT during the experiments, the aliquot was
further purified on a PD MidiTrap G-10 column (GE Healthcare). After equilibration of the
column with 20 mM Tris-HCl pH 8, 1 mL of the sample has been added until it completely
entered the packed bed followed by 0.7 mL of the buffer. After discarding the flow-through,
1.2 mL of buffer were used for elution and collection of the protein sample in a tube. The
resulting concentration of protein was determined using a Pierce BCA Protein Assay procedure
based on a Biuret reaction. The sample was stored at -80 °C.
Albumin from bovine serum ≥ 99 % purified by agarose gel electrophoresis was purchased
from Sigma-Aldrich and stored at 4 °C.
Cytochrome c from bovine heart ≥ 95 % was purchased from Sigma-Aldrich and stored
at -20° C.
Fibrinogen from human plasma ≥ 90 % was purchased from Calbiochem and stored at 4 °C.
Page 73
Chapter 3 Electrochemical characterisation of the
immobilisation of the peptide aptamer probe on gold
57
Chapter 3. Electrochemical characterisation of the
immobilisation of the peptide aptamer probe on gold
3.1 Formation of the self-assembled monolayers
The immobilisation of the probe on the electrode surface is one of the key aspects in the
elaboration of a biorecognition interface. Many features that have to be taken into account have
been widely underlined in the literature such as the amount of immobilised probe for a highly
sensitive detection signal for the analytical process as well as the appropriate density of probe
to allow a sufficient accessibility of the immobilised molecules for the target. In this context,
attention has been drawn to the formation of homogenous layers [80, 99, 103, 104, 109, 112,
75, 165]. Furthermore, the modified interface has to present a good selectivity for the target
molecule.
The immobilisation process consisting in the anchoring of one of the extremity of the peptide
probe to the surface is commonly used and considered as a convenient method. This procedure
allows some control of the density of the probe and preserve a conformational freedom of the
probe for the recognition event.
In this work, we propose a self-assembled immobilisation procedure of a peptide aptamer. This
probe is based on the interaction sequence of the p53 tumour suppressor protein with the
oncoprotein MDM2 and more particularly the amino acids 12 to 26. The peptide sequence has
been modified by a cysteine residue to allow the chemisorption of the probe on the gold
substrate through the formation of a Au-S bond. In the following work, we will refer to the
probe sequence as “Ap-cys-p53”.
The formation of the biorecognition layer has been realised by self-assembly of the thiolated
peptide probe on a polycrystalline gold electrode.
Two ways of immobilisation have been considered in this work,
- a one-step coadsorption procedure in which a hydroxyalkanethiol, the 4-
mercaptobutan-1-ol (MCB) and the p53 based thiolated peptide aptamer are
simultaneously adsorbed on the gold surface as can be seen on Figure 3-1 (a).
Page 74
Chapter 3 Electrochemical characterisation of the
immobilisation of the peptide aptamer probe on gold
58
- a two-step adsorption procedure in which the p53 peptide probe is firstly
immobilised followed by the “passivation” of the gold surface with 4-
mercaptobutan-1-ol as can be seen on Figure 3-1 (b).
The following immobilisation conditions have been employed:
- a total concentration of thiolated probe and hydroxyalkanethiol maintained at
20 µM.
- a 50 µL immobilisation medium consisting in 1 M sodium phosphate buffer pH 7.4
- a long adsorption time (> 16 hours)
- different peptide/diluent molar ratios
The coadsorption of the biological probe with a hydroxyalkanethiol is commonly used in
the elaboration of a biorecognition interface. It prevents the non-specific adsorption of
biological molecules on the gold surface. It also allows the probe to straighten up to be
accessible to the target. Figure 3-1 illustrates both ways of adsorption. The self-assembly occurs
through simple immersion of the gold substrate in a buffered solution containing a known
concentration of the thiolated species.
(a) One-step coadsorption
(b) Two-step consecutive adsorption
Figure 3-1 : Illustration of the immobilisation procedures through (a) one-step coadsorption
and (b) two-step consecutive adsorption.
Page 75
Chapter 3 Electrochemical characterisation of the
immobilisation of the peptide aptamer probe on gold
59
3.2 Evidence of the immobilisation of the thiolated
molecules
The presence of immobilised molecules at the electrode surface can be detected by
evidencing the reductive desorption of these species. Figure 3-2 shows the evolution of the
cyclic voltammograms of a Ap-cys-p53/MCB (2/3) modified gold electrode in one-step
coadsorption while cycling the potential between -0.8 V and +0.1 V. A modification of the
shape of the voltammograms, associated with the reductive desorption of the thiolated species
immobilised on the electrode surface, can be observed over cycling. A continuous decrease in
the intensity of both the cathodic and anodic responses is noticed at each cycle indicating that
a smaller amount of thiolated molecules is adsorbed on the surface. This decrease originates in
the diffusion from the electrode surface to the bulk of the desorbed thiolated peptide and MCB
at potentials more negative than -0.5 V. The molecules keep diffusing as long as the potential
has not reached a value positive enough to allow the re-adsorption of the thiolated species and
only those being close enough to the electrode will be re-adsorbed.
-0.8 -0.6 -0.4 -0.2 0.0 0.2
-15
-10
-5
0
5
j /
µA
.cm
-2
E vs Ag|AgCl / V
scan 1
scan 2
scan 4
scan 7
scan 10
Start potential
Figure 3-2: Evolution of the cyclic voltammograms of a coadsorbed Ap-cys-p53/MCB (2/3)
modified electrode recorded in 10 mM Tris-HCl – pH 7.4; υ = 50 mV s-1.
Figure 3-3 presents the cyclic voltammograms recorded in the ideally polarisable domain,
before and after an overnight immersion in a 1 M phosphate buffer solution pH 7.4 containing
a 20 µM mixture of Ap-cys-p53/MCB in proportion 2/3 (coadsorption procedure). Whereas no
faradaic current is observed on the curve corresponding to the bare gold, the presence of the
Page 76
Chapter 3 Electrochemical characterisation of the
immobilisation of the peptide aptamer probe on gold
60
layer after the immobilisation is evidenced by the appearance of a cathodic peak at -0.7 V
corresponding to the reductive desorption of the thiolated species immobilised on the electrode
surface. The potential sweep is inverted when the peak corresponding to the reduction of the
electrolyte appears. On the backward sweep, a smaller peak, originating from the partial re-
adsorption of the thiolated species, is observed around -0.53 V.
-0.8 -0.6 -0.4 -0.2 0.0 0.2
-20
-15
-10
-5
0
5
-0.8 -0.6 -0.4 -0.2 0.0 0.2
-15
-10
-5
0
5 (b)
j /
µA
.cm
-2
E vs Ag|AgCl / V
(a)j
/ µ
A.c
m-2
E vs Ag|AgCl / V
Start potential
Figure 3-3 : Cyclic voltammograms of a polycrystalline gold electrode before (a) and after (b)
immersion in a 20 µM solution of Ap-cys-p53/MCB (2/3) recorded in 10 mM Tris-HCl -
pH 7.4, υ = 50 mV s-1.
At pH 7.4, desorption occurs according to the following reaction:
𝑅𝑆 − 𝐴𝑢 + 1𝑒− ⇄ 𝑅𝑆− + 𝐴𝑢
Page 77
Chapter 3 Electrochemical characterisation of the
immobilisation of the peptide aptamer probe on gold
61
The mechanism of reductive desorption involving the transfer of one electron per adsorbed
molecule, the total amount of adsorbed self-assembled thiolated molecules can be determined,
after the first cycle, through the integration of the cathodic peak to obtain the faradaic charge
according to equation 3.1:
𝜎𝑓 = 𝑛𝐹Γ𝑡𝑜𝑡 (3.1)
With σf the charge density, n the number of electron transferred (n assumed as being equal to
1 in the present case), F the Faraday constant, Γtot the total surface concentration in thiolated
molecules, ΓMCB + ΓAp-cys-p53.
The integration of the cathodic peak of the cyclic voltammogram of the coadsorbed Ap-
cys-p53/MCB 2/3 modified electrode presented in Figure 3-3 leads, after subtraction of the
capacitive current, to a faradaic charge of 45.5 ± 0.9 µC cm-2 so that the total surface
concentration in thiols amounts to 4.7±0.1 10-10 mol cm-2.
In the case of the two-step adsorption procedure in which the peptide probe is adsorbed on the
electrode surface overnight prior to the MCB (1 hour), the same shape and behaviour is
observed for the cyclic voltammograms associated with the reductive desorption. However, the
layer presents a lower stability since it already desorbs at -0.6 V compared to -0.7 V for the
one-step adsorption procedure. For a two-step adsorption, with a same peptide/MCB ratio (Ap-
cys-p53/MCB 2/3), a faradaic reduction charge of 41.2 ± 0.7 µC cm-2 is measured giving
therefore a total surface concentration of 4.2±0.1 10-10 mol cm-2. These data indicates that both
ways of immobilisation lead to a comparable amount of adsorbed thiolated molecules. These
results can be compared with those obtained for compact self-assembled alkanethiols
monolayers where concentrations of 7.6 10-10 mol cm-2 are obtained on Au(111) [69, 166]. The
smaller value obtained in this work is related to the bigger size of the peptide molecule
compared to an alkanethiol.
Although these reductive desorption measurements evidence the immobilisation of a layer of
thiols, it only gives a total thiol concentration and does not unarguably prove the adsorption of
the peptide on the electrode surface, even though the smaller total superficial excess compared
to a full layer of alkanethiol supports this hypothesis. Therefore, we need additional approaches
to provide further evidence of the biomolecule adsorption, as well as to quantify its amount.
Page 78
Chapter 3 Electrochemical characterisation of the
immobilisation of the peptide aptamer probe on gold
62
3.3 Interaction between the [Ru(NH3)6]3+ complex and
the peptide probe
3.3.1. Evidence of the interaction between the complex and the
peptide probe
The characterisation of the monolayer requires the control and determination of the amount
of probe immobilised on the surface. In the field of biosensing, this quantification is often
processed through the use of radioactive or fluorescent marker [167, 168, 169, 170].
Nevertheless, Steel et al. developed an easy-to-use electrochemical quantification to monitor
the amount of DNA oligonucleotides adsorbed on a gold surface [77]. The surface density of
DNA was determined by taking advantage of the electrostatic interaction of the positively
charged hexaammineruthenium(III) redox complex with the negatively charged phosphate
backbone of DNA. In this technique, a DNA modified electrode was soaked in a low ionic
strength electrolyte containing the cationic redox marker which can exchange for the native
counterions associated with the negative phosphate residues of the oligonucleotides. From
chronocoulometric measurements one can calculate the amount of redox marker in electrostatic
interaction with DNA. At saturation coverage of the redox marker, assuming a complete
compensation of the DNA residues by redox cations, the surface density of the probe can be
calculated. This method has also been developed by Yu et al. who were able to evaluate the
surface densities of both single and double-stranded molecules via the integration of the peak
for reduction of [Ru(NH3)6]3+ bound electrostatically to DNA as well as the binding constant
and electron transfer rate constant of [Ru(NH3)6]3+ on DNA modified electrodes [171, 172]. In
an extended view, Steichen et al. showed that the method, developed by Tarlov, can be applied
to anionic self-assembled monolayers namely on compact monolayers of 2-
mercaptobenzimidazole-5-sulfonate (MBIS) on gold [173].
As, in this work, we will be working with oligopeptides instead of oligonucleotides, we
will remain cautious about the results obtained from the quantification based on the
hexaammineruthenium(III). Although this method can give us an information, firstly, on the
presence of the probe on the surface and, secondly, on the relative amount of immobilised
peptide regarding the adsorption procedure, the presence of both negative and positive charges
on the peptide can have an influence on the results since intramolecular electrostatic interactions
may occur. However, at the working pH of this work, 7.4, our peptide probe presents a positive
charge on the lateral chain of the lysine residue and a negative charge on the lateral chains of
the aspartic acid residue and glutamic acid residue. Besides lateral chains, the peptide also
presents both a negative and a positive charge on the C- and N-terminal position respectively,
resulting therefore in a globally negatively charged probe allowing the use of [Ru(NH3)6]3+ as
dissolved marker.
Page 79
Chapter 3 Electrochemical characterisation of the
immobilisation of the peptide aptamer probe on gold
63
The interaction of the hexaammineruthenium(III) with the immobilised peptide probe is
evidenced by the cyclic voltammogram of a gold electrode exclusively modified with the
peptide presented on Figure 3-4.
-0.5 -0.4 -0.3 -0.2 -0.1 0.0 0.1 0.2 0.3-15
-10
-5
0
5
10j
/ µ
A.c
m-2
E vs Ag|AgCl / V
(B)
(A)
Figure 3-4 : Cyclic voltammogram of a 20 µM Ap-cys-p53 modified gold electrode in 10 mM
Tris-HCl – pH 7.4 -50 µM [Ru(NH3)6]3+; υ = 50 mV s-1.
Two cathodic responses are observed, a first peak (A) at -0.15 V corresponding to the diffusion
of the electroactive species to the electrode is followed by a post-peak (B) at more negative
potentials, around -0.3 V. This voltammogram characteristic shape witnesses the adsorption of
dissolved electroactive species at the electrochemical interface [174]. The post-peak results
from the greater stability with respect to the reduction of the adsorbed electroactive species as
compared to the dissolved ones. These data confirm the adsorption of the [Ru(NH3)6]3+ at the
modified electrode, and this can be assigned to the successful immobilisation of the peptide
probe.
Cyclic voltammograms recorded at different scan rates support the adsorption of
[Ru(NH3)6]3+ at the modified electrode. By plotting the current associated with both peaks as a
function of the scan rate (Figure 3-5), it is found that the intensity of the peak A is proportional
to the square root of the scan rate, indicating a diffusion controlled process. However, a linear
relation of the intensity as a function of the scan rate is observed for peak B, confirming the
reduction of the adsorbed electroactive species.
Page 80
Chapter 3 Electrochemical characterisation of the
immobilisation of the peptide aptamer probe on gold
64
0 50 100 150 2000
2
4
6
8
10
12
14
16 peak A
peak B
j p /
µA
.cm
-2
/ mV.s-1
Figure 3-5: Peak current densities of the peaks A and B as a function of the scan rate for the
[Ru(NH3)6]3+ on a Ap-cys-p53/MCB modified electrode.
Figure 3-6 compares the cyclic voltammograms recorded for mixed layers of Ap-cys-p53/MCB
immobilised by two-step adsorption (curve a) and coadsorption (curve b) procedures.
Figure 3-6: Cyclic voltammograms of a mixed layer Ap-cys-p53/MCB modified gold
electrode by two-step adsorption (a) and coadsorption (b) in 10 mM Tris-HCl – pH 7.4 -50
µM [Ru(NH3)6]3+ ; υ = 150 mV s-1.
It can be noticed that the post-peak associated with the [Ru(NH3)6]3+ adsorbed on the peptide is
markedly smaller on curve (b), corresponding to the coadsorption of the peptide with MCB,
-0.5 -0.4 -0.3 -0.2 -0.1 0.0 0.1 0.2 0.3-15
-10
-5
0
5
10
-0.5 -0.4 -0.3 -0.2 -0.1 0.0 0.1-15
-10
-5
0
5
10(a)
j/µ
A.c
m-2
E vs Ag|AgCl /V
j/µ
A.c
m-2
E vs Ag|AgCl/V
(b)
Page 81
Chapter 3 Electrochemical characterisation of the
immobilisation of the peptide aptamer probe on gold
65
than on curve (a). This variation could indicate that coadsorption leads to monolayers less
concentrated in peptide compared to a two-step adsorption.
In principle, it should be possible to quantify the amount of adsorbed [Ru(NH3)6]3+ through
the integration of the post-peak, provided it is sufficiently separated from the main wave.
Indeed, as it has been mentioned earlier, Yu et al. based the quantification of the surface density
in DNA on the integration of the peak for reduction of [Ru(NH3)6]3+ electrostatically bound to
DNA [171]. In practice, it is usually complicated to subtract the baseline and to correct for
double layer charging. Therefore, we will use chronocoulometry which allow the determination
of the amount of adsorbed reactant independently of the relative position of the dissolved and
adsorbed marker reduction as well as the kinetics of the reaction.
From chronocoulometric data, we can obtain the charge density σ, measured as a function of
time (t > 0) as it is expressed in equation 3.2 [174]:
𝜎 =
2𝜋𝐷𝑂1/2
𝐶𝑂
𝜋1/2𝑡1/2 + 𝜎𝑑𝑙 + 𝑛𝐹𝛤𝑂 (3.2)
with n the number of electrons involved in the reduction of the redox species, DO its diffusion
coefficient, CO its bulk concentration, σdl the charge associated to the double layer, ΓO the
surface concentration of redox cations adsorbed at the electrochemical interface and F the
Faraday constant.
The first term of this equation, commonly referred to as the Cottrell contribution, represents the
charge associated with the redox process involving electroactive species diffusing to the
electrode. The second term is associated with the charge contribution due to the presence of an
electrical double layer at the electrode|solution interface. The third term, the one of interest in
this work, allows the quantification of the redox species adsorbed at the electrode.
Practically, the surface concentration of adsorbed redox cations is obtained in two stages in a
low ionic force buffer. A potential step programmation is applied from E1 to E2, firstly in the
absence of the redox complex to determine the charge of the double layer σdl and, secondly in
the presence of [Ru(NH3)6]3+. The same programmation is used in the present work.
The first potential E1 is chosen in a region where no faradaic reaction occurs, in the present case
+0.2 V. The choice of the second potential E2 is more complicated since it must be negative
enough so that all the adsorbed [Ru(NH3)6]3+ can be quantified but not too negative to avoid
the desorption of the monolayer. In this work, the second potential fulfilling both criteria
is -0.4 V.
Typical chronocoulometric curves of a Ap-cys-p53/MCB modified electrode in Tris-HCl 0.01
M-pH 7.4 in the absence and presence of 50 µM [Ru(NH3)6]3+ for a potential jump between
+0.2 V and -0.4 V are presented on Figure 3-7.
Page 82
Chapter 3 Electrochemical characterisation of the
immobilisation of the peptide aptamer probe on gold
66
The surface concentration of adsorbed redox cations ΓO is obtained through the difference
between the extrapolation lines at t=0 of the charges measured in the presence and absence of
the [Ru(NH3)6]3+ complex.
0.0 0.2 0.4 0.6 0.8 1.00
2
4
6
8
10
12
14
16
18
20
22
| |
/ µ
C.c
m-2
t1/2
/ s1/2
without [Ru(NH3)
6]
3+
with [Ru(NH3)
6]
3+
Figure 3-7: Chronocoulometric curve of a coadsorbed Ap-cys-p53/MCB (2/3) in absence ( )
and presence ( ) of 50 µM [Ru(NH3)6]3+ in 10 mM Tris-HCl–pH 7.4.
E1= +0.2 V; E2=-0.4 V.
As we evidenced that the behaviour of the [Ru(NH3)6]3+ follows a process of adsorption relying
on an equilibrium at the interface between the modified electrode and the solution, we can
expect an influence of the concentration. Therefore, by varying the concentration in redox
complex in solution, we should be able to determine an adsorption isotherm of the [Ru(NH3)6]3+
in electrostatic interaction with the peptide and extract an adsorption constant. This
characterisation of the interaction will help us to support the use of the [Ru(NH3)6]3+ complex
as an analytical tool to evaluate the influence of different adsorption procedures on the probe
density in the self-assembled monolayers. Figure 3-8 presents the chronocoulometric data of a
two-step adsorption Ap-cys-p53/MCB (2/3) modified electrode in a 10 mM Tris-HCl pH 7.4
buffer solution containing different concentrations of [Ru(NH3)6]3+ varying from 0 to 100 µM.
Page 83
Chapter 3 Electrochemical characterisation of the
immobilisation of the peptide aptamer probe on gold
67
0.0 0.2 0.4 0.6 0.8 1.00
5
10
15
20
25
30
||
/ µ
C.c
m-2
t1/2
/ s1/2
0 µM
1 µM
2 µM
5 µM
10 µM
15 µM
20 µM
25 µM
30 µM
40 µM
50 µM
60 µM
Figure 3-8: Chronocoulometric curves of a two-step adsorption Ap-cys-p53/MCB (2/3)
modified electrode recorded in 10 mM Tris-HCl-pH 7.4 containing varying concentrations in
[Ru(NH3)6]3+ from 0 µM to 60 µM. E1= +0.2 V ; E2=-0.4 V.
At lower concentrations, the extrapolation lines at t=0 show an increase of the amount of
adsorbed complex up to a certain concentration cO at which a maximum value is reached. A
further increase in concentration only leads to an increase of the slope of the line corresponding
to the Cottrell contribution. A curve showing the shape of an isotherm of adsorption is observed
when plotting the charge density of the adsorbed [Ru(NH3)6]3+ as a function of its concentration
(Figure 3-9).
Page 84
Chapter 3 Electrochemical characterisation of the
immobilisation of the peptide aptamer probe on gold
68
0 10 20 30 40 50 60
0
2
4
6
8
10
12
|a
ds| /
µC
.cm
-2
[RuHex]/µM
Figure 3-9: Cathodic density of charge of the adsorbed [Ru(NH3)6]3+ as a function of the
concentration in [Ru(NH3)6]3+ in solution for a two-step adsorption Ap-cys-p53/MCB (2/3)
modified electrode in 10 mM Tris-HCl – pH 7.4. E1= +0.2 V; E2=-0.4 V.
The data are conveniently described by a Langmuir adsorption isotherm responding to
equation 3.3:
𝜎𝑎𝑑𝑠
𝜎𝑠𝑎𝑡 − 𝜎𝑎𝑑𝑠= 𝐾𝑎𝑑𝑠[𝑅𝑢𝐻𝑒𝑥] (3.3)
With [RuHex] the concentration of the species in solution, σads the charge involving the
adsorbed species, σsat the charge at saturation and Kads the adsorption constant [175].
This model assumes the equivalence of all sites of adsorption and the ability of each
molecule to bind independently from the occupation of the neighbouring sites. The validation
of the Langmuir adsorption isotherm is often assessed via its linearization and the equation 3.3
becomes,
[𝑅𝑢𝐻𝑒𝑥]
𝜎𝑎𝑑𝑠=
[𝑅𝑢𝐻𝑒𝑥]
𝜎𝑠𝑎𝑡+
1
𝐾𝑎𝑑𝑠𝜎𝑠𝑎𝑡 (3.4)
A linear graph of [𝑅𝑢𝐻𝑒𝑥]
𝜎𝑎𝑑𝑠 as a function of the concentration in [Ru(NH3)6]
3+ is in agreement with
the Langmuir model. The determination of Kads and σsat can then be graphically determined
respectively via the extrapolation of the line at x=0 and its slope. Figure 3-10 shows a linear
relation between the experimentally determined [𝑅𝑢𝐻𝑒𝑥]
𝜎𝑎𝑑𝑠 and the concentration in [Ru(NH3)6]
3+
in solution.
Page 85
Chapter 3 Electrochemical characterisation of the
immobilisation of the peptide aptamer probe on gold
69
0 10 20 30 40 50 600
1
2
3
4
5
6
[Ru
Hex
]/
ad
s / µ
M.µ
C-1
.cm
2
[RuHex] / µM
Figure 3-10: Cathodic density of charge of the adsorbed [Ru(NH3)6]3+ as a function of the
concentration in [Ru(NH3)6]3+ in solution for a two-step adsorption Ap-cys-p53/MCB (2/3)
modified electrode in 10 mM Tris-HCl – pH 7.4 presented according to the linear form of the
Langmuir adsorption isotherm.
According to the conditions used in this work, 10 mM Tris-HCl–pH 7.4 buffer, the value of
adsorption constant obtained is 1.3 (± 0.6) 105 mol-1 L (n=3). This value reflect a strong
interaction between the complex and the peptide. Therefore, an analytical method based on this
interaction can be conceived.
3.3.2. Influence of the immobilisation procedure on the
[Ru(NH3)6]3+ concentration adsorbed at the
electrochemical interface
In the case of DNA, Tarlov et al. have shown that the quantification of oligonucleotides
immobilised in the SAM can be evaluated [77]. This quantification is based on a hypothesis
assuming that for diluted mixed monolayers all phosphate groups are associated with cationic
redox species so that the direct determination of DNA superficial excess is possible since a
complete compensation of charge corresponds to a 3 to 1 ratio (3 phosphate groups/ 1
[Ru(NH3)6]3+).
This hypothesis is more questionable in the present work since the peptide probe presents both
positive and negative charges allowing the presence of electrostatic interaction within the
peptide itself. Therefore, we propose here only to consider ΓO, the amount in redox cations
adsorbed at the electrochemical interface, rather than the peptide surface concentration.
Page 86
Chapter 3 Electrochemical characterisation of the
immobilisation of the peptide aptamer probe on gold
70
Nevertheless, we will use the Tarlov method for a comparison purpose and consider the values
obtained for ΓO to compare how different procedures of adsorption will influence the density
of the probe assuming a similar accessibility of the probe irrespective of the immobilisation
conditions. Figure 3-11 presents the values of ΓO obtained for different mixed monolayers
prepared in varying the proportions of peptide and MCB in the immobilisation solution both in
a one-step coadsorption and a two-step adsorption procedure. For a constant concentration of
20 µM in thiolated molecules in the immobilisation solution, the mole fraction of peptide probe
has been varied and the amount of adsorbed [Ru(NH3)6]3+ has been measured by
chronocoulometry.
0.0 0.2 0.4 0.6 0.80
2
4
6
8
10
Coadsorption
Two-step adsorption
O /
10
-11m
ol.
cm-2
xpeptide
Figure 3-11: Surface concentration in [Ru(NH3)6]3+ , (n=3), in a mixed self-assembled
monolayer of Ap-cys-p53/MCB obtained by coadsorption (■) and two-step adsorption (●) as
a function of the mole fraction of Ap-cys-p53 present in the solution of immobilisation
recorded in 10 mM Tris-HCl-pH 7.4 in the presence of 50 µM [Ru(NH3)6]3+. E1= +0.2 V;
E2=-0.4 V.
We can notice on Figure 3-11 that the amount of adsorbed [Ru(NH3)6]3+ is constant for a
given immobilisation procedure irrespective of the amount of peptide probe in the solution.
Therefore, we might suggest that, for the concentration in thiols considered in this work, a
limiting coverage in Ap-cys-p53 is reached in the mixed monolayers. The mean value of the
surface concentration reaches 4.0 ± 0.2 10-11 mol cm-2 for the one-step coadsorption and
6.4 ± 0.2 10-11 mol cm-2 for the two-step adsorption. Comparing these values to those obtained
for the total surface concentration in thiols, respectively 4.7 ± 0.1 10-10 mol cm-² and
4.2 ± 0.1 1010 mol cm-², and considering a one to one ratio between the[Ru(NH3)6]3+ and the
Page 87
Chapter 3 Electrochemical characterisation of the
immobilisation of the peptide aptamer probe on gold
71
peptide, we can estimate that about 10 % of the surface is covered by the peptide probe in one-
step coadsorption against 15 % for the two-step adsorption.
The amount of adsorbed [Ru(NH3)6]3+ however differs significantly between the two
procedures. Indeed, the [Ru(NH3)6]3+ surface concentration obtained for a mixed layer prepared
by coadsorption is 30 % lower than that obtained for a two-step adsorption. This trend has
already been evidenced in our lab for the immobilisation of mixed layers of oligonucleotides
and alkanethiols [104]. Some explanations can be found in the kinetics and thermodynamics of
adsorption of those species.
It is known that for thiols on gold, an initial adsorption step results in a surface coverage of
about 80 to 90 % at short times. This step is followed by a second stage at a much slower rate
during which the organisation of the SAM occurs. It is also known that for longer chains of
alkanethiols, the rate of the initial adsorption decreases, a phenomenon that is explained by the
slower diffusion of these thiols [70]. These informations may help us to interpret the difference
in peptide concentration for the two adsorption procedures.
In the case of the two-step adsorption, the peptide molecules are firstly self-assembled overnight
on the gold electrode surface through the thiol function of the cysteine residue. Over this period,
a maximum coverage of the peptide is reached. In addition to the covalently bonded molecules,
non specific adsorption of the amino acids on the substrate can also occurs. After the first
immobilisation step, MCB is put in contact with this initial layer. The peptide molecules
composing the SAM, when exposed to solutions containing other thiols, in this case MCB, may
exchange progressively. As the peptide is globally negatively charged, repulsions are expected
between molecules and the replacement of some of the peptide molecules by alkanethiols is
facilitated. Arinaga et al. evidenced this replacement of biomolecules, more specifically
oligonucleotides, by alkanethiols in real time by optical means [176]. They showed that the
mercaptohexanol induces the desorption of weakly adsorbed DNA and the reorientation of the
covalently attached strands.
During the one-step coadsorption, as both the peptide and the MCB are thiolated, a competition
directly occurs between these two species. Besides the charge difference, there is also a
difference in size between the two molecules. It is known that the adsorption process followed
a diffusion controlled Langmuir kinetics. The smaller MCB molecules, diffusing faster to the
electrode than the peptide, will rapidly cover a significant surface. It has been showed by Bain
et al. [55], that for long chain alkanethiols, the film thickness reached 80 to 90 % of its final
value after two minutes. It has also been showed by Subramanian et al. [71], that for
concentration in alkanethiols lower that 5 µM, 80 % coverage is reached after 500 s. The results
obtained here are consistent with the fact that, due to fast adsorption kinetics of the MCB on
the gold electrode, only a limited number of sites remain free for the thiolated peptide which
explains the smaller density of probe in the coadsorbed mixed monolayer compared to the one
obtained by the two-step adsorption.
Page 88
Chapter 3 Electrochemical characterisation of the
immobilisation of the peptide aptamer probe on gold
72
3.4 Electrochemical behaviour of the redox couple
[Fe(CN)6]3-/4- in presence of the monolayers
As biomolecules are immobilised at the electrochemical interface, modifications in the
electrical double layer capacitance and in electron transfer kinetics are expected. The peptide
probe being globally negatively charged, its immobilisation generates an increase of the
negative charges at the electrochemical interface. It has been shown that in the presence of the
positively charged redox marker, [Ru(NH3)6]3+, electrostatic attraction occurred between the
peptide and the cation as evidenced by the appearance of an adsorption post-peak on the cyclic
voltammogramm presented on Figure 3-4. Therefore, using anionic redox markers in solution,
we expect to evidence electrostatic repulsions between the peptide monolayer and these
complexes. The redox couple [Fe(CN)6]3-/4- is frequently used to characterise the properties of
the self-assembled monolayers towards electron transfer. Figure 3-12 shows the cyclic
voltammograms of a polycrystalline gold electrode in the presence of [Fe(CN)6]3-/4- before and
after the immobilisation of a mixed layer Ap-cys-p53/MCB by coadsorption and two-step
adsorption. It also shows the electrochemical behaviour of the [Fe(CN)6]3-/4- towards a
monolayer exclusively composed of the peptide probe.
-0.1 0.0 0.1 0.2 0.3 0.4 0.5 0.6
-400
-300
-200
-100
0
100
200
300
400
j /
µA
.cm
-2
E vs Ag|Agcl / V
Bare gold
Coadsorbed peptide/MCB (2/3)
Two-step adsorption peptide/MCB (2/3)
Ap-cys-p53(12-26)
Figure 3-12 : Cyclic voltammograms recorded in a 50 mM phosphate buffer pH 7.4 in the
presence of 5 mM [Fe(CN)6]3-/4- 1/1, before (---) and after modification of a gold electrode by
coadsorption of 20 µM Ap-cys-p53/MCB (2/3) (---), two-step adsorption of 20 µM Ap-cys-
p53/MCB (2/3) (---) and adsorption of 20 µM of Ap-cys-p53 ( ) overnight ; υ = 50 mV s-1.
Page 89
Chapter 3 Electrochemical characterisation of the
immobilisation of the peptide aptamer probe on gold
73
It can be seen that the [Fe(CN)6]3-/4- redox couple presents a nicely reversible behaviour on bare
gold. Upon immobilisation of the layers, the reversibility of the redox couple [Fe(CN)6]3-/4- is
affected. While the faradaic response remains highly reversible in the case of a coadsorbed
layer, a significant inhibition of the signal is observed for the films formed through a two-step
adsorption. Such a modification of electron transfer kinetics of redox molecule within films has
already been evidenced by Ceres et al. for DNA modified electrodes passivated by
mercaptohexanol. They showed that the permselectivity is related to the initial deposition
conditions, interduplex distances being dictated by the screening of the negative charges of the
phosphate backbone [177].
It is however very impressive to notice on Figure 3-12 that the redox peaks totally disappear
for a layer exclusively composed of the peptide probe.
It has been shown by Steichen et al. that self-assembly of mercaptobutanol on gold has no
significant influence on the redox process of [Fe(CN)6]3-/4- [79]. Therefore, the inhibition
observed here is clearly associated with the presence of the negatively charged peptide aptamer.
We have seen earlier that coadsorption was leading to a lower density of the aptamer in the
mixed film allowing thus the mercaptobutanol to preserve channels through the film where the
redox couple kinetics is merely affected. The higher density of peptide aptamer in the two-step
adsorption procedure increases the amount of negative charges at the electrode surface and
further hinders the electron transfer. This effect is reinforced for the layer exclusively composed
of peptide, since the absence of mercaptobutanol removes any facile access to the electrode.
The negatively charged peptide layer forms thus a barrier to the electronic transfer, and totally
inhibits the signal.
The insulating property of peptide films has already been evidenced for helicoidal peptides
by Gatto et al. who used Cα-tetrasubstituted amino acids behaving as rigid helical oligopeptides
able to form densely packed layers [109, 110]. Although the transactivation domain of the p53
is supposed to be intrinsically disordered and to form a helicoidal structure only under
interaction with the MDM2 target protein, a multidimensional NMR study carried by Lee et al.,
has shown that this domain is populated by an amphipathic helix and two nascent turns. The
helix is formed by residues Thr18–Leu26 and the two turns are formed by residues Met40–
Met44 and Asp48–Trp53 [178].
The peptide aptamer chosen in this work being formed of the residues 12-26, it contains the
residues associated with the amphipathic helix which might be considered to explain the
complete inhibition of the electron transfer observed on Figure 3-12. To better understand this
specific behaviour of the monolayer exclusively composed of peptide, we will investigate its
interfacial behaviour by microscopy means in parallel with the mixed layers later in this work.
Page 91
Chapter 4 Elaboration of a p53 peptide-based transducer
for the detection of the protein MDM2
75
Chapter 4. Elaboration of a p53 peptide-based transducer
for the detection of the protein MDM2
4.1 Principle of the detection method
In the previous sections, we presented the immobilisation of self-assembled monolayers of
the p53 peptide aptamer mixed with MCB and briefly looked at the behaviour of a layer
exclusively composed of peptide in order to electrochemically characterise and optimise the
interface for the electrochemical biorecognition of the MDM2 target protein by the probes
adsorbed on the gold electrode. We will now present the results associated with the detection
occurring at the electrochemical interface.
The detection of a biorecognition event by electrochemical means can proceed according
to various methods. In this work we propose to use a label-free technique in which the aptamer
probe is not labelled. Since the formation of the p53-MDM2 peptide-protein system will induce
a modification of the electrical double layer, we decided to use the electrochemical impedance
spectroscopy in the presence of the redox couple [Fe(CN)6]3-/4- as detection method. This
technique is widely used in the biosensing field since the electron transfer of the redox couple
is influenced both by a variation in charge at the interface but also by a modification of the
accessibility of the surface. Indeed, it has been shown, in our lab [79], that upon hybridisation,
the charge transfer resistance evolved in opposite ways depending on the type of probe selected,
hairpin DNA or linear DNA. For linear DNA, the hybridisation led to a higher hindrance at the
electrode and the charge transfer resistance increased whereas for hairpin DNA, the
disappearance of the DNA loop upon hybridisation favoured the access of the redox marker to
the electrode inducing a decrease of the charge transfer resistance. The variation of electron
transfer resistance will allow us to compare the interfacial behaviour, associated with the
various procedures of immobilisation considered, as we have seen in section 3.4 that the
electrochemical behaviour of the redox complex is tremendously affected by the adsorption
procedure considered.
Practically, a Nyquist plot of the electrode modified by the aptamer probe mixed or unmixed
with MCB is recorded in a cell containing a 50 mM phosphate buffer at pH 7.4 in the presence
of 5 10-3 M [Fe(CN)6]3- and 5 10-3 M [Fe(CN)6]
4-. The impedance spectrum is recorded at
+0.2 V in a frequency range between 10 mHz and 50 kHz for a monolayer exclusively
composed of peptide and 350 mHz and 50 kHz for mixed layers with an alternating amplitude
Page 92
Chapter 4 Elaboration of a p53 peptide-based transducer
for the detection of the protein MDM2
76
of 5 mV. The electrode is then taken out from the electrochemical cell and put into contact with
a 1 M phosphate buffer solution - pH 7.4 containing the MDM2 target for 10 minutes.
Afterwards, the electrode is rinsed with the measuring buffer and replaced in the electrolyte for
impedance measurements.
To deeper characterise the electrochemical interface, the experimental impedance spectra
are confronted to theoretical models of electrical equivalent circuits where the electrochemical
cell is represented by a combination of resistors and capacitors. The equivalent circuits
associated with an electrochemical cell are not unique and their identification for complicated
processes are often very complex.
A frequently used circuit, is the Randles equivalent circuit which models interfacial
electrochemical reactions in presence of semi-infinite linear diffusion of electroactives species
at electrodes. Since the responses are rarely the ideally expected ones the distribution of
reactivity is commonly represented in equivalent electrical circuits as a constant phase element
(CPE). The time-constant dispersion leading to CPE behaviour can arise from surface
heterogeneities such as grain boundaries, crystal faces on a polycrystalline electrode or other
variations in surface properties [163]. Therefore, in the Randles equivalent circuit, the double
layer capacitance Cdl is often replaced by a constant phase element Qdl. The Randles electrical
equivalent circuit Rs(Qdl[RctW]) is presented on Figure 4-1 where Rs represents the resistance
of the solution, Rct the charge transfer resistance which is inversely proportional to the exchange
current density and gives us information about the electron transfer kinetics, Qdl the constant
phase element of the double layer and Zw the Warburg impedance which is related to the semi-
infinite linear diffusion of the redox species to the electrode.
Figure 4-1: Illustration of the Randles electrical equivalent circuit Rs(Qdl[RctW]).
Generally, we favour the selection of a simple equivalent circuit. Indeed, although an increasing
number of parameters allows a better fitting of the experimental data, it often lacks of scientific
meaning as the uncertainties on the fitting parameters are too high (> 30%). The choice of the
Randles equivalent circuit has been motivated by its suitability for systems presenting electron
transfer. Indeed, in the context of this work, we will focus mostly on the charge transfer
resistance Rct associated with the electron transfer of the redox couple [Fe(CN)6]3-/4- at the
electrode. This parameter which is influenced both by the variation of charge at the interface
and the modification of accessibility will allow the detection of the recognition event.
Page 93
Chapter 4 Elaboration of a p53 peptide-based transducer
for the detection of the protein MDM2
77
The impedance of a constant phase element, Qdl, is given by:
𝑍𝑄𝑑𝑙
=1
(𝑖𝜔)𝛼𝑌0 (4.1)
with -1 < α < 1 and Y0 the admittance at ω=1 rad s-1 expressed by:
𝑌0 =
1
|𝑍| (4.2)
So that we have,
𝑌0 =
1
𝑅 𝑓𝑜𝑟 𝛼 = 0 (4.3)
𝑌0 = 𝐶 𝑓𝑜𝑟 𝛼 = 1 (4.4)
Therefore, when α=1, the element represents a purely capacitive behaviour.
When α=1/2, the constant phase element evidences a diffusive behaviour which can be
represented by a Warburg element.
Page 94
Chapter 4 Elaboration of a p53 peptide-based transducer
for the detection of the protein MDM2
78
4.2 Influence of the contact of the protein MDM2 with the
peptide layer on the charge transfer resistance
Figures 4-2 and 4-3 present the impedance spectra as a Nyquist plot of an Ap-cys-p53/MCB
(2/3) modified electrode, obtained by one-step and two-step adsorption respectively, before and
after contact with the MDM2 target protein.
0 500 1000 1500 2000 2500 3000
0
500
1000
1500
2000
2500
3000 Before MDM2
After 5 nM MDM2
-Z''
/ o
hm
Z' / ohm
Figure 4-2: Impedance spectra in 50 mM phosphate buffer – pH 7.4 in the presence of
5 10-3 M [Fe(CN)6] 3-/4- 1/1 at + 0.20 V of coadsorbed Ap-cys-p53/MCB (2/3) monolayer on
gold electrode before (■) and after (●) 10 minutes contact with 5 nM MDM2.
Page 95
Chapter 4 Elaboration of a p53 peptide-based transducer
for the detection of the protein MDM2
79
0 1000 2000 3000 4000 5000 6000 7000
0
1000
2000
3000
4000
5000
6000
7000 Before MDM2
After 5 nM MDM2
-Z''
/ o
hm
Z' / ohm
Figure 4-3: Impedance spectra in 50 mM phosphate buffer – pH 7.4 in the presence of
5 10-3 M [Fe(CN)6] 3-/4- 1/1 at + 0.20 V of two-step adsorption Ap-cys-p53/MCB (2/3)
monolayer on gold electrode before (■) and after (●) 10 minutes contact with 5 nM MDM2.
The impedance spectra of a peptide alone modified electrode before and after contact with the
MDM2 target protein are presented on Figure 4-4.
0 500 1000 1500 2000 2500 3000
0
500
1000
1500
2000
2500
3000
Before MDM2
After 5 nM MDM2
-Z''
/ k
oh
m
Z' / kohm
Figure 4-4: Impedance spectra in 50 mM phosphate buffer – pH 7.4 in the presence of
5 10-3 M [Fe(CN)6] 3-/4- 1/1 at + 0.20 V of a Ap-cys-p53 alone monolayer on gold electrode
before (■) and after (●) 10 minutes contact with 5 nM MDM2.
Page 96
Chapter 4 Elaboration of a p53 peptide-based transducer
for the detection of the protein MDM2
80
The analysis in terms of the Randles electrical equivalent circuit, Rs(Qdl[RctW]), are
summarised in Table 4-1 for the three immobilisation situations before and after interaction
with MDM2. Note that the value of the parameter Rs has been set to its experimental value in
the case of coadsorption since the value resulting from the fitting was negative which has no
physical meaning. Note also that in the absence of any apparent diffusion in the case of a
monolayer exclusively composed of peptide, the Warburg impedance has been set to 0. The
error estimates are calculated by testing several solutions near the best fit. For example, if the
best value for a particular resistor is 100 Ohms, the value is increased and decreased until the
goodness of fit starts to decrease. If 98 and 102 Ohms produces a very similar goodness of fit,
but 97 and 103 Ohms produces a poorer fit, the Error is reported as 2/100 * 100 = 2%. The
errors oscillating between 1 and 10 % supports the suitability of this model.
Table 4-1: Fitting parameters of the electrical equivalent circuit Rs(Qdl[RctW])
(The Error estimates are calculated by testing several solutions near the best fit).
Rs (Ω) Rct (kΩ) ZQdl (Ω) Zw (10-3 Ω)
Y0 (10-6 S sα ) α
Coadsorption
Before
MDM2
42.3 0.69
(±0.01)
0.036 (±0.007) 0.98
(±0.02)
0.229
(±0.006)
After 5 nM
MDM2
34.9 0.86
(±0.02)
0.05 (±0.01) 0.95
(±0.02)
0.225
(±0.005)
Two-step
adsorption
Before
MDM2
410 (±4) 3.74
(±0.04)
0.46
(±0.03)
0.894
(±0.007)
0.195
(±0.005)
After 5 nM
MDM2
405 (±4) 3.51
(±0.04)
0.44
(±0.02)
0.900
(±0.007)
0.206
(±0.006)
Peptide alone
Before
MDM2
196
(±19)
2430
(±220)
0.57 (±0.04) 0.88
(±0.01)
0
After 5 nM
MDM2
189
(±18)
809 (±57) 0.67
(±0.06)
0.86
(±0.01)
0
The Nyquist representations illustrated on Figure 4-2, 4-3 and 4-4 show that the charge transfer
resistance before interaction is highly affected by the adsorption procedure. Indeed, this
parameter is increased by a factor 5 between coadsorption and two-step adsorption and by a
factor 3500 for the peptide alone. Major differences in the electron transfer behaviour of the
[Fe(CN)6]3-/4- redox couple have already been observed in this work on the basis of the cyclic
voltammograms of the various layers presented on Figure 3-12. It has been seen that one-step
coadsorption of peptide and MCB leads to a more reversible behaviour of the electron transfer
compared to a two-step adsorption whereas it is totally inhibited when the peptide is
immobilised alone. AFM measurements have confirmed that the thickness of the layer increases
Page 97
Chapter 4 Elaboration of a p53 peptide-based transducer
for the detection of the protein MDM2
81
respectively according to the ascending order coadsorption, two-step adsorption, and peptide
alone. The values of Y0 of the Qdl element of the equivalent circuit, which is higher for the
peptide alone compared to both mixed layers indicating a higher capacity of the layer, further
support this hypothesis. Furthermore, chronocoulometric measurements carried out on a
peptide layer in the presence of [Ru(NH3)6]3+ has given a charge density of the adsorbed
complex twice higher than for a two-step adsorption layer.
The analysis of the results, presented on Figure 4-2, 4-3 and 4-4, indicates that the charge
transfer resistance in the presence of a coadsorbed layer of Ap-cys-p53/MCB (2/3) reaches 0.69
kΩ prior to detection. After contact with 5 nM MDM2, a slight increase to 0.86 kΩ is observed.
This higher value is probably related to the interaction between the probe and the MDM2
protein which further hinders the access of the redox couple to the electrode surface. Although
an observable modification of the charge transfer resistance is observed after interaction with a
5 nM solution of MDM2 for a coadsorbed layer, the amplitude of this variation is not enough
to allow the detection of lower concentrations of the peptide.
It can also be observed that the interaction of a two-step adsorbed probe with a 5 nM solution
of MDM2, does not lead to significant modification of the shape of the impedance spectra
shown on Figure 4-3. This is confirmed by the analysis in terms of electrical equivalent circuit
since only a decrease of 6 % (from 3.74 kΩ to 3.51 kΩ) is observed. These results indicate that
the two-step adsorption of the probe is unable to provide a good sensitivity for the detection of
MDM2.
On the contrary, it is impressive to note on Figure 4-4 that the interaction of the MDM2 target
protein with a layer of peptide alone leads to a massive drop in the charge transfer resistance
indicating that the electron transfer is facilitated after interaction. Indeed, the charge transfer
resistance varies from 2430 kΩ before interaction to 810 kΩ after interaction which corresponds
to a 67 % decrease. This variation may be explained by a reorientation of the p53 peptide probe
upon interaction with MDM2. Indeed, in the absence of a diluent thiol, the presence of non-
specific interactions between the peptide probe and the gold surface is very likely. Upon
interaction with MDM2, the peptide probe could take an upright conformation to interact with
the target. The transition from a random structure to a α helix of the p53 transactivation domain
upon interaction with MDM2 has been extensively studied [137, 144]. From these results, the
detection mechanism based on the release of the electron transfer of a layer exclusively
composed of peptide upon interaction with MDM2 seems the most promising. This prospect
which is quite unusual since mixed layers are widely used and promoted in the literature could
lead to many possibilities for the detection of proteins.
Prior to the testing of the Ap-cys-p53 based sensor, we will try to identify whether the
signal modification is really related to the interaction with the target protein. Indeed, the
observed decrease in signal could also be related to the replacement of the peptide probe by the
target protein, which also presents cysteine residues able to form a covalent bond with gold, or,
to the removal of the non-specifically adsorbed peptide upon interaction. In the following
Page 98
Chapter 4 Elaboration of a p53 peptide-based transducer
for the detection of the protein MDM2
82
section, we will therefore present the behaviour of the MDM2 target protein at a bare gold
electrode in order to validate or not the use of a monolayer exclusively composed of the peptide
probe as a transducer for the detection of MDM2.
4.3 Behaviour of the MDM2 protein on gold and at Ap-
cys-p53 modified gold electrodes
Figure 4-5 shows the reductive desorption curve recorded on a gold electrode that has been
modified with the MDM2 protein overnight. While sweeping from 0.00 V to -0.80 V, the
occurrence of a reduction peak at -0.59 V is observed during the first scan. This indicates that
the protein can covalently bind to gold. Indeed, the protein contains cysteine residues allowing
the formation of a sulphur-gold bond. While scanning back to more positive potentials, a small
oxidation peak appears at -0.51 V. As it has been seen in section 3.2, the smaller intensity of
the oxidation peak compare to the reduction peak can be explained by the diffusion of a large
amount of protein to the bulk upon desorption before the potential allowing a re-adsorption is
reached. Therefore, only the proteins remaining in the vicinity of the gold surface will be re-
adsorbed.
-0.8 -0.6 -0.4 -0.2 0.0
-20
-15
-10
-5
0
5
First cycle
j /
µA
.cm
-2
E vs Ag|AgCl / V
Figure 4-5: Cyclic voltammogram of a polycrystalline gold electrode modified overnight by
MDM2 recorded in 10 mM Tris-HCl-pH 7.4; υ = 50 mV s-1.
Figure 4-6 shows an impedance spectrum of a gold electrode modified overnight by MDM2
recorded in the same conditions as earlier. Contrary to the results obtained on a one component
Ap-cys-p53 layer, the charge transfer resistance, obtained by analysing the data according to a
Randles equivalent circuit, reaches 3.2 kΩ, a value 80 times lower than that obtained for the
peptide layer indicating a much faster electron transfer process. As it has been shown on Figure
Page 99
Chapter 4 Elaboration of a p53 peptide-based transducer
for the detection of the protein MDM2
83
4-4, the charge transfer resistance strongly decreased after the recognition event. This might
indicate that the protein MDM2 removes the peptide layer. However, the charge transfer
resistance remains 17 times higher, after interaction, than that of a gold electrode modified by
the MDM2 protein. These observations indicate that the variation observed in the charge
transfer resistance of an Ap-cys-p53 alone monolayer upon contact with MDM2 cannot be
simply explained by the replacement of the peptide probe by MDM2.
0 1000 2000 3000 4000 5000 6000 7000
0
1000
2000
3000
4000
5000
6000
7000
-Z''
/ ohm
Z' / ohm
Figure 4-6: Impedance spectrum of a MDM2 monolayer on gold electrode in 0.05 M
phosphate buffer – pH 7.4 in the presence of 5 10-3 M [Fe(CN)6] 3-/4- 1/1 at + 0.20 V.
Reductive desorption experiments, whose associated voltammetric curves are presented on
Figure 4-7, carried out in the presence of an Ap-cys-p53 layer (a) and on an Ap-cys-p53 layer
after 10 minutes of contact with a 5 nM MDM2 solution (b), have confirmed the remaining
presence of the peptide probe after the recognition event. Indeed, by sweeping the potential
from 0.00V to -0.80 V, a first peak appears at -0.59 V followed by a second small peak at -
0.72V. The comparison with Figure 4-5 and Figure 4-7(b) allows the association of the first
peak with MDM2 and of the second with the peptide probe. These data give direct evidence for
the adsorption of MDM2 at the peptide modified electrode and, suggest that the peptide remains
present at the surface after interaction.
Page 100
Chapter 4 Elaboration of a p53 peptide-based transducer
for the detection of the protein MDM2
84
-0.8 -0.6 -0.4 -0.2 0.0-10
-8
-6
-4
-2
0
-0.8 -0.6 -0.4 -0.2 0.0
-8
-4
0(a)
j /
µA
.cm
-2
E vs Ag|AgCl / V
(b)
j /
µA
.cm
-2
E vs Ag|AgCl / V
Figure 4-7: Linear sweep voltammetry of a Ap-cys-p53 modified gold electrode before (a)
and after (b) 10 minutes contact with 5 nM MDM2 in 10 mM Tris-HCl – pH 7.4,
υ = 50 mV s-1.
To further support this statement, we carried an experiment where the Ap-cys-p53 probe
layer was replaced by its fluorescently-labelled equivalent. To evidence the absence of
replacement of our peptide probe by the MDM2, we proceeded to the reductive desorption of
the Ap-cys-p53-fluo layer after 10 minutes contact with 5 nM MDM2. Electrochemical
impedance measurements were similar for fluorescently labelled or not probes.
Figure 4-8 presents the capacitance and mean fluorescence on a full image as a function of the
applied potential. Prior to the desorption of the layer, no fluorescence is observed since the
adsorbed labelled biomolecules undergo quenching by the gold surface. Upon desorption, the
quenching is no longer effective and a fluorescence signal is recorded. This phenomenon will
be described in further details later in this work. Although the increase in capacitance,
witnessing the desorption of the adsorbed biomolecules, can be correlated to the presence at the
electrode of both MDM2 and p53, the observed increase in fluorescence observed can only be
due to the fluorescently labelled p53 probe. A first increase appears between -0.40 V and -0.70
V and can be associated to the two small peaks observed on Figure 4-7(a) corresponding to the
desorption of the peptide. This indicates that the probe remains on the gold surface after the
Page 101
Chapter 4 Elaboration of a p53 peptide-based transducer
for the detection of the protein MDM2
85
interaction with the target protein. The second increase appearing at about -1.25 V is probably
due to the reduction of the electrolyte.
-1.4 -1.2 -1.0 -0.8 -0.6 -0.4 -0.20
1
2
3
4
5
-1.4 -1.2 -1.0 -0.8 -0.6 -0.4 -0.2
1000
1100
1200
1300
1400
1500 (b)
C /
µF
E vs Ag|AgCl / V
(a)
Mea
n f
luore
scen
ce i
nte
nsi
ty /
a.u
.
E vs Ag|AgCl / V
Figure 4-8: Capacitance-potential (a) and mean fluorescence-potential (b) curves of a Ap-cys-
p53-fluo modified electrode after 10 minutes contact with 5 nM MDM2 recorded in 10 mM
phosphate buffer-pH 7.4.
Page 102
Chapter 4 Elaboration of a p53 peptide-based transducer
for the detection of the protein MDM2
86
4.4 Quartz crystal microbalance measurements
As electrochemical measurements give indirect evidence of the interaction, the interaction
process has also been followed by a non-electrochemical technique, namely by quartz crystal
microbalance measurements, to validate the strategy presented above. Indeed, quartz resonators
are often used as mass sensors, to monitor molecular recognition events in biological sensors,
since it is able to transform a mass intake of an analyte into an electrical signal. It has, for
example, been used to monitor hybridisation events, lipid-protein interactions at lipid
membranes, DNA aptamers-protein interactions or the adsorption of proteins at functionalised
interfaces [179, 180, 181, 182]. Therefore, QCM appears as a suitable technique for the
validation of our detection strategy.
We performed measurements on Ap-cys-p53 modified gold coated quartz resonators to
measure how the mass load is influenced upon contact with MDM2 but also with three non-
specific proteins as negative control namely, bovine serum albumin, fibrinogen and cytochrome
c. Table 4-2 summarises some information relative to those proteins.
Table 4-2: Some physical properties of MDM2, BSA, fibrinogen and cytochrome c.
MDM2 BSA Fibrinogen Cytochrome c
Molecular weight 58 kDa 66 kDa 341 kDa 12 kDa
Isoelectric pH 4.6 4.7 5.4-5.5 10.0 - 10.5
Charge at pH 7.4 - - - +
As can be seen from Table 4-2, the proteins selected as negative controls vary in terms of
isoelectric pH and charge, and in terms of molecular weight. Albumin from bovine serum has
been selected because it presents a similar molecular weight and isoelectric pH compared to
MDM2. Besides, this protein is present in large amount in serum which makes it a major
potential interfering agent. BSA is also often used as a model system for protein adsorption and
is even used as an antifouling agent in the preparation of ELISA devices [183]. Fibrinogen was
selected because of its bigger size and its ability to adsorb on various substrates upon blood
contact which makes it a key factor in the determination of heamocompatibility of a material
[184]. Finally, cytochrome c was selected for its high isoelectric pH which makes it positively
charged at the working pH of 7.4. Indeed, since the peptide is negatively charged, the use of a
positively charged protein as negative control will allow to study whether the charge of the
protein influence the electrochemical impedance measured signal.
A 20 µM Ap-cys-p53 solution was immobilised overnight on the gold crystal in 1 M phosphate
buffer – pH 7.4. The crystal was then placed in a flow cell and rinsed by the same buffer before
Page 103
Chapter 4 Elaboration of a p53 peptide-based transducer
for the detection of the protein MDM2
87
injection of a 5 nM protein solution. Once the whole solution has gone through the flow cell,
the crystal is rinsed again with the buffer. Figure 4-9 presents the data obtained with both
MDM2 and negative control proteins.
0 250 500 750 1000 1250 1500 1750
-0.15
-0.10
-0.05
0.00
0.05
0.10
1 M Phosphate
Buffer
Injection
Fibrinogen
m
/ µ
g
t / s
MDM2
BSA
Fibrinogen
Cytochrome c
Injection
MDM2
1 M Phosphate
Buffer
Figure 4-9: Variation in mass of the Ap-cys-p53 modified gold coated quartz crystal (10
MHz) after contact with a 5 nM solution of MDM2 ( ), BSA ( ), Fibrinogen ( ) or
Cytochrome c ( ) in 1 M phosphate buffer – pH 7.4.
It can be seen from Figure 4-9 that only MDM2 induces an increase in mass whereas BSA,
fibrinogen and cytochrome c induce a mass decrease. The increase in mass upon contact with
MDM2 is easy to understand since it is the expected behaviour upon recognition. However, the
behaviour observed for negative controls has to be looked into further details since non-specific
adsorption of these proteins should have led to the opposite effect.
It is interesting to note that upon rinsing with the buffer after contact with the negative controls,
the mass tends to its initial value indicating that the decrease does not actually correspond to a
mass loss. This behaviour is probably due to the change of solution that occurs upon injection
of the solution containing the negative control protein and might be related to a viscosity effect.
Indeed, through the preparation of the protein solution a 5 % dilution of the 1 M phosphate
buffer is introduced since proteins are initially dissolved in 20 mM Tris-HCl. This dilution is
presumed to sufficiently modify the viscosity of our solution so that a modification of the
frequency appears upon injection of the protein solution.
Kanazawa and Gordon predicted the influence of the viscosity of the media on the frequency
of vibration of the quartz [185, 186]. The variation in frequency is given by equation 4.5:
Page 104
Chapter 4 Elaboration of a p53 peptide-based transducer
for the detection of the protein MDM2
88
∆𝑓 = −𝑓03/2
√𝜂𝑠𝜌𝑠
𝜋𝜇𝑞𝜌𝑞 (4.5)
with f0 the fundamental frequency of the free dry crystal, ηs the kinematic viscosity of the
solution; ρs the volumetric mass density of the solution; µq the shear modulus of the quartz and
ρq volumetric mass density of the quartz. This relation was experimentally verified by
Bruckenstein and Shay by varying proportions in glycerol-water mixtures [187].
Figure 4-10 presents QCM data obtained upon injection of a 5 % diluted solution of 1 M
phosphate buffer. A decrease of similar amplitude to that obtained for cytochrome c and
fibrinogen is observed confirming the hypothesis of a viscosity effect.
0 200 400 600 800 1000 1200 1400 1600-0.12
-0.10
-0.08
-0.06
-0.04
-0.02
0.00
0.02 1 M phosphate buffer
m
/ µ
g
t / s
5 % diluted
1 M phosphate buffer
Figure 4-10: Influence of the viscosity of the media on the variation in mass measured by
quartz crystal microbalance.
All four protein solutions presenting the same dilution factor, as they were prepared according
to a very same procedure, it appears that the change in mass observed for cyctochrome c and
fibrinogen originates from the variation in viscosity rather than from an effect of protein
interaction since it presents a similar variation as that recorded by injection of a diluted solution.
Besides, we assume that the smaller decrease observed for BSA might be due to some non-
specific adsorption of this protein that would be hidden by the influence of the viscosity. This
is not surprising since it presents similar isolelectric pH and molecular weight to MDM2. It
appears that only the interaction of our target protein, MDM2 with the probe, is sufficient
enough to overcome the viscosity effect.
Page 105
Chapter 4 Elaboration of a p53 peptide-based transducer
for the detection of the protein MDM2
89
From the data presented on Figure 4-9, an increase in mass of about 0.05 µg is recorded
indicating an adsorption of 2.5 1012 molecules cm-2, corresponding to a projected area per
MDM2 of 4000 Ų. It is important to keep in mind that this value is probably underestimated
since the variation in mass obtained by QCM measurements is affected by the viscosity effect.
A variation in mass of 0.15 µg is probably more accurate and corresponds to 7.6 1012
molecules cm-2 and a projected area of 1300 Ų per MDM2.
From chronocoulometric measurements carried out on a layer exclusively composed of
Ap-cys-p53, in the presence of [Ru(NH3)6]3+ complex, a density of adsorbed charge of 12 µC
cm-2 has been recorded. Assuming a one-to-one ratio between the complex and the peptide
probe, a density of adsorbed probe of 7.5 1013 molecules cm-2 has been evaluated. From these
data, considering a variation in mass corrected by the viscosity effect of 0.15 µg, a ratio of 1
MDM2 protein for 10 Ap-cys-p53 probes has been reached.
Page 106
Chapter 4 Elaboration of a p53 peptide-based transducer
for the detection of the protein MDM2
90
4.5 Analytical performance
4.5.1 Impact of the concentration of MDM2 on the signal
In the previous section, we showed that incubation of a monolayer exclusively composed
of the p53 aptamer with a solution containing the MDM2 protein led to significant modification
of the charge transfer resistance. To evaluate whether this strategy can be implemented for
biosensing, we have to assess its analytical performance.
To evaluate the recognition properties of the system, in terms of sensitivity and selectivity,
we have performed electrochemical impedance spectroscopy on Ap-cys-p53 aptamer modified
gold electrodes before and after exposing the electrode to various MDM2 concentrations. As
shown on Figure 4-11, the electron transfer which is highly inhibited before interaction, already
partially recovers at concentrations of protein as low as 10 pM.
0 500 1000 1500 2000 2500 3000
0
500
1000
1500
2000
2500
3000
0 nM
0.005 nM
0.01 nM
0.02 nM
0.05 nM
0.07 nM
0.1 nM
0.2 nM
0.5 nM
0.7 nM
1 nM
2 nM
5 nM
7 nM
10 nM
-Z''
/ kohm
Z' / kohm
Figure 4-11: Nyquist plots of impedance data recorded before (■) and after 10 minutes
contact with various concentration of MDM2 in 50 mM phosphate buffer- pH 7.4 in the
presence of 5 mM [Fe(CN)6]3-/4- 1/1 at + 0.20 V.
The changes of resistance are calculated according to equation 4.6:
∆𝑅𝑐𝑡 (%) =
𝑅𝑐𝑡𝑝53+𝑀𝐷𝑀2 − 𝑅𝑐𝑡
𝑝53
𝑅𝑐𝑡𝑝53 × 100 (4.6)
Page 107
Chapter 4 Elaboration of a p53 peptide-based transducer
for the detection of the protein MDM2
91
with 𝑅𝑐𝑡𝑝53 the charge transfer resistance before recognition and 𝑅𝑐𝑡
𝑝53+𝑀𝐷𝑀2 after incubation in
the MDM2 solution.
The charge transfer resistance decreases as the concentration in MDM2 increases until reaching
a roughly constant value above 1 nM (Figure 4-12).
0 2000 4000 6000 8000 10000
-80
-60
-40
-20
0
R
ct /
%
[MDM2] / pM
Figure 4-12: Calibration plot showing the change in charge transfer resistance as a function of
different concentrations of MDM2 (n=4).
Figure 4-13: Modification of the charge transfer resistance (∆Rct) with the log of MDM2
concentration (n=4).
1.0 1.5 2.0 2.5 3.0-90
-80
-70
-60
-50
-40
-30
-20
-10
0
R
ct /
%
log[MDM2] / pM
Page 108
Chapter 4 Elaboration of a p53 peptide-based transducer
for the detection of the protein MDM2
92
The analytical sensitivity, measuring the ability of the method to discriminate small variations
in the analyte concentration, is given by:
𝛾 = 𝑚/𝑠𝑆 (4.7)
with γ the analytical sensitivity, m the slope of the calibration curve and ss, the standard
deviation of the measurement.
A linear relationship between ∆Rct and logarithmic value of MDM2 concentration was found in
the range of 10 to 1000 pM (0.58 ng mL-1 to 58 ng/mL) as shown on Figure 4-13. This semi-
logarithmic representation is typical of the calibration curves associated with the binding
between a protein and a ligand. This representation leads to a characteristic S-shaped curve
which central part is linear and allows quantification. At a concentration of 100 pM, which is
the one presenting the highest standard deviation, an analytical sensitivity of 2 has been
calculated.
4.5.2 Negative controls
To confirm that the modifications in charge transfer resistance of the impedance curves
arise from the specific interaction between Ap-cys-p53 and MDM2, and to evaluate the
selectivity of the recognition, control experiments were performed. These measurements will
allow the determination of a realistic limit of detection of the method. To do so, the same non-
specific proteins as for quartz microbalance measurements have been used: bovine serum
albumin, fibrinogen and cytochrome c.
Figure 4-14 presents the impedance data obtained before and after interaction of the probe with
(a) BSA, (b) fibrinogen and (c) cytochrome c. Impedance spectra were recorded before and
after 10 minutes contact with 5 nM solutions of each of the three non-specific proteins.
Page 109
Chapter 4 Elaboration of a p53 peptide-based transducer
for the detection of the protein MDM2
93
0 50 100 150 200 250 300 350
0
50
100
150
200
250
300
350 Before BSA
5 nM BSA
-Z''
/kohm
Z' / kohm
(a)
0 50 100 150 200 250 300 350
0
50
100
150
200
250
300
350 Before fibrinogen
5 nM fibrinogen
-Z''
/ kohm
Z' / kohm
(b)
Page 110
Chapter 4 Elaboration of a p53 peptide-based transducer
for the detection of the protein MDM2
94
0 500 1000 1500 2000 2500 3000 3500
0
500
1000
1500
2000
2500
3000
3500
-Z''
/ kohm
Z' / kohm
Before cytochrome c
5 nM cytochrome c(c)
Figure 4-14: Impedance spectra of a Ap-cys-p53 modified electrode before (■) and after (●)
10 minutes contact with 5 nM BSA (a), Fibrinogen (b), Cytochrome c (c), measured in 0.05
M phosphate buffer – pH 7.4 – 5 10-3 M [Fe(CN)6] 3-/4- 1/1.
From the control data presented on Figure 4-14, we observe a small decrease
(ΔRct = 15.4 ± 0.8 % ; n=3) of the charge transfer resistance after contact with solutions of the
three non-specific proteins compared to that obtain for a same concentration in MDM2. This
supports the assumption according to which the reduction in charge transfer resistance recorded
upon exposure of the Ap-cys-p53 modified gold electrode to various concentrations of MDM2
is related to a specific binding of the protein to its probe. From these data, we can extract the
limit of detection (LOD), within a confidence limit of 99.7 %, corresponding to the lowest
quantity of a substance that can be distinguished from the absence of that substance, according
to equation 4.8:
𝐿𝑂𝐷 = 𝑆�̅�𝑐 + 3𝑠𝑛𝑐 (4.8)
where 𝑆�̅�𝑐 is the mean of the variation of charge transfer resistance in percentage of the negative
control signals and snc its standard deviation. The limit of detection has been based on the
negative controls rather than the blank because of its higher relevance. Indeed, contrary to non-
specific proteins, no interfering signal is expected upon contact with buffer solution.
The limit of quantification (LOQ) can also be determined according to the relation:
𝐿𝑂𝑄 = 𝑆�̅�𝑐 + 10𝑠𝑛𝑐 (4.9)
Page 111
Chapter 4 Elaboration of a p53 peptide-based transducer
for the detection of the protein MDM2
95
A limit of detection of 12 pM, corresponding to 0.69 ng mL-1 and a limit of quantification of
19 pM, corresponding to 1.08 ng mL-1 have been obtained.
ELISA (enzyme-linked immunosorbent assay) is a common technique used to identify the
presence of biomolecules as antibodies, antigen or protein in a sample. The information
gathered on performances offered by various ELISA kits indicate a detection range being, at
best, between 0.156 ng mL-1 and 20 ng mL-1 and a limit of detection reaching 0.053 ng mL-1
[188]. The detection range of 1.08 to 58 ng mL-1 and LOD of 0.69 ng mL-1 obtained with this
transducer, indicates that the impedimetric detection, based on the immobilisation of a peptide
aptamer, elaborated in this work, can compete with the performance of an ELISA kit.
Furthermore, the detection is much faster. Indeed, an ELISA analysis takes about 45 minutes
against 15 minutes in our case. The new strategy, considered in this work, appears very
promising and opens a wide range of possibilities in the sensing of other proteins since the
technique is based on the immobilisation of a peptide allowing the interaction with a target
protein.
Page 113
Chapter 5 Fluorescence microscopy study of self-
assembled monolayers of the peptide aptamer probe on gold
97
Chapter 5. Fluorescence microscopy study of self-
assembled monolayers of the peptide aptamer probe on
gold
It has been demonstrated, in the previous chapters, that different adsorption procedures
lead to different electrochemical behaviours both in the presence of positively and negatively
charged redox marker. More surprisingly, it has also been shown that the most suitable
transducer, with respect to the considered strategy, is the one exclusively composed of the
peptide.
As electrochemistry only provides average information on what is happening at the electrode
surface, we propose, in the following section, to examine, at a localised scale, the organisation
of the layers according to the various adsorption procedures considered in this work. To do so,
in situ epifluorescence microscopy under potential control, a unique technique able to give
simultaneously localised and average information on the monolayers characteristics, will be
considered.
5.1 Fluorescence Spectroscopy
5.1.1 General principles
The fluorescence phenomenon corresponds to the re-emission of an absorbed photon
without modification of the spin of the electron as the transition occurs between a singlet excited
state and a singlet ground-state. The emission rates of fluorescence are about 108 s-1,
corresponding to a fluorescence lifetime of 10 ns. A Jablonski diagram represents the various
molecular processes that can occur after the absorption of photons as shown on Figure 5-1.
Page 114
Chapter 5 Fluorescence microscopy study of self-
assembled monolayers of the peptide aptamer probe on gold
98
Figure 5-1: A Jablonski diagram showing the transitions between energy levels [189].
It can be seen on the Jablonski diagram that the energy of emission is lower than the energy
of absorption meaning that fluorescence occurs at longer wavelengths. This phenomenon
originates in the fact that a molecule can be excited at any vibrational state. In solution, this
excess of energy is lost through collisions between the excited molecules and those composing
the solvent. Therefore, a transition in fluorescence always originates from the lower vibrational
level of the excited state. A superimposition in the absorption and emission spectra is only
observed in the range of wavelengths corresponding to the lines of resonance which are
associated with a transition between the lowest vibrational levels of the excited and ground
states.
For most fluorophores, the emission spectrum is the mirror image of So → S1 absorption,
not of the total absorption spectrum. The symmetry is caused by the fact that transitions between
same vibrational energy levels are involved in both the absorption and emission processes. For
most fluorophores, these energy levels are not significantly altered by the different electronic
distributions of So and S1. Indeed, if the peaks associated with the absorption of a fluorophore
are due to transitions from the 0th vibrational state of the ground state So to higher vibrational
levels of the excited state S1, the emission can return to any of the vibrational state of the ground
state. Furthermore, the vibrational energy difference being similar in both So and S1, the
vibrational energy difference is the same in both emission and absorption spectra. All the
transitions occur without change in the position of the nuclei according to the Franck-Condon
principle, if the probability of a transition between the 0th and the 1st vibrational levels is largest
in absorption, the same is true in emission. This mirror-image rule is illustrated on Figure 5-2.
Page 115
Chapter 5 Fluorescence microscopy study of self-
assembled monolayers of the peptide aptamer probe on gold
99
Figure 5-2: Mirror-image rule [190].
5.1.2 Fluorescence quenching
An excited molecule can return to the ground state through various successive processes.
Knowing that the excited molecules not only relax to the ground state through radiative
processes but also via non radiative processes, two major parameters are considered to
characterise a fluorophore, the fluorescence lifetime and the quantum yield.
The fluorescence quantum yield is defined as the fraction of excited molecules that return
to the ground state S0 with emission of fluorescence photons. In other words, the fluorescence
quantum yield is the ratio of the number of emitted photons (over the whole duration of the
decay) to the number of absorbed photons and is given by:
Φ =
𝑘𝑟
𝑘𝑟 + 𝑘𝑛𝑟 (5.1)
where kr and knr are respectively the rate constant for radiative deactivation of the fluorophore
and its rate constant of non radiative decay to S0.
The lifetime is defined as the time spent by a molecule in the excited state before it returns
to the ground state and is given by:
𝜏 =
1
𝑘𝑟 + 𝑘𝑛𝑟 (5.2)
Page 116
Chapter 5 Fluorescence microscopy study of self-
assembled monolayers of the peptide aptamer probe on gold
100
In the absence of non radiative processes, the natural or intrinsic lifetime of the fluorophore
is expressed by:
𝜏0 =
1
𝑘𝑟 (5.3)
The most favourable path being the one that minimises the lifetime of the excited state, if
the kinetics of the non radiative process is favoured, the intensity of fluorescence will be
minimised or even suppressed. This decrease in fluorescence intensity is called “quenching”.
Among the non radiative processes, the internal conversion describes intermolecular processes
allowing a molecule to return to a lower electronic state without light emission. This
phenomenon occurs when two energy levels are close enough to present vibrational levels of
same energy. In general, this process is more likely than fluorescence from a higher excited
state. In the Jablonski diagram presented on Figure 5-1, this process is illustrated between the
vibrational levels of the excited states S2 and S1.
Another quenching mechanism, which occurs from the first singlet excited state S1 to the first
triplet state T1, is intersystem crossing, possible thanks to spin-orbit coupling. The efficiency
of this coupling varies with the fourth power of the atomic number, so that intersystem crossing
is favoured by the presence of a heavy atom.
A third process is the collisional quenching which occurs when an excited molecule is
deactivated upon contact with the solvent or other solutes. Many molecules can act as
collisional quenchers such as oxygen, halogens, and amines. The decrease in fluorescence
associated with this process is well described by the Stern-Volmer equation:
𝛷0
𝛷=
𝐼0
𝐼= 1 + 𝐾𝑆𝑉[𝑄] = 1 + 𝑘𝑞𝜏[𝑄] (5.4)
where I and I0 are the steady-state fluorescence intensities in presence and absence of quencher,
KSV is the Stern-Volmer quenching constant which expresses the sensitivity of the fluorophore
to a quencher, kq is the bimolecular quenching constant, τ lifetime in absence of quencher and
[Q] the quencher concentration. It is interesting to note that KSV-1 is the concentration at which
50 % of the intensity is quenched.
Page 117
Chapter 5 Fluorescence microscopy study of self-
assembled monolayers of the peptide aptamer probe on gold
101
5.1.3 Förster Resonance Energy Transfer
In the context of this work, we will take advantage of the quenching of the fluorescence of
excited molecules placed in the vicinity of a metal surface to study the assembly of fluorescently
labelled peptide molecules on gold. This property of quenching by a metal is often associated
with resonance energy transfer.
Whereas quenching results in the dissipation of the energy as heat, resonance energy transfer
(RET) decreases the intensity of the donor (fluorophore) and transfers the energy to the
acceptor, which can be fluorescent or not, through dipole-dipole coupling. This phenomenon
occurs when the emission spectrum of the donor overlaps with the absorption spectrum of the
acceptor (A) so that several vibronic transitions in the donor (D) have practically the same
energy as the corresponding transitions in the acceptor. Such transitions are couple, i.e. are in
resonance. During a RET process, the electron in the excited state of the donor returns to the
ground state while simultaneously an electron in the acceptor goes from the ground state into
an excited state orbital. There is no emission of light by the donor. If the acceptor is fluorescent,
light will be emitted by the acceptor, if not the energy will be released as heat. Unlike collisional
quenching, RET does not require a contact between the donor and acceptor. The distance at
which RET reaches 50 % of efficiency is called the Förster distance. The RET efficiency (ΦT)
depends on the distance between the donor and acceptor and the extent of spectral overlap, and
is given by:
𝛷𝑇 =
𝑘𝑇(𝑟)
1𝜏𝐷
+ 𝑘𝑇(𝑟)
(5.5)
with the rate constant for transfer between a donor and an acceptor at distance r,
𝑘𝑇(𝑟) =
1
𝜏𝐷(
𝑅0
𝑟)
6
(5.6)
where τD is the excited-state lifetime of the donor in the absence of transfer, r is the center-to-
center distance between D and A, and R0 is the Förster critical radius (distance at which transfer
and spontaneous decay of the excited donor are equally probable, i.e. 𝑘𝑇 =1
𝜏𝐷).
Therefore, for a single donor-acceptor pair,
𝛷𝑇 =
𝑅06
𝑟6 + 𝑅06 (5.7)
Page 118
Chapter 5 Fluorescence microscopy study of self-
assembled monolayers of the peptide aptamer probe on gold
102
It is interesting to note that RET is efficient over long distances (up to 10 nm) whereas
quenching is efficient at very short distance (few Angströms). Therefore, RET has been
commonly used to evaluate the distance between sites in proteins but also between two proteins
[191, 192].
5.1.4 Fluorescence near metal surface
When an excited fluorescent molecule is placed in the vicinity of a metal surface, its
lifetime can be substantially altered due to the reflection and absorption at the surface. It has
been shown that for large distances from the metal surface, the fluorescence lifetime oscillates
as a function of the distance while for small distances, the lifetime tends towards zero [193]. In
this section, we will consider the phenomenon taking place in the vicinity of the surface that
finds its origin in the non radiative transfer of energy from the excited molecule to the metal.
The emitting molecule acts as an oscillating dipole near a partially absorbing and partially
reflecting surface which can be a very thin metal film as described by Kuhn [194].
This scenario will give electrochemistry a useful tool to study the organisation resulting from
the assembly process of thiolated fluorescent biomolecules on gold electrodes. Indeed, the
immobilised fluorescent biomolecules will act as emitter whereas the gold substrate will play
the role of acceptor.
The transfer of energy from an emitter molecule D to an acceptor A can be treated by
calculating the rate of absorption by the acceptor kT in the field of the emitter to estimate how
the luminescence of the emitter D is quenched by the acceptor A. The amount of quenched
luminescence of the emitter can be expressed as the ratio between the quantum yield of the
emitter in the absence of an acceptor, Φ0 and the quantum yield of the emitter when the acceptor
is located at a distance r from it, Φr.
This relation in terms of the power loss of D, in the absence of A (P0) and the power absorbed
by A in its presence (P), is written as:
𝛷0
𝛷𝑟= 1 +
𝑃
𝑃0 (5.8)
with, the power radiated by the dipole emitter is:
𝑃0 = µ02𝜔4𝑛/3𝛷0𝑐³ (5.9)
Page 119
Chapter 5 Fluorescence microscopy study of self-
assembled monolayers of the peptide aptamer probe on gold
103
with µ0 the amplitude of the dipole moment, ω the angular velocity, n the refractive index of
the medium, c the speed of light and 𝛷0 the quantum yield of the dipole emittor in the absence
of acceptor.
If we look at a thin metal absorbing layer of absorbance A for a light of angular velocity
ω, the average rate of energy absorption of an area dxdy of the metal, when irradiated with light
of intensity I striking area with normal incidence, we have:
𝑑𝑃 = 𝐴𝐼𝑑𝑥𝑑𝑦 = 𝐴 (𝑐𝑛
8𝜋) 𝐹0
2𝑑𝑥𝑑𝑦 (5.10)
with Fo, the amplitude of the electric field.
Let us now replace the incident light beam by the field of a dipole D at a point x,y of the
absorbing metal layer, oscillating in the z direction, perpendicular to the metal absorbing layer
and at a distance r above it as represented on Figure 5-3.
Figure 5-3: Oscillating dipole D at a distance r from an absorbing metal layer.
Assuming that the layer only interacts with the component of the field oscillating in the plane
of the layer with an amplitude F0, we obtain the power absorbed by the acceptor:
𝑃 = 𝐴
1
16 (𝑐𝑛)𝜇0
2 (𝜔4
𝑐4) [
3
2 (
𝜆
2𝜋𝑛𝑟)
4
+ (𝜆
2𝜋𝑛𝑟)
2
+ 1] (5.11)
Page 120
Chapter 5 Fluorescence microscopy study of self-
assembled monolayers of the peptide aptamer probe on gold
104
When the acceptor is located at r<<λ, the last term, which is predominant in the radiation field
region (r>>λ), can be neglected and by replacing (5.8) and (5.9) in (5.11) we have:
𝛷
𝛷𝑟= 1 + (
𝑟0
𝑟)
4
+ 𝜂 (𝑟0
𝑟)
2
(5.12)
With
𝑟0 = 𝛼 (𝜆
𝑛) (𝐴𝛷)
1
4 ; (5.13)
𝛼 = (
1
4𝜋) (
9
2)
1
4 ; (5.14)
𝜂 = (
√2
4) (𝐴𝛷)
12 (5.15)
It has been shown that the relation can be reduced at the first two terms by considering a dipole
in the x direction (parallel to the acceptor metal) with an acceptor metal interacting only with
F0 (amplitude of field component oscillating in the plane of the metal). We have then:
𝛷
𝛷𝑟= 1 + (
𝑟0
𝑟)
4
(5.16)
with r0, the Förster distance.
Figure 5-4 represents the evolution of the quenching of the luminescence of a dipole emitter by
a thin metal layer as a function of the distance for various values of the absorbance of the metal.
The values selected for the quantum yield and excitation wavelength corresponds to the
fluorescein fluorophore used in this work. A refractive index of 1.33 has been selected since all
experiments were performed in aqueous solutions.
Page 121
Chapter 5 Fluorescence microscopy study of self-
assembled monolayers of the peptide aptamer probe on gold
105
0 50 100 150 200 250 3000.0
0.2
0.4
0.6
0.8
1.0
r /
0
r / nm
A= 0.1
A= 0.25
A= 0.5
A= 0.75
A= 1
Figure 5-4: Evolution of the amount of quenched luminescence (Φr/Φ0) of a dipole emitter by
a thin metal layer acceptor as a function of the distance for various values of the absorbance
of the metal with Φ0= 0.9; λ= 521 nm; n=1.
As can be seen from Figure 5-4, the Förster distance, at which half of the fluorescence is
quenched, is of the order of a few tens of nm. This confirms that, in the context of this work,
the quenching of the fluorescence by a metal can be used as a complementary tool to study how
different procedures of immobilisation influence the organisation of the resulting self-
assembled monolayers. As the quenching by the metal operates at a distance similar to the size
of a biomolecule, a minimum of fluorescence should be observed as long as the biomolecule is
adsorbed on the surface. It has been shown by Rant et al., that upon application of a bias
potential, the orientation of DNA oligonucleotides immobilised on gold could be modulated
[195]. They evidenced that, by consecutively applying positive and negative potential to the
modified interface, respective attraction and repulsion of DNA oligonucleotides towards the
surface changed their orientation from a down to upright position allowing the study of the
interface. This flipping behaviour was followed by fluorescence measurements since an
increase in intensity was recorded while oligonucleotides stood up straight. As a result, the
study of the interface can also be performed via the reductive desorption of the biomolecular
layer under potential control. Indeed, upon desorption of the biomolecules, quenching will be
less effective, so that information can be obtained regarding the adsorbed layer [99, 104, 176,
196].
Electrochemical measurements presented in the first part of this work, such as reductive
desorption of the layer give us an insight of what is happening at the µm scale. The
Page 122
Chapter 5 Fluorescence microscopy study of self-
assembled monolayers of the peptide aptamer probe on gold
106
concentration-distance profile of the species during desorption can be described in terms of a
semi-infinite linear diffusion process. By resolving the Fick’s equations, the evolution of the
concentration as a function of time and distance from the electrode can be expressed by
equation 5.17:
𝑐(𝑟, 𝑡) =
𝛤
√𝜋𝐷𝑡 𝑒
−𝑟²4𝐷𝑡 (5.17)
With Γ the total surface concentration in thiols, D the diffusion coefficient of the desorbed
species, t the time and r the distance from the electrode surface.
Figure 5-5 presents the concentration profile as a function of the distance from the electrode for
various times considering a fast desorption. The value selected for the diffusion coefficient and
total surface concentration respectively are typical values for thiol molecules in aqueous media
and densely packed thiol monolayers.
0 100 200 300 4000
20
40
60
80
100
Conce
ntr
ati
on
/ µ
M
r / µm
5 s
10 s
20 s
50 s
100 s
500 s
800 s
Figure 5-5: Concentration profiles of a desorption at different time scales based on the
resolution of the Fick’s equations with D = 2.10-6 cm² s-1; Γ=5.10-10 mol/cm².
As can be seen on Figure 5-5, mass transport influences electrochemical data at a µm scale
from the surface, whereas the quenching properties of the metal are impacted at a nm scale from
the metal surface. Therefore, we propose to couple fluorescence microscopy and
electrochemical measurements to study in more details how the immobilisation procedure
impacts the organisation of the probe layer. Furthermore electrochemistry gives us average
information on the phenomenon occuring at the electrode surface, whereas fluorescence
microscopy will allow us to obtain some local information.
Page 123
Chapter 5 Fluorescence microscopy study of self-
assembled monolayers of the peptide aptamer probe on gold
107
In order to proceed to the experiments, the peptide probe sequence has been modified by a
fluorescent marker.
5.1.5 Fluorescence Microscopy
In fluorescence microscopy, the wavelength is selected through the use of optical filters. In
this work, the microscope will present an epifluorescence configuration, meaning that both the
excitation and emission beams are passing through the microscope objective. To observe the
fluorescence, a set of filters represented on Figure 5-6 is required. It is composed of three
combined categories of filters; excitation filters, barrier or emission filter and dichromatic
beamsplitter which spectral properties are represented respectively by the blue, red and green
curve on Figure 5-7.
Figure 5-6: Illustration of a filter cube [197].
A range of wavelengths is selected by the excitation filter from a broadband source to excite
the sample. The resulting emission is transmitted by the emission filter which rejects the
excitation wavelengths. The dichroic mirror reflects the excitation wavelength into the objective
and transmits the emission to allow it to reach the eyepiece or the detector. Figure 5-7 presents
the spectral characteristics associated with the filter cube adapted to the 5-carboxyfluorescein
fluorophore used in this work. The excitation filter, only allows the transmission of selected
wavelengths from the lamp to the specimen. In the case of the 5-carboxyfluorescein fluorophore
used in this work, excitation is allowed for wavelengths from 450 to 490 nm as shown by the
blue curve. The emission filter, playing the role of barrier, is designed to absorb the excitation
wavelengths and only allows the selected emission wavelengths, in this case from 515 nm, to
go towards the detector as represented by the red curve. The dichroic mirror reflects the
excitation wavelengths and passes emission ones from 505 nm as presented by the green curve.
The 5-carboxyfluorescein spectra are shown behind the filters curves with maximum
wavelengths of absorption and emission respectively at 492 nm and 518 nm.
Page 124
Chapter 5 Fluorescence microscopy study of self-
assembled monolayers of the peptide aptamer probe on gold
108
Figure 5-7: Spectral properties of a filter cube adapted to the 5-carboxyfluorescein
fluorophore (see text) [198].
Figure 5-8 represents a typical wide-field epifluorescence microscope on top of which stands
an electrochemical cell. A detailed description of the equipment has been presented in chapter
2. The illumination source is an arc lamp (Xe or Hg) and the excitation light passes through
collector lenses before it reaches the excitation filter which only allows the transmission of the
wavelengths corresponding to the fluorophore absorption band.
Figure 5-8: Schematic representation of a typical wide-field epifluorescence microscope
(courtesy of Dan Bizzotto).
The transmitted light then reaches the dichroic mirror, which is tilted at an angle of 45°
with respect to the incoming excitation light and reflects the illumination beam directly through
Page 125
Chapter 5 Fluorescence microscopy study of self-
assembled monolayers of the peptide aptamer probe on gold
109
the objective and focus it onto the sample. The fluorescence generated in every direction upon
excitation is gathered by the same objective used for the excitation and transmitted through the
dichroic mirror whereas most of the scattered excitation light reaching the dichroic mirror is
reflected back to the lamp.
The fluorescence finally reaches the emission filter which only allows wavelengths
corresponding to the emission band of the fluorophore and further filter the residual excitation
light that might have gone through the dichroic mirror.
The resolution of a microscope is the shortest distance at which two separated features will
still be distinguished as distinct entities. When the light emitted from the sample goes through
the objective to form an image, it does not image a point in the object as a bright disk with
defined edges but as a slightly blurred point surrounded by diffraction rings, Airy disks as
represented on Figure 5-9. This phenomenon originates in the diffraction of light that occurs
when it goes through the aperture of the objective to reach the sample. The smaller the aperture,
the higher the effect.
Figure 5-9: Illustration of the Airy disks and the Rayleigh resolution limit [199].
It is easy to distinguished two objects when they are well separated but when the distance
between the Airy disks decreases, a limit, referred to as the Rayleigh criterion, is reached. It is
defined as the distance at which the principal maximum of the second Airy disk and the first
minimum of the first Airy disk coincide. This Rayleigh criterion giving the limit of the human
eye to see two separated points is represented on Figure 5-10.
Page 126
Chapter 5 Fluorescence microscopy study of self-
assembled monolayers of the peptide aptamer probe on gold
110
Figure 5-10: Illustration of the Rayleigh criterion [200].
Page 127
Chapter 5 Fluorescence microscopy study of self-
assembled monolayers of the peptide aptamer probe on gold
111
5.2 Modification of the peptide probe for fluorescence
purposes
The fluorescent dye chosen in this work is the 5-carboxyfluorescein and its structure is
shown on Figure 5-11. Derivatives of fluorescein are often used as reagents in biological
systems since they present a high absorptivity and an excellent quantum yield (Φ=0.9). The
wavelengths of excitation and emission maxima of the 5-carboxyfluorescein molecule are
respectively 494 nm and 519 nm.
Figure 5-11: Molecular structure of 5-carboxyfluorescein.
The initial thiolated p53 aptamer has been elongated by three amino acids residues, a proline,
an alanine and a lysine, to maintain the 5-carboxyfluorescein dye away from the interaction
sequence. The lateral amine group of the lysine residue was used to attach the fluorescent dye
through the formation of an amide with the carboxyl group of the dye resulting in the following
sequence H2N-CPPLSQETFSDLWKLLPAK(5-FAM)-COOH. In the rest of the work, this
sequence will be referred to as “Ap-cys-p53-fluo”.
Page 128
Chapter 5 Fluorescence microscopy study of self-
assembled monolayers of the peptide aptamer probe on gold
112
5.3 Interfacial behaviour of peptide monolayers under
polarisation
The interfacial behaviour of monolayers under polarisation has been studied by coupling
capacitance measurements with fluorescence microscopy. Various sets of measurements have
been performed on mixed layers formed either by one-step coadsorption or two-step adsorption,
and on a single component monolayer of peptide. Figure 5-12 presents typical curves of the
measured capacitance and fluorescence intensity upon scanning the potential from +0.1 V to -
1.25 V for mixed layers of peptide and MCB prepared by two-step adsorption (left) and
coadsorption (right). Fluorescence curves are built by plotting the mean fluorescence intensity
obtained for a full image (thus encompassing only a part of the electrode) record at a specific
potential.
-1.4 -1.2 -1.0 -0.8 -0.6 -0.4 -0.2 0.0 0.20
2
4
6
8
10
12
14
-1.4 -1.2 -1.0 -0.8 -0.6 -0.4 -0.2 0.0 0.20
5
10
15
20
25
30
-1.4 -1.2 -1.0 -0.8 -0.6 -0.4 -0.2 0.0 0.20
2000
4000
6000
8000
10000
-1.4 -1.2 -1.0 -0.8 -0.6 -0.4 -0.2 0.0 0.21000
1200
1400
1600
1800
2000
2200
2400
2600
(a)
(d)(c)
C/µ
F c
m-2
E vs Ag|AgCl/V
(b)
C/µ
F c
m-2
E vs Ag|AgCl/V
I flu
o/a
.u.
E vs Ag|AgCl/V
I flu
o/a
.u.
E vs Ag|AgCl/V
Figure 5-12: Representative capacitance-potential (a,b) and fluorescence-potential (c,d)
curves recorded in 10 mM phosphate buffer-pH 7.4 at peptide/MCB (1/4) mixed SAMs
obtained by coadsorption (b,d) and two-step adsorption (a,c), υ = 20 mV s-1.
On the capacity vs potential curves, two distinct behaviours are observed according to the
adsorption procedure considered. On Figure 5-12(a), respectively corresponding to a two-step
adsorption the capacity remains constant up to around -0.7 V at which a first increase in capacity
is observed and directly followed by a second increase at -1.0 V. This obvious increase in two
Page 129
Chapter 5 Fluorescence microscopy study of self-
assembled monolayers of the peptide aptamer probe on gold
113
steps does not appear on Figure 5-12(b) for a coadsorbed layer. In this second case, the capacity
remains constant up to approximatively -0.7 V where a marked increase in the capacity is
noticed. In both cases, while scanning back the potential up to +0.1 V, the capacity slightly
decreases till -0.4 V but always remains higher than the initial value. This behaviour is
consistent with the reductive desorption of SAMs taking place at very negative potentials. Upon
desorption, the low permittivity layer of thiols is replaced by small polar water molecules,
which results in a higher capacitance. As the desorbed thiolated molecules diffuse away from
the electrode, only a small amount that remains in the vicinity of the surface can be readsorbed
while scanning to higher potentials, leading to a relatively higher capacity.
In the fluorescence vs potential curves, fluorescence signal remains constant from +0.1 V to -
0.5 V for both immobilisation procedures. At –0.50 V a massive increase in fluorescence is
observed up to -0.9 V for the two-step adsorption (Figure 5-12(c)) and -0.8 V for the
coadsorption (Figure 5-12(d)). It is interesting to notice that the fluorescence intensity observed
on Figure 5-12(c) is 4 times higher than that of Figure 5-12(d). Since the only fluorescent thiol
is the peptide probe, an insight on the relative amount of immobilised probe can be obtained.
This observation confirms the results obtained earlier by chronoucoulometric data, with the non
fluorescent probe, in the presence of [Ru(NH3)6]3+, indicating that a coadsorption procedure
leads to a lower density of probe molecules in the mixed layer. While sweeping back to the
initial potential, the fluorescence no longer change and reaches a constant minimum value.
It is important to notice that the fluorescence vs potential curves presented on Figure 5-12
correspond to the total fluorescence intensity of a full image recorded at a specified potential.
It has been showed that potential induced fluorescence variations of biomolecules SAMs at
metal electrodes can originate for two main reasons. Upon application of a potential, the
orientation of molecules can be modified. In the case of DNA, it has been shown that upon
application of more negative potentials, the negatively charged DNA straighten up as they are
subject to electrostatic repulsion from the negatively charged surface. On the other hand, they
are attracted to positively charged surfaces. This on and off fluorescence profile is reversible
and use the property of quenching by a metal to modulate the signal as a function of the applied
potential.
The second origin of fluorescence is related to the desorption of the adsorbed fluorescent
molecules upon application of a potential. As the fluorescently labelled molecules diffuse away
from the electrode surface, the quenching of the fluorescence by the metal is no longer effective,
resulting in a substantial increase in fluorescence. Unlike the first origin of fluorescence, this
phenomenon is not reversible since the monolayer is destroyed as the molecules diffuse away
from the electrode surface. Therefore, the increase in fluorescence is followed by a decrease
which is dependent on the diffusion rate.
As Figures 5-12(c) and (d) correspond to the mean fluorescence intensity of a full image
recorded at a specified potential, part of the information remains unexploited. Fluorescence
microscopy allows us to extract extra information. Figures 5-13 and 5-14 show a selection of
images recorded at various potentials, while scanning from +0.100 V to -1.250V and back to
Page 130
Chapter 5 Fluorescence microscopy study of self-
assembled monolayers of the peptide aptamer probe on gold
114
+0.100 V, at electrodes respectively modified with Ap-cys-p53-fluo/MCB (1/4) following a
two-step adsorption and coadsorption procedure. It is important to notice that the brightness
and contrast have been adjusted with respect to the first image in order to be able to see the
progressive fluorescence variation. This explains the saturation of the fluorescence signal on
some of the images.
0.1000 V vs Ag|AgCl -0.250 V vs Ag|AgCl -0.400 V vs Ag|AgCl -0.425 V vs Ag|AgCl
-0.450 V vs Ag|AgCl -0.475 V vs Ag|AgCl -0.500 V vs Ag|AgCl -0.750 V vs Ag|AgCl
-0.950 V vs Ag|AgCl -0.975 V vs Ag|AgCl -1.000 V vs Ag|AgCl -1.025 V vs Ag|AgCl
-1.125 V vs Ag|AgCl -1.175 V vs Ag|AgCl -1.175 V vs Ag|AgCl 0.100 V vs Ag|AgCl
Figure 5-13: Fluorescence images of an electrode modified by two-step adsorption with
peptide/MCB (1/4) during a reductive desorption from +0.100 V to -1.250 V. The images
(50 × objective; exposure time = 500 ms; Gain=400; Lamp intensity 30 %) are taken at
indicated potentials.
Page 131
Chapter 5 Fluorescence microscopy study of self-
assembled monolayers of the peptide aptamer probe on gold
115
0.100 V vs Ag|AgCl -0.250 V vs Ag|AgCl -0.500 V vs Ag|AgCl -0.600 V vs Ag|AgCl
-0.625 V vs Ag|AgCl -0.650 V vs Ag|AgCl -0.675V vs Ag|AgCl -0.750 V vs Ag|AgCl
-0.950 V vs Ag|AgCl -0.975 V vs Ag|AgCl -1.000 V vs Ag|AgCl -1.025 V vs Ag|AgCl
-1.125 V vs Ag|AgCl -1.150 V vs Ag|AgCl -0.900 V vs Ag|AgCl + 0.100 V vs Ag|AgCl
Figure 5-14: Fluorescence images of a coadsorbed peptide/MCB (1/4) modified electrode
during a reductive desorption from +0.100V to -1.250V. The images (50 × objective;
exposure time = 500 ms, Gain=400; Lamp intensity 30 %) are taken at indicated potentials.
On both Figures 5-13 and 5-14, the left image of the first row corresponding to the first
recorded image during the reductive desorption of the layer, we observe a coexistence of more
or less intense regions. This information is hidden within the fluorescence intensity curves as a
Page 132
Chapter 5 Fluorescence microscopy study of self-
assembled monolayers of the peptide aptamer probe on gold
116
function of the potential since it presents a mean fluorescence profile for a full image; this value
does not convey any localised information. These variations in intensity can be interpreted
according with different hypothesis. Indeed, a higher intensity can be explained by a localised
higher density of the fluorescently labelled probe on the metal surface. This distribution can
also be explained by the presence of aggregates of the fluorescent molecule on the electrode
surface. This aggregation leading to the presence of fluorescently labelled molecules further
away from the metal surface induces a lower efficiency of the quenching by the metal.
So far, the presence of heterogeneities within self-assembled monolayers has only been studied
on DNA self-assembled monolayers. It has been shown by Murphy et al., who studied the
assembly of mixed layers composed of DNA and mercaptohexanol by in situ fluorescence
microscopy under potential control, that a two-step assembly where mercaptohexanol is
adsorbed prior to the oligonucleotides leads to more homogeneous layers than the adsorption
in two steps consisting of the immobilisation of the biomolecule followed by the passivation by
an alkanethiol [99]. AFM measurements performed by Josephs and Ye have led to the same
conclusion. Moreover, they also evidenced subpopulations of probe with various levels of probe
density [103].
In our lab, using the same technique of in situ fluorescence microscopy, we studied the
interfacial inhomogeneities of DNA mixed SAMs on gold and showed that the main factors
affecting the interfacial characteristics of mixed DNA/MCB SAMs were the substrate
crystallinity and the immobilisation procedure [104].
In this thesis, we investigate, for the first time, the interfacial characteristics of peptide SAMs
by in situ fluorescence microscopy. In Figure 5-13 presenting the images associated with the
reductive desorption for a monolayer resulting from a two-step adsorption, two distinct
increases in fluorescence are noticed. A first increase in fluorescence from -0.450 V to -0.950 V
directly followed by a second increase at -1.000V are observed. While the initial increase in
fluorescence seems to originate from the entire electrode, the second increase is more localised
and seems to arise from the regions of higher intensity. This fluorescence in two steps might be
correlated with the reductive desorption which also occurs in two well distinct steps. Both in
fluorescence and capacitance curves, we observed a first increase around -0.600 V/-0.650 V
followed by a second increase at -1.000 V although there is a small shift in the potentials at
which the increases are observed. It should be noticed that the capacitance variation arises both
from the fluorescently labelled peptide and the non fluorescent mercaptobutanol desorption
although the fluorescence signal only provides from the biomolecule.
Looking at the various images recorded in the course of the reductive desorption of the layer
immobilised by a coadsorption procedure, presented on Figure 5-14, a marked increase in
fluorescence is observed at -0.600 V until -0.950 V where it starts to decrease to reach a
minimum value where less modification of the fluorescence intensity occurs. This behaviour
can easily be correlated with the electrochemical data simultaneously recorded presented at the
beginning of this section.
Page 133
Chapter 5 Fluorescence microscopy study of self-
assembled monolayers of the peptide aptamer probe on gold
117
It is also interesting to note that the zones of higher intensity observed for both films obtained
by different immobilisation procedures remains after cycling up to -1.250 V. They will be
named here as « hotspots ».
In the next sections, we propose to investigate how the fluorescence signal is influenced by the
organisation of the layer. Therefore, we will define various regions, which we will name
« regions of interest » or ROI, to study how the regions of high intensity behaves compare to
the lower ones and what are their similarities.
Page 134
Chapter 5 Fluorescence microscopy study of self-
assembled monolayers of the peptide aptamer probe on gold
118
5.4 Definition of the regions of interest
To define the regions of interest, we will have to distinguish the more intense regions from
the less intense. To do so we will use the image analysis software Image J [201].
As the image obtained through the objective is more in focus than what the real image is,
a Gaussian blur filter is applied on the image. This filter allows to reduce the focalisation to a
more reliable value. It acts on each pixel of the image and applies a convolution with a Gaussian
function for smoothing. It reduces noise and redefines the edges. The more common way to
accomplish neighbourhood averaging is to replace each pixel by the average of itself and its
neighbours. This is often described as a “kernel” operation, given that its implementation can
be generalized as the sum of the pixel values in the region multiplied by a set of integer weights.
For a Gaussian blur, the set of weights approximates the profile of a Gaussian function along
any row, column or diagonal through the centre [202].
During the reductive desorption, a succession of image is recorded as various successive fixed
potentials are applied. As regions of varying intensities can be present, we want to make sure
that it consists of actual variations and not of artefacts. Therefore, the first step is to extract the
“minimum image” of a complete stack which corresponds to the minimum of each pixels of the
whole stack of images. This procedure will allow us to remove artefacts and identify
heterogeneities as real features.
Once the image is blurred and the minimum image is defined, the brightness and contrast are
adjusted. Figure 5-15 shows the minimum image of a two-step adsorbed monolayer of Ap-cys-
p53-fluo/MCB (1/4) without (a) and with (b) the application of a Gaussian blur filter.
(a) (b)
Figure 5-15: Fluorescence image without (a) and with application of a Gaussian blur filter on
an electrode modified by a two-step adsorption with Ap-cys-p53-fluo/MCB (1/4).
Page 135
Chapter 5 Fluorescence microscopy study of self-
assembled monolayers of the peptide aptamer probe on gold
119
As the areas of higher intensity do not always present sharp outlines, they might appear as a
unique bigger spot although it is composed of a collection of smaller regions. To emphasise the
contours of these concentrated features, another filter can be applied to the image, the unsharp
mask. This filter subtracts a blurred copy of the image from the original to suppress large scale
variations to better show local details as illustrated on Figure 5-16.
(a) (b)
Figure 5-16: Fluorescence image before (a) and after application of an unsharp mask filter on
the system presented on Figure 5-15.
The image is now ready for the determination of the regions of interest. In this particular
case, we will have to define two types of regions of interests, meaning the hot spots regions and
the non-hot spots regions. Indeed, as we would like to investigate how the fluorescence signal
is distributed between the more and less intense areas, we will have to define a threshold value
to define the fluorescence intensity at which a pixel is consider as being part of a hotspot. To
do so a threshold value has to be adjusted. This requires to specify a range of brightness of
colour values that discriminate a feature from its surroundings, or using a region-growing
method in which selecting one point in the feature allows the software to include all touching
similar pixels. In this work, we decided to use a maximum entropy threshold. This algorithm,
based on the entropy of the histogram maximise the inter-class entropy. This technique is very
similar to the one of Otsu which assumes that the image contains two classes of pixels following
a bi-modal histogram and then calculates the optimum threshold separating the two classes so
that their inter-class variance is maximal [203]. The entropy of the brightness pattern is
calculated as the number of ways that the pattern could have been formed by rearrangement.
Figure 5-17 shows the histograms of the whole minimum image and of the selection of the
pixels associated with the hotspot regions via the maximum entropy threshold.
Page 136
Chapter 5 Fluorescence microscopy study of self-
assembled monolayers of the peptide aptamer probe on gold
120
1000 2000 3000 4000 5000 6000
0
5000
10000
15000
20000
25000
30000
2500 3000 3500 4000 4500 5000
0
2
4
6
8
Counts
Pixel value
Hotspots
Counts
Pixel value
Whole image
Hotspots
Figure 5-17: Histograms of the whole minimum image and of the selection of the pixels
associated with the hotspot regions via the maximum entropy threshold.
This thresholding will allow us to create two masks, one keeping only the hotspots region and
the other keeping the rest of the image. This will allow to define how the fluorescence signal is
influenced by the presence of these higher intensity regions and discriminate this contribution
from the total fluorescence profile corresponding to the whole image presented earlier on Figure
5-12. Figure 5-18 presents a mask allowing the measurement of the fluorescence corresponding
to the hotspot regions only. The complementary mask is obtained by taking the inverse of the
selection.
Figure 5-18: Creation of a mask corresponding to the hotspots regions by setting a maximum
entropy threshold.
Once both masks are created, we can select various regions of interest within the defined hotspot
and non hotspot regions and compare their respective behaviours.
Page 137
Chapter 5 Fluorescence microscopy study of self-
assembled monolayers of the peptide aptamer probe on gold
121
5.5 Reductive desorption behaviour of mixed layers
We have seen on Figure 5-12 that the reductive desorption of mixed layers of peptide and
MCB occurs in two well separated steps in the case of a two-step adsorption and in an
apparently single step in the case of a one-step coadsorption. These observations have been
confirmed by the fluorescence images recorded under polarisation and presented on Figures 5-
13 and 5-14. We have also seen that brighter areas and darker ones coexist at the surface. As a
threshold value allowing the definition of the hotspot areas has been settled, it is now possible
to investigate more deeply how these aggregates contribute to the capacitance and concomitant
fluorescence.
For each condition of immobilisation, four consecutive reductive desorption runs were
performed. During the two first reductive desorptions, the potential was scanned from +0.100
V to -1.250 V. The two subsequent cycles were recorded while scanning to more negative
potentials, respectively -1.350 V and -1.450 V. The successive curves of the capacitance as a
function of the applied potential will be interpreted concomitantly with the fluorescence
behaviour. In order to differentiate the fluorescence behaviour of the hotspots from that of the
rest of the layer, different regions of interest will be selected.
5.5.1 Case of an electrode modified by a two-step adsorption
procedure
Figure 5-19 shows four regions of interest, two of them corresponding to hotspot areas
(HS) and two others to non-hotspot areas (NHS), that have been selected and the minimum
image associated with each of the four consecutive reductive desorptions. It should be
emphasized here that, although one set of data is presented, a similar behaviour has been
observed for different experiments on multiple electrodes and for various peptide/MCB
proportions indicating that although each set has singularities, the present analysis is well
representative.
Page 138
Chapter 5 Fluorescence microscopy study of self-
assembled monolayers of the peptide aptamer probe on gold
122
1st reductive
desorption
2nd reductive
desorption
3rd reductive
desorption
4th reductive
desorption
Figure 5-19: ROIs selection and minimum images corresponding to four consecutive
reductive desorptions of a peptide/MCB (1/4) mixed SAM obtained by two-step adsorption.
Figure 5-20 shows the capacitance vs potential curves of the whole electrode (right) and
the fluorescence profiles (left), extracted from the four regions of interest selected, as a function
of the applied potential with respect to the four consecutive reductive desorptions.
A first look at Figure 5-20(a) reveals that, during the first reductive desorption, a major increase
in fluorescence of similar intensity in the four ROIs, starts more negatively than -0.500 V and
a high fluorescence peak is observed at – 0.725 V while the fluorescence decreases at more
negative potentials. However, the background fluorescence is slightly higher in the two HS
regions. Looking at the corresponding capacitance curve, we notice that the signal increases
smoothly from -0.400 V until -0.700 V where a pronounced modification of the signal is
recorded.
At -1.125 V, the fluorescence profile of the HS and NHS regions varies. A small increase in
fluorescence in the HS regions is observed in contrast to the NHS regions. At about the same
potential, the capacitance curve also shows a second variation of the signal.
Looking at Figure 5-20(b), showing the data associated with a second reductive desorption, it
appears immediately that the fluorescence signal is lower of about a factor 100 indicating that
a large amount of peptide has already been removed from the surface during the first desorption
step. This is supported by the higher capacitance recorded at the beginning of the second
reductive desorption cycle at positive potentials.
Although the intensity of the first increase is lowered by about a factor of 100, the fluorescence
corresponding to the second increase remains approximatively constant. The same behaviour is
observed during the third and fourth desorption runs although the potential is swept to more
negative value, respectively -1.350 V and -1.450 V.
From the capacitance curves, we do observe that between the first and second desorption, a
modification of the layer occurs as evidenced by the lower capacitance value between the end
of the first reductive desorption and the beginning of the second reductive desorption.
Furthermore, it appears, from the increasing initial capacitance values and the persistent two
successive fluorescence increases recorded during the four consecutive desorption runs that, the
hotspots may act as a source of peptide after the first desorption cycle.
Page 139
Chapter 5 Fluorescence microscopy study of self-
assembled monolayers of the peptide aptamer probe on gold
123
(a)
-1.4 -1.2 -1.0 -0.8 -0.6 -0.4 -0.2 0.0 0.20
5000
10000
15000
20000
25000
30000
35000M
ean
Flu
ore
scen
ce I
nte
nsi
ty /
a.u
.
E vs Ag|AgCl / V
HS 1
HS 2
NHS 1
NHS 2
-1.4 -1.2 -1.0 -0.8 -0.6 -0.4 -0.2 0.0 0.20
2
4
6
8
10
12
14
C /
µF
cm
-2
E vs Ag|AgCl / V (b)
-1.4 -1.2 -1.0 -0.8 -0.6 -0.4 -0.2 0.0 0.20
400
800
1200
1600
2000
2400
2800
3200
3600
4000
Mea
n F
luore
scen
ce I
nte
nsi
ty /
a. u.
E vs Ag|AgCl / V
HS 1
HS 2
NHS 1
NHS 2
-1.4 -1.2 -1.0 -0.8 -0.6 -0.4 -0.2 0.0 0.20
2
4
6
8
10
12
14
C /
µF
cm
-2
E vs Ag|AgCl / V
(c)
-1.4 -1.2 -1.0 -0.8 -0.6 -0.4 -0.2 0.0 0.20
400
800
1200
1600
2000
2400
2800
3200
3600
4000
Mea
n F
luore
scen
ce I
nte
nsi
ty /
a.u
.
E vs Ag|AgCl / V
HS 1
HS 2
NHS 1
NHS 2
-1.4 -1.2 -1.0 -0.8 -0.6 -0.4 -0.2 0.0 0.20
2
4
6
8
10
12
14
16
C /
µF
cm
-2
E vs Ag|AgCl / V (d)
-1.4 -1.2 -1.0 -0.8 -0.6 -0.4 -0.2 0.0 0.20
400
800
1200
1600
2000
2400
2800
3200
3600
4000
4400
Mea
n F
luore
scen
ce I
nte
nsi
ty /
a.u
.
E vs Ag|AgCl / V
HS 1
HS 2
NHS 1
NHS 2
-1.6 -1.4 -1.2 -1.0 -0.8 -0.6 -0.4 -0.2 0.0 0.20
2
4
6
8
10
12
14
16
18
C /
µF
cm
-2
E vs Ag|AgCl / V
Figure 5-20 : Representative fluorescence-potential (left) and capacitance-potential (right) curves
of hotspot and non-hotspot regions associated with four consecutive reductive desorption up to -
1.250 V (a and b); -1.350 V (c); -1.450 V (d) recorded in 10 mM phosphate buffer-pH 7.4 at
peptide/MCB (1/4) mixed SAMs obtained by two-step adsorption, υ=20 mV s-1.
Page 140
Chapter 5 Fluorescence microscopy study of self-
assembled monolayers of the peptide aptamer probe on gold
124
It is very impressive to note that even though the potential is scanned to very negative values,
some of the fluorescence corresponding to the first increase at -0.500 V remains and that no
decrease in the second fluorescence signal at -1.000 V associated with the hotspots regions is
observed. To better outline this distinctive behaviour between the HS and NHS regions, the
fluorescence profiles associated with to the four reductive desorptions associated with regions
HS2 and NHS2 have been superimposed on Figure 5-21.
-1.4 -1.2 -1.0 -0.8 -0.6 -0.4 -0.2 0.0 0.20
5000
10000
15000
20000
25000
30000
Mea
n F
luore
scen
ce I
nte
nsi
ty /
a.u
.
E vs Ag|AgCl / V
Scan 1
Scan 2
Scan 3
Scan 4
(a)
-1.4 -1.2 -1.0 -0.8 -0.6 -0.4 -0.2 0.0 0.20
5000
25000
30000
Mea
n F
luore
scen
ce I
nte
nsi
ty /
a.u
.
E vs Ag|AgCl / V
Scan 1
Scan 2
Scan 3
Scan 4
(b)
Figure 5-21: Overlay of the fluorescence vs potential curves associated with the four
consecutive reductive desorption in HS2 (a) and NHS2 (b), υ = 20 mV s-1.
Page 141
Chapter 5 Fluorescence microscopy study of self-
assembled monolayers of the peptide aptamer probe on gold
125
From the data presented above, it seems to indicate that the first increase in fluorescence can
be associated with the more homogenous areas of the layer whereas the second fluorescence
increase originates from the hotspots.
5.5.2 Case of an electrode modified by a one-step coadsorption
procedure
In order to compare how the procedure of immobilisation influence the organisation of the
layer, we will now compare the fluorescence and capacity results of layers obtained by a two-
step adsorption and a one-step adsorption. Indeed, as it has been presented earlier,
electrochemical characterisation performed on layers prepared by these two procedures shows
significant differences in particular in terms of the probe density. To do so, we selected two
regions of interest being within a hotspot (HS) and in a less intense area (NHS). This selection
and the evolution of the minimum images obtained for each reductive desorption are presented
on Figure 5-22.
1st reductive
desorption
2nd reductive
desorption
3rd reductive
desorption
4th reductive
desorption
Figure 5-22: ROIs selection and minimum images corresponding to four consecutive
reductive desorptions of a peptide/MCB (1/4) mixed SAM obtained by coadsorption.
Figure 5-23 presents a typical behaviour of a mixed layer of fluorescently labelled peptide and
MCB formed by coadsorption procedure.
A first observation reveals that for the first reductive desorption, the fluorescence signal is the
10 times smaller than with a layer formed by the two-step procedure. Although fluorescence
cannot be directly associated with the concentration of species, it is consistent with the
chronocoulometric data indicating that coadsorption generates less labelled probe immobilised
at the surface than the two-step procedure. Secondly, it is interesting to note that, again, two
increases in fluorescence are observed in the hotspot region whereas only one increase is
observed in the non-hotspot area. Here again, we observed the persistence only of the hotspots
after four consecutive desorptions up to very negative potentials.
Page 142
Chapter 5 Fluorescence microscopy study of self-
assembled monolayers of the peptide aptamer probe on gold
126
Another different behaviour of the film formed by coadsorption is that no significant
modification of the fluorescence signal is observable after the first reductive desorption
indicating that a large majority of the peptide probe is removed and diffuses to the bulk. This is
also confirmed by the absence of significant modifications of the capacitance value respectively
to the three next successive desorptions indicating that a minimum value has been reached.
Looking at the fourth reductive desorption, we observe however a small increase in
fluorescence in the NHS region at the same potential as that observed in the HS region. We
assume that this signal is due to the apparition of bubbles at the electrode surface due to the
reaction of hydrogen evolution, as we are scanning to very low potentials, rather than to a
significant contribution.
Page 143
Chapter 5 Fluorescence microscopy study of self-
assembled monolayers of the peptide aptamer probe on gold
127
(a)
-1.4 -1.2 -1.0 -0.8 -0.6 -0.4 -0.2 0.0 0.20
500
1000
1500
2000
2500
3000
3500
Mea
n F
luo
resc
ence
In
ten
sity
/ a
.u.
E vs Ag|AgCl / V
HS
NHS
-1.4 -1.2 -1.0 -0.8 -0.6 -0.4 -0.2 0.0 0.20
5
10
15
20
25
30
C /
µF
cm
-2
E vs Ag|AgCl / V
(b)
-1.4 -1.2 -1.0 -0.8 -0.6 -0.4 -0.2 0.0 0.20
500
1000
1500
2000
Mea
n F
luo
resc
ence
In
ten
sity
/ a
.u.
E vs Ag|AgCl / V
HS
NHS
-1.4 -1.2 -1.0 -0.8 -0.6 -0.4 -0.2 0.0 0.20
5
10
15
20
25
30
35
40
C /
µF
cm
-2
E vs Ag|AgCl / V
(c)
-1.4 -1.2 -1.0 -0.8 -0.6 -0.4 -0.2 0.0 0.20
500
1000
1500
2000
Mea
n F
luo
resc
ence
In
ten
sity
/ a
.u.
E vs Ag|AgCl / V
HS
NHS
-1.4 -1.2 -1.0 -0.8 -0.6 -0.4 -0.2 0.0 0.20
5
10
15
20
25
30
35
40
C /
µF
cm
-2
E vs Ag|AgCl / V
(d )
-1.4 -1.2 -1.0 -0.8 -0.6 -0.4 -0.2 0.0 0.20
500
1000
1500
2000
Mea
n F
luo
resc
ence
In
ten
sity
/ a
.u.
E vs Ag|AgCl / V
HS
NHS
-1.6 -1.4 -1.2 -1.0 -0.8 -0.6 -0.4 -0.2 0.0 0.20
5
10
15
20
25
30
35
40
45
C /
µF
cm
-2
E vs Ag|AgCl / V
Figure 5-23: Representative fluorescence-potential (left) and capacitance-potential (right) curves
of hotspot and non-hotspot regions associated with four consecutive reductive desorption up to -
1.250 V (a and b); -1.350 V (c); -1.450 V (d) recorded in 10 mM phosphate buffer-pH 7.4 at
peptide/MCB (1/4) mixed SAMs obtained by one-step coadsorption, υ= 20 mV s-1.
Page 144
Chapter 5 Fluorescence microscopy study of self-
assembled monolayers of the peptide aptamer probe on gold
128
5.6 Interfacial behaviour of a single component layer
composed of peptide
As the presence of distinct regions observed in the fluorescence imaging of layers formed
by two different procedures could arise from a segregation of phases between the
mercaptobutanol diluent and the peptide aptamer probe, we decided to examine the
fluorescence signal in the absence of diluent. The same strategy was used, namely the
succession of two reductive desorptions from +0.100 V to -1.250V followed by two consecutive
desorptions up to -1.350 V and -1.450 V but, this time, the gold electrode was exclusively
modified by labelled thiolated peptide. Figure 5-24 presents an image of a gold electrode
modified by the peptide layer. As for mixed layers, a coexistence of more and less intense
regions is observed indicating that the presence of hotspots cannot simply be explained by a
phase segregation due to the presence of MCB in the mixed monolayers.
Figure 5-24: Fluorescence image acquired at open circuit potential (50 × objective, exposure
time = 500 ms) for polycrystalline gold surface modified by a SAM of peptide.
Figure 5-25 presents a typical curve of the total fluorescence as a function of the applied
potential for a full image of a self-assembled monolayer exclusively composed of the
fluorescently labelled peptide. Two significant increases in fluorescence are observed during
the first reductive desorption whereas only one significative increase is observed at more
negative potential for the additional successive scans.
Page 145
Chapter 5 Fluorescence microscopy study of self-
assembled monolayers of the peptide aptamer probe on gold
129
-1.4 -1.2 -1.0 -0.8 -0.6 -0.4 -0.2 0.0 0.20
200
400
600
800
1000
1200
1400
1600
Scan 1
Scan 2
Scan 3
Scan 4
Mea
n F
luore
scen
ce I
nte
nsi
ty /
a.u
.
E vs Ag|AgCl / V
Figure 5- 25: Representative fluorescence-potential curves of four successive reductive
desorption runs recorded in 10 mM phosphate buffer-pH 7.4 at a peptide alone SAM modified
electrode.
A first increase is observed from -0.2 V until -0.7 V where the fluorescence starts to
decrease up to -1.0 V before a second increase is observed around -1.0 V. A similar two-step
fluorescence behaviour was observed in the case of mixed layers although the increase started
at around -0.5 V. The onset of the fluorescence at a more positive potential could be explained
by the absence of mercaptobutanol. One of the role of this diluting molecule is to prevent from
the nonspecific adsorption of the biomolecules on gold. Therefore, in its absence, non-
specifically adsorbed molecules might be present at the electrode surface, the lower stability of
this anchoring leading to an earlier desorption of those species upon the application of a
negative potential.
Another hypothesis could be the second role of MCB which is to stabilise the layer by diluting
the negatively charged peptide aptamer to decrease the electrostatic repulsion between the
strands. The evolution of the capacitance as a function of the applied potential presented on
Figure 5-26 supports this assumption since that capacitance already starts to significantly
increase at -0.4 V compared to -0.6 V and -0.7 V respectively for a mixed layers.
Page 146
Chapter 5 Fluorescence microscopy study of self-
assembled monolayers of the peptide aptamer probe on gold
130
-1.4 -1.2 -1.0 -0.8 -0.6 -0.4 -0.2 0.0 0.20
2
4
6
8
10
12
14
16
18
C /
µF
cm
-2
E vs Ag|AgCl / V
Figure 5-26: Representative capacity-potential curves of the first reductive desorption from
+0.100 V to -1.250 V recorded in 10 mM phosphate buffer-pH 7.4 at a peptide SAM modified
electrode.
It is interesting to note that the capacitance also rises in two successive steps. On the forward
scan, a first increase is observed between -0.4 V and -0.9 V where the curvature changes and a
second increase is observed until the potential is scanned backwards.
More information will be obtained by selecting two regions of interest in a hotspot region and
a non-hotspot region. The selection and associated results are presented on Figure 5-27 and 5-
28, respectively.
Figure 5-27: ROIs selection and minimum image corresponding to the reductive desorption of
a peptide SAM.
Page 147
Chapter 5 Fluorescence microscopy study of self-
assembled monolayers of the peptide aptamer probe on gold
131
-1.4 -1.2 -1.0 -0.8 -0.6 -0.4 -0.2 0.0 0.2400
600
800
1000
1200
1400
1600
1800
-1.4 -1.2 -1.0 -0.8 -0.6 -0.4 -0.2 0.0 0.2
500
600
700
800
900
1000
-1.4 -1.2 -1.0 -0.8 -0.6 -0.4 -0.2 0.0 0.2
500
600
700
800
900
-1.4 -1.2 -1.0 -0.8 -0.6 -0.4 -0.2 0.0 0.2
500
600
700
800
900(c)
(b)
Mea
n F
luore
scen
ce I
nte
nsi
ty /
a.u
.
E vs Ag|AgCl / V
HS
NHS
Mea
n F
luore
scen
ce I
nte
nsi
ty /
a.u
.
E vs Ag|AgCl / V
HS
NHS
(d)
Mea
n F
luore
scen
ce I
nte
nsi
ty /
a.u
.
E vs Ag|AgCl / V
HS
NHS
Mea
n F
luore
scen
ce I
nte
nsi
ty /
a.u
.
E vs Ag|AgCl / V
HS
NHS
(a)
Figure 5-28: Representative fluorescence-potential curves associated with the hotspot and
non-hotspot areas for four successive reductive desorptions from +0.100 V to -1.250 V (a,b), -
1.350 V (c) and -1.450 V (d) recorded in 10 mM phosphate buffer-pH 7.4 at a peptide SAM
modified electrode.
From the fluorescence vs potential curves shown on Figure 5-28(a), two consecutive
increases are observed. Contrary to the case of the mixed films formed by a two-step adsorption,
the first increase has almost disappeared after the first reductive desorption, which indicates
that the molecules have clearly diffused from the electrode surface to the bulk.
Another interesting feature to underline that differs from the behaviour of mixed layers is the
presence of a second peak, both in the hotspot and non-hotspot regions irrespective of the
number of desorption cycles. After the first desorption cycle, the second increase solely remains
allowing a better assignment of the potential where it appears. From the curves associated to
the last three desorptions, the fluorescence increase appears at -0.8 V in the hotspot region and
at about -1.1 V in the non-hotspot region. From Figure 5-29, it seems that the fluorescence
associated with the non-hotspot region is mainly related to the diffusion in every directions of
the fluorescence initiated by the hotspots.
Page 148
Chapter 5 Fluorescence microscopy study of self-
assembled monolayers of the peptide aptamer probe on gold
132
-1.000 V vs Ag|AgCl -1.125 V vs Ag|AgCl -1.150 V vs Ag|AgCl -1.175 V vs Ag|AgCl
-1.225 V vs Ag|AgCl -1.250 V vs Ag|AgCl -1.125 V vs Ag|AgCl -1.100 V vs Ag|AgCl
-1.075 V vs Ag|AgCl -1.050 V vs Ag|AgCl -1.025 V vs Ag|AgCl -0.750 V vs Ag|AgCl
Figure 5-29: Fluorescence images of a gold electrode modified by the peptide alone for the
second reductive desorption. The images (50 × objective; exposure time = 500 ms) are taken
at indicated potentials.
Note, once again, the persistence of the hotspot regions after four successive cycles of reductive
desorption to very negative potentials.
Further work is required to study these hotspots and we propose to investigate what could
influence the presence of these regions.
Page 149
Chapter 5 Fluorescence microscopy study of self-
assembled monolayers of the peptide aptamer probe on gold
133
5.7 Study of the heterogeneities of the SAMs
As clearly evidence by the images, the fluorescence is not uniformly distributed on the
electrode and a coexistence of more or less intense regions are observed prior to the reductive
desorption. In the case of DNA SAMs, Murphy et al. suggested that these brighter regions could
be related to higher density of the fluorescent molecules or to their aggregation resulting in the
presence of labelled molecules further from the surface [99]. A first hypothesis regarding the
origin of this inhomogeneous distribution could be the structure of the electrode such as the
presence of defects. To explore this possibility, a bright field image has been taken prior to
every experiment to be able to compare the structure of the electrode to the distribution of the
hot spots. Figure 5-30 presents the images of a same area recorded in bright field and
fluorescence mode of a Ap-cys-p53-fluo/MCB (1/4) modified electrode prepared by a two-step
adsorption procedure.
(a) (b)
Figure 5-30: (a) Bright field (10 × objective, exposure time = 100 ms, Lamp Intensity= 10 %,
Gain = 400) and (b) fluorescence (10 × objective, exposure time = 500 ms, Lamp Intensity
=30 %, Gain =400) acquired at open circuit potential for a mixed SAM of Ap-cys-p53-
fluo/MCB (1/4) prepared by a two-step adsorption procedure.
On Figure 5-30(b) we first selected two regions of interest, ROI 1 and ROI 2, corresponding
to areas of high fluorescence intensity. Upon reporting those regions on the bright field image,
no major defect can be associated with the presence of these brighter fluorescence features.
Moreover, the selection of a third region, ROI 3, on Figure 5-30(a), presenting a succession of
steps and terrace, does not show any brighter spot when the selection is reported on the
fluorescence image. This indicates that the presence of brighter fluorescence regions in the self-
assembled monolayer cannot be directly correlated to the presence of defects at the substrate.
Page 150
Chapter 5 Fluorescence microscopy study of self-
assembled monolayers of the peptide aptamer probe on gold
134
This comparison has been realised on a variety of immobilisation conditions on several
electrodes, leading always to this same conclusion.
It was also suspected that these hotspots could be correlated to the substrate crystallinity
but experiments carried out, in our lab, with SAMs of fluorescently labelled oligonucleotides
on polycrystalline, single crystal (111) and single crystal (210) gold electrodes have shown no
influence on the occurrence of these features as hotspots were systematically present [104].
Fluorescence measurements carried out with a single crystal (210) modified in two steps by a
peptide/MCB (2/3) layer have confirmed these results as presented on Figure 5-31. AFM
measurements performed on Arrandee (111) gold plates modified by a peptide layer have also
confirmed the same statement. AFM measurements will be discussed in more details in the
future developments of this work.
Figure 5-31: Fluorescence image (10 × objective, exposure time = 2 s) acquired at open
circuit potential for a two-step adsorbed Ap-cys-p53-fluo/MCB (2/3) SAM on a gold single
crystal (210).
As Murphy suggested that the presence of hotspots could be related to the formation of
aggregates of labelled biomolecules on the gold substrate and, as urea is often used for its
denaturing effect on protein, we tried to evaluate whether it could have an influence on the
hotspots. To do so we prepared a peptide SAM and proceeded to a reductive desorption from
+0.1 V to -1.250V in order to only keep the hotspots on the gold surface. We, then, exposed the
electrode surface to a denaturing solution of 8 M urea overnight. As negative control, we
performed the same experiment, but instead of urea, the electrode was exposed to a 1 M
phosphate buffer - pH 7.4. Figure 5-32 shows an OCP image of the electrode surface before
and after an overnight contact with 1 M phosphate buffer- pH 7.4 (a, b) and with 8 M urea (c,d).
Page 151
Chapter 5 Fluorescence microscopy study of self-
assembled monolayers of the peptide aptamer probe on gold
135
(a) (b)
(c) (d)
Figure 5-32: Fluorescence images (10 x objective, exposure time = 1 s) acquired at open
circuit potential for a peptide SAM before and after overnight contact with 1 M phosphate
buffer – pH 7.4 (a,b) and 8 M urea (c,d).
It can be seen on Figure 5-32(d) that the aggregates observed on Figure 5-32(c) remain after
being treated overnight with urea. No significant modification is observed in comparison with
the effect of phosphate buffer shown on Figure 5-32(a, b). The effect of ultrasounds has also
been examined by exposing the electrode for 10 minutes in an ultrasounds bath but no
noticeable effect has been detected.
We also tried to immobilise a fluorescently labelled non thiolated probe, corresponding to
the p53 peptide labelled probe without additional cysteine residue in N-terminal position, to see
if hotspots would be present. Figure 5-33 shows 10× magnification fluorescence images on this
probe immobilised overnight in 1 M phosphate buffer-pH 7.4 before and after performing a
potential sweep experiment from +0.100 V to –1.250 V in 10 mM phosphate buffer pH 7.4.
Page 152
Chapter 5 Fluorescence microscopy study of self-
assembled monolayers of the peptide aptamer probe on gold
136
(a) (b)
Figure 5-33: Fluorescence images (10 × objective, exposure time = 500 ms) acquired at open
circuit potential for an unthiolated peptide SAM before (a) and after (b) reductive desorption
from +0.100 V to -1.250 V.
Although less hotspots are observed than for a thiolated probe, significant aggregates are
observed and these remain through desorption. This indicates that these aggregates are not only
due to thiol-gold bonding but to other interactions between the peptide probes such as hydrogen
bonding or hydrophobic effects keeping them in the vicinity of the surface and preventing them
from diffusing away from the electrode surface upon the application of a potential.
Page 153
Chapter 5 Fluorescence microscopy study of self-
assembled monolayers of the peptide aptamer probe on gold
137
5.8 AFM characterisation of the peptide SAMs
AFM allows to determine the nanoscale distribution of the thiolated molecules immobilised
at the electrode surface and is the only technique that reaches a sufficient lateral resolution to
localise individual molecules. These abilities makes it one of the most prized technique in the
study of the organisation of self-assembled monolayers. Different parameters can be obtained
as the roughness. Since AFM gives information on the relative height at which the molecules
are distributed on the surface and that the hotspots observed in fluorescence are assumed to be
aggregates which relative height from the electrode surface should be higher, we performed
non-contact mode AFM measurements to evaluate whether the aggregates observed in
fluorescence microscopy could be correlated to features observed via this highly resolved
technique. Figure 5-34(a) presents a 50 × magnification fluorescence image of a peptide/MCB
(2/3) electrode modified by a two-step adsorption. Using the corresponding bright field image
of the electrode, we were able to position the cantilever in the area in the upper right corner of
the fluorescence image, to perform an AFM imaging, at air, of this region. The image recorded
is shown on Figure 5-34(b).
(a)
(b)
Figure 5-34: Fluorescence image (50 × objective, exposure time = 1 s) acquired at open
circuit potential for a two-step adsorbed Ap-cys-p53-fluo/MCB (2/3) SAM on a gold
electrode (a) and AFM image of this same region (b).
By comparing the distance and angles between different hotspots, we were able to correlate the
hotspots observed in fluorescence with features observed in AFM as represented by the
coloured lines on Figure 5-34. The height profiles of a few aggregates have been obtained by
plotting the height as a function of the cross section of the hotspots as shown on Figure 5-35.
Note that the hotspot at the extreme right has been set as 1, the others being numbered
clockwise.
Page 154
Chapter 5 Fluorescence microscopy study of self-
assembled monolayers of the peptide aptamer probe on gold
138
0 1 2 3 4 5 6 7
-50
0
50
100
150
200
250
300
350
Hei
ght
/ nm
Section / µm
HS 1
HS 3
HS 4
Figure 5-35: Height profiles of cross-sections performed on some aggregates observed on
AFM images recorded on a Ap-cys-p53-fluo/MCB (2/3) modified gold electrode obtained by
two-step adsorption.
It can be seen that the height of the hotspots varies between roughly 150 and 300 nm. This is
interesting since we have shown on Figure 3-30 that the quenching of fluorescence is no longer
effective for a fluorescein fluorophore, at a distance of 150 nm from the electrode, allowing the
visualisation of the labelled molecules by fluorescence microscopy. These observations further
support our assumption on the origin of the hotspots as resulting from an aggregation of
fluorescent biomolecule at the electrode surface.
Besides imaging, AFM, as its name suggests, also allows the direct measurement of tip-
sample interaction forces as a function of the gap between the tip and sample. This measurement
gives information on the adhesion of the sample on the substrate and corresponds to the
minimum of the force-distance curve to finally obtain a topographic image of the adhesion as a
function of the distance. Since we have tried, via fluorescence measurements, to contribute to
the study of the organisation of self-assembled monolayers of peptide mixed or not with MCB
and since we have shown that the hotspots observed in fluorescence can be correlated to the
features observed via AFM, we decided to perform experiments on four different samples to
obtain information both on the distribution and adhesion of the layers. The prepared layers
were:
a monolayer of 4-mercaptobutan-1-ol (MCB)
a layer exclusively composed of peptide (Ap-cys-p53-fluo)
a mixed layer composed of mercaptobutanol and Ap-cys-p53-fluo (2/3) formed in one
step
Page 155
Chapter 5 Fluorescence microscopy study of self-
assembled monolayers of the peptide aptamer probe on gold
139
a mixed layer composed of mercaptobutanol and Ap-cys-p53-fluo (2/3) formed in two
steps
AFM contrary to fluorescence allows the visualisation of the organisation of both fluorescent
and non fluorescent molecules. Furthermore, its higher resolution should allow a sharper
visualisation of the organisation. Therefore, we propose to compare the height vs distance and
force vs distance images obtained for the four samples as presented on Figure 5-36.
(a)
(b)
Page 156
Chapter 5 Fluorescence microscopy study of self-
assembled monolayers of the peptide aptamer probe on gold
140
(c)
(d)
Figure 5-36: Height vs distance and force vs distance image obtained by atomic force
microscopy of a layer of MCB (a), Ap-cys-p53-fluo (b), Ap-cys-p53-fluo/MCB formed in one
step (c), Ap-cys-p53-fluo/MCB formed in two steps (d).
It can be seen on Figure 5-36 that the four layers present different behaviours both in terms of
height distribution and adhesion. Figure 5-36(a) corresponding to a monolayer of MCB presents
a quite homogeneous organisation. Indeed from the adhesion image, we can assume that the
higher patterns observed originates from dried drops of electrolyte rather than from the
alkanethiol molecules. The variations observed in the force distribution however indicate that
the MCB is probably assembled in a succession of well organised domains rather than in one
major domain.
Figure 5-36(b) illustrating a layer of peptide presents a highly homogeneous organisation as
can be seen from both height and adhesion images. Indeed, the amplitude of the height variation
is smaller than in any of the other three adsorbed layers and the same observation can be made
Page 157
Chapter 5 Fluorescence microscopy study of self-
assembled monolayers of the peptide aptamer probe on gold
141
for the adhesion image. This indicates that the adsorption of the peptide only results in the
formation of highly compact layers which is in agreement with the electrochemical results
previously shown in this work presenting a complete inhibition of the electron transfer
associated with the oxidation and reduction processes of the [Fe(CN)6]3-/4- redox couple.
It is also very impressive to observe that the organisation of the mixed layers is quite different
from the peptide or MCB layers but also from each other. Indeed, the adhesion patterns are, in
both cases, very heterogeneous compared to the peptide or to MCB but the organisation of these
patterns also strongly varies. The force obtained for the one-step adsorbed layer cannot,
however, be compared to the others since we had to change cantilevers for this experiment.
Besides, it can be seen on each image that the higher patterns present smaller adhesion than the
rest of the sample.
At this stage of the work, it is not possible to go any further in the interpretation of these data.
However, considering the variations observed from one procedure of adsorption to the other,
both via electrochemical methods, fluorescence and atomic force microscopy, it would be very
interesting to pursue this investigation. For example, a similar coupling to the one used in this
work for fluorescence measurements would allow a more accurate and more systematic study
of the organisation of the peptides layers and the origin of the strong adsorption of the
aggregates.
Page 159
Chapter 6 Conclusions
143
Chapter 6: Conclusions
6.1 General conclusions
In the first part of this thesis, we have shown that p53-based peptide aptamer sequences
can be assembled on gold through addition of a cysteine residue to allow its covalent anchoring
via the thiol side chain of the amino acid. The immobilisation of the peptide probe has been
performed according to distinct procedures in which the biomolecule was adsorbed alone or in
the presence of a diluent, the 4-mercaptobutan-1-ol (MCB).
Experiments performed in the presence of the redox complex [Ru(NH3)6]3+, electrostatically
interacting with the negatively charged peptide, have evidenced that the simultaneous
adsorption of these two thiolated molecules leads to a lower peptide ratio in the monolayer
(about 10 %) compared to the two-step adsorption in which the peptide is absorbed prior to the
MCB (about 15 %). The adsorption of the peptide alone leads to the most concentrated layers
with twice the amount of biomolecule compared to the two-step adsorption. Furthermore, we
showed using electrochemical impedance spectroscopy in the presence of the redox couple
[Fe(CN)6]3-/4- that the adsorption of a layer exclusively composed of the peptide leads to a
complete inhibition of the electron transfer. This inhibition, not observed for mixed layers, has
been related to the presence of the negatively charged peptide aptamer. Indeed, in mixed layers,
channels are preserved through the film by the mercaptobutanol and the electron transfer
kinetics is merely affected. The negatively charged peptide layer forms thus a barrier to the
electronic transfer, and totally inhibits the signal. AFM measurements have confirmed the
compact organisation of the layers exclusively composed of peptide. The dramatically different
behaviours towards electron transfer observed between the mixed layers and the layer of peptide
underlines the attention that should be given to the influence of the immobilisation procedure
on the organisation of the resulting self-assembled monolayers.
In the second part of this work, a new strategy of detection of the protein MDM2, relying
on the immobilisation of a peptide aptamer based on the interaction sequence of the p53 protein
with the MDM2 protein has been implemented. This method relies on the analysis of the
variation of the charge transfer resistance (ΔRct) of the [Fe(CN)6]3-/4- redox couple at the
modified interface by electrochemical impedance spectroscopy. Whereas the three adsorption
procedures have been tested, the monolayers composed of the sole peptide probe have shown
the most promising results. Indeed, the inhibition of the electronic transfer, evidenced in
absence of diluent, was used to follow the interaction between the peptide probe and MDM2.
The study of the behaviour of MDM2 at gold electrodes via cyclic voltammetry,
Page 160
Chapter 6 Conclusions
144
electrochemical impedance spectroscopy and in situ fluorescence microscopy have shown that
the modification of the charge transfer resistance upon contact with the target protein is not
resulting from the desorption of the peptide probe. Quartz crystal microbalance measurements
performed on gold-coated quartz crystals modified by a peptide layer have confirmed the
interaction between MDM2 and the probe. Negative controls performed with bovine serum
albumin, fibrinogen and cytochrome c further supports the strategy. At the highest protein
surface coverage, a ratio of 1 MDM2 for 10 Ap-cys-p53 probes has been obtained.
The analytical performance of the detection method has been assessed. Experiments have been
performed by exposing electrodes modified by the peptide to various concentration of MDM2
and the limit of detection (LOD) and limit of quantification (LOQ) have been determined based
on the same negative controls as those used in QCM. A limit of detection of 12 pM,
corresponding to 0.69 ng mL-1 and a limit of quantification of 19 pM, corresponding to
1.08 ng mL-1 have been determined. The detection range of 1.08 to 58 ng mL-1 and LOD of
0.69 ng mL-1 obtained with the transducer elaborated in this work indicates that, the
immobilisation of a peptide aptamer combined with the impedimetric detection can compete
with the performance of ELISA kits. Therefore, the strategy developed in this work, relying on
the use of a peptide sequence whose selection is based on the interaction sequence of a protein
with the considered target seems very promising.
In the third part of this work, we studied, via in situ fluorescence microscopy, the influence
of the adsorption procedure on the organisation of the peptide monolayers. For fluorescence
purposes, the initial probe has been labelled with a 5-carboxyfluorescein dye. In each
immobilisation procedure, a coexistence of more or less intense fluorescent regions was
observed. The brighter areas were referred to as “hotspots”. Four successive reductive
desorptions were performed to study the behaviour of the monolayers.
In mixed layers, two increases in the fluorescence signal at about -0.6 V and -1.0 V were
recorded during the first desorption cycle. However, the fluorescence intensity observed for a
layer obtained by a two-step adsorption was about 10 times higher compared to those formed
by coadsorption. This observation indicates a higher peptide concentration as evidenced by our
electrochemical results in the presence of [Ru(NH3)6]3+. From the second cycle, variations were
observed in the behaviour of mixed layers. Indeed, whereas the signal intensity associated with
the first fluorescence increase diminishes by a factor 10 in the case of a two-step adsorption, it
completely vanishes in coadsorption. However it is interesting to notice that the fluorescence
intensity of the second increase remains, in both cases, approximatively constant even after four
reductive desorption cycles. In addition, the hotspots also remain after four cycles of reductive
desorption.
The definition of regions of interest allowed us to evidence different fluorescence behaviours
for the hotspot (HS) and non hotspot (NHS) regions. We were able to assign the first increase
in fluorescence to the less intense areas of the layer and the second fluorescence increase to the
hotspots.
Page 161
Chapter 6 Conclusions
145
The presence of hotspots in the layers exclusively composed of the peptide probe indicates that
the heterogeneities are not related to a phase segregation between the biomolecule and the
MCB. As in mixed layers, two increases in the fluorescence signal were observed although the
desorption started at a more positive potential (-0.2 V) witnessing the stabilising effect of the
MCB in mixed layers. As for the hotspots, the fluorescence intensity associated with the second
increase remained after four consecutive desorption cycles.
As Murphy et al. [99] suggested that these brighter regions could be related to higher density
of the fluorescent molecules or to their aggregation resulting in the presence of labelled
molecules further from the surface, different hypotheses regarding their origin were tested.
However, no influence of the presence of defects or of the crystallinity of the substrate were
evidenced on the presence of aggregates in the peptide monolayers. Similarly, no effect of a
denaturing solution of urea or of the use of ultrasounds were observed on the presence of
hotspots. However, atomic force microscopy measurements (AFM) allowed us to correlate the
brighter regions observed in fluorescence with higher features imaged in AFM. This supported
the hypothesis that the hotspots actually are aggregates of peptide on the surface.
6.2 Prospects
Beyond the results presented in this work, various prospects are worth to be considered.
Indeed, we have shown that a sensing strategy relying on the immobilisation on gold of a
peptide probe based on the natural sequence of interaction of the protein p53 with the protein
MDM2, can be used to follow their interaction. Therefore, it would be interesting, in future
work, to further assess the performance of this probe towards its target using other transducers.
For instance, the immobilisation of this same peptide on gold could be used to detect the protein
MDM2 via surface plasmon resonance (SPR) or quartz crystal microbalance (QCM). Besides,
the use of gold nanoparticles as support could also be considered.
Secondly, new peptide/protein couples should be tested to evaluate whether other
interaction sequences might be suitable for protein detection and further support the strategy
implemented in this thesis.
Furthermore, infrared spectroscopy might elucidate whether the complete inhibition of the
electron transfer observed in the case of monolayers exclusively composed of the p53 peptide
can be related to a secondary structure of the peptide probe. Indeed, in the work developed by
Gatto [109, 110], self-assembly of helices were shown to block the electron transfer.
The influence on the electron transfer inhibition of a modification of the p53 aptamer
sequence by a variety of spacer inserted between the cysteine anchor and the probe sequence
would also be worth investigation. In the same idea, the length of the interaction sequence or
the addition of amino acids as the α-aminoisobutyric acid residue (Aib) known to force the
sequence to take a rigid 310 helix structure could be modified. These modifications would also
Page 162
Chapter 6 Conclusions
146
help to understand the organisation of the monolayer in relation to the sequence of the probe
and/or its structure.
The deeper understanding of the organisation of the monolayer might also be obtained by
further atomic force microscopy measurements. Coupling AFM measurements in solution with
electrochemistry can provide further insights into the correlation between the interfacial
properties of the peptide layers and the electron transfer. Besides complementary measurements
are necessary to understand the origin of the aggregates and whether the substrate is a driving
force for the formation of aggregates in the monolayers.
Page 163
147
References
[1] G. Evtugyn, Biosensors: Essentials, Lecture Notes in Chemistry ed., vol. 84, Berlin Heidelberg:
Springer-Verlag, 2014.
[2] R. Vargas-Bernal, E. Rodriguez-Miranda and G. Herrera-Pérez, “Chapter 14: Evolution and
Expectations of Enzymatic Biosensors for Pesticides,” in Pesticides - Advances in Chemical and
Botanical Pesticides, R. P. Soundararajan, Ed., InTech, 2012, pp. 329-356.
[3] M. Zourob, Recognition Receptors in Biosensors, New York: Springer, 2010.
[4] M. A. Cooper, Label-free biosensors: techniques and applications, New York: Cambridge
University Press, 2009.
[5] M. B. Gu and H.-S. Kim, Biosensors based on Aptamers and Enzymes, Advances in Biochemical
Engineering/Biotechnology ed., vol. 140, T. Scheper, Ed., Berlin Heidelberg: Springer, 2014.
[6] J. Janata, Principles of chemical sensors, 2nd ed., Boston: Springer, 2009.
[7] K. R. Rogers and A. Mulchandani, “Principles of Affinity-Based Biosensors,” in Affinity
Biosensors: Techniques and Protocols, Methods in Biotechnology ed., vol. 7, Totowa, Humana
Press, 1998, pp. 3-18.
[8] E. Palecek, J. Tkac, M. Bartosik, T. Bertok, V. Ostatna and J. Palecek, “Electrochemistry of
Nonconjugated Proteins and Glycoproteins.Toward Sensors for Biomedicine and Glycomics,”
Chemical Reviews, vol. 115, pp. 2045-2108, 2015.
[9] S. Hu , Q. Lu and Y. Xu, “Chaper 17: Biosensors based on direct electron transfer of protein,” in
Electrochemical sensors, biosensors and their medical applications, Academic Press, 2011.
[10] M. Cretich, F. Damin, G. Pirri and M. Chiari, “Protein and peptide arrays: Recent trends and new
directions,” Biomolecular Engeneering, vol. 23, pp. 77-88, 2006.
[11] D. R. Thévenot, K. Toth, R. A. Durst and G. S. Wilson, “Electrochemical Biosensors:
Recommended Definitions and Classification,” Pure Applied Chemistry, vol. 71, pp. 2333 - 2348,
1999.
[12] D. Mimica, J. H. Zagal and F. Bedioui, “Electrocatalysis of nitric oxide reduction by hemoglobin
entrapped in surfactant films,” Electochemical Communications, vol. 3, pp. 435-438, 2001.
[13] F. Lisdat, B. Ge, E. Ehrentreich-Förster, R. Reszka and F. W. Scheller, “Superoxide dismutase
activity measurement using cytochrome c-modified electrode,” Analytical Chemistry, vol. 71,
pp. 1359-1365, 1999.
[14] C. Fan, G. Li, J. Zhu and D. Zhu, “A reagentless nitric oxide biosensor based on hemoglobin-DNA
films,” Analytica Chimica Acta, vol. 423, pp. 95-100, 2000.
Page 164
148
[15] U. Wollenberger, R. Spricigo, S. Leimkühler and K. Schröder, “Protein Electrodes with Direct
Electrochemical Communication,” in Biosensing for the 21st Century, vol. 109, Berlin
Heidelberg, Springer, 2008, pp. 19-64.
[16] F. Lisdat and F. W. Scheller, “Principles of Sensorial Radical Detection-A Minireview,” Analytical
Letters, vol. 33, pp. 1-16, 2000.
[17] H. Ju and D. Leech, “Electrochemical study of a metallothionein modified gold disk electrode
and its action on Hg2+ cations,” Journal of Electroanalytical Chemistry, vol. 484, pp. 150-156,
2000.
[18] F. Lisdat and I. Karube, “Copper proteins immobilised on gold electrodes for (bio)analytical
studies,” Biosensors and Bioelectronics, vol. 17, pp. 1051-1057, 2002.
[19] E. Chow and J. J. Gooding, “Peptide Modified Electrodes as Electrochemical Metal Ion Sensors,”
Electroanalysis, vol. 18, pp. 1437-1448, 2006.
[20] P. Corbisier, D. Van Der Lelie, B. Borremans, A. Provoost, V. de Lorenzo, N. L. Brown, J. R. Lloyd,
J. L. Hobman, E. Csöregi, G. Johansson and B. Mattiasson, “Whole cell- and protein-based
biosensors for the detection of bioavailable heavy metals in environmental samples,” Analytica
Chimica Acta, vol. 387, pp. 235-244, 1999.
[21] R. S. Yalow and S. A. Berson, “Assay of plasma insulin in human subject by immunological
methods,” Nature, vol. 184, pp. 1648-1649, 1959.
[22] X. Pei, B. Zhang, J. Tang, B. Liu, W. Lai and D. Tang, “Sandwich-type immunosensors and
immunoassays exploiting nanostructure labels: A review,” 2013, vol. 758, pp. 1-18, Analytica
Chimica Acta.
[23] W. Ying, Y. Su, X. Zhu, G. Liu and C. Fan, “Development of electrochemical immunosensors
towards point of care diagnostics,” Biosensors and Bioelectronics, vol. 47, pp. 1-11, 2013.
[24] G. Liu and Y. Lin, “Nanomaterial labels in electrochemical immunosensors and immunoassays,”
Talanta, vol. 74, pp. 308-317, 2007.
[25] F. Yan, J. Wu, F. Tan, Y. Yan and H. Ju, “A rapid simple method for ultrasensitive electrochemical
immunoassay of protein by an electric field-driven strategy,” Analytica Chimica Acta, vol. 644,
pp. 36-41, 2009.
[26] C.-C. Lin, L.-C. Chen, C.-H. Huang, S.-J. Ding, C.-C. Chang and H.-C. Chang, “Development of the
multi-functionalized gold nanoparticles with electrochemical-based immunoassy for protein A
detection,” Journal of Electroanalytical Chemistry, Vols. 619-620, pp. 39-45, 2008.
[27] A. Vasudev, A. Kaushik and S. Bhansali, “Electrochemical immunosensor for label free epidermal
growth factor receptor (EGFR) detection,” Biosensors and Bioelectronics, vol. 39, pp. 300-305,
2013.
[28] X. Liu, P. A. Duckworth and D. K. Wong, “Square Wave Voltammetry versus electrochemical
impedance spectroscopy as a rapid detection technique at electrochemical immunosensors,”
Biosensors and Bioelectronics, vol. 25, pp. 1467-1473, 2010.
Page 165
149
[29] A. Warsinke, W. Stöcklein, E. Leupold, E. Micheel and F. W. Scheller, “Chapter 14:
Electrochemical Immunosensors on the Route to Proteomic Chips,” in Electrochemistry of
Nucleic Acids and Proteins-Towards ELectrochemical sensors for Genomics and Proteomics, E.
Palecek, F. Scheller and J. Wang, Eds., Amsterdam, Elsevier, 2005, pp. 451- 484.
[30] W. Lu, H. Zhao and G. G. Wallace, “Pulsed electrochemical detection of proteins using
conducting polymer based sensors,” Analytica Chimica Acta, vol. 315, pp. 27-32, 1995.
[31] D. Ozkan, P. Kara, K. Kerman, B. Meric, A. Erdem, F. Jelen, P. E. Nielsen and M. Ozsoz, “DNA and
PNA sensing on mercury and carbon electrodes by using methylene blue as an electrochemical
label,” Bioelectrochemistry, vol. 58, pp. 119-126, 2002.
[32] J. Wang, X. Cai, G. Rivas, H. Shiraishi, P. A. M. Farias and N. Donta, “DNA Electrochemical
Biosensor for the Detection of Short DNA Sequences Related to the Human Immunodeficiency
Virus,” Analytical Chemistry, vol. 68, pp. 2629-2634, 1996.
[33] B. Piro, J. Haccoun, M. Pham, L. Tran, A. Rubin, H. Perrot and C. Gabrielli, “Study of the DNA
hybridization transduction behavior of a quinone-containing electroactive polymer by cyclic
voltametry and electrochemical impedance spectroscopy,” Journal of Electroanalytical
Chemistry, vol. 577, pp. 155-165, 2005.
[34] A. M. V. Mohan, K. K. Aswini, A. M. Starvin and V. M. Biju, “Amperometric detection of glucose
using Prussian blue-graphene oxide modified platinum electrode,” Analytical Methods, vol. 5,
pp. 1764-1770, 2013.
[35] C. G. Begley and L. M. Ellis, “Raise standards for preclinical cancer research,” Nature, vol. 483,
pp. 531-533, 2012.
[36] I. Prassas and E. P. Diamandis, “Translational researchers beware! Unreliable commercial
immunoassays (ELISAs) can jeopardize your research,” Clinical Chemistry and Laboratory
Medicine, vol. 52, p. 765–766, 2014.
[37] M. Baker, “Blame it on the antibodies,” Nature, vol. 521, pp. 274-276, 2015.
[38] S. Puertas, M. Moros, R. Fernandez-Pacheco, M. R. Ibarra, V. Grazu and J. de la Fuente,
“Designing novel nano-immunoassays: antibody orientation versus sensitivity,” Journal of
Physics D: Applied Physics, vol. 43, p. 474012 (8pp), 2010.
[39] B. Lu, M. R. Smyth and R. O'Kennedy, “Oriented immobilization of antibodies and its
applications in immunoassays and immunosensors,” Analyst, vol. 121, pp. 29R-32R, 1996.
[40] F. Hoppe-Seyler, I. Cmkovic-Mertens, E. Tomai and K. Butz, “Peptide Aptamers: Specific
Inhibitors of Protien Function,” Current Molecular Medicine, vol. 4, pp. 539-538, 2004.
[41] I. C. Baines and P. Colas, “Peptide aptamers as guides for small-molecule drug discovery,” Drug
discovery today, vol. 11, pp. 334-341, 2006.
[42] S. Fields and O.-K. Song, “A novel genetic system to detect protein–protein interactions,”
Nature, vol. 340, pp. 245 - 246, 1989.
Page 166
150
[43] J. E. Butler, “Solid Supports in Enzyme-Linked Immunosorbent Assay and Other Solid-Phase
Immunoassays,” Methods, vol. 22, pp. 4-23, 2000.
[44] W. Kusnezow and J. D. Hoheisel, “Solid supports for microarray immunoassay,” Journal of
Molecular Recognition, vol. 16, pp. 165-176, 2003.
[45] Y. H. Tan, B. Pandey, A. Sharma, J. Bhattarai and K. J. Steine, “Bioconjugation reactions for
covalent coupling of proteins to gold surfaces,” Global Journal of Biochemistry, vol. 3, pp. 1-21,
2012.
[46] P. Schaaf, V. Ball, P. Huetz, A. Elaissari, J.-P. Cazenave, J.-C. Voegel and P. Schaff, “Kinetics of
exchange processes in the adsorption of proteins on solid surfaces,” Proceedings of the National
Academy of Sciences, vol. 91, pp. 7330-7334, 1994.
[47] E. Lutanie, J.-C. Voegel, P. Schaaf, M. Freund, J.-P. Cazenave and A. Schmitt, “Competitive
adsorption of human immunoglobulin G and albumin: consequences for structure and reactivity
of the adsorbed layer,” Proceedings of the National Academy of Sciences, vol. 89, pp. 9890-
9894, 1992.
[48] F. Rusmini, Z. Zhong and J. Feijen, “Protein Immobilization Strategies for Protein Biochips,”
Biomacromolecules, vol. 8, p. 1775–1789, 2007.
[49] R. Fernandez-Lafuente, C. M. Rosell, V. Rodriguez, C. Santana, G. Soler, A. Bastida and J. M.
Guisan, “Preparation of activated supports containing low pK amino groups. A new tool for
protein immobilization via the carboxyl coupling method,” Enzyme and Microbial Technology,
vol. 15, pp. 546-550, 1993.
[50] I. A. Banerjee, L. Yu, R. I. MacCupsie and H. Matsui, “Thiolated Peptide Nanotube Assembly of
Arrays on Patterned Au Substrates,” Nanoletters, vol. 4, pp. 2437-2440, 2004.
[51] O. R. Bolduc and J.-F. Masson, “Monolayers of 3-mercaptopropyl-amino acid to reduce the
nonspecific adsorption of serum proteins on the surface of biosensors,” Langmuir, vol. 24, pp.
12085-12091, 2008.
[52] V. K. Yadavalli, J. G. Forbes and K. Wang, “Functionalized Self-Assembled Monolayers on
Ultraflat Gold as Platforms for Single Molecule Force Spectroscopy and Imaging,” Langmuir, vol.
22, pp. 6969-6976, 2006.
[53] A. Hirlekar Schmid, S. Stanca, M. S. Thakur, K. Ravindranathan Thampia and C. Raman Suri, “Site-
directed antibody immobilization on gold substrate for surface plasmon resonance sensors,”
Sensors and Actuators B, vol. 113, p. 297–303, 2006.
[54] R. G. Nuzzo and D. L. Allara, “Adsorption of Bifunctional Organic Disulfides on Gold Surfaces,”
Journal of the American Chemical Society, vol. 105, pp. 4481-4483, 1983.
[55] C. D. Bain, E. B. Troughton, Y.-T. Tao, J. Evall, G. M. Whitesides and R. Nuzzo, “Formation of
Monolayer Films by Spontaneous Assembly of Organic Thiols from Solution onto Gold,” Journal
of the American Chemical Society, vol. 111, pp. 321-335, 1989.
Page 167
151
[56] H. A. Biebuyck, C. D. Bain and G. M. Whitesides, “Comparison of Organic Monolayers on
Polycrystalline Gold Spontaneously Assembled from Solutions Containing Dialkyl Disulfides or
Alkanethiols,” Langmuir, vol. 10, p. 1825–1831, 1994.
[57] C. D. Bain, H. A. Biebuyck and G. M. Whitesides, “Comparison of self-assembled monolayers on
gold: coadsorption of thiols and disulfides,” Langmuir, vol. 5, p. 723–727, 1989.
[58] J. Noh, T. Murase, K. Nakajima, H. Lee and M. Hara, “Nanoscopic Investigation of the Self-
Assembly Processes of Dialkyl Disulfides and Dialkyl Sulfides on Au(111),” The Journal of Physical
Chemistry B, vol. 104, p. 7411–7416, 2000.
[59] C. Jung, O. Dannenberger, Y. Xu, M. Buck and M. Grunze, “Self-Assembled Monolayers from
Organosulfur Compounds: A Comparison between Sulfides, Disulfides, and Thiols,” Langmuir,
vol. 14, p. 1103–1107, 1998.
[60] S. Frey, V. Stadler, K. Heister, W. Eck, M. Zharnikov, M. Grunze, B. Zeysing and A. Terfort,
“Structure of Thioaromatic Self-Assembled Monolayers on Gold and Silver,” Langmuir, vol. 17,
p. 2408–2415, 2001.
[61] P. E. Laibinis, G. M. Whitesides, D. L. Allara, Y. T. Tao, A. N. Parikh and R. G. Nuzzo, “Comparison
of the structures and wetting properties of self-assembled monolayers of n-alkanethiols on the
coinage metal surfaces, copper, silver, and gold,” Journal of the American Chemical Society, vol.
113, p. 7152–7167, 1991.
[62] P. Fenter, P. Eisenberger, J. Li, N. Camillone, S. Bernasek, G. Scoles, T. A. Ramanarayanan and K.
S. Liang, “Structure of octadecyl thiol self-assembled on the silver(111) surface: an
incommensurate monolayer,” Langmuir, vol. 7, p. 2013–2016, 1991.
[63] M. M. Walczak, C. Chung, S. M. Stole, C. A. Widrig and M. D. Porter, “Structure and interfacial
properties of spontaneously adsorbed n-alkanethiolate monolayers on evaporated silver
surfaces,” Journal of the American Chemical Society, vol. 113, p. 2370–2378, 1991.
[64] J. C. Love, D. B. Wolfe, R. Haasch, M. L. Chabinyc, K. E. Paul, G. M. Whitesides and R. G. Nuzzo,
“Formation and Structure of Self-Assembled Monolayers of Alkanethiolates on Palladium,”
Journal of the American Chemical Society, vol. 125, pp. 2597-2609, 2003.
[65] E. Li, S.-C. Chang and S. R. Williams, “Self-Assembly of Alkanethiol Molecules onto Platinum and
Platinum Oxide Surfaces,” Langmuir, vol. 19, pp. 6744-6749, 2003.
[66] N. Muskal, I. Turyan and D. Mandler, “Self-assembled monolayers on mercury surfaces,” Journal
of Electrocnalytical Chemistry, vol. 409, pp. 131-136, 1996.
[67] G. E. Poirier, “Characterization of Organosulfur Molecular Monolayers on Au(111) using
Scanning Tunneling Microscopy,” Chemical Reviews, vol. 97, p. 1117–1128, 1997.
[68] C. O'Dwyer, G. Gay, B. Viaris de Lesegno and J. Weiner, “The Nature of Alkanethiol Self-
Assembled Monolayer Adsorption on Sputtered Gold Substrates,” Langmuir, vol. 20, pp. 8172-
8182, 2004.
Page 168
152
[69] A. Ulman, “Formation and Structure of Self-Assembled Monolayers,” Chemical Reviews, vol. 96,
pp. 1533-1554, 1996.
[70] F. Schreiber, “Structure and growth of self-assembling monolayers,” Progress in Surface Science,
vol. 65, pp. 151-257, 2000.
[71] R. Subramanian and V. Lakshminarayanan, “A study of kinetics of adsorption of alkanethiols on
gold using electrochemical impedance spectroscopy,” Electrochimica Acta, vol. 45, pp. 4501-
4509, 2000.
[72] M. Boncheva and H. Vogel, “Formation of Stable Polypeptide Monolayers at Interfaces:
Controlling Molecular Conformation and Orientation,” Biophysical Journal, vol. 73, pp. 1056-
1072, 1997.
[73] K. Park, J. M. Lee, Y. Jung, T. Habtemariam, A. W. Salah, C. D. Fermin and M. Kim, “Combination
of cysteine- and oligomerization domain-mediated protein immobilization on a surface plasmon
resonance (SPR) gold chip surface,” Analyst, vol. 136, pp. 2506-2511, 2011.
[74] P. Sejwal, S. K. Narasimhan, D. Prashar, D. Bandyopadhyay and Y.-Y. Luk, “Selective
Immobilization of Peptides Exclusively viaN-Terminus Cysteines by Water-Driven Reactions on
Surface,” The Journal of Organic Chemistry, vol. 74, pp. 6843-6846, 2009.
[75] J. J. Davis, C. M. Halliwell, H. A. O. Hill, G. W. Canters, M. C. van Amsterdam and M. P. Verbeet,
“Protein adsorption at a gold electrode studied by in situ scanning tunnelling microscopy,” New
Journal of Chemistry, pp. 1119-1123, 1998.
[76] T. Sakurai, S. Oka, A. Kubo, K. Nishiyama and I. Taniguchi, “Formation of oriented polypeptides
on Au(111) surface depends on the secondary structure controlled by peptide length,” Journal
of peptide Science, vol. 12, pp. 396-402, 2006.
[77] A. B. Steel, T. M. Herne and M. J. Tarlov, “Electrochemical Quantitation of DNA Immobilized on
Gold,” Analytical Chemistry, vol. 70, pp. 4670-4677, 1998.
[78] R. Levicky, T. M. Herne, M. J. Tarlov and S. K. Satija, “Using Self-Assembly To Control the
Structure of DNA Monolayers on Gold: A Neutron Reflectivity Study,” Journal of the American
Chemical Society, vol. 120, pp. 9787-9792, 1998.
[79] M. Steichen, Thèse de doctorat, Université Libre de Bruxelles, 2008.
[80] T. Doneux, A. De Rache, E. Triffaux, A. Meunier, M. Steichen and C. Buess-Herman,
“Optimization of the Probe Coverage in DNA Biosensors by a One-Step Coadsorption
Procedure,” ChemElectroChem, vol. 1, pp. 147-157, 2014.
[81] V. Brabec and V. Mornstein, “Electrochemical behaviour of proteins at graphite electrodes. I.
Electrooxidation of proteins as a new probe of protein structure and reactions,” Biochimica et
Biophysica Acta, vol. 625, pp. 43-50, 1980.
[82] V. Brabec and V. Mornstein, “Electrochemical behaviour of proteins at graphite electrodes: II.
Electrooxidation of amino acids,” Biophysical Chemistry, vol. 12, pp. 159-165, 1980.
Page 169
153
[83] X. Cai, G. Rivas, P. Farias, H. Shiraishi, J. Wang and E. Palecek, “Potentiometric stripping analysis
of bioactive peptides at carbon electrodes down to subnanomolar concentrations,” Analytica
Chimica Acta, vol. 332, pp. 49-57, 1996.
[84] J. Y. Gerasimov and R. Y. Lai, “An electrochemical peptide-based biosensing platform for HIV
detection,” Chemical Communications, vol. 46, pp. 395-397, 2010.
[85] J. Y. Gerasimov and R. Y. Lai, “Design and characterization of an electrochemical peptide-based
sensor fabricated via "click" chemistry,” Chemical Communications, vol. 47, pp. 8688-8690,
2011.
[86] R. Li, H. Huang, L. Huang, Z. Lin, L. Guo, B. Qiu and G. Chen, “Electrochemical biosensor for
epidermal growth factor receptor detection with peptide ligand,” Electrochimica Acta, vol. 109,
pp. 233-237, 2013.
[87] H. Li, Y. Cao, X. Wu, Z. Ye and G. Li, “Peptide-based electrochemical biosensor for amyloid 1–42
soluble oligomer assay,” Talanta, vol. 93, pp. 358-363, 2012.
[88] M. Puiu, A. Idili, D. Moscone, F. Ricci and C. Bala, “A modular electrochemical peptide-based
sensor for antibody detection,” Chemical Communications, vol. 50, pp. 8962-8965, 2014.
[89] G. A. Orlowski and H.-B. Kraatz, “Evaluation of electron transfer rates in peptide films: Simplified
calculation and theory,” Electrochimica Acta, vol. 51, pp. 2934-2937, 2006.
[90] K. Sugawara, T. Kadoya, H. Kuramitz and S. Tanaka, “Voltammetric detection of ovalbumin using
a peptide labeled with an electractive compound,” Analytica Chimica Acta, vol. 834, pp. 37-44,
2014.
[91] P. Estrela, D. Paula, P. Li, S. D. Keighley, P. Migliorato, S. Laurenson and P. K. Ferrigno, “Label-
Free Detection of Protein interactions with peptide aptamers by open circuit potential
measurement,” Electrochimica Acta, vol. 53, pp. 6489-6496, 2008.
[92] P. Miao, J. Yin, L. Ning and X. Li, “Peptide-based electrochemical approach for apoptosis
evaluation,” Biosensors and Bioelectronics, vol. 62, pp. 97-101, 2014.
[93] L. Feng, L. Wu, J. Wang, J. Ren, D. Miyoshi, N. Sugimoto and X. Qu, “Detection of a prognostic
indicator in early-stage cancer using functionalized graphene-based peptide sensors,”
Advanced Materials, vol. 24, pp. 125-131, 2012.
[94] K. Kerman, H. Song, J. S. Ducan, D. W. Litchfield and H.-B. Kraatz, “Peptide Biosensors for the
Electrochemical Measurement of Protein Kinase Activity,” Analytical Chemistry, vol. 80, pp.
9395-9401, 2008.
[95] S. Martic, M. Labib and H.-B. Kraatz, “On chip electrochemical detection of sarcoma protein
kinase and HIV-1 reverse transcriptase,” Talanta, vol. 85, pp. 2430-2436, 2011.
[96] J. L. Shepherd, A. Kell, E. Chung, C. W. Sinclair, M. S. Workentin and D. Bizzotto, “Selective
Reductive Desorption of a SAM-Coated Gold Electrode Revealed Using Fluorescence
Microscopy,” Journal of the American Chemical Society, vol. 126, pp. 8329-8335, 2004.
Page 170
154
[97] J. L. Shepherd and D. Bizzotto, “Characterization of Mixed Alcohol Monolayers Adsorbed onto
a Au(111) Electrode Using Electro-fluorescence Microscopy,” Langmuir, vol. 22, pp. 4869-4876,
2006.
[98] A. Musgrove, A. Kell and D. Bizzotto, “Fluorescence Imaging of the Oxidative Desorption of a
BODIPY-Alkyl-Thiol Monolayer Coated Au Bead,” Langmuir, vol. 24, pp. 7881-7888, 2008.
[99] J. N. Murphy, A. K. Chang, H.-Z. Yu and D. Bizzotto, “On the Nature of DNA Self-Assembled
Monolayers on Au: Measuring Surface Heterogeneity with Electrochemical in Situ Fluorescence
Microscopy,” Journal of the American Chemical Society, vol. 131, pp. 4042-4050, 2009.
[100] J. R. Casanova-Moreno and D. Bizzotto, “Electrochemistry and in situ fluorescence microscopy
of octadecanol layers doped with a BODIPY-labeld phospholipid: Investigating an adsorbed
heterogeneous layer,” Journal of Electroanalytical Chemistry, vol. 649, pp. 126-135, 2010.
[101] E. A. Josephs and T. Ye, “A Single-Molecule View of the Conformational Switching of DNA
tethered to a Gold Electrode,” Journal of the American Chemical Society, vol. 134, pp. 10021-
10030, 2012.
[102] E. A. Josephs and T. Ye, “Electric-Field Dependent Conformations of Single DNA Molecules on a
Model Biosensor Surface,” Nanoletters, vol. 12, pp. 5255-5261, 2012.
[103] E. A. Josephs and T. Ye, “Nanoscale Spatial Distribution of Thiolated DNA on Model Nucleic Acid
Sensor Surfaces,” ACS Nano, vol. 7, pp. 3653-3660, 2013.
[104] A. Meunier, E. Triffaux, D. Bizzotto, C. Buess-Herman and T. Doneux, “In Situ Fluorescence
Microscopy Study of the Interfacial Inhomogeneity of DNA Mixed Self-Assembled Monolayers
at Gold Electrodes,” ChemElectroChem, vol. 2, pp. 434-442, 2015.
[105] O. R. Bolduc, D. Correia-Ledo and J.-F. Masson, “Electroformation of peptide self-assembled
monolayers on gold,” Langmuir, vol. 28, pp. 22-26, 2012.
[106] O. R. Bolduc, J. N. Pelletier and J.-F. Masson, “SPR biosensing in crude serum using ultralow
fouling binary patterned peptide SAM,” Analytical Chemistry, vol. 82, pp. 3699-3706, 2010.
[107] K. Nowinski, F. Sun, D. White, J. Keefe and S. Jiang, “Sequence, structure, and function of peptide
self-assembled monolayers,” Journal of the American Chemical Society, vol. 134, pp. 6000-6005,
2012.
[108] S. Chen, Z. Cao and S. Jiang, “Ultra-low fouling peptide surfaces derived from natural amino
acids,” Biomaterials, vol. 30, pp. 5892-5896, 2009.
[109] E. Gatto, A. Prochetta, M. Scarselli, M. De Crescenzi, F. Formaggio, C. Toniolo and M. Venanzi,
“Playing with Peptides: How to Build a Supramolecular Peptide Nanostructure by Exploiting
Helix Helix Macrodipole Interactions,” Langmuir, vol. 28, pp. 2817-2826, 2012.
[110] E. Gatto and M. Venanzi, “Self-assembled monolayers formed by helical peptide buiding blocks:
a new tool for bioinspired nanotechnology,” Polymer Journal, pp. 1-13, 2013.
Page 171
155
[111] K. Fujita, N. Bunjes, K. Nakajima, M. Hara, H. Sasabe and W. Knoll, “Macrodipole Interaction of
Helical Peptides in a Self-Assembled Monolayer on Gold Substrate,” Langmuir, vol. 14, pp. 6167-
6172, 1998.
[112] L. Duchesne, G. Wells, D. G. Fernig, S. A. Harris and R. Levy, “Supramolecular Domains in Mixed
Peptide Self-Assembled Monolayers on Gold Nanoparticles,” ChemBioChem, vol. 9, pp. 2127-
2134, 2008.
[113] S. M. Morris, “A role for p53 in the frequency and mechanism of mutation,” Mutation Research,
vol. 511, pp. 45-62, 2002.
[114] J. G. Teodoro, S. K. Evans and M. R. Green, “Inhibition of tumor angiogenesis by p53: a new role
for the guardian of the genome,” Journal of Molecular Medicine, vol. 85, pp. 1175-1186, 2007.
[115] J. S. Fridman and S. W. Lowe, “Control of apoptosis by p53,” Oncogene, vol. 22, pp. 9030-9040,
2003.
[116] K. H. Vousden and X. Lu, “Live or let die: the cell's response to p53,” Nature Reviews Cancer, vol.
2, pp. 594-604, 2002.
[117] A. B. Deleo, G. Jay, E. Appella, G. C. Dubois, L. W. Law and L. J. Old, “Detection of a
transformation-related antigen in chemically induced sarcomas and other transformed cells of
the mouse,” Proceedings of the National Academy of Sciences, vol. 76, pp. 2420-2424, 1979.
[118] D. P. Lane and L. V. Crawford, “T antigen bound to a host protein in SV40-transformed cells,”
Nature, vol. 278, pp. 261-263, 1979.
[119] D. I. Linzer and A. J. Levine, “Characterization of a 54 kDalton cellular SV40 tumor antigen
present in SV40-transformed cells and uninfected embryonal carcinoma cells,” Cell, vol. 17, pp.
43-52, 1979.
[120] M. S. Greenblatt, W. P. Bennett, M. Hollstein and C. C. Harris, “Mutations in the p53 Tumor
Suppressor Gene: Clues to Cancer Etiology and Molecular Pathogenesis,” Cancer Research, vol.
54, pp. 4855-4878, 1994.
[121] J. Momand, G. P. Zambetti, D. C. Olson, D. George and A. J. Levine, “The mdm-2 oncogene
product forms a complex with the p53 protein and inhibits p53-mediated transactivation,” Cell,
vol. 69, pp. 1237-1245, 1992.
[122] S. S. Fakharzadeh, S. P. Trusko and D. L. George, “Tumorogenic potential associated with
enhanced expression of a gene that is amplified in a mouse tumor cell line,” The EMBO Journal,
vol. 10, pp. 1565-1569, 1991.
[123] J. Oliner, K. Kinzler, P. Meltzer, D. George and B. Vogelstein, “Amplification of a gene encoding
a p53-associated protein in human sarcomas,” Nature, vol. 358, pp. 80-83, 1992.
[124] C. Cordon-Cardo, E. Latres, M. Drobujak, M. R. Oliva, D. Pollack, J. M. Woodruff, V. Marechal, J.
Chen, M. F. Brennan and A. J. Levine, “Molecular Abnormalities of mdm2 and p53 Genes in
Adult Soft Tissue Sarcomas',” Cancer Research, vol. 54, pp. 794-799, 1994.
Page 172
156
[125] F. S. Leach, T. Tokino, P. Meltzer, M. Burrell, J. D. Oliner, S. Smith, D. E. Hill, D. Sidransky, K. W.
Kinzler and B. Vogelstein, “p53 Mutation and MDM2 Amplification in Human Soft Tissue
Sarcomas,” Cancer Research, pp. 2231-2234, 1993.
[126] G. Reifenberger, L. Liu, K. Ichimura, E. E. Schmidt and V. P. Collins, “Amplification and
Overexpression of the MDM2 Gene in a Subset of Human Malignant Gliomas without p53
Mutations,” Cancer Research, vol. 53, pp. 2736-2739, 1993.
[127] C. Bueso-Ramos, Y. Yang, E. deLeon, P. McCown, S. Stass and M. Albitar, “The Human MDM2
Oncogene is Overexpressed in Leukemias,” Blood, vol. 82, pp. 2617-2623, 1993.
[128] A. Marchetti, F. Buttitta, S. Girlando, P. Dalla Palma, S. Pellegrini, P. Fina, C. Doglioni, G.
Bevilacqua and M. Barbareschi, “MDM2 gene alterations and MDM2 protein expression in
breast carcinomas,” The Journal of Pathology, vol. 175, pp. 31-38, 1995.
[129] I. Shibagaki, H. Tanaka, Y. Shimada, T. Wagata, M. Ikenaga, M. Imamura and K. Ishizaki, “p53
mutation, murine double minute 2 amplification, and human papillomavirus infection are
frequently involved but not associated with each other in esophageal squamous cell
carcinoma,” Clinical Cancer Research, vol. 1, pp. 769-773, 1995.
[130] J. Momand, H.-H. Wu and G. Dasgupta, “MDM2— master regulator of the p53 tumor suppressor
protein,” Gene, vol. 242, pp. 15-29, 2000.
[131] T. Juven-Gershon and M. Oren, “Mdm2: The Ups and Downs,” Molecular Medicine, vol. 5, pp.
71-83, 2000.
[132] J. Momand, D. Jung, S. Wilczynski and J. Niland, “The MDM2 gene amplification database,”
Nucleic Acids Research, vol. 26, pp. 3453-3459, 1998.
[133] S. Daujat, H. Neel and J. Piette, “MDM2:life without p53,” Trends in Genetics, vol. 17, pp. 459-
464, 2001.
[134] D. Michael and M. Oren, “The p53-Mdm2 module and the ubiquitin system,” Seminars in Cancer
Biology, vol. 13, pp. 49-58, 2003.
[135] E. Pennisi, “Filling In the Blanks in the p53 Protein Structure,” Science, vol. 274, pp. 921-922,
1996.
[136] S. Wang, Y. Zhao, D. Bernard, A. Aguilar and S. Kumar, “Targeting the MDM2-p53 Protein-
Protein Interaction for New Cancer Therapeutics,” in Topics in Medicinal Chemistry: Protein-
Protein Interactions, vol. 8, Berlin Heidelberg, Springer, 2012, pp. 57-80.
[137] P. H. Kussie, S. Gorina, V. Marechal, B. Elenbaas, J. Moreau, A. J. Levine and N. P. Pavletich,
“Structure of the MDM2 Oncoprotein Bound to the p53 Tumor Suppressor Transactivation
Domain,” Science, vol. 274, pp. 948-953, 1996.
[138] M. A. McCoy, J. J. Gesell, M. M. Senior and D. F. Wyss, “Lid to the p53-Binding Domain of Human
Mdm2: Implications for p53 Regulation,” Proceedings of the National Academy of Sciences, vol.
100, pp. 1645-1648, 2003.
Page 173
157
[139] N. Magnasco Nichols and K. Shive Matthews, “p53 Unfolding Detected by CD but Not by
Tryptophan Fluorescence,” Biochemical and Biophysical Research Communications, vol. 288,
pp. 111-115, 2001.
[140] T. M. Webber, A. C. Allen, W. K. Ma, R. G. Molloy and C. N. Kettelkamp, “Conformational
detection of p53's oligomeric state by FlAsH Fluorescence,” Biochemical and Biophysical
Research Communications, vol. 384, pp. 66-70, 2009.
[141] M. Wallace, E. Worall, S. Pettersson, T. R. Hupp and K. L. Ball, “Dual-Site Regulation of MDM2
E3-Ubiquitin Ligase Activity,” Molecular Cell, vol. 23, pp. 251-263, 2006.
[142] L. M. Espinoza-Fonseca and J. Garcia-Machorro, “Aromatic-aromatic interactions in the
formation of the MDM2-p53 complex,” Biochemical and Biophysical Research Communications,
vol. 370, pp. 547-551, 2008.
[143] Z. Liu, E. T. Olejniczak and S. W. Fesik, “Over-expression of the human MDM2 p53 binding
domain by fusion to a p53 transactivation domain,” Protein Expression and Purification, vol. 37,
pp. 493-498, 2004.
[144] M. Wells, H. Tidow, T. J. Rutherford, P. Markwick, J. Ringkjobing, E. Mylonas, D. I. Svergun, M.
Blackledge and A. F. Fersht, “Structure of Tumor Suppressor p53 and Its Intrinsically Disorderd
N-Terminal Transactivation Domain,” Proceedings of the National Academy of Sciences, vol.
105, pp. 5762-5767, 2008.
[145] J. D. Oliner, J. A. Pietenpol, S. Thiagalingam, J. Gyuris, K. W. Kinzler and B. Vogelstein,
“Oncoprotein MDM2 conceals the activation domain of tumour suppressor p53,” Nature, vol.
362, pp. 857-860, 1993.
[146] J. Lin, J. Chen, B. Elenbaas and A. J. Levine , “Several hydrophobic amino acids in the p53 amino-
terminal domain are required for transcriptional activation, binding to mdm-2 and the
adenovirus 5 E1B 55-kD protein,” Genes & Development, vol. 8, pp. 1235-1246, 1994.
[147] S. Picksley, B. Vojtesek, A. Sparks and D. P. Lane, “Immunochemical analysis of the interaction
of p53 with MDM2;--fine mapping of the MDM2 binding site on p53 using synthetic peptides,”
Oncogene, vol. 9, pp. 2523-2529, 1994.
[148] R. Zhang and H. Wang, “MDM2 Oncogene as a Novel Target for Human Cancer Therapy,”
Current Pharmaceutical Design, vol. 6, pp. 393-416, 2000.
[149] E. Rayburn, R. Zhang, J. He and H. Wang, “MDM2 and Human Malignancies: Expression, Clinical
Pathology, Prognostic Markers, and Implications for Chemotherapy,” Current Cancer Drug
Targets, vol. 5, pp. 27-41, 2005.
[150] Y. Takahashi, Y. Oda, K.-i. Kawaguchi, S. Tamiya, H. Yamamoto, S. Suita and M. Tsuneyoshi,
“Altered expression and molecular abnormalities of cell-cycle-regulatory proteins in
rhabdomyosarcoma,” Modern Pathology, vol. 17, pp. 660-669, 2004.
[151] M. Ladanyi, R. Lewis, S. C. Jhanwar, W. Gerald, A. G. Huvos and J. H. Healey, “MDM2 and CDK4
Gene Amplification in Ewing's Sarcoma,” The Journal of Pathology, vol. 175, pp. 211-217, 1995.
Page 174
158
[152] J. M. Gudas, H. Nguyen, R. C. Klein, D. Katayose, P. Seth and K. H. Cowan, “Differential Expression
of Multiple MDM2 Messenger RNAs and Proteins in Normal and Tumorigenic Breast Epithelial
Cells,” Clinical Cancer Research, vol. 1, pp. 71-80, 1995.
[153] J. Weaver, P. Rao, J. R. Goldblum, M. J. Joyce, S. L. Turner, A. J. Lazar, D. Lopez-Terada, R. R.
Tubbs and B. P. Rubin, “Can MDM2 analytical tests performed on core needle biopsy be relied
upon to diagnose well-differentiated liposarcoma?,” Modern Pathology, vol. 23, pp. 1301-1306,
2010.
[154] Y. A. Valentin-Vega, J. A. Barboza, G. P. Chau, A. K. El-Naggar and G. Lozano, “High levels of the
p53 inhibitor MDM4 in head and neck squamous carcinomas,” Human Pathology, vol. 38, pp.
1553-1562, 2007.
[155] R. Elshafey, C. Tlili, A. Abulrob, A. C. Tavares and M. Zourob, “Label-free impedimetric
immunosensor for ultrasensitive detection of cancer marker Murine double minute 2 in brain
tissue,” Biosensors and Bioelectronics, vol. 39, pp. 220-225, 2013.
[156] H. Li, H. Xie, Y. Huang, B. Bo, X. Zhu, Y. Shu and G. Li, “Highly sensitive protein detection based
on a novel probe with catalytic activity combined with a signal amplification strategy: assay of
MDM2 for cancer staging,” Chemical Communications, vol. 49, pp. 9848-9850, 2013.
[157] A. Hamelin, “Cyclic voltammetry at gold single-crystal surfaces. Part 1. Behaviour at low-index
faces,” Journal of Electroanalytical Chemistry, vol. 407, pp. 1-11, 1996.
[158] A. Hamelin, “Cyclic voltammetry at gold single-crystal surfaces. Part 2. Behaviour of high-index
faces,” Journal of Electroanalytical Chemistry, vol. 407, pp. 13-21, 1996.
[159] O. Schon, A. Friedler, M. Bycroft, S. M. Freund and A. R. Fersht, “Molecular Mechanism of the
Interaction between MDM2 and p53,” Journal of Molecular Biology, vol. 323, pp. 491-501, 2002.
[160] K. Kusmierczyk, M. Lukaszewski, Z. Rogulski, H. Siwek, J. Kotowski and A. Czerwinski,
“Electrochemical Behavior of Pt-Au alloys,” Polish Journal of Chemistry, vol. 76, pp. 607-618,
2002.
[161] Southampton Electrochemistry Group, Instrumental Methods in Electrochemistry, Chichester:
Horwood Publishing,Chemical science series, 2001.
[162] A. J. Bard and L. R. Faulkner, Electrochemical Methods: Fundamentals and Applications, 2nd ed.,
New York: John Wiley &Sonc, Inc., 2001.
[163] M. E. Orazem and B. Tribollet, Electrochemical Impedance Spectroscopy, Hoboken: John Wiley
& Sons, Inc., 2008.
[164] A. Janshoff, H.-J. Galla and C. Steinem, “Piezoelectric Mass-Sensing Devices as Biosensors-An
Alternative to Optical Biosensors?,” Angewandte Chemie International Edition, vol. 39, pp.
4004-4032, 2000.
[165] U. Rant, K. Arinaga, S. Fujita, N. Yokoyama, G. Abstreiter and M. Tornow, “Structural Properties
of Oligonucleotide Monolayers on Gold Surface Probed by Fluorescence Investigations,”
Langmuir, vol. 20, pp. 10086-10092, 2004.
Page 175
159
[166] H. Finklea, in Electroanalytical Chemistry, vol. 19, A. Bard and I. Rubinstein, Eds., 1996, pp. 109-
335.
[167] M. A. Coleman, V. H. Lao, B. W. Segelke and P. T. Beernink, “High-Throughput, Fluorescence-
Based Screening for Soluble Protein Expression,” Journal of Proteome Research, vol. 3, p. 1024–
1032, 2004.
[168] D. Finnskog, A. Ressine, T. Laurell and G. Marko-Varga, “Integrated Protein Microchip Assay with
Dual Fluorescent- and MALDI Read-Out,” Journal of Proteome Research, vol. 3, p. 988–994,
2004.
[169] G. Hui, “UPA, a universal protein array system for quantitative detection of protein–protein,
protein–DNA, protein–RNA and protein–ligand interactions,” Nucleic Acids Research, vol. 28, p.
e2, 2000.
[170] K.-Y. Tomizaki, K. Usui and H. Mihara, “Protein-Detecting Microarrays: Current
Accomplishments and Requirements,” ChemBioChem, vol. 6, pp. 782-799, 2005.
[171] H.-Z. Yu, C.-Y. Luo, C. G. Sankar and S. Dipankar, “Voltammetric Procedure for Examining DNA-
Modified Surfaces: Quantitation, Cationic Binding Activity, and Electron-Transfer Kinetics,”
Analytical Chemistry, vol. 75, pp. 3902-3907, 2003.
[172] L. Su, C. G. Sankar, D. Sen and H.-Z. Yu, “Kinetics of Ion-Exchange Binding of Redox Metal Cations
to Thiolate-DNA Monolayers on Gold,” Analytical Chemistry, vol. 76, pp. 5953-5959, 2004.
[173] M. Steichen, T. Doneux and C. Buess-Herman, “On the adsorption of hexaammineruthenium
(III) at anionic self-assembled monolayers,” Electrochimica Acta, vol. 53, p. 6202–6208, 2008.
[174] A. J. Bard and L. R. Faulkner, “Chapter 14. Electroactive Layers and Modified Electrodes,” in
Electrochemical Methods: Fundamentals and Applications, 2nd Edition ed., New York, John
Wiley &Sonc, Inc., 2001, pp. 580-631.
[175] A. B. Steel, T. M. Herne and M. J. Tarlov, “Electrostatic Interactions of Redox Cations with
Surface-Immobilized and Solution DNA,” Bioconjugate Chemistry, vol. 10, pp. 419-423, 1999.
[176] K. Arinaga, U. Rant, M. Tornow, S. Fujita, G. Abstreiter and N. Yokoyama, “The Role of Surface
Charging during the Coadsorption of Mercaptohexanol to DNA Layers on Gold: Direct
Observation of Desorption and Layer Reorientation,” Langmuir, vol. 22, pp. 5560-5562, 2006.
[177] D. M. Ceres, A. K. Udit, H. D. Hill, M. G. Hill and J. K. Barton, “Differential Ionic Permeation of
DNA-Modified Electrodes,” Journal of Physical Chemistry B, vol. 111, pp. 663-668, 2007.
[178] H. Lee, K. H. Mok, R. Muhandiram, K.-H. Park, J.-E. Suk, D.-H. Kim, J. Chang, Y. C. Sung, K. Y. Choi,
H. Kyou-Hoon and K.-H. Han, “Local structural elements in the mostly unstructured
transcriptional activation domain of human p53,” The Journal of biological chemistry, vol. 275,
pp. 29426-29432, 2000.
[179] J. Y. Chen, M. Li, L. S. Penn and J. Xi, “Real-Time and Label-Free Detection of Cellular Response
to Signaling Mediated by Distinct Subclasses of Epidermal Growth Factor Receptors,” Analytical
Chemistry, vol. 83, pp. 3141-3146, 2011.
Page 176
160
[180] H. Choi and S.-J. Choi, “Detection of Edwardsiella tarda by fluorometric or biosensor methods
using peptide ligand,” Analytical Biochemistry, vol. 421, pp. 152-157, 2012.
[181] T. Hianik, V. Ostatna , Z. Zajacova, E. Stoikova and G. Evtugyn, “Detection of aptamer-protein
interactions using QCM and electrochemical indicator methods,” Bioorganic & Medicinal
Chemistry Letters, vol. 15, pp. 291-295, 2005.
[182] T. Hianik, V. Ostatna and Z. Zajacova, “The study of the binding of globular protein to DNA using
mass detection and electrochemical indicator methods,” Journal of Electroanalytical Chemistry,
vol. 564, pp. 19-24, 2004.
[183] Y. Xiao and S. N. Isaacs, “Enzyme-linked immunosorbent assay (ELISA) and blocking with bovine
serum albumin (BSA)—not all BSAs are alike,” Journal of Immunological Methods, vol. 384, pp.
148-151, 2012.
[184] Y. Lin, J. Wang, L.-J. Wan and X.-H. Fang, “Study of fibrinogen adsorption on self-assembled
monolayers on Au(111) by atomic force microscopy,” Ultramicroscopy, vol. 105, p. 129–136,
2005.
[185] K. K. Kanazawa and J. G. Gordon, “The oscillation frequency of a quartz resonator in contact
with liquid,” Analytica Chimica Acta, vol. 175, pp. 99-105, 1985.
[186] K. K. Kanazawa and J. G. Gordon, “Frequency of a quartz microbalance in contact with liquid,”
Analytical Chemistry, vol. 57, pp. 1770-1771, 1985.
[187] S. Bruckenstein and M. Shay, “Experimental aspects of the use of the quartz crystal
microbalance in solution,” Electrochimica Acta, vol. 30, pp. 1295-1300, 1985.
[188] [Online]. Available: http://www.biocompare.com/pfu/110627/soids/2-
2010/ELISA_Kit/ELISA_MDM2. [Accessed 16 06 2015].
[189] D. A. Skoog, J. F. Holler and T. A. Nieman, Principles of Instrumental Analysis, 5th ed., H. B. &.
Company, Ed.
[190] B. Valeur and M. N. Berberan-Santos, Molecular Fluorescence Principle and Applications, 2nd
ed., Wiley-VCH, 2012.
[191] S. S. Vogel, B. W. van der Meer and P. S. Blank, “Estimating the distance separating fluorescent
protein FRET pairs,” Methods, vol. 66, pp. 131-138, 2014.
[192] L. Stryer and R. Haugland, “Energy transfer: a spectroscopic ruler,” Proceedings of the National
Academy of Sciences, vol. 58, pp. 719-726, 1967.
[193] R. R. Chance, A. Prock and R. Silbey, “Molecular Fluorescence and Energy Transfer Near
Interfaces,” in Advances in Chemical Physics, vol. 37, I. Prygogine and S. A. Rice, Eds., Hoboken,
John Wiley & Sons, Inc., 1978.
[194] H. Kuhn, “Classical Aspects of Energy Transfer in Molecular Systems,” The Journal of Chemical
Physics, vol. 53, pp. 101-108, 1970.
Page 177
161
[195] U. Rant, K. Arinaga, S. Fujita, N. Yokoyama, G. Abstreiter and M. Tornow, “Dynamic Electrical
Switching of DNA Layers on a Metal Surface,” Nanoletters, vol. 4, pp. 2441-2445, 2004.
[196] S. Takeishi, U. Rant, T. Fujiwara, K. Buchholz, T. Usuki, K. Arinaga, K. Takemoto, Y. Yamaguchi,
M. Tornow, S. Fujita, G. Abstreiter and N. Yokoyama, “Observation of electrostatically released
DNA from gold electrodes with controlled treshold voltages,” Journal of Chemical Physics, vol.
120, pp. 5501-5504, 2004.
[197] [Online]. Available:
http://www.microscopyu.com/articles/fluorescence/filtercubes/filterindex.html. [Accessed 05
06 2015].
[198] [Online]. Available: http://www.microscopyu.com/tutorials/flash/spectralprofiles/index.html.
[Accessed 08 06 2015].
[199] [Online]. Available: http://www.rocketmime.com/astronomy/Telescope/ResolvingPower.html.
[Accessed 08 06 2015].
[200] [Online]. Available: http://zeiss-campus.magnet.fsu.edu/articles/basics/resolution.html.
[Accessed 08 06 2015].
[201] [Online]. Available: http://rsb.info.nih.gov/ij/. [Accessed 16 06 2015].
[202] J. C. Russ, The Image Processing Handbook, 6th ed., Boca Raton: CRC Press Taylor & Francis
Group, 2011.
[203] N. Otsu, “A Threshold Selection Method from Grey-Level Histograms,” IEEE Transactions on
Systems, Man, and Cybernetics, vol. SMC9, pp. 62-66, 1979.