Page 1
ERA Business Unit: ERA Technology
Report Title: Interference from Radars into Adjacent Band
UMTS and WiMAX Systems
Author(s): Z Wang, M Ganley, Bal Randhawa, I Parker.
Client: Ofcom
Client Reference: Kamlesh Masrani
ERA Report Number: 2007-0554
ERA Project Number: 7G0403803
Report Version: Final Report
Document Control: Commercial-in-Confidence
ERA Report Checked by:
Approved by:
Stephen Munday
Ofcom Resource Project Manager
Martin Ganley
Head of RF & EMC
September 07
Ref. C:\ERA\Ofcom 2.6GHz radar\Final Report.doc
Page 2
ERA Report 2007-0554
Ref: C:\ERA\Ofcom 2.6GHz radar\Final Report.doc
© ERA Technology Ltd
2
© Copyright ERA Technology Limited 2007 All Rights Reserved
No part of this document may be copied or otherwise reproduced without the prior written permission of ERA Technology Limited. If received electronically, recipient is permitted to make such copies as are necessary to: view the document on a computer system; comply with a reasonable corporate computer data protection and back-up policy and produce one paper copy for personal use.
Disclaimer
This report ("report") has been prepared by ERA Technology Ltd for Ofcom, in connection with the award of wireless
telegraphy licences to use the three spectrum bands at 2500-2690 MHz and 2010MHz -2025MHz (the “Spectrum Bands”).
This report is intended for information purposes only. This report is not intended to form any part of the basis of any
investment decision or other evaluation or any decision to participate in the award process for the Spectrum Bands, and
should not be considered as a recommendation by Ofcom or its advisers to any recipient of this report to participate in the
award process for the Spectrum Bands. Each recipient of this report must make its own independent assessment of the
potential value of a licence after making such investigation as it may deem necessary in order to determine whether to
participate in the award process for the Spectrum Bands. All information contained in this report is subject to updating and
amendment.
The content of the report, or any other communication by or on behalf of Ofcom or any of its advisers, should not be
construed as technical, financial, legal, tax or any other advice or recommendation. Accordingly, any person considering
participating in the award process for the Spectrum Bands (either directly or by investing in another enterprise) should
consult its own advisers as to these and other matters or in respect of any other assignment of any radio spectrum.
Limitations
The results detailed in this report apply only to the tests made at that time, using the test equipment detailed and are
indicative. They do not indicate that on another date an identical set of results may be achieved, due to changes in the local
environmental conditions, characteristics of different receivers, test equipments or other factor which may or may not have
an effect on the measurement results obtained at that future time.
DOCUMENT CONTROL
If no restrictive markings are shown, the document may be distributed freely in whole, without alteration, subject to Copyright.
ERA Technology Ltd Cleeve Road Leatherhead Surrey KT22 7SA UK Tel : +44 (0) 1372 367000 Fax: +44 (0) 1372 367099 E-mail: [email protected]
Read more about ERA Technology on our Internet page at: http://www.era.co.uk/
Page 3
ERA Report 2007-0554
Ref: C:\ERA\Ofcom 2.6GHz radar\Final Report.doc
© ERA Technology Ltd
3
Summary
Ofcom has recently commissioned a series of technical studies in support of the award of
spectrum in the band 2500 to 2690 MHz [1], [2] which could possibly be occupied in the
future by systems such as UMTS or WiMAX. This band is very near to the band 2700 to
3100 MHz used by aeronautical and military radars and there is the potential for adjacent
channel interference from radars into the 2.6GHz band due to the nature of radar out-of-
band (OOB) and spurious emissions. Ofcom commissioned ERA Technology Ltd to
undertake a measurement programme to identify the potential for interference to UMTS and
WiMAX systems operating in adjacent bands to aeronautical and military radars. This report
details the measurements that were undertaken and the conclusion drawn by ERA on the
findings.
Measurements were undertaken at four airports characterising the emissions arising from
solid-state, Travelling Wave Tube (TWT) and magnetron technologies. In addition, laboratory
measurements have been performed using simulated radar signals generated by a
Frequency Agile Signal Simulator and a signal generator (using pulse building software).
The conducted laboratory based measurements have been used to gain a deeper
understanding of the interference mechanism from radar emissions into UMTS(mobile
modelled according to specifications ETSI 3GPP TS 25.101) and WiMAX systems(fixed user
unit modelled according to specifications IEEE 802.16-2004).
It was determined in the laboratory that the degradation of the UMTS and WiMAX systems
was dominated by the average power experienced, as a result of the radar side-lobe
emissions, as opposed to the intermittent peak experienced from the radar antenna main
beam. It is therefore found to be important to be precise in the methodology used for the
calculation of any C/I protection criteria (whether peak or average interference) and how
these are used in subsequent interference simulations. Protection criteria based on both
peak and average interference levels are given within the report for comparison. Also
provided for comparison are the level of Carrier Wave (CW) and Additive White Gaussian
Noise (AWGN) emission required to cause co-frequency interference to the UMTS or
WiMAX system.
ERA’s analysis of the results from the airport measurements indicate that the bit error rate
(BER) in the presence of the measured radar interference was less than 10e-3 (0.1%) to
either the UMTS or WiMAX systems at a separation distance of 600m from the radar and
with a set minimum usable carrier signal for the wanted system. These results were based
on the measurement of BER within a reference UMTS channel having a user data-rate of
12.2 kbps, and into a reference WiMAX channel having a user data rate of 1.5mbps. It
should be noted the study did not consider the effect of radar interference to other system
parameters such as quality of service or the impact radar interference has on particular
types of communication applications (e.g., voice, video, and different types of data
transmissions).
Page 4
ERA Report 2007-0554
Ref: C:\ERA\Ofcom 2.6GHz radar\Final Report.doc
© ERA Technology Ltd
4
All the results were established on the basis of the radar interference being co-channel with
the communications receiver. In practice, the communications systems operating in the
2.6GHz band may well be separated greater than about 18 MHz away from a radar centre
frequency and, as such, may be expected to experience radar powers at least 20 to 30dB
below the co-frequency radar power level.
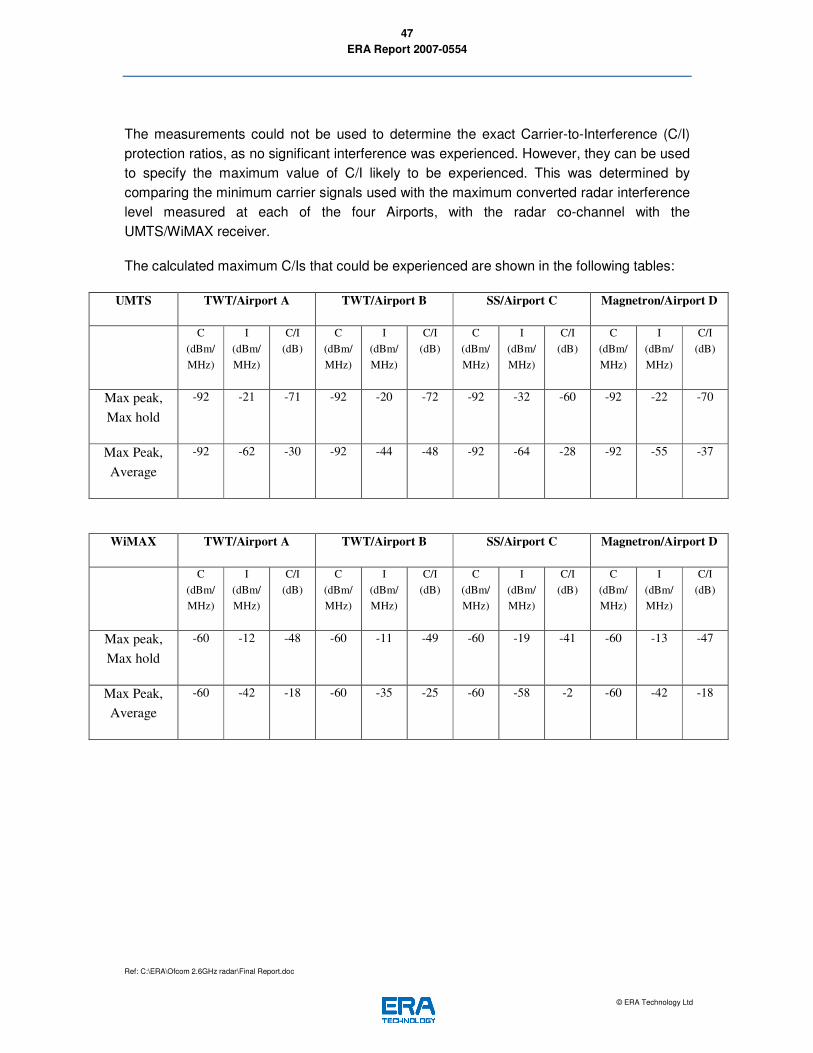
The measurements could not be used to determine the exact Carrier-to-Interference (C/I)
protection ratios, as no significant interference was experienced. However, they can be used
to specify the maximum value of C/I likely to be experienced. This was determined by
comparing the minimum carrier signals used with the maximum radar interference level
measured at each of the four Airports, when the radar and the UMTS/WiMAX receiver were
operating in the same channel.
The calculated maximum C/Is that could be experienced are shown in the following tables:
UMTS TWT/Airport A TWT/Airport B SS/Airport C Magnetron/Airport D
C
(dBm/
MHz)
I
(dBm/
MHz)
C/I
(dB)
C
(dBm/
MHz)
I
(dBm/
MHz)
C/I
(dB)
C
(dBm/
MHz)
I
(dBm/
MHz)
C/I
(dB)
C
(dBm/
MHz)
I
(dBm/
MHz)
C/I
(dB)
Max peak,
Max hold
-92 -21 -71 -92 -20 -72 -92 -32 -60 -92 -22 -70
Max Peak,
Average
-92 -62 -30 -92 -44 -48 -92 -64 -28 -92 -55 -37
WiMAX TWT/Airport A TWT/Airport B SS/Airport C Magnetron/Airport D
C
(dBm/
MHz)
I
(dBm/
MHz)
C/I
(dB)
C
(dBm/
MHz)
I
(dBm/
MHz)
C/I
(dB)
C
(dBm/
MHz)
I
(dBm/
MHz)
C/I
(dB)
C
(dBm/
MHz)
I
(dBm/
MHz)
C/I
(dB)
Max peak,
Max hold
-60 -12 -48 -60 -11 -49 -60 -19 -41 -60 -13 -47
Max Peak,
Average
-60 -42 -18 -60 -35 -25 -60 -58 -2 -60 -42 -18
Page 5
ERA Report 2007-0554
Ref: C:\ERA\Ofcom 2.6GHz radar\Final Report.doc
© ERA Technology Ltd
5
Contents
Page No.
1 Introduction 14
2 Objectives 15
3 Test Methodology 16
3.1 Introduction 16
3.2 Identification of radars 17
3.3 Radar interference into UMTS 20
3.4 Radar interference into WIMAX 23
3.5 Measurement Procedure 25
4 Results 26
4.1 Measured Radar Emissions 26
4.1.1 TWT/airport [A] 26
4.1.2 TWT/airport [B] 30
4.1.3 Solid State/Airport [C] 33
4.1.4 Magnetron/Airport [D] 37
4.2 Interference from Radar into Communications Equipment 39
4.2.1 Interference from Radar into UMTS DL 40
4.2.2 Interference from Radar into WiMAX 43
4.3 Conducted measurements of simulated radar emissions 44
4.3.1 Conducted measurements of C/W and AWGN 44
4.3.2 Simulated radar emissions using FASS 45
Page 6
ERA Report 2007-0554
Ref: C:\ERA\Ofcom 2.6GHz radar\Final Report.doc
© ERA Technology Ltd
6
4.3.3 Simulated radar emissions using a Signal Generator 45
5 Conclusions 46
6 References 48
APPENDIX A 49
APPENDIX B 54
APPENDIX C 57
Page 7
ERA Report 2007-0554
Ref: C:\ERA\Ofcom 2.6GHz radar\Final Report.doc
© ERA Technology Ltd
7
Tables List
Page No.
Table 1: Typical ATC radar parameters ..................................................................................18
Table 2: UMTS downlink signal parameters ...........................................................................20
Table 3: DL reference measurement channel physical parameters (12.2 kps)......................21
Table 4: UL reference measurement channel physical parameters (12.2 kps)......................21
Table 5: Out of band blocking and Spurious Response .........................................................21
Table 6: Frequency offsets for concerned UMTS and radar frequencies...............................22
Table 7: Wanted WiMAX signal parameters ...........................................................................23
Table 8: Frequency offsets for concerned WiMAX and radar frequencies.............................24
Table 9 Calculation of received maximum signal levels .........................................................41
Table 10: Maximum C/I values for radar to UMTS interference .............................................43
Table 11: Maximum C/I values for radar to WiMAX interference ...........................................44
Table 12: Measured C/I using AWGN and CW interference sources ....................................44
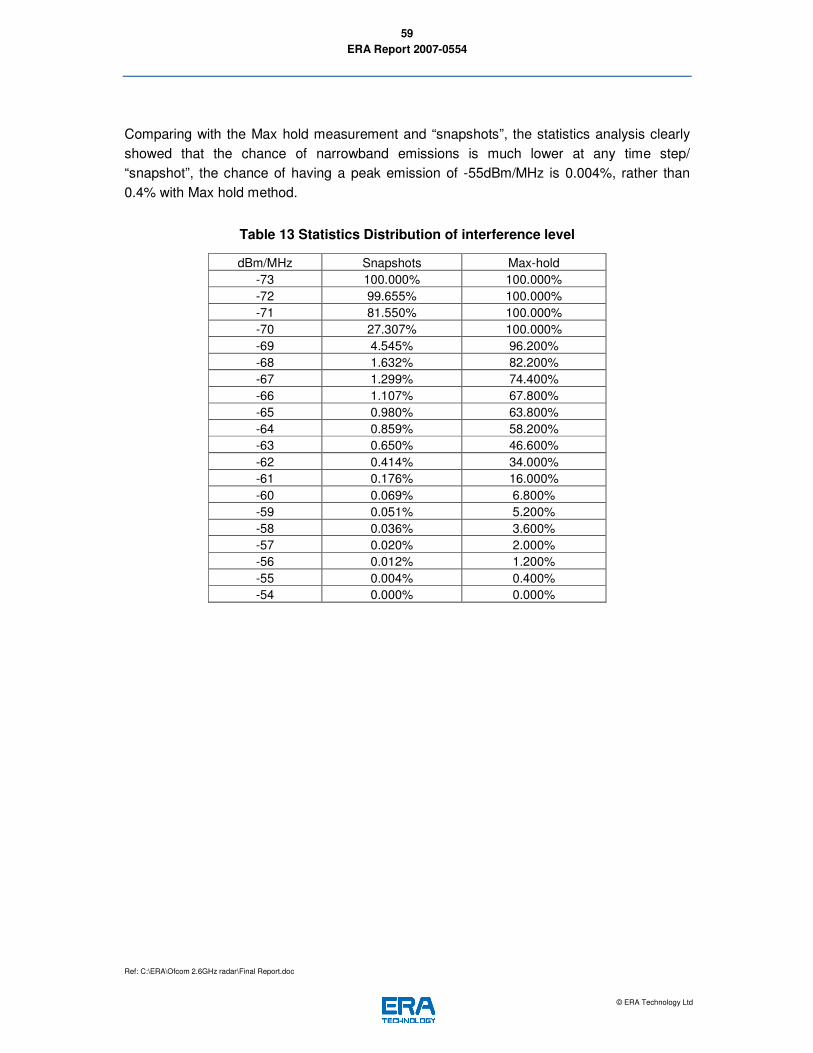
Table 13 Statistics Distribution of interference level ...............................................................59
Page 8
ERA Report 2007-0554
Ref: C:\ERA\Ofcom 2.6GHz radar\Final Report.doc
© ERA Technology Ltd
8
Figures List
Page No.
Figure 1: Example of radar emission mask and out-of-band and spurious emissions falling
into potentially new UMTS/WiMAX bands .......................................................................15
Figure 2: 2.6 GHz award band adjacencies ............................................................................16
Figure 3: Example of measured harmonics from a magnetron radar.....................................18
Figure 4: Radar interference zones.........................................................................................19
Figure 5: Illustrative radar pulse train as seen by a stationary receiver .................................19
Figure 6 Radar emission measurement setup ........................................................................20
Figure 7: Conducted measurement setup for radar interference into UMTS .........................22
Figure 8: Conducted measurement setup for WiMAX 802.16-2004.......................................25
Figure 9: Measurement location of TWT/airport [A] ................................................................27
Figure 10: Measured emissions at TWT/airport [A] showing a large number of consecutive
radar sweeps individually, using a peak detector, and max-hold for the length of one
radar rotation. ...................................................................................................................28
Figure 11: Measured emissions at TWT/airport [A] using a peak detector, and showing the
“max hold” and average result over a long time period. ..................................................28
Figure 12: Measured emissions at TWT/airport [A] using a peak detector, and showing the
emissions in the band 2.5 to 2.69 GHz. ...........................................................................29
Figure 13: Measured emissions at TWT/airport [A] in the frequency band 2.5 to 2.69 GHz,
showing the probability of any given received power level..............................................30
Figure 14: Measurement location of TWT/airport [B] ..............................................................31
Figure 15: Measured emissions at TWT/airport [B] showing a large number of consecutive
radar sweeps individually, using a peak detector, and max-hold for the length of one
radar rotation. ...................................................................................................................32
Figure 16: Measured emissions at TWT/airport [B] using a peak detector, and showing the
“max hold” and average result over a long time period. ..................................................32
Page 9
ERA Report 2007-0554
Ref: C:\ERA\Ofcom 2.6GHz radar\Final Report.doc
© ERA Technology Ltd
9
Figure 17: Measured emissions at TWT/airport [B] in the frequency band 2.5 to 2.69GHz,
showing the probability of any given received power level..............................................33
Figure 18: Measurement location of Solid State/Airport [C]....................................................34
Figure 19: Measured emissions at solid state/Airport [C] showing a large number of
consecutive radar sweeps individually, using a peak detector, and max-hold for the
length of one radar rotation. .............................................................................................35
Figure 20: Measured emissions at solid state/Airport [C] using a peak detector, and showing
the “max hold” and average result over a long time period. ............................................35
Figure 21: Measured emissions at solid state/Airport [C] using a peak detector, and showing
the emissions in the band 2.5 to 2.69 GHz......................................................................36
Figure 22: Measured emissions at solid state/Airport [C] in the frequency band 2.5 to 2.69
GHz, showing the probability of any given received power level. ...................................36
Figure 23: Measurement location of Magnetron/Airport [D]....................................................37
Figure 24: Measured emissions at magnetron/Airport [D] showing a large number of
consecutive radar sweeps individually, using a peak detector, and max-hold for the
length of one radar rotation. .............................................................................................38
Figure 25: Measured emissions at magnetron/airport [D] using a peak detector, and showing
the “max hold” and average result over a long time period. ............................................38
Figure 26: Measured emissions at magnetron/Airport [D] in the frequency band 2.5 to 2.69
GHz, showing the probability of any given received power level ....................................39
Figure 27 Emission Limits at the measurement locations with maximum EIRP at Airports A,
predicted with freespace path loss...................................................................................41
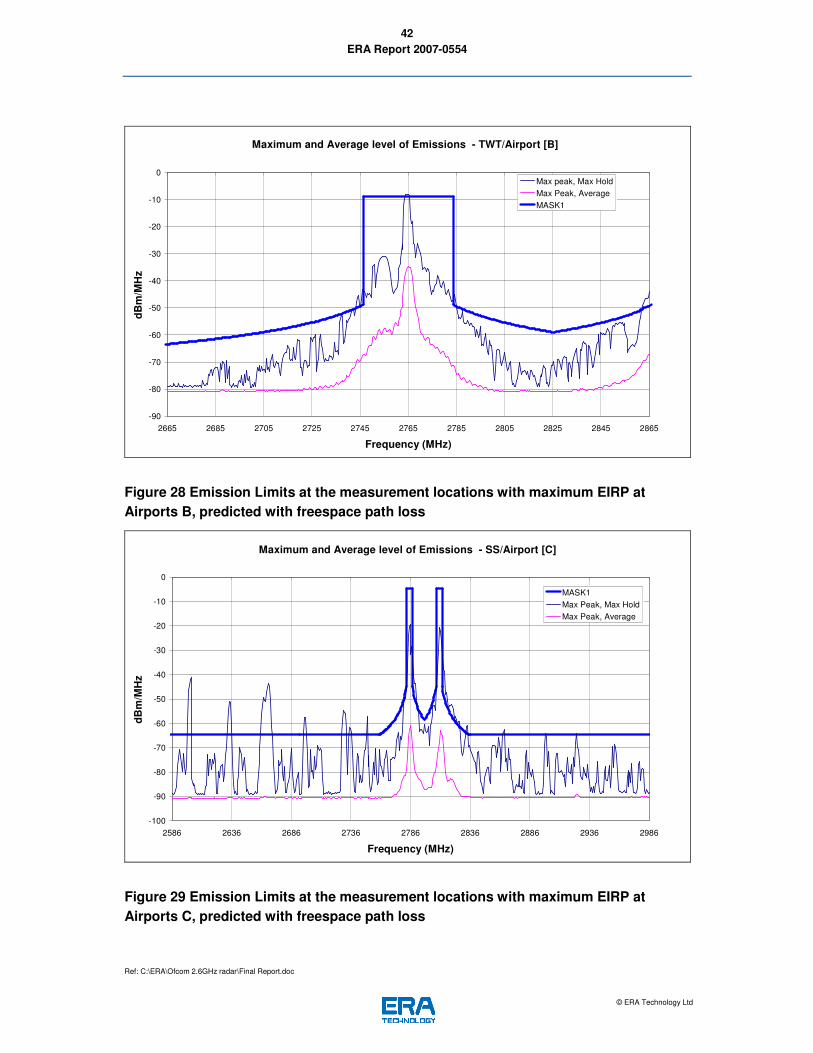
Figure 28 Emission Limits at the measurement locations with maximum EIRP at Airports B,
predicted with freespace path loss...................................................................................42
Figure 29 Emission Limits at the measurement locations with maximum EIRP at Airports C,
predicted with freespace path loss...................................................................................42
Figure 30 Emission Limits at the measurement locations with maximum EIRP at Airports D,
predicted with freespace path loss...................................................................................43
Figure 31 Validation of Radar spectra from FASS, against measurement at Airport [A] airport
and data from AMS report [6] ...........................................................................................49
Figure 32: Effect of pulse width on the TWT radar signal.......................................................50
Page 10
ERA Report 2007-0554
Ref: C:\ERA\Ofcom 2.6GHz radar\Final Report.doc
© ERA Technology Ltd
10
Figure 33: Measured and simulated antenna pattern and rotation.........................................51
Figure 34: OOB emissions falling within the UMTS and WiMAX bandwidths ........................52
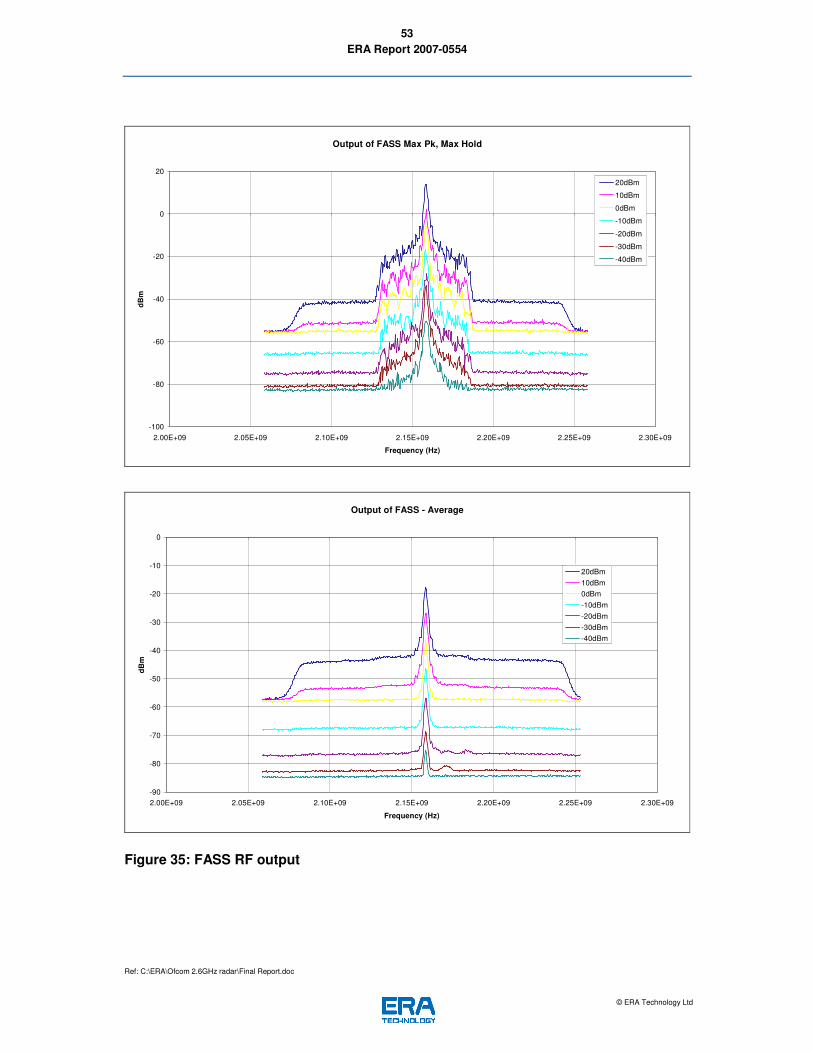
Figure 35: FASS RF output .....................................................................................................53
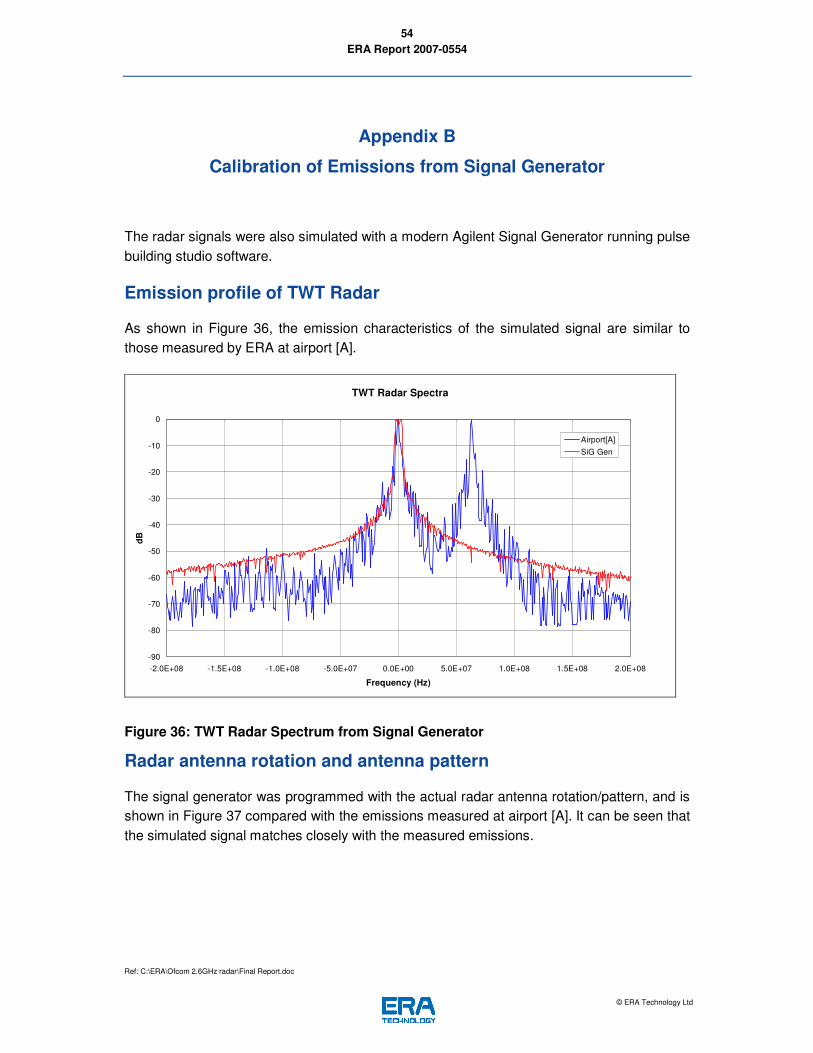
Figure 36: TWT Radar Spectrum from Signal Generator .......................................................54
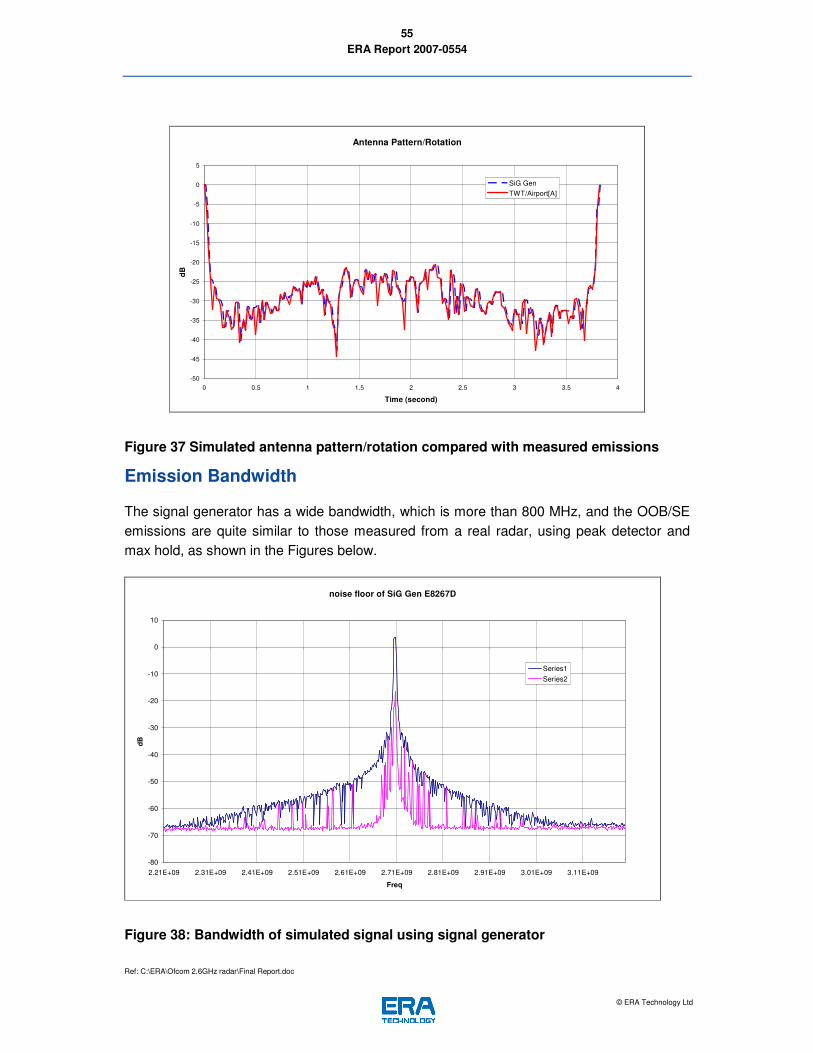
Figure 37 Simulated antenna pattern/rotation compared with measured emissions .............55
Figure 38: Bandwidth of simulated signal using signal generator ..........................................55
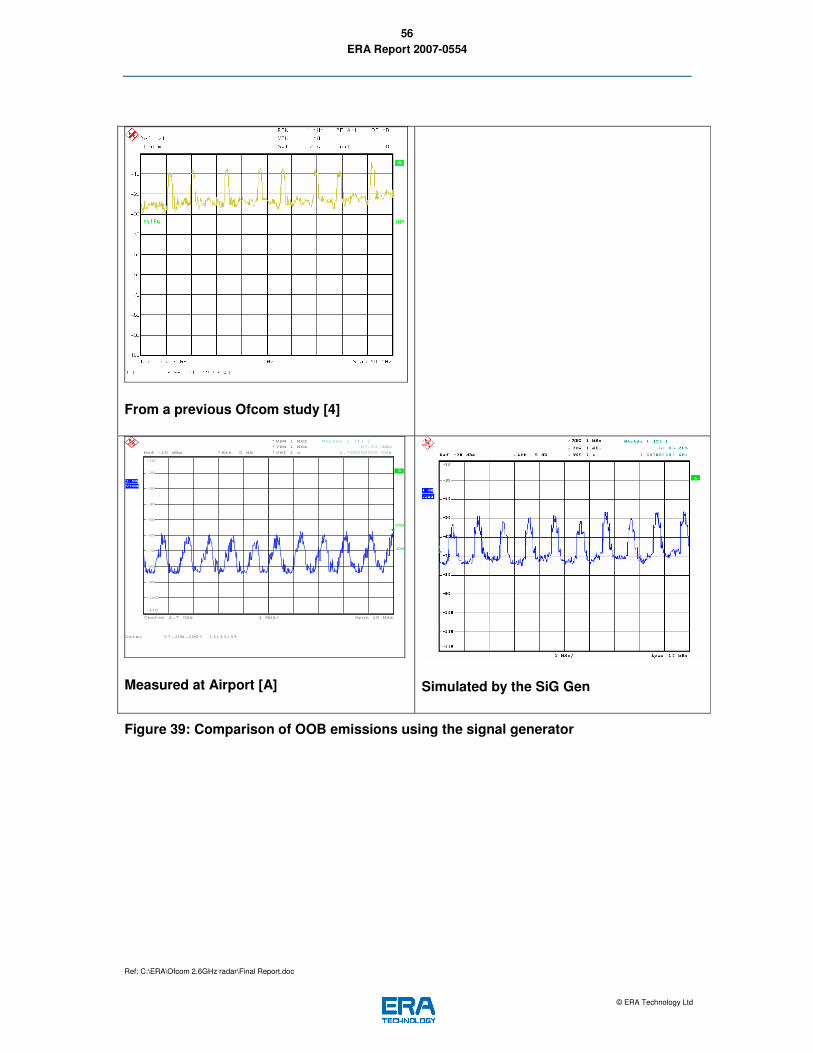
Figure 39: Comparison of OOB emissions using the signal generator ..................................56
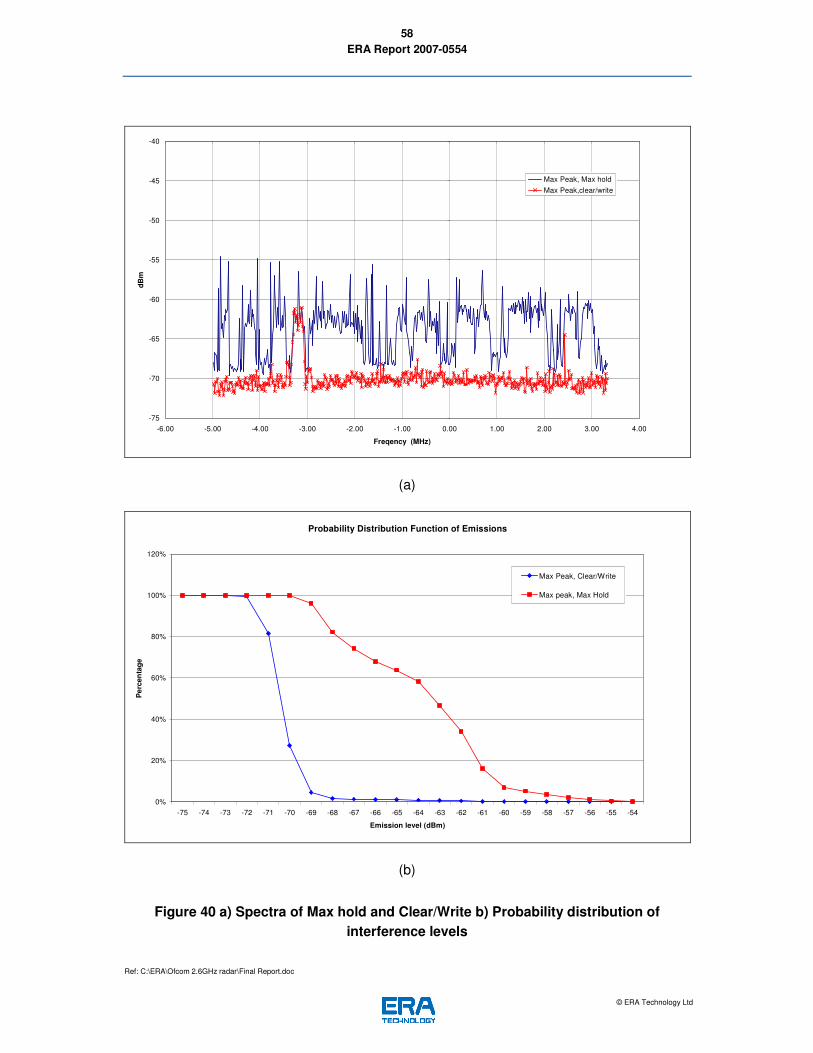
Figure 40 a) Spectra of Max hold and Clear/Write b) Probability distribution of interference
levels.................................................................................................................................58
Page 11
ERA Report 2007-0554
Ref: C:\ERA\Ofcom 2.6GHz radar\Final Report.doc
© ERA Technology Ltd
11
Abbreviations List
ACI
Adjacent Channel Interference
ATPC
Automatic Transmit Power Control
ATC
Air Traffic Control
AWGN
Additive White Gaussian Noise
BER
Bit Error Ratio
CAA
Civil Aviation Authority
CDMA
Code Division Multiple Access
DFS
Dynamic Frequency Selection
DL
Downlink
DPCH
Dedicated Physical Channel
DPCCH
Dedicated Physical Control Channel
DPDCH
Dedicated Physical Data Channel
DTCH
Dedicated Traffic Channel
DTX
Discontinuous Transmission
FASS
Frequency Agile Signal Simulator
FDD
Frequency Division Duplex
FEC
Forward Error Correction
IF
Intermediate Frequency
LNA
Low Noise Amplifier
MoD
Ministry of Defence
Page 12
ERA Report 2007-0554
Ref: C:\ERA\Ofcom 2.6GHz radar\Final Report.doc
© ERA Technology Ltd
12
MCA
Maritime & Coastguard Agency
OOB
Out of band
PER
Packet Error Ratio
PHY
Physical Layer
QAM
Quadrature Amplitude Modulation
RF
Radio Frequency
RLC
Radio Link Control
RMC
Reference Measurement Channel
RSA
Recognised Spectrum Access
SDU
Service Data Unit
SE
Spurious Emissions
SS
Solid State
SUR
Spectrum User Rights
TDD
Time Division Duplex
TFCI
Transport Format Combination Indicator
TM
Telecomm Management
TWT
Travelling Wave Tube
UE
User Equipment
UL
Uplink
UMTS
Universal Mobile Telecommunications System
Page 13
ERA Report 2007-0554
Ref: C:\ERA\Ofcom 2.6GHz radar\Final Report.doc
© ERA Technology Ltd
13
This page left intentionally blank
Page 14
ERA Report 2007-0554
Ref: C:\ERA\Ofcom 2.6GHz radar\Final Report.doc
© ERA Technology Ltd
14
1 Introduction
Ofcom has recently commissioned a series of technical studies in support of the award of
spectrum in the band 2500 to 2690 MHz [1], [2] which could possibly be occupied in the
future by systems such as UMTS or WiMAX. This band is very near to the band 2700 to
3100 MHz used by aeronautical and military radars and there is the potential for adjacent
channel interference due to the nature of radar out-of-band (OOB) and spurious emissions.
Ofcom commissioned ERA Technology Ltd to undertake a measurement programme to
identify the potential for interference to UMTS and WiMAX systems operating in adjacent
bands to aeronautical and military radars. This report details the measurements that were
undertaken and the conclusion drawn by ERA on the findings.
Measurements have been performed using real radar emissions around four airports A, B,
C, D along with conducted laboratory measurements. The laboratory measurements have
been performed using simulated radar signals generated by a Frequency Agile Signal
Simulator (FASS) and a signal generator (using pulse building software). The conducted
laboratory based measurements have been used to gain a deeper understanding of the
interference mechanism from radar emissions into UMTS and WiMAX systems.
Spectrum quality is an increasingly important issue for Ofcom, particularly with the recent
developments in technology neutrality and spectrum liberalisation, spectrum user rights
(SUR), recognised spectrum access (RSA), spectrum pricing and Cave-related band sharing
with radar.
Radar emissions may produce significant out-of-band emissions, particularly older
magnetron radars. In recent times, there has been considerable effort in terms of the design
of radar pulse generation and filtering to reduce the bandwidth occupied by radar signals
and the amount of out-of-band emissions that are generated. However, the ITU
recommendations allow a significant percentage of radar output power to spill over into
adjacent bands.
The figure below shows the ITU mask for radar spurious emissions (SE) and out-of-band
(OOB) emissions [3] and how they can fall into the 2500 to 2690 MHz band.
Page 15
ERA Report 2007-0554
Ref: C:\ERA\Ofcom 2.6GHz radar\Final Report.doc
© ERA Technology Ltd
15
Figure 1: Example of radar emission mask and out-of-band and spurious emissions
falling into potentially new UMTS/WiMAX bands
The main interference mechanism is from a number of harmonics which only appear each
time the radar rotates to face the victim receiver, and whose levels vary on each sweep. This
would have a very different effect on a voice-based application compared to a data-based
application such as broadband wireless for example.
2 Objectives
The objectives of the work were as follows:
• To determine the effect that adjacent channel interference from radar systems
operating in the 2700 – 3100 MHz band has on a range of possible mobile systems
operating in the band 2500 – 2690 MHz.
• To simulate different types of radar pulses, taking into account the result of the radar
antenna radiation pattern (e.g., through differences in main-beam and side-lobe
gains) and antenna rotation. The time-domain and emissions spectra of the radar
pulses are to be representative of the different types of radar systems deployed in
the band for air traffic control.
• To set up an end-to-end UMTS and WiMAX communications test bed of: “transmitter
-> unfaded propagation channel -> receiver” chain and then introduce known radar
interference impairments within the mobile radio channel arising from adjacent
channel radar usage.
Page 16
ERA Report 2007-0554
Ref: C:\ERA\Ofcom 2.6GHz radar\Final Report.doc
© ERA Technology Ltd
16
• To quantify the effect that different levels of radar interference has on the mobile
system receiver performance in terms of the degradation in the data throughput and
packet error rate.
• Mobile standards to be considered are WCDMA/UMTS, OFDM/WiMAX – 802.16-
2004 (representative of fixed WiMAX systems) and, if available, OFDMA/WiMAX –
802.16e (representative of mobile WiMAX systems).
• The test equipment should be able to simulate the full FEC coding of the mobile
standard under investigation, to enable packet error ratio and throughput
measurements to be made.
• The interference mechanisms to be assessed will be out-of-band and spurious
emissions from the radar based on the proposed adjacent award bands for UMTS
and WiMAX as shown in the figure below.
2690
MoD and civil radars
2500 MHz
Radio Astronomy, Earth Exploration Satellite (Passive) and Space Research (Passive) Award spectrum - Channels 1 to 38
31002700
C3
8
C3
7
C3
6
C1
C2
RA
DA
R
Figure 2: 2.6 GHz award band adjacencies
3 Test Methodology
3.1 Introduction
Conducted measurements were initially undertaken in a laboratory environment to quantify
the interference effects from radars into adjacent band UMTS and WiMAX systems.
The radar signals were simulated using a Frequency Agile Signal Simulator (FASS) and also
with a complex signal generator running pulse building studio software. The WiMAX system
under test was representative of a 2-way fixed 802.16-2004 WiMAX system. It was not
possible to obtain any mobile 802.16e WiMAX equipment in the short timeframe of the
project. The UMTS User Equipment (UE) under test was a standard 3G handset from an
established manufacturer.
Page 17
ERA Report 2007-0554
Ref: C:\ERA\Ofcom 2.6GHz radar\Final Report.doc
© ERA Technology Ltd
17
The laboratory measurements were then compared with results obtained from operational
radars at four airport sites referred to as A, B, C and D in this report.
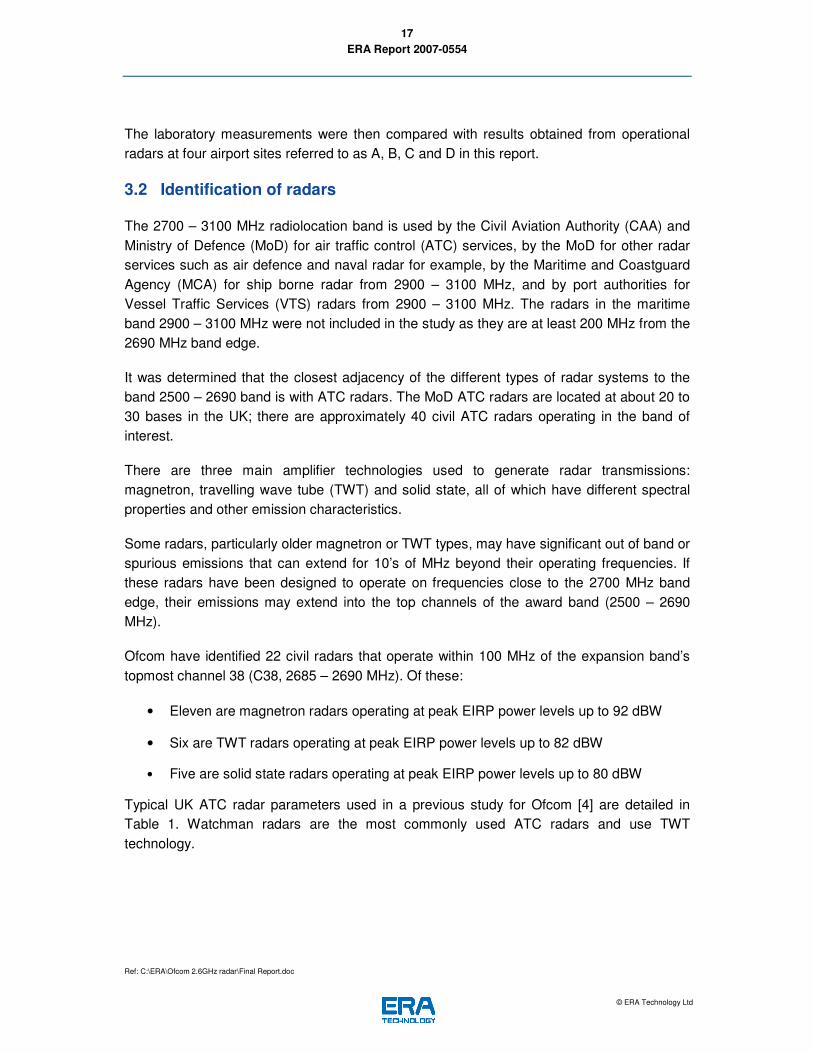
3.2 Identification of radars
The 2700 – 3100 MHz radiolocation band is used by the Civil Aviation Authority (CAA) and
Ministry of Defence (MoD) for air traffic control (ATC) services, by the MoD for other radar
services such as air defence and naval radar for example, by the Maritime and Coastguard
Agency (MCA) for ship borne radar from 2900 – 3100 MHz, and by port authorities for
Vessel Traffic Services (VTS) radars from 2900 – 3100 MHz. The radars in the maritime
band 2900 – 3100 MHz were not included in the study as they are at least 200 MHz from the
2690 MHz band edge.
It was determined that the closest adjacency of the different types of radar systems to the
band 2500 – 2690 band is with ATC radars. The MoD ATC radars are located at about 20 to
30 bases in the UK; there are approximately 40 civil ATC radars operating in the band of
interest.
There are three main amplifier technologies used to generate radar transmissions:
magnetron, travelling wave tube (TWT) and solid state, all of which have different spectral
properties and other emission characteristics.
Some radars, particularly older magnetron or TWT types, may have significant out of band or
spurious emissions that can extend for 10’s of MHz beyond their operating frequencies. If
these radars have been designed to operate on frequencies close to the 2700 MHz band
edge, their emissions may extend into the top channels of the award band (2500 – 2690
MHz).
Ofcom have identified 22 civil radars that operate within 100 MHz of the expansion band’s
topmost channel 38 (C38, 2685 – 2690 MHz). Of these:
• Eleven are magnetron radars operating at peak EIRP power levels up to 92 dBW
• Six are TWT radars operating at peak EIRP power levels up to 82 dBW
• Five are solid state radars operating at peak EIRP power levels up to 80 dBW
Typical UK ATC radar parameters used in a previous study for Ofcom [4] are detailed in
Table 1. Watchman radars are the most commonly used ATC radars and use TWT
technology.
Page 18
ERA Report 2007-0554
Ref: C:\ERA\Ofcom 2.6GHz radar\Final Report.doc
© ERA Technology Ltd
18
Table 1: Typical ATC radar parameters
These parameters were used to programme the FASS/SigGen, giving the required OOB
emissions. An example of the OOB emissions measured from a magnetron ATC radar in the
previous Ofcom study [4] is shown below. This shows a 10 MHz span around 2.5 GHz,
indicating the number of harmonics that appear in a typical receiver bandwidth.
Figure 3: Example of measured harmonics from a magnetron radar
An important consideration in the study was the effect of radar rotation and the antenna
characteristics. These were programmed into the FASS and observed on a spectrum
analyser using a zero-span at the radar centre frequency and a CW signal source. An
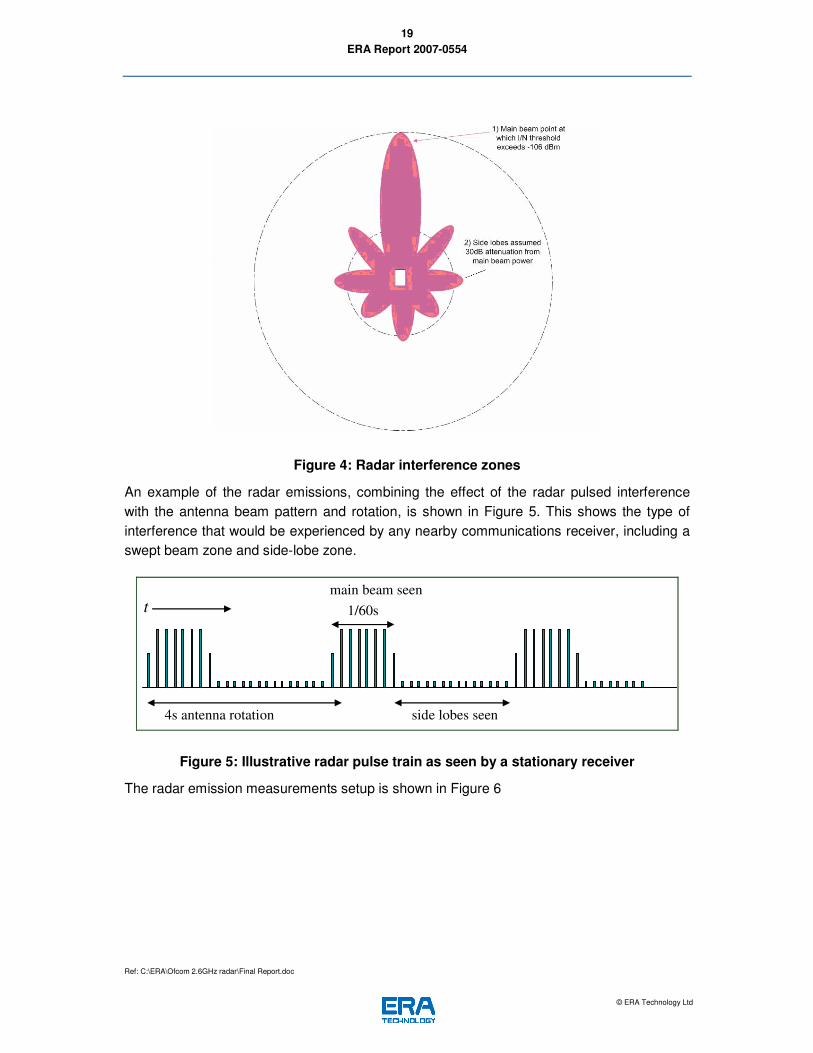
example antenna horizontal beam pattern is shown in Figure 4, and it can be seen that the
antenna typically has a narrow main beam and side lobes which are typically about 30dB
below the main beam gain. The FASS/SigGen was programmed with various beam widths
representing the different antenna patterns used by different radars.
Page 19
ERA Report 2007-0554
Ref: C:\ERA\Ofcom 2.6GHz radar\Final Report.doc
© ERA Technology Ltd
19
Figure 4: Radar interference zones
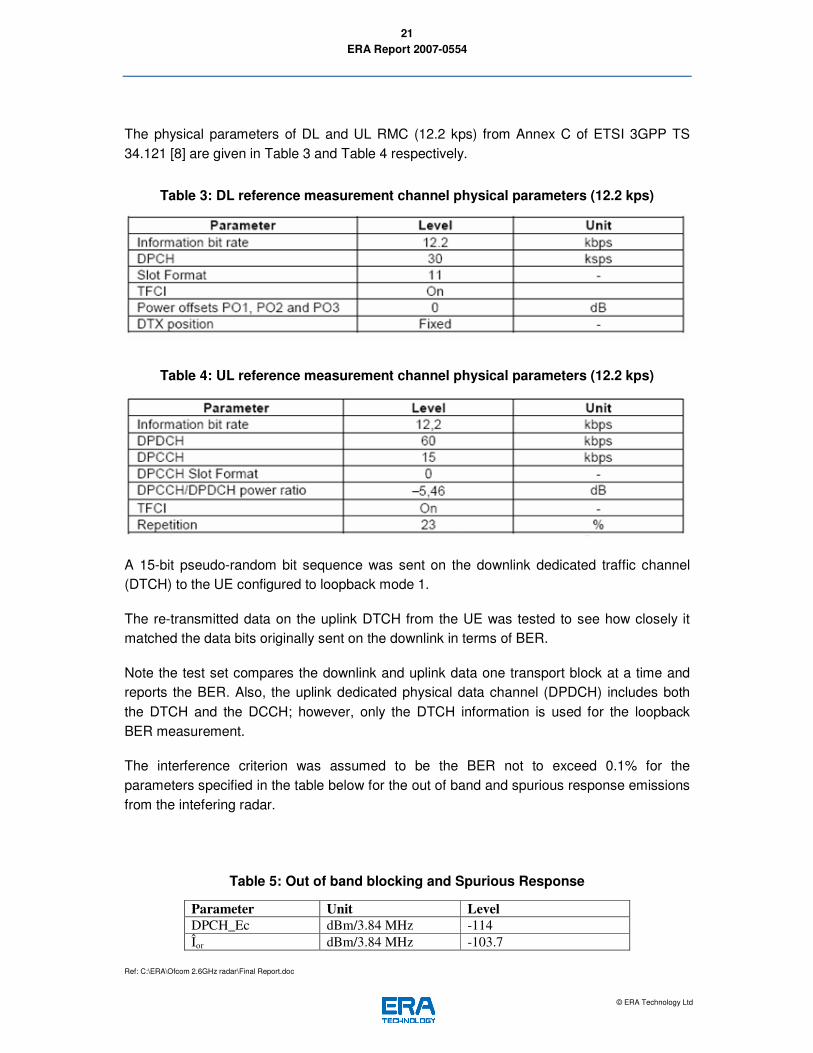
An example of the radar emissions, combining the effect of the radar pulsed interference
with the antenna beam pattern and rotation, is shown in Figure 5. This shows the type of
interference that would be experienced by any nearby communications receiver, including a
swept beam zone and side-lobe zone.
4s antenna rotation
1/60s
main beam seen t
side lobes seen
Figure 5: Illustrative radar pulse train as seen by a stationary receiver
The radar emission measurements setup is shown in Figure 6
Page 20
ERA Report 2007-0554
Ref: C:\ERA\Ofcom 2.6GHz radar\Final Report.doc
© ERA Technology Ltd
20
Figure 6 Radar emission measurement setup
3.3 Radar interference into UMTS
For measurements of radar interference into UMTS UE, the received UMTS downlink signal
parameters shown in Table 2 were used.
Table 2: UMTS downlink signal parameters
3GPP downlink Value
Multiple access method CDMA
Channel modulation QPSK
Number of carriers 1
Chip rate 3.84 Mcps
Modulation filter A=0.22
Channel raster 5 MHz
Loopback Bit Error Ratio (BER) measurements were performed on a standard reference
measurement channel (RMC) with a data rate of 12.2 kbps as defined in ETSI 3GPP TS
25.101 [7].
When measuring the BER using frequency division duplex (FDD), the DL and UL reference
measurement channel operating at 12.2 kbps should be configured to:
• DL and UL transport block = 244 bits (RLC, TM).
• UE test loop mode 1 parameter UL RLC SDU size = 244 bits.
Attenuator Spectrum Analyser
Antenna
Mast
ATC
radar
Page 21
ERA Report 2007-0554
Ref: C:\ERA\Ofcom 2.6GHz radar\Final Report.doc
© ERA Technology Ltd
21
The physical parameters of DL and UL RMC (12.2 kps) from Annex C of ETSI 3GPP TS
34.121 [8] are given in Table 3 and Table 4 respectively.
Table 3: DL reference measurement channel physical parameters (12.2 kps)
Table 4: UL reference measurement channel physical parameters (12.2 kps)
A 15-bit pseudo-random bit sequence was sent on the downlink dedicated traffic channel
(DTCH) to the UE configured to loopback mode 1.
The re-transmitted data on the uplink DTCH from the UE was tested to see how closely it
matched the data bits originally sent on the downlink in terms of BER.
Note the test set compares the downlink and uplink data one transport block at a time and
reports the BER. Also, the uplink dedicated physical data channel (DPDCH) includes both
the DTCH and the DCCH; however, only the DTCH information is used for the loopback
BER measurement.
The interference criterion was assumed to be the BER not to exceed 0.1% for the
parameters specified in the table below for the out of band and spurious response emissions
from the intefering radar.
Table 5: Out of band blocking and Spurious Response
Parameter Unit Level
DPCH_Ec dBm/3.84 MHz -114 Îor dBm/3.84 MHz -103.7
Page 22
ERA Report 2007-0554
Ref: C:\ERA\Ofcom 2.6GHz radar\Final Report.doc
© ERA Technology Ltd
22
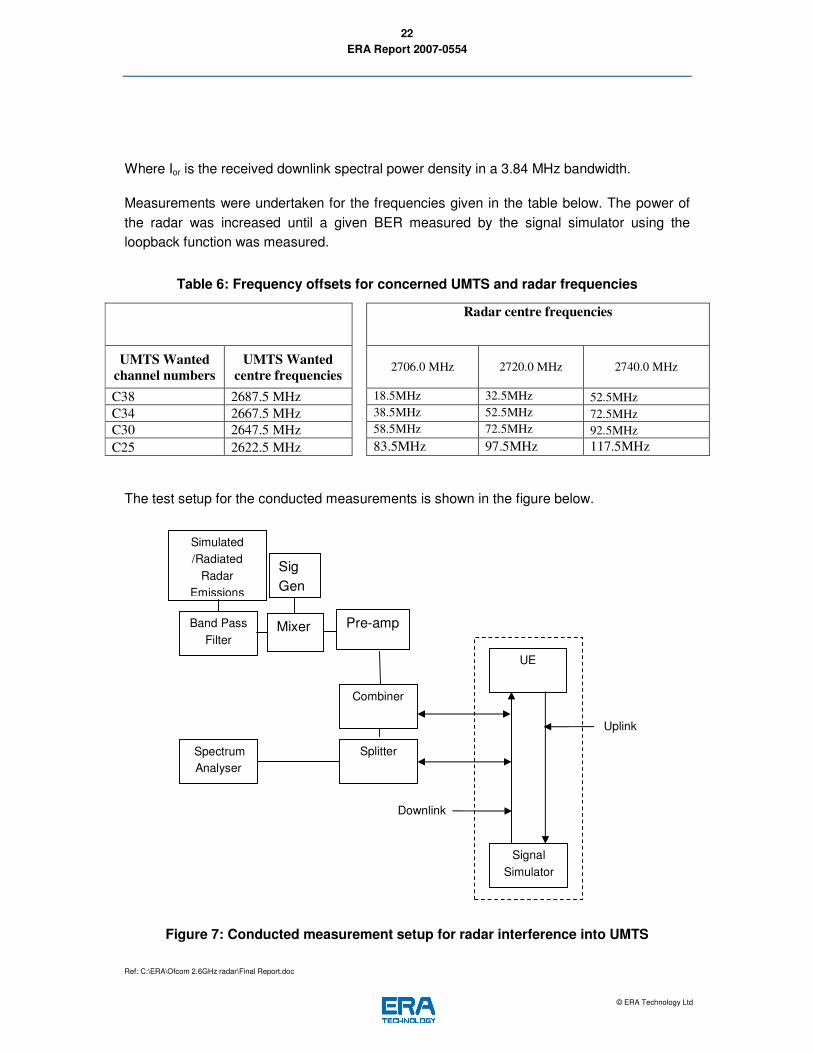
Where Ior is the received downlink spectral power density in a 3.84 MHz bandwidth.
Measurements were undertaken for the frequencies given in the table below. The power of
the radar was increased until a given BER measured by the signal simulator using the
loopback function was measured.
Table 6: Frequency offsets for concerned UMTS and radar frequencies
Radar centre frequencies
UMTS Wanted
channel numbers
UMTS Wanted
centre frequencies 2706.0 MHz 2720.0 MHz 2740.0 MHz
C38 2687.5 MHz 18.5MHz 32.5MHz 52.5MHz C34 2667.5 MHz 38.5MHz 52.5MHz 72.5MHz C30 2647.5 MHz 58.5MHz 72.5MHz 92.5MHz
C25 2622.5 MHz 83.5MHz 97.5MHz 117.5MHz
The test setup for the conducted measurements is shown in the figure below.
Figure 7: Conducted measurement setup for radar interference into UMTS
Simulated
/Radiated
Radar
Emissions
Signal
Simulator
UE
Downlink
Combiner
Splitter Spectrum
Analyser
Band Pass
Filter
Uplink
Pre-amp Mixer
Sig
Gen
Page 23
ERA Report 2007-0554
Ref: C:\ERA\Ofcom 2.6GHz radar\Final Report.doc
© ERA Technology Ltd
23
3.4 Radar interference into WIMAX
ERA has two fully operational WiMAX 802.16-2004 systems. The first system comprises a
base station and subscriber station designed to meet the IEEE 802.16-2004 [9] MAC and
physical layer (PHY) specifications. However, this system has a fixed bandwidth of 3.5 MHz
and so was not considered representative of WiMAX equipment required for this project.
The second system is designed to provide broadband wireless infrastructure and can be
deployed for fixed and mobile wireless access and backhaul applications. It provides the
following features: Up to 72 Mbps raw and 49 Mbps data throughput; dynamic time division
duplex transmission; bi-directional dynamic adaptive modulation; point-to-point and point-to-
multipoint; dynamic frequency selection (DFS) and automatic transmit power control (ATPC)
options. The system has a fixed bandwidth of 20 MHz, which was considered more
representative of a wide-band system required for the project.
It should be noted that the available WiMAX system was designed to operate at 5.5 GHz.
Therefore, the WiMAX signals were down converted to the 2.5 – 2.69 GHz band for use in
this study.
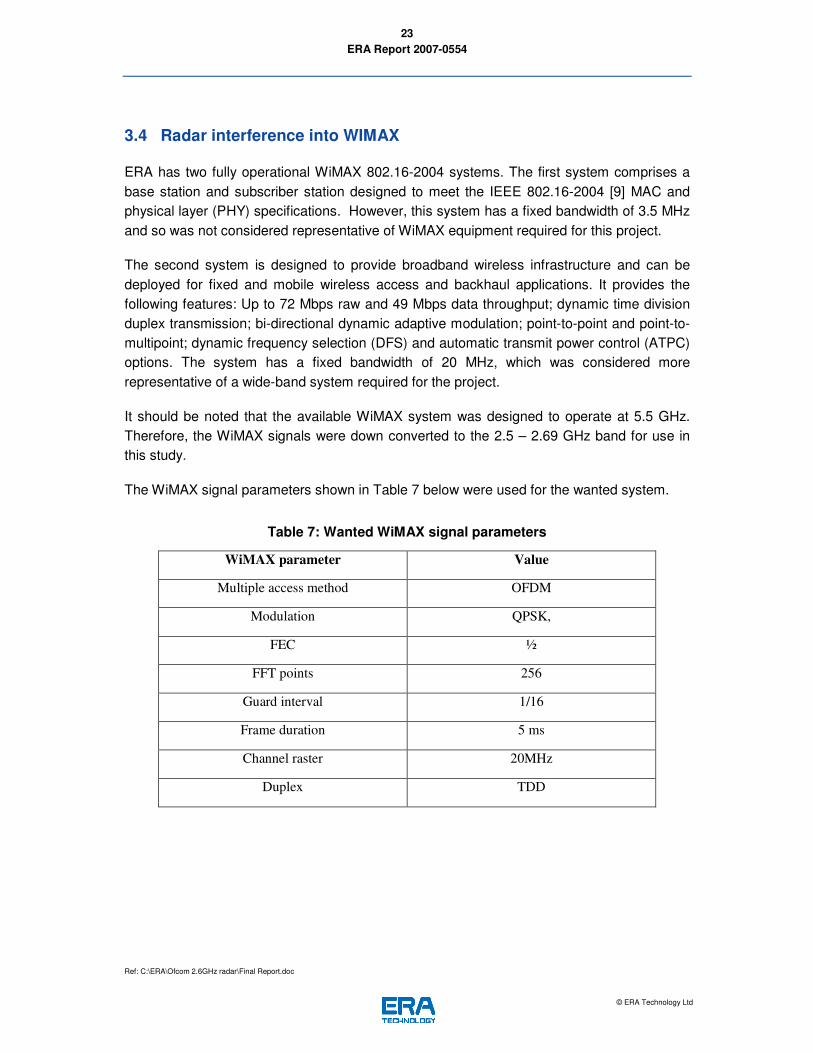
The WiMAX signal parameters shown in Table 7 below were used for the wanted system.
Table 7: Wanted WiMAX signal parameters
WiMAX parameter Value
Multiple access method OFDM
Modulation QPSK,
FEC ½
FFT points 256
Guard interval 1/16
Frame duration 5 ms
Channel raster 20MHz
Duplex TDD
Page 24
ERA Report 2007-0554
Ref: C:\ERA\Ofcom 2.6GHz radar\Final Report.doc
© ERA Technology Ltd
24
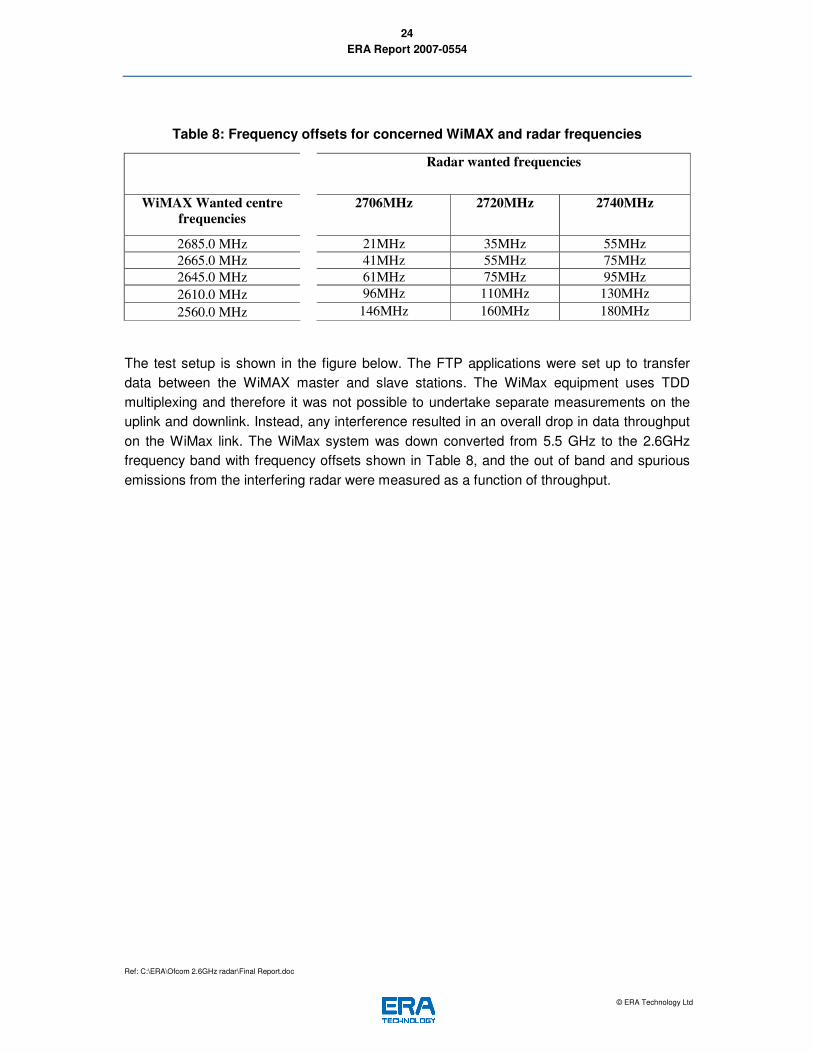
Table 8: Frequency offsets for concerned WiMAX and radar frequencies
Radar wanted frequencies
WiMAX Wanted centre
frequencies
2706MHz 2720MHz 2740MHz
2685.0 MHz 21MHz 35MHz 55MHz 2665.0 MHz 41MHz 55MHz 75MHz 2645.0 MHz 61MHz 75MHz 95MHz 2610.0 MHz 96MHz 110MHz 130MHz 2560.0 MHz 146MHz 160MHz 180MHz
The test setup is shown in the figure below. The FTP applications were set up to transfer
data between the WiMAX master and slave stations. The WiMax equipment uses TDD
multiplexing and therefore it was not possible to undertake separate measurements on the
uplink and downlink. Instead, any interference resulted in an overall drop in data throughput
on the WiMax link. The WiMax system was down converted from 5.5 GHz to the 2.6GHz
frequency band with frequency offsets shown in Table 8, and the out of band and spurious
emissions from the interfering radar were measured as a function of throughput.
Page 25
ERA Report 2007-0554
Ref: C:\ERA\Ofcom 2.6GHz radar\Final Report.doc
© ERA Technology Ltd
25
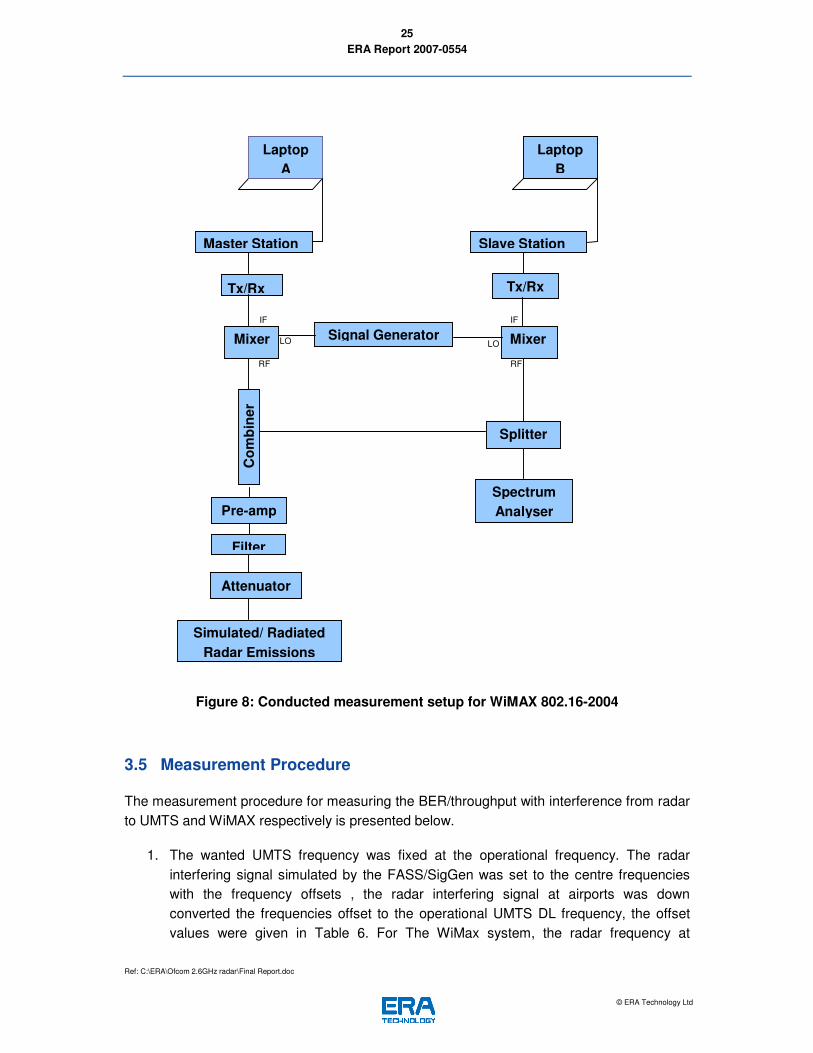
Figure 8: Conducted measurement setup for WiMAX 802.16-2004
3.5 Measurement Procedure
The measurement procedure for measuring the BER/throughput with interference from radar
to UMTS and WiMAX respectively is presented below.
1. The wanted UMTS frequency was fixed at the operational frequency. The radar
interfering signal simulated by the FASS/SigGen was set to the centre frequencies
with the frequency offsets , the radar interfering signal at airports was down
converted the frequencies offset to the operational UMTS DL frequency, the offset
values were given in Table 6. For The WiMax system, the radar frequency at
Master Station Slave Station
Tx/Rx
Mixer
Filter
Simulated/ Radiated
Radar Emissions
Tx/Rx
Mixer
IF IF
LO
RF
Signal Generator
Splitter
RF
LO
Spectrum
Analyser
Laptop
A
Laptop
B
Co
mb
iner
Pre-amp
Attenuator
Page 26
ERA Report 2007-0554
Ref: C:\ERA\Ofcom 2.6GHz radar\Final Report.doc
© ERA Technology Ltd
26
airport/FASS/SigGen was the operational frequencies observed at airports, the
wanted WiMax centre frequency was down converted to the concerned frequency
with frequency offsets given in Table 8.
2. The wanted signal for either the UMTS or WiMAX system was configured according
to the parameters shown in Table 2 or Table 7.
3. The interfering radar signal level was increased until the desired BER for UMTS UE
or the degradation of throughput for the WiMAX slave was attained.
4. The level of interference was recorded in a 1 MHz resolution bandwidth using peak
detection. The sweep time of spectrum analyser was 1 second.
5. The above steps were then repeated for the various wanted and unwanted centre
frequency combinations.
4 Results
4.1 Measured Radar Emissions
ERA undertook a measurement campaign at 4 airports (A, B, C and D) to measure the radar
emissions from operational TWT, solid-state, and magnetron radars. All of the
measurements presented in the following sections have the relevant correction factors
applied (for antenna gain, cable losses etc) so that they specify the power that would be
received at the base of a 0dBi antenna, and therefore what would be incident at the port of a
typical communications receiver. For all the emission measurements, the setting of
Spectrum analyser was resolution bandwidth of 1MHz, sweep time of 1 second.
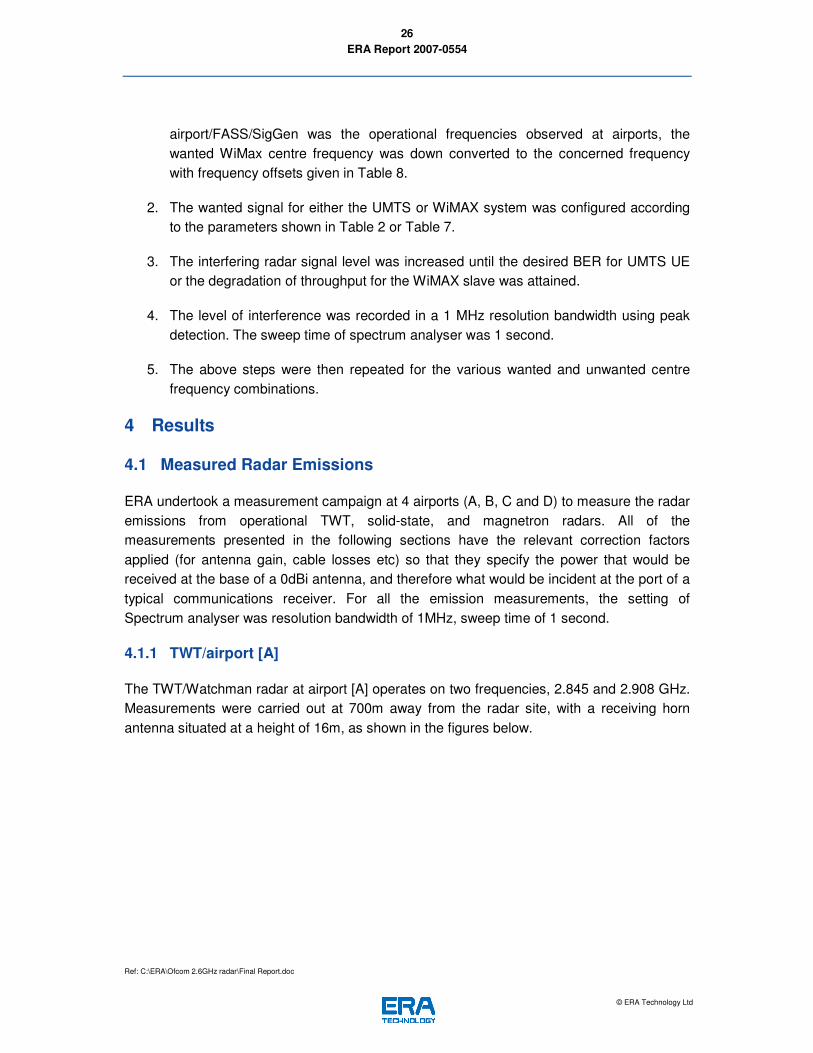
4.1.1 TWT/airport [A]
The TWT/Watchman radar at airport [A] operates on two frequencies, 2.845 and 2.908 GHz.
Measurements were carried out at 700m away from the radar site, with a receiving horn
antenna situated at a height of 16m, as shown in the figures below.
Page 27
ERA Report 2007-0554
Ref: C:\ERA\Ofcom 2.6GHz radar\Final Report.doc
© ERA Technology Ltd
27
Figure 9: Measurement location of TWT/airport [A]
The measured emissions are shown in Figure 10 to 13, as the power that would be received
at the base of a 0dBi antenna at a height of 16m. The level experienced at ground level will
typically be some 6 to 10dB lower. Figure 10 shows individual radar sweeps captured by
setting the spectrum analyser to max hold for the duration of one radar rotation. Figure 11
shows the peak levels compared to the average levels (average of each peak
measurement).
Page 28
ERA Report 2007-0554
Ref: C:\ERA\Ofcom 2.6GHz radar\Final Report.doc
© ERA Technology Ltd
28
Figure 10: Measured emissions at TWT/airport [A] showing a large number of
consecutive radar sweeps individually, using a peak detector, and max-hold for the
length of one radar rotation.
Maximum and Average level of Emissions - TWT/Airport[A]
-100
-90
-80
-70
-60
-50
-40
-30
-20
-10
0
2640 2690 2740 2790 2840 2890 2940 2990 3040
Frequency (MHz)
dB
m/M
Hz
Max Peak, Max hold
Max Peak, Average
Figure 11: Measured emissions at TWT/airport [A] using a peak detector, and showing
the “max hold” and average result over a long time period.
Page 29
ERA Report 2007-0554
Ref: C:\ERA\Ofcom 2.6GHz radar\Final Report.doc
© ERA Technology Ltd
29
Figure 12 shows the levels experienced in the frequency band under consideration, 2.5 to
2.69 GHz
Emissions at the frequency band of 2.5-2.69GHz
-100
-90
-80
-70
-60
-50
-40
-30
-20
-10
0
2500 2520 2540 2560 2580 2600 2620 2640 2660 2680
Frequency (MHz)
dB
m/M
Hz
Figure 12: Measured emissions at TWT/airport [A] using a peak detector, and showing
the emissions in the band 2.5 to 2.69 GHz.
Figure 13 shows the probability of receiving any given emission level. The averaged results
in Figure 11 and the statistical results in Figure 13 demonstrate the combined effects of the
radar pulsing, antenna rotation and narrow beam antenna, showing that instantaneous levels
have a high probability of being considerably below the peak levels.
Page 30
ERA Report 2007-0554
Ref: C:\ERA\Ofcom 2.6GHz radar\Final Report.doc
© ERA Technology Ltd
30
Probability of the emissions at the 2.5-2.69GHz frequency band
0%
20%
40%
60%
80%
100%
120%
-96 -91 -86 -81 -76 -71 -66 -61 -56
Signal Level (dBm/MHz)
Perc
en
tag
e
Figure 13: Measured emissions at TWT/airport [A] in the frequency band 2.5 to
2.69 GHz, showing the probability of any given received power level.
The measurements show that in the frequency band 2.5 to 2.69 GHz, the recorded
maximum radar emission were -54dBm/MHz and the statistics show that the probability of
this level occurring is about 0.004% of the time. In this band, the probability of the received
level being above the noise floor of -89dBm/MHz was only about 0.98% of time.
4.1.2 TWT/airport [B]
Measurements on the TWT radar at airport [B] were carried out at 600m away from the radar
site with the receiving antenna at a height of 16m, as shown in the figure below.
Page 31
ERA Report 2007-0554
Ref: C:\ERA\Ofcom 2.6GHz radar\Final Report.doc
© ERA Technology Ltd
31
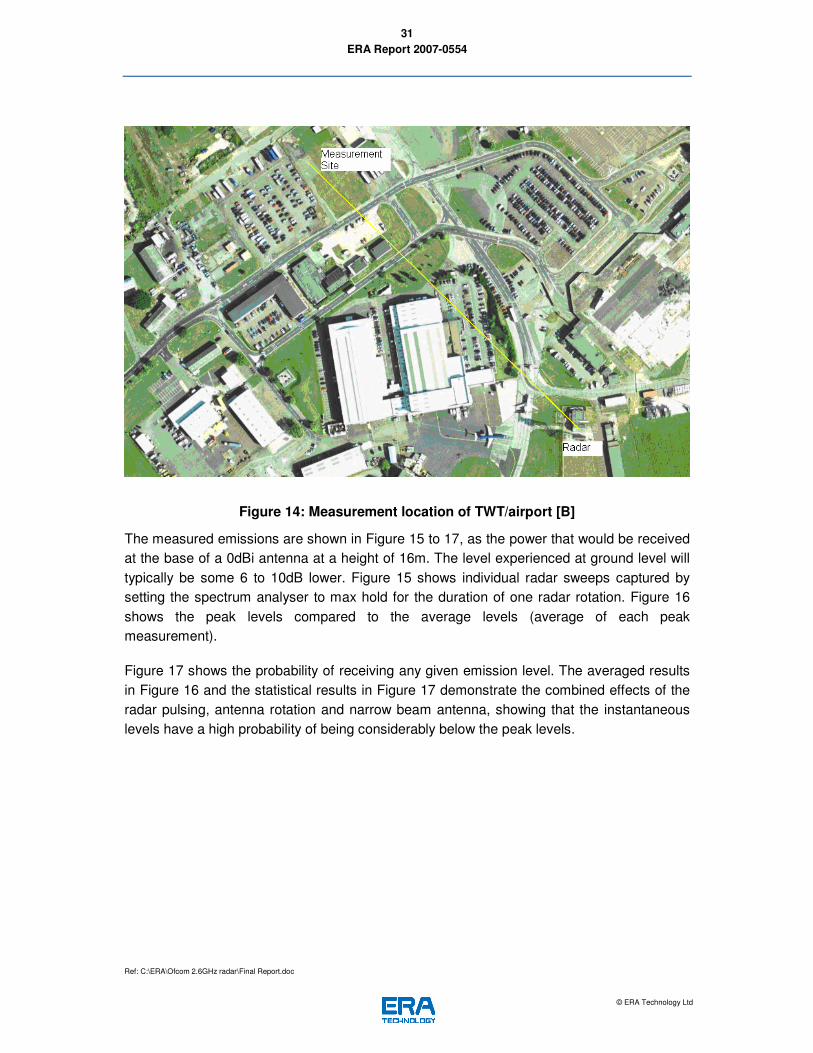
Figure 14: Measurement location of TWT/airport [B]
The measured emissions are shown in Figure 15 to 17, as the power that would be received
at the base of a 0dBi antenna at a height of 16m. The level experienced at ground level will
typically be some 6 to 10dB lower. Figure 15 shows individual radar sweeps captured by
setting the spectrum analyser to max hold for the duration of one radar rotation. Figure 16
shows the peak levels compared to the average levels (average of each peak
measurement).
Figure 17 shows the probability of receiving any given emission level. The averaged results
in Figure 16 and the statistical results in Figure 17 demonstrate the combined effects of the
radar pulsing, antenna rotation and narrow beam antenna, showing that the instantaneous
levels have a high probability of being considerably below the peak levels.
Page 32
ERA Report 2007-0554
Ref: C:\ERA\Ofcom 2.6GHz radar\Final Report.doc
© ERA Technology Ltd
32
Figure 15: Measured emissions at TWT/airport [B] showing a large number of
consecutive radar sweeps individually, using a peak detector, and max-hold for the
length of one radar rotation.
Maximum and Average level of Emissions - TWT/Airport [B]
-90
-80
-70
-60
-50
-40
-30
-20
-10
0
2665 2685 2705 2725 2745 2765 2785 2805 2825 2845 2865
Frequency (MHz)
dB
m/M
Hz
Max Peak, Max Hold
Max Peak, Average
Figure 16: Measured emissions at TWT/airport [B] using a peak detector, and showing
the “max hold” and average result over a long time period.
Page 33
ERA Report 2007-0554
Ref: C:\ERA\Ofcom 2.6GHz radar\Final Report.doc
© ERA Technology Ltd
33
Probability of the emissions at the concerned frequency band
0%
20%
40%
60%
80%
100%
120%
-83 -82 -81 -80 -79 -78 -77 -76 -75 -74 -73 -72 -71 -70 -69
Signal Level (dBm/MHz)
Pe
rce
nta
ge
Figure 17: Measured emissions at TWT/airport [B] in the frequency band 2.5 to
2.69GHz, showing the probability of any given received power level.
In the frequency band 2.5 to 2.69 GHz, the recorded maximum radar emission were -
69dBm/MHz and the statistics show that the probability of this level occurring is about 0.08%
of the time (for data between 2.665 GHz and 2.69 GHz, as no emissions above noise floor
observed between 2.5 GHz and 2.665 GHz). In this band, the probability of the received
level being above the noise floor of -79dBm/MHz was only about 0.67% of time. (The noise
floor for this measurement was above that in the other airport measurements due to the
spectrum analyser reference level setting.)
4.1.3 Solid State/Airport [C]
4.1.3.1 Radar location and emissions
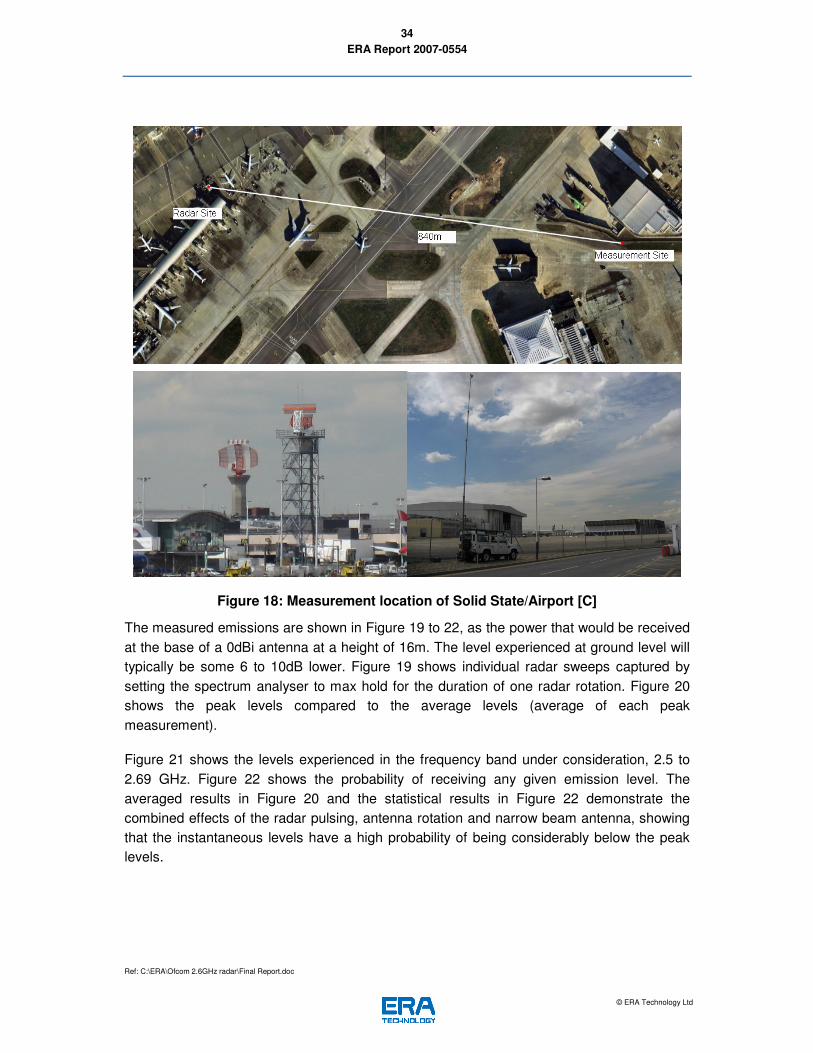
The Solid State/ASR10 radar at airport [C] operates on two frequencies, 2.785 GHz and
2.8105 GHz. Measurements were carried out at 840m away from the radar site, with a
receiving horn antenna situated at a height of 16m, as shown in Figure 18.
Page 34
ERA Report 2007-0554
Ref: C:\ERA\Ofcom 2.6GHz radar\Final Report.doc
© ERA Technology Ltd
34
Figure 18: Measurement location of Solid State/Airport [C]
The measured emissions are shown in Figure 19 to 22, as the power that would be received
at the base of a 0dBi antenna at a height of 16m. The level experienced at ground level will
typically be some 6 to 10dB lower. Figure 19 shows individual radar sweeps captured by
setting the spectrum analyser to max hold for the duration of one radar rotation. Figure 20
shows the peak levels compared to the average levels (average of each peak
measurement).
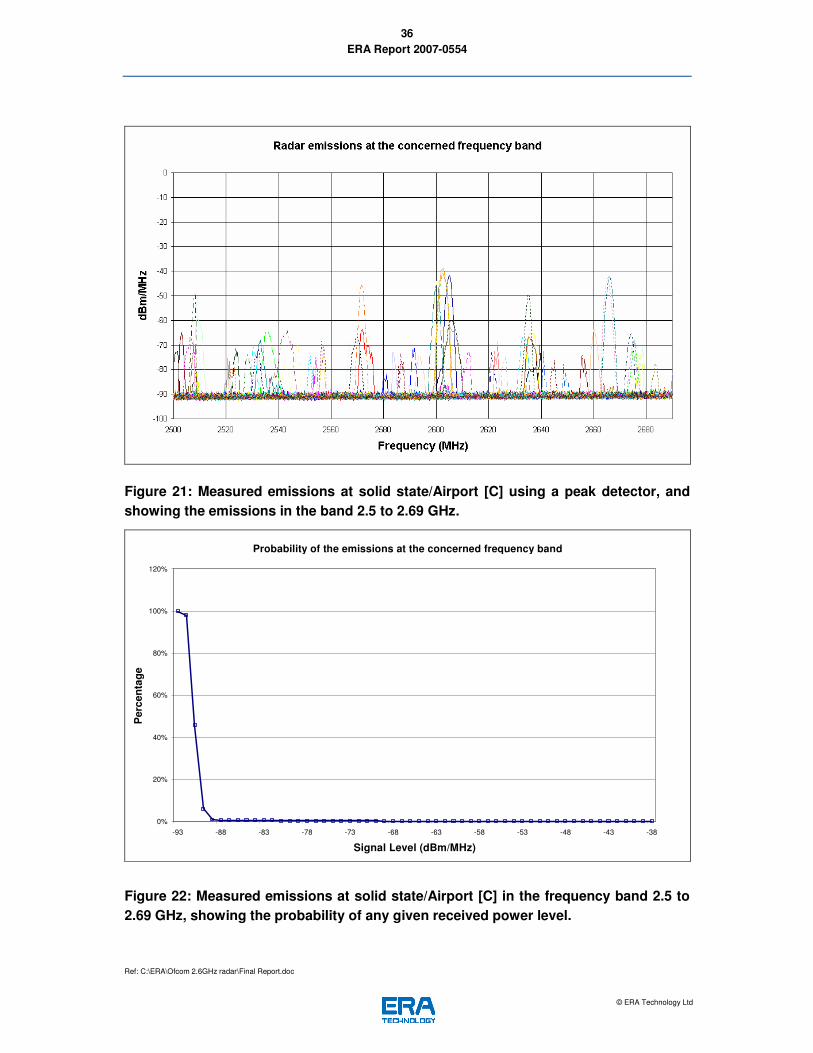
Figure 21 shows the levels experienced in the frequency band under consideration, 2.5 to
2.69 GHz. Figure 22 shows the probability of receiving any given emission level. The
averaged results in Figure 20 and the statistical results in Figure 22 demonstrate the
combined effects of the radar pulsing, antenna rotation and narrow beam antenna, showing
that the instantaneous levels have a high probability of being considerably below the peak
levels.
Page 35
ERA Report 2007-0554
Ref: C:\ERA\Ofcom 2.6GHz radar\Final Report.doc
© ERA Technology Ltd
35
Figure 19: Measured emissions at solid state/Airport [C] showing a large number of
consecutive radar sweeps individually, using a peak detector, and max-hold for the
length of one radar rotation.
Maximum and Average level of Emissions - SS/Airport [C]
-100
-90
-80
-70
-60
-50
-40
-30
-20
-10
0
2586 2636 2686 2736 2786 2836 2886 2936 2986
Frequency (MHz)
dB
m/M
Hz
Max Peak, Max Hold
Max Peak, Average
Figure 20: Measured emissions at solid state/Airport [C] using a peak detector, and
showing the “max hold” and average result over a long time period.
Page 36
ERA Report 2007-0554
Ref: C:\ERA\Ofcom 2.6GHz radar\Final Report.doc
© ERA Technology Ltd
36
Figure 21: Measured emissions at solid state/Airport [C] using a peak detector, and
showing the emissions in the band 2.5 to 2.69 GHz.
Probability of the emissions at the concerned frequency band
0%
20%
40%
60%
80%
100%
120%
-93 -88 -83 -78 -73 -68 -63 -58 -53 -48 -43 -38
Signal Level (dBm/MHz)
Perc
en
tag
e
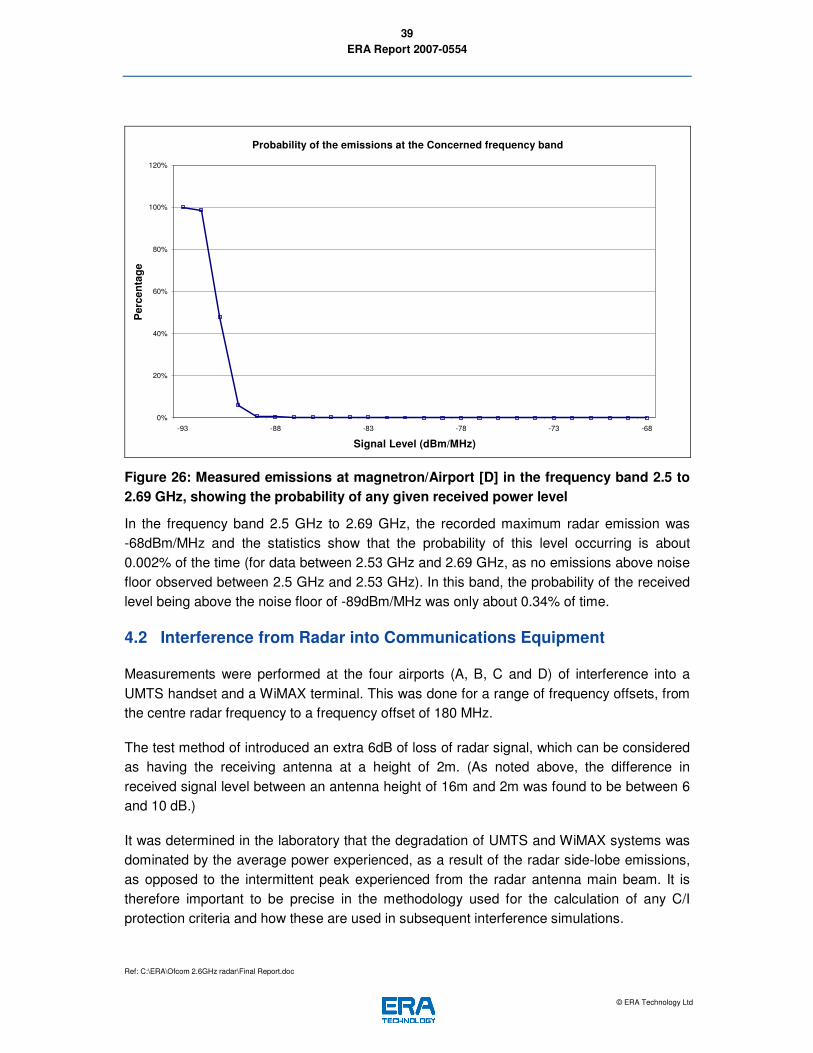
Figure 22: Measured emissions at solid state/Airport [C] in the frequency band 2.5 to
2.69 GHz, showing the probability of any given received power level.
Page 37
ERA Report 2007-0554
Ref: C:\ERA\Ofcom 2.6GHz radar\Final Report.doc
© ERA Technology Ltd
37
The measurements show that in the frequency band 2.5 GHz to 2.69 GHz, the recorded
maximum radar emission was -39dBm/MHz and the statistics show that the probability of
this level occurring is about 0.002% of the time. In this band, the probability of the received
level being above the noise floor of -89dBm/MHz was only about 0.91% of time.
4.1.4 Magnetron/Airport [D]
4.1.4.1 Radar location and emissions
Measurements on the magnetron radar at airport [D] were carried out at 650m away from the
radar site with the receiving antenna at a height of 16m, as shown in the figure below.
Figure 23: Measurement location of Magnetron/Airport [D]
The measured emissions are shown in Figure 24 to 26, as the power that would be received
at the base of a 0dBi antenna at a height of 16m. The level experienced at ground level will
typically be some 6 to 10dB lower. Figure 24 shows individual radar sweeps captured by
setting the spectrum analyser to max hold for the duration of one radar rotation. Figure 25
shows the peak levels compared to the average levels (average of each peak
measurement).
Figure 26 shows the probability of receiving any given emission level. The averaged results
in Figure 25 and the statistical results in Figure 26 demonstrate the combined effects of the
radar pulsing, antenna rotation and narrow beam antenna, showing that the instantaneous
levels have a high probability of being considerably below the peak levels.
Page 38
ERA Report 2007-0554
Ref: C:\ERA\Ofcom 2.6GHz radar\Final Report.doc
© ERA Technology Ltd
38
Figure 24: Measured emissions at magnetron/Airport [D] showing a large number of
consecutive radar sweeps individually, using a peak detector, and max-hold for the
length of one radar rotation.
Maximum and Average level of Emissions - Magnetron/Airport[D]
-100
-90
-80
-70
-60
-50
-40
-30
-20
-10
0
2530 2580 2630 2680 2730 2780 2830 2880 2930
Frequency (MHz)
dB
m/M
Hz
Max Peak, Max Hold
Max Peak, Average
Figure 25: Measured emissions at magnetron/airport [D] using a peak detector, and
showing the “max hold” and average result over a long time period.
Page 39
ERA Report 2007-0554
Ref: C:\ERA\Ofcom 2.6GHz radar\Final Report.doc
© ERA Technology Ltd
39
Probability of the emissions at the Concerned frequency band
0%
20%
40%
60%
80%
100%
120%
-93 -88 -83 -78 -73 -68
Signal Level (dBm/MHz)
Perc
en
tag
e
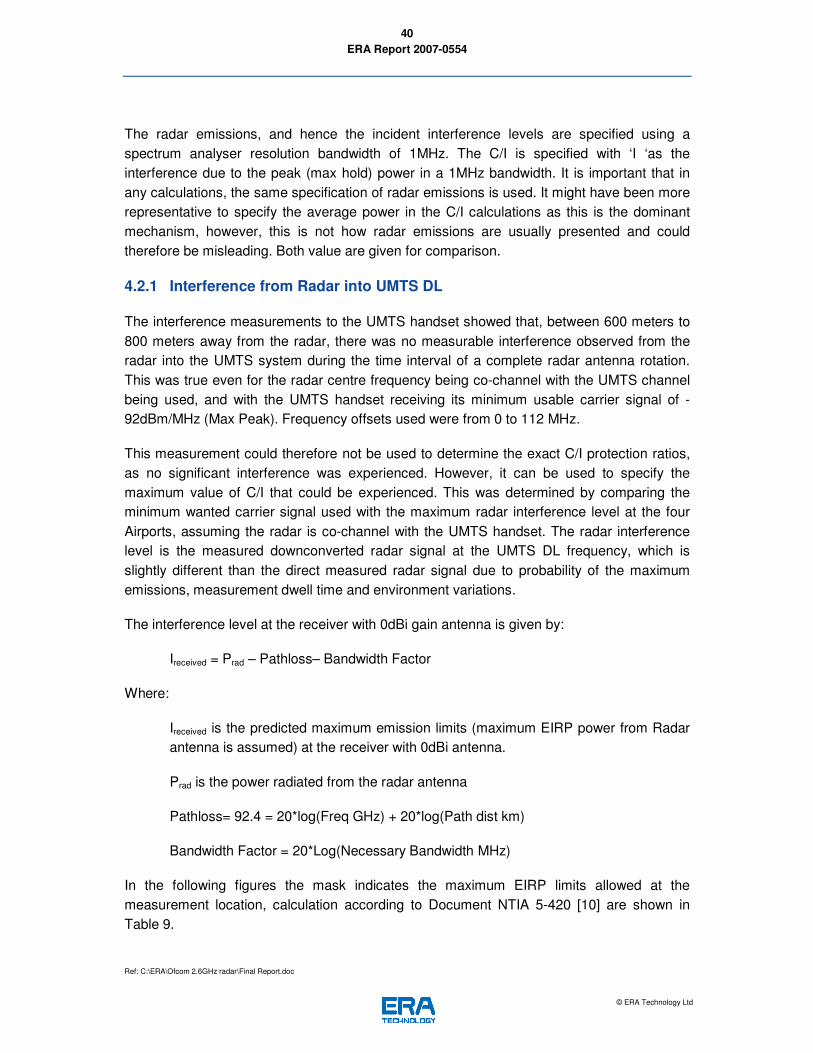
Figure 26: Measured emissions at magnetron/Airport [D] in the frequency band 2.5 to
2.69 GHz, showing the probability of any given received power level
In the frequency band 2.5 GHz to 2.69 GHz, the recorded maximum radar emission was
-68dBm/MHz and the statistics show that the probability of this level occurring is about
0.002% of the time (for data between 2.53 GHz and 2.69 GHz, as no emissions above noise
floor observed between 2.5 GHz and 2.53 GHz). In this band, the probability of the received
level being above the noise floor of -89dBm/MHz was only about 0.34% of time.
4.2 Interference from Radar into Communications Equipment
Measurements were performed at the four airports (A, B, C and D) of interference into a
UMTS handset and a WiMAX terminal. This was done for a range of frequency offsets, from
the centre radar frequency to a frequency offset of 180 MHz.
The test method of introduced an extra 6dB of loss of radar signal, which can be considered
as having the receiving antenna at a height of 2m. (As noted above, the difference in
received signal level between an antenna height of 16m and 2m was found to be between 6
and 10 dB.)
It was determined in the laboratory that the degradation of UMTS and WiMAX systems was
dominated by the average power experienced, as a result of the radar side-lobe emissions,
as opposed to the intermittent peak experienced from the radar antenna main beam. It is
therefore important to be precise in the methodology used for the calculation of any C/I
protection criteria and how these are used in subsequent interference simulations.
Page 40
ERA Report 2007-0554
Ref: C:\ERA\Ofcom 2.6GHz radar\Final Report.doc
© ERA Technology Ltd
40
The radar emissions, and hence the incident interference levels are specified using a
spectrum analyser resolution bandwidth of 1MHz. The C/I is specified with ‘I ‘as the
interference due to the peak (max hold) power in a 1MHz bandwidth. It is important that in
any calculations, the same specification of radar emissions is used. It might have been more
representative to specify the average power in the C/I calculations as this is the dominant
mechanism, however, this is not how radar emissions are usually presented and could
therefore be misleading. Both value are given for comparison.
4.2.1 Interference from Radar into UMTS DL
The interference measurements to the UMTS handset showed that, between 600 meters to
800 meters away from the radar, there was no measurable interference observed from the
radar into the UMTS system during the time interval of a complete radar antenna rotation.
This was true even for the radar centre frequency being co-channel with the UMTS channel
being used, and with the UMTS handset receiving its minimum usable carrier signal of -
92dBm/MHz (Max Peak). Frequency offsets used were from 0 to 112 MHz.
This measurement could therefore not be used to determine the exact C/I protection ratios,
as no significant interference was experienced. However, it can be used to specify the
maximum value of C/I that could be experienced. This was determined by comparing the
minimum wanted carrier signal used with the maximum radar interference level at the four
Airports, assuming the radar is co-channel with the UMTS handset. The radar interference
level is the measured downconverted radar signal at the UMTS DL frequency, which is
slightly different than the direct measured radar signal due to probability of the maximum
emissions, measurement dwell time and environment variations.
The interference level at the receiver with 0dBi gain antenna is given by:
Ireceived = Prad – Pathloss– Bandwidth Factor
Where:
Ireceived is the predicted maximum emission limits (maximum EIRP power from Radar
antenna is assumed) at the receiver with 0dBi antenna.
Prad is the power radiated from the radar antenna
Pathloss= 92.4 = 20*log(Freq GHz) + 20*log(Path dist km)
Bandwidth Factor = 20*Log(Necessary Bandwidth MHz)
In the following figures the mask indicates the maximum EIRP limits allowed at the
measurement location, calculation according to Document NTIA 5-420 [10] are shown in
Table 9.
Page 41
ERA Report 2007-0554
Ref: C:\ERA\Ofcom 2.6GHz radar\Final Report.doc
© ERA Technology Ltd
41
Table 9 Calculation of received maximum signal levels
TWT/
Airport[A]
TWT/
Airport[B]
Solid State/
Airport[C]
Magnetron/
Airport[D]
Max EIRP(dBm) 108 108 103 122
Frequency (MHz) 2840 2765 2785 2730
Necessary bandwidth
(MHz) 10 10 2.5 5.6
Bandwidth factor (dB) 20 20 8 15
Distance (km) 0.7 0.6 0.84 0.65
Path Loss (dB) 98.4 96.8 99.8 97.4
Estimated received
maximum signal
(dBm/MHz)
-10.4 -8.8 -4.8 9.6
Maximum and Average level of Emissions - TWT/Airport[A]
-100
-90
-80
-70
-60
-50
-40
-30
-20
-10
0
2640 2690 2740 2790 2840 2890 2940 2990 3040
Frequency (MHz)
dB
m/M
Hz
MASK1
Max Peak, Max hold
Max Peak, Average
Figure 27 Emission Limits at the measurement locations with maximum EIRP at
Airports A, predicted with freespace path loss
Page 42
ERA Report 2007-0554
Ref: C:\ERA\Ofcom 2.6GHz radar\Final Report.doc
© ERA Technology Ltd
42
Maximum and Average level of Emissions - TWT/Airport [B]
-90
-80
-70
-60
-50
-40
-30
-20
-10
0
2665 2685 2705 2725 2745 2765 2785 2805 2825 2845 2865
Frequency (MHz)
dB
m/M
Hz
Max peak, Max Hold
Max Peak, Average
MASK1
Figure 28 Emission Limits at the measurement locations with maximum EIRP at
Airports B, predicted with freespace path loss
Maximum and Average level of Emissions - SS/Airport [C]
-100
-90
-80
-70
-60
-50
-40
-30
-20
-10
0
2586 2636 2686 2736 2786 2836 2886 2936 2986
Frequency (MHz)
dB
m/M
Hz
MASK1
Max Peak, Max Hold
Max Peak, Average
Figure 29 Emission Limits at the measurement locations with maximum EIRP at
Airports C, predicted with freespace path loss
Page 43
ERA Report 2007-0554
Ref: C:\ERA\Ofcom 2.6GHz radar\Final Report.doc
© ERA Technology Ltd
43
Maximum and Average level of Emissions - Magnetron/Airport[D]
-100
-90
-80
-70
-60
-50
-40
-30
-20
-10
0
10
2530 2580 2630 2680 2730 2780 2830 2880 2930
Frequency (MHz)
dB
m/M
Hz
MASK1
Max Peak, Max Hold
Max Peak, Average
Figure 30 Emission Limits at the measurement locations with maximum EIRP at
Airports D, predicted with freespace path loss
The resulting maximum C/I levels experienced are presented in Table 10.
Table 10: Maximum C/I values for radar to UMTS interference
UMTS TWT/Airport A TWT/Airport B SS/Airport C Magnetron/Airport D
C
(dBm/
MHz)
I
(dBm/
MHz)
C/I
(dB)
C
(dBm/
MHz)
I
(dBm/
MHz)
C/I
(dB)
C
(dBm/
MHz)
I
(dBm/
MHz)
C/I
(dB)
C
(dBm/
MHz)
I
(dBm/
MHz)
C/I
(dB)
Max peak,
Max hold
-92 -21 -71 -92 -20 -72 -92 -32 -60 -92 -22 -70
Max Peak,
Average
-92 -62 -30 -92 -44 -48 -92 -64 -28 -92 -55 -37
4.2.2 Interference from Radar into WiMAX
The interference measurements to the WiMAX subscriber unit showed that, between 600
meters to 800 meters away from the radar, there was no measurable interference observed
from the radar into the WiMAX system during the time interval of a complete radar antenna
rotation. This was true even for the radar centre frequency being co-channel with the WiMAX
Page 44
ERA Report 2007-0554
Ref: C:\ERA\Ofcom 2.6GHz radar\Final Report.doc
© ERA Technology Ltd
44
channel being used, and with the WiMAX subscriber receiving its minimum usable carrier
signal -60dBm/MHz (Max Peak). Frequency offsets used were from 0 to 180 MHz.
This measurement could therefore not be used to determine the exact C/I protection ratio
values, as no significant interference was experienced. However, it can be used to specify
the maximum value of C/I that could be experienced. As for the UMTS case, this was
determined by comparing the minimum wanted carrier signal used with the maximum radar
interference level at the four Airports, assuming the radar is co-channel with the WiMAX
system. The results are presented in Table 11.
Table 11: Maximum C/I values for radar to WiMAX interference
WiMAX TWT/Airport A TWT/Airport B SS/Airport C Magnetron/Airport D
C
(dBm/
MHz)
I
(dBm/
MHz)
C/I
(dB)
C
(dBm/
MHz)
I
(dBm/
MHz)
C/I
(dB)
C
(dBm/
MHz)
I
(dBm/
MHz)
C/I
(dB)
C
(dBm/
MHz)
I
(dBm/
MHz)
C/I
(dB)
Max peak,
Max hold
-60 -12 -48 -60 -11 -49 -60 -19 -41 -60 -13 -47
Max Peak,
Average
-60 -42 -18 -60 -35 -25 -60 -58 -2 -60 -42 -18
4.3 Conducted measurements of simulated radar emissions
Conducted measurements were made using radar simulators and a number of reference
interference sources to help determine the interference mechanisms occurring.
4.3.1 Conducted measurements of C/W and AWGN
When CW or AWGN was applied as the interference source into the UMTS or WiMAX
system, the C/I values shown in Table 12 were obtained.
Table 12: Measured C/I using AWGN and CW interference sources
AWGN C/I (dB) CW C/I (dB)
UMTS -12 -26
WiMAX -2 -16
Page 45
ERA Report 2007-0554
Ref: C:\ERA\Ofcom 2.6GHz radar\Final Report.doc
© ERA Technology Ltd
45
4.3.2 Simulated radar emissions using FASS
The FASS was used to simulate the radar interference source for laboratory conducted
interference tests. Comparing with the radar measurements at the airports, it was found that
the RF output of FASS had a fairly significant component of noise at frequency offsets
greater than around 60MHz from the radar centre frequency in addition to the radar
emissions. The measurement results are shown in the Appendix A. It can be seen that the
results are very close to those using the AWGN interferer, due to the noise-like nature. Thus,
we considered the out-of-band radar signal emissions simulated using the FASS was not
accurate enough for the purpose of this project. An improved radar simulator was used as
described in Section 4.3.3.
4.3.3 Simulated radar emissions using a Signal Generator
The interfering radar signals were replicated using a high performance Signal Generator
(Agilent 8267D-M2) and pulse building studio software. The generator is capable of
producing narrow radar pulses and has the advantage of having a wide bandwidth, as
shown in Appendix B.
The conducted measurements with the signal generator did not cause any measurable
interference to the UMTS or WiMAX receivers with the simulated TWT, solid state or
magnetron radar signals at the output levels that could be achieved. This result compared
well with the measurements at the airports and it is considered that the signal generator
gave a more accurate representation of the radar signals than the FASS.
Page 46
ERA Report 2007-0554
Ref: C:\ERA\Ofcom 2.6GHz radar\Final Report.doc
© ERA Technology Ltd
46
5 Conclusions
Measurements have been undertaken to quantify the interference effects from aeronautical
radars operating in the 2.7 – 3.1 GHz band into representative communications systems that
could be used in future in the 2.5 to 2.69 GHz band. The representative communications
systems used in this case were UMTS and WiMAX.
Measurements were undertaken at four airports, characterising the emissions arising from
solid-state, TWT and magnetron technologies. In addition, laboratory measurements have
been performed using simulated radar signals generated by a Frequency Agile Signal
Simulator and a signal generator (using complex pulse building software). The conducted
laboratory based measurements have been used to gain a deeper understanding of the
interference mechanism from radar emissions into UMTS and WiMAX systems.
It was determined in the laboratory that the degradation of the UMTS and WiMAX systems
was dominated by the average power experienced, as a result of the radar side-lobe
emissions, as opposed to the intermittent peak experienced from the radar antenna main
beam. It is therefore found to be important to be precise in the methodology used for the
calculation of any C/I protection criteria (whether peak or average interference) and how
these are used in subsequent interference simulations. Protection criteria based on both
peak and average interference levels are given within the report for comparison. Also
provided for comparison are the level of Carrier Wave and Additive White Gaussian Noise
(AWGN) emission required to cause interference to the UMTS or WiMAX system.
ERA’s analysis of the results from the airport measurements indicate that the bit error rate
(BER) in the presence of the measured radar interference was less than 10e-3 (0.1%) to
either the UMTS or WiMAX systems at a separation distance of 600m from the radar and
with a set minimum usable carrier signal for the wanted system. These results were based
on the measurement of BER within a reference UMTS channel having a user data-rate of
12.2 kbps, and into a reference WiMAX channel having a user data rate of 1.5mbps. It
should be noted the study did not consider the effect of radar interference to other system
parameters such as quality of service or the impact radar interference has on particular
types of communication applications (e.g., voice, video, and different types of data
transmissions).
The results were established on the basis of the radar interference being co-channel with the
communications receiver. In practice, the communications systems operating in the 2.6GHz
band may well be separated greater than about 18 MHz away from a radar centre frequency
and, as such, may be expected to experience radar powers at least 20 to 30dB below the
co-frequency radar power level.
Page 47
ERA Report 2007-0554
Ref: C:\ERA\Ofcom 2.6GHz radar\Final Report.doc
© ERA Technology Ltd
47
The measurements could not be used to determine the exact Carrier-to-Interference (C/I)
protection ratios, as no significant interference was experienced. However, they can be used
to specify the maximum value of C/I likely to be experienced. This was determined by
comparing the minimum carrier signals used with the maximum converted radar interference
level measured at each of the four Airports, with the radar co-channel with the
UMTS/WiMAX receiver.
The calculated maximum C/Is that could be experienced are shown in the following tables:
UMTS TWT/Airport A TWT/Airport B SS/Airport C Magnetron/Airport D
C
(dBm/
MHz)
I
(dBm/
MHz)
C/I
(dB)
C
(dBm/
MHz)
I
(dBm/
MHz)
C/I
(dB)
C
(dBm/
MHz)
I
(dBm/
MHz)
C/I
(dB)
C
(dBm/
MHz)
I
(dBm/
MHz)
C/I
(dB)
Max peak,
Max hold
-92 -21 -71 -92 -20 -72 -92 -32 -60 -92 -22 -70
Max Peak,
Average
-92 -62 -30 -92 -44 -48 -92 -64 -28 -92 -55 -37
WiMAX TWT/Airport A TWT/Airport B SS/Airport C Magnetron/Airport D
C
(dBm/
MHz)
I
(dBm/
MHz)
C/I
(dB)
C
(dBm/
MHz)
I
(dBm/
MHz)
C/I
(dB)
C
(dBm/
MHz)
I
(dBm/
MHz)
C/I
(dB)
C
(dBm/
MHz)
I
(dBm/
MHz)
C/I
(dB)
Max peak,
Max hold
-60 -12 -48 -60 -11 -49 -60 -19 -41 -60 -13 -47
Max Peak,
Average
-60 -42 -18 -60 -35 -25 -60 -58 -2 -60 -42 -18
Page 48
ERA Report 2007-0554
Ref: C:\ERA\Ofcom 2.6GHz radar\Final Report.doc
© ERA Technology Ltd
48
6 References
[1] Adjacent and In-Band Compatibility Assessment for 2500-2690MHz, Ofcom
Technical Study, 11 Dec 06
[2] 2500-2690MHz, 2010-2025MHz and 2290-2302MHz Spectrum Awards –
Engineering Study (Phase 2), Mason Communications Ltd, November 2006
[3] ITU-R Recommendation SM.1541 “Unwanted emissions in the out-of-band domain”
[4] CAA radar out of band emissions, Radio Technology & Compatibility Group, March
2001.
[5] Radar Unwanted Emissions, J Holloway, ITU WP8B Radar Seminar, Geneva,
September 2005.
[6] The report of an investigation into the characteristics, operation and protection
requirements of civil aeronautical and civil maritime radar system, Alenia Marconi Systems
Ltd, October 2002.
[7] 3GPP TS 25.101 v7.8.0, 3rd Generation Partnership Project; Technical Specification
Group Radio Access Network; UE Radio Transmission and Reception (FDD) (Release 7),
Giugno 2001.
[8] 3GPP TS 34.121 V6.0.0, 3rd Generation Partnership Project; Technical Specification
Group Terminals; Terminal conformance specification; Radio transmission and reception
(FDD) (Release 6), 2005.
[9] IEEE Standard for Local and metropolitan area networks Part 16: Air Interface for
Fixed Broadband Wireless Access Systems
[10] NTIA Document 5-420, Measurement Procedures for the Radar Spectrum
Engineering Criteria (RSEC), March 2005
Page 49
ERA Report 2007-0554
Ref: C:\ERA\Ofcom 2.6GHz radar\Final Report.doc
© ERA Technology Ltd
49
APPENDIX A
Calibration of Radar Emissions from FASS
Emission profile of TWT Radar
The unwanted emissions from the radar include both OOB and spurious emissions. OOB
emissions occur at frequencies immediately outside the necessary bandwidth resulting from
the modulation process, but excluding spurious emissions. Spurious emissions are
emissions on frequencies which are outside the necessary bandwidth and the level of which
maybe reduced without affecting the corresponding transmission of information. Spurious
emissions include harmonics emissions, ‘parasitic’ emissions, intermodulation products and
frequency conversion products, but exclude OOB emissions [5].
The output from the FASS was assessed to determine if the OOB and spurious emissions
are comparable to the emissions from real radar transmissions.
As shown in Figure 31, the emission characteristics of a TWT radar simulated by the FASS
are very similar to the spectra measured in a study by Alenia Marconi Systems Ltd (the AMS
report) [6] and radar measurements carried out by ERA at airport [A], especially for the in
band and OOB emissions.
Spectrum of FASS, Measurement at airport[A] and from AMS report
-120
-100
-80
-60
-40
-20
0
-2.5E+08 -2.0E+08 -1.5E+08 -1.0E+08 -5.0E+07 0.0E+00 5.0E+07 1.0E+08 1.5E+08 2.0E+08 2.5E+08 3.0E+08
Frequency (Hz)
dB
m/M
Hz
AMS
FASS
Airport[A]
Figure 31 Validation of Radar spectra from FASS, against measurement at Airport [A]
airport and data from AMS report [6]
Page 50
ERA Report 2007-0554
Ref: C:\ERA\Ofcom 2.6GHz radar\Final Report.doc
© ERA Technology Ltd
50
The TWT radar has two operating frequencies and two pulse widths of 0.4µs and 20 µs. At
the lower operating frequency the radar transmits 9 short pulses, followed by 9 long pulses
while at the upper operating frequency 9 long pulses are transmitted followed by 9 short
pulses. The unwanted emissions are therefore components from both short pulse and long
pulse. The spectra of short pulse, long pulse and the short+ long pulse are shown in Figure
32. It can be seen that the short pulse gives less in-band peak power but gives the worst
case of OOB/spurious emission levels, as also noted in the Ofcom consultation document.
For this study both the short and long pulse series was applied to simulate the situation
which is more close to the real radar signal.
TWT radar with different pulse width
-80
-70
-60
-50
-40
-30
-20
-10
0
1.94E+09 1.96E+09 1.98E+09 2.00E+09 2.02E+09 2.04E+09 2.06E+09
Frequency (Hz)
dB
m/M
Hz
Long pulse 20us
short pulse 0.4us
Short + Long Pulse
Figure 32: Effect of pulse width on the TWT radar signal
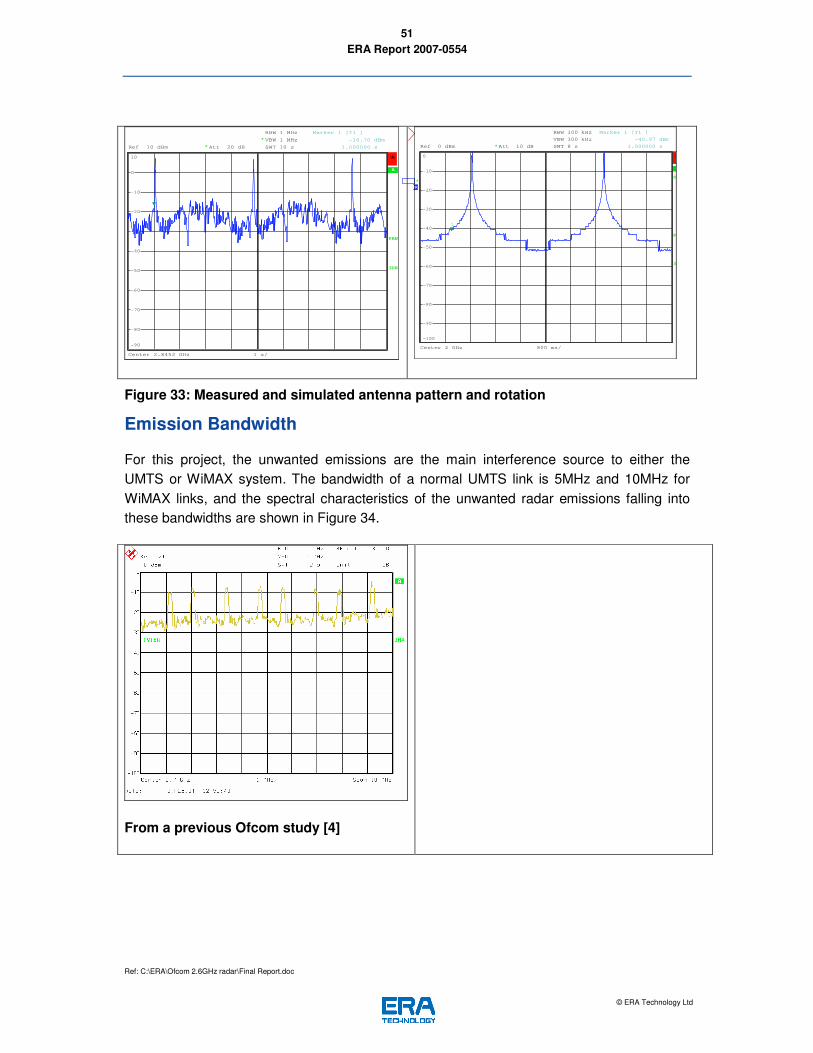
Radar antenna rotation and antenna pattern
The effect of radar antenna pattern and rotation is shown in Figure 33. The plot on the left is
measured at airport [A], and on the right is simulated by the FASS. The FASS gives the
same antenna rotation rate of 4 second per rotation and simulates the same 1.5° beamwidth
as the real radar, with a fast roll-off. The radar antenna has a -20 to -25dBc back lobe, while
the antenna pattern of FASS gives null up to -50dBc.
Page 51
ERA Report 2007-0554
Ref: C:\ERA\Ofcom 2.6GHz radar\Final Report.doc
© ERA Technology Ltd
51
Ref 10 dBm Att 20 dB*
*
A
3DB
RBW 1 MHz
VBW 1 MHz
Center 2.8452 GHz 1 s/
SWT 10 s
*
PRN
-90
-80
-70
-60
-50
-40
-30
-20
-10
0
10
1
Marker 1 [T1 ]
-16.70 dBm
1.000000 s
Ref 0 dBm Att 10 dB*
3
RBW 100 kHz
VBW 300 kHz
S
WR
*K
Center 2 GHz 800 ms/
*
SWT 8 s
P
-100
-90
-80
-70
-60
-50
-40
-30
-20
-10
0
1
Marker 1 [T1 ]
-40.97 dBm
1.000000 s
Figure 33: Measured and simulated antenna pattern and rotation
Emission Bandwidth
For this project, the unwanted emissions are the main interference source to either the
UMTS or WiMAX system. The bandwidth of a normal UMTS link is 5MHz and 10MHz for
WiMAX links, and the spectral characteristics of the unwanted radar emissions falling into
these bandwidths are shown in Figure 34.
From a previous Ofcom study [4]
Page 52
ERA Report 2007-0554
Ref: C:\ERA\Ofcom 2.6GHz radar\Final Report.doc
© ERA Technology Ltd
52
A
3DB
*
*
RBW 1 MHz
VBW 1 MHz
SWT 1 s*Ref -10 dBm Att 0 dB*
Center 2.7 GHz Span 10 MHz1 MHz/
1 PK
VIEW
PRN
-110
-100
-90
-80
-70
-60
-50
-40
-30
-20
-10
1
Marker 1 [T1 ]
-57.53 dBm
2.705000000 GHz
Date: 27.JUN.2007 13:33:39
Measured at airport [A]
Center 2.14 GHz Span 10 MHz1 MHz/
Ref -20 dBm Att 0 dB **
A
* RBW 1 MHz
VBW 3 MHz
SWT 1 s*
1 PK
VIEW
-120
-110
-100
-90
-80
-70
-60
-50
-40
-30
-20
1
Marker 1 [T1 ]
-44.01 dBm
2.144423077 GHz
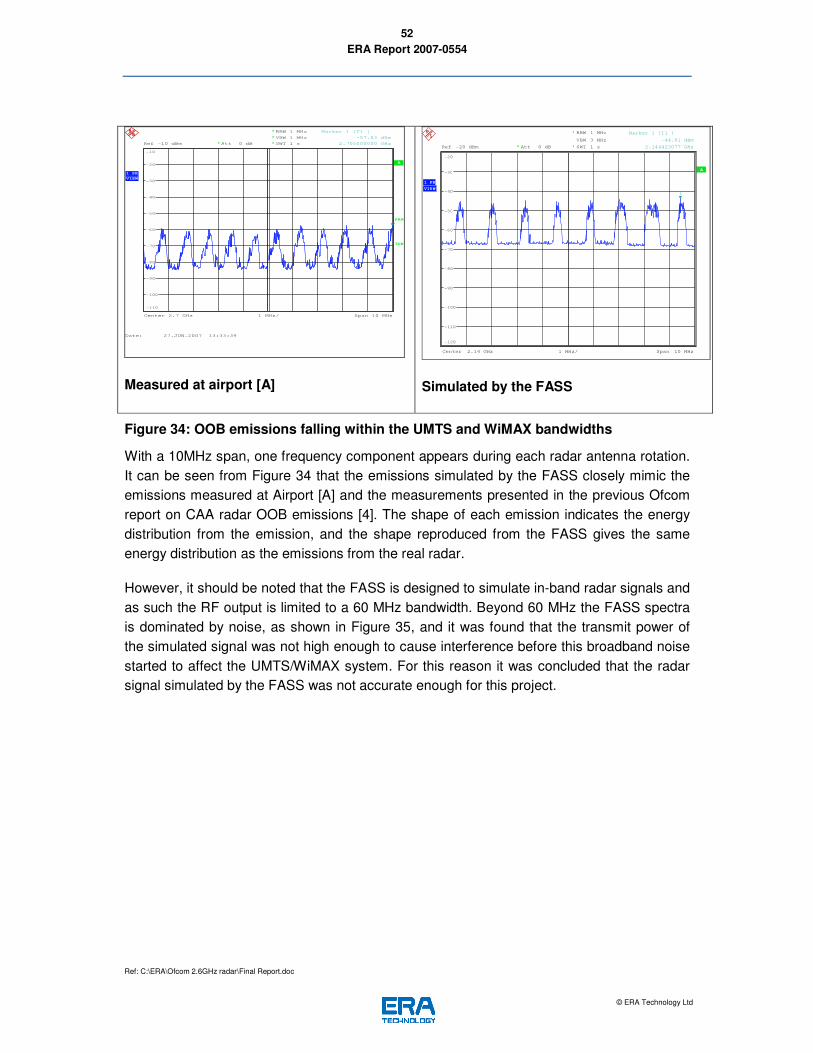
Simulated by the FASS
Figure 34: OOB emissions falling within the UMTS and WiMAX bandwidths
With a 10MHz span, one frequency component appears during each radar antenna rotation.
It can be seen from Figure 34 that the emissions simulated by the FASS closely mimic the
emissions measured at Airport [A] and the measurements presented in the previous Ofcom
report on CAA radar OOB emissions [4]. The shape of each emission indicates the energy
distribution from the emission, and the shape reproduced from the FASS gives the same
energy distribution as the emissions from the real radar.
However, it should be noted that the FASS is designed to simulate in-band radar signals and
as such the RF output is limited to a 60 MHz bandwidth. Beyond 60 MHz the FASS spectra
is dominated by noise, as shown in Figure 35, and it was found that the transmit power of
the simulated signal was not high enough to cause interference before this broadband noise
started to affect the UMTS/WiMAX system. For this reason it was concluded that the radar
signal simulated by the FASS was not accurate enough for this project.
Page 53
ERA Report 2007-0554
Ref: C:\ERA\Ofcom 2.6GHz radar\Final Report.doc
© ERA Technology Ltd
53
Output of FASS Max Pk, Max Hold
-100
-80
-60
-40
-20
0
20
2.00E+09 2.05E+09 2.10E+09 2.15E+09 2.20E+09 2.25E+09 2.30E+09
Frequency (Hz)
dB
m
20dBm
10dBm
0dBm
-10dBm
-20dBm
-30dBm
-40dBm
Output of FASS - Average
-90
-80
-70
-60
-50
-40
-30
-20
-10
0
2.00E+09 2.05E+09 2.10E+09 2.15E+09 2.20E+09 2.25E+09 2.30E+09
Frequency (Hz)
dB
m
20dBm
10dBm
0dBm
-10dBm
-20dBm
-30dBm
-40dBm
Figure 35: FASS RF output
Page 54
ERA Report 2007-0554
Ref: C:\ERA\Ofcom 2.6GHz radar\Final Report.doc
© ERA Technology Ltd
54
Appendix B
Calibration of Emissions from Signal Generator
The radar signals were also simulated with a modern Agilent Signal Generator running pulse
building studio software.
Emission profile of TWT Radar
As shown in Figure 36, the emission characteristics of the simulated signal are similar to
those measured by ERA at airport [A].
TWT Radar Spectra
-90
-80
-70
-60
-50
-40
-30
-20
-10
0
-2.0E+08 -1.5E+08 -1.0E+08 -5.0E+07 0.0E+00 5.0E+07 1.0E+08 1.5E+08 2.0E+08
Frequency (Hz)
dB
Airport[A]
SiG Gen
Figure 36: TWT Radar Spectrum from Signal Generator
Radar antenna rotation and antenna pattern
The signal generator was programmed with the actual radar antenna rotation/pattern, and is
shown in Figure 37 compared with the emissions measured at airport [A]. It can be seen that
the simulated signal matches closely with the measured emissions.
Page 55
ERA Report 2007-0554
Ref: C:\ERA\Ofcom 2.6GHz radar\Final Report.doc
© ERA Technology Ltd
55
Antenna Pattern/Rotation
-50
-45
-40
-35
-30
-25
-20
-15
-10
-5
0
5
0 0.5 1 1.5 2 2.5 3 3.5 4
Time (second)
dB
SiG Gen
TWT/Airport[A]
Figure 37 Simulated antenna pattern/rotation compared with measured emissions
Emission Bandwidth
The signal generator has a wide bandwidth, which is more than 800 MHz, and the OOB/SE
emissions are quite similar to those measured from a real radar, using peak detector and
max hold, as shown in the Figures below.
noise floor of SiG Gen E8267D
-80
-70
-60
-50
-40
-30
-20
-10
0
10
2.21E+09 2.31E+09 2.41E+09 2.51E+09 2.61E+09 2.71E+09 2.81E+09 2.91E+09 3.01E+09 3.11E+09
Freq
dB
Series1
Series2
Figure 38: Bandwidth of simulated signal using signal generator
Page 56
ERA Report 2007-0554
Ref: C:\ERA\Ofcom 2.6GHz radar\Final Report.doc
© ERA Technology Ltd
56
From a previous Ofcom study [4]
A
3DB
*
*
RBW 1 MHz
VBW 1 MHz
SWT 1 s*Ref -10 dBm Att 0 dB*
Center 2.7 GHz Span 10 MHz1 MHz/
1 PK
VIEW
PRN
-110
-100
-90
-80
-70
-60
-50
-40
-30
-20
-10
1
Marker 1 [T1 ]
-57.53 dBm
2.705000000 GHz
Date: 27.JUN.2007 13:33:39
Measured at Airport [A]
Simulated by the SiG Gen
Figure 39: Comparison of OOB emissions using the signal generator
Page 57
ERA Report 2007-0554
Ref: C:\ERA\Ofcom 2.6GHz radar\Final Report.doc
© ERA Technology Ltd
57
Appendix C
Definition of Radar interference
The Out-Of-Band and Spurious Emissions of the radar signal are quite complex; the
measured spectra are a combination of the radar transmission spectrum, factors of radar
antenna rotation, and other factors such as non-linear effects from the radar components
etc. The components of the radar emissions include essentially two types of emissions,
narrow peaks and broadband-like emissions. The narrow peaks tend to be higher but do not
occur as often statistically as the broadband interference. They are both limited by the
antenna rotation, but the narrow peaks are even less statistically likely. For example, on a
typical spectrum analyser setting, 1s sweep time, it may take up to about 10 seconds for
most of the narrowband peaks to appear, whereas the broadband noise appears fairly
instantaneously.
The radar emissions can then be presented and interpreted differently with different
measuring methods. The radar emissions are defined in the spurious emissions standards to
be measured using peak detector, 1 MHz RBW and max hold. However, an average
measurement (with peak detector) instead of a max hold measurement shows that the
narrowband peaks disappear and you essentially have the average of the broadband noise.
For this reason, specifying C/I is completely dependent on how to specify the measurement
of the value of I. If an average measurement is used then a relative constant value C/I to
cause problems of other comm kits is observed for all frequency offsets. If a max hold
measurement, the level of the narrowband peaks is measured, although these are not
actually causing the interference. Therefore higher C/Is is observed for small frequency
offsets, approaching same C/I as broadband emissions for offsets tending towards large
frequency offset. This is because with increasing frequency offset, the ratio of the
narrowband peaks to the level of the broadband emissions reduces.
Page 58
ERA Report 2007-0554
Ref: C:\ERA\Ofcom 2.6GHz radar\Final Report.doc
© ERA Technology Ltd
58
-75
-70
-65
-60
-55
-50
-45
-40
-6.00 -5.00 -4.00 -3.00 -2.00 -1.00 0.00 1.00 2.00 3.00 4.00
Freqency (MHz)
dB
m
Max Peak, Max hold
Max Peak,clear/write
(a)
Probability Distribution Function of Emissions
0%
20%
40%
60%
80%
100%
120%
-75 -74 -73 -72 -71 -70 -69 -68 -67 -66 -65 -64 -63 -62 -61 -60 -59 -58 -57 -56 -55 -54
Emission level (dBm)
Pe
rcen
tag
e
Max Peak, Clear/Write
Max peak, Max Hold
(b)
Figure 40 a) Spectra of Max hold and Clear/Write b) Probability distribution of
interference levels
Page 59
ERA Report 2007-0554
Ref: C:\ERA\Ofcom 2.6GHz radar\Final Report.doc
© ERA Technology Ltd
59
Comparing with the Max hold measurement and “snapshots”, the statistics analysis clearly
showed that the chance of narrowband emissions is much lower at any time step/
“snapshot”, the chance of having a peak emission of -55dBm/MHz is 0.004%, rather than
0.4% with Max hold method.
Table 13 Statistics Distribution of interference level
dBm/MHz Snapshots Max-hold
-73 100.000% 100.000%
-72 99.655% 100.000%
-71 81.550% 100.000%
-70 27.307% 100.000%
-69 4.545% 96.200%
-68 1.632% 82.200%
-67 1.299% 74.400%
-66 1.107% 67.800%
-65 0.980% 63.800%
-64 0.859% 58.200%
-63 0.650% 46.600%
-62 0.414% 34.000%
-61 0.176% 16.000%
-60 0.069% 6.800%
-59 0.051% 5.200%
-58 0.036% 3.600%
-57 0.020% 2.000%
-56 0.012% 1.200%
-55 0.004% 0.400%
-54 0.000% 0.000%