63

Interference �lter stabilized external cavity
diode laser
Matthias Scholl
March 18, 2010
Abstract
This document contains explanations about an external cavity diodelaser (ECDL) using an interference �lter as the wavelength selective ele-ment as well as the characterization of two nearly identical realizations.Spectral properties and characteristics are measured and discussed. At theend a step by step instructions manual for building one of these ECDL'sis given.
1

Contents
I Theory and Measurements 4
1 Introduction and Motivation 41.1 Littrow con�guration . . . . . . . . . . . . . . . . . . . . . . . . . 41.2 Interference �lter con�guration . . . . . . . . . . . . . . . . . . . 5
2 Basic Setup and Cavity Modes 62.1 Elements used in the cavity . . . . . . . . . . . . . . . . . . . . . 62.2 Internal & external cavity modes . . . . . . . . . . . . . . . . . . 12
3 Output Power 15
4 Beam pro�le 16
5 Wavelength tuning 18
6 Noise and linewidth 206.1 De�nition: Linewidth, Drift and instantaneous linewidth . . . . . 216.2 Contribution of driver noise to linewidth . . . . . . . . . . . . . . 216.3 Noise spectrum . . . . . . . . . . . . . . . . . . . . . . . . . . . . 226.4 Beat note measurements . . . . . . . . . . . . . . . . . . . . . . . 226.5 Piezo resonance frequency . . . . . . . . . . . . . . . . . . . . . . 25
II Instructions for building the ECDL 29
7 Schematic of the laser 30
8 Needed items 308.1 Drivers & controllers . . . . . . . . . . . . . . . . . . . . . . . . . 308.2 Mechanical parts . . . . . . . . . . . . . . . . . . . . . . . . . . . 308.3 Optics & electronics . . . . . . . . . . . . . . . . . . . . . . . . . 318.4 Miscellaneous . . . . . . . . . . . . . . . . . . . . . . . . . . . . . 31
9 Cleaning of mechanical parts 32
10 Wiring - Electric Connections 3210.1 Thermal management wiring . . . . . . . . . . . . . . . . . . . . 3310.2 Wiring for laser diode current . . . . . . . . . . . . . . . . . . . . 3410.3 Wiring for the piezo . . . . . . . . . . . . . . . . . . . . . . . . . 35
11 Assembling: out-coupler to piezo 35
12 Assembling: piezo+out-coupler to �cat's eye� mount 36
2

13 Soldering and testing: peltiers, thermistors and laser diodesocket 3713.1 Soldering . . . . . . . . . . . . . . . . . . . . . . . . . . . . . . . 3913.2 Testing . . . . . . . . . . . . . . . . . . . . . . . . . . . . . . . . . 39
14 Assembling: cavity to base plate 4114.1 Cavity, peltier and base plate . . . . . . . . . . . . . . . . . . . . 4114.2 Thermistor for base . . . . . . . . . . . . . . . . . . . . . . . . . 42
15 Assembling: laser diode to copper housing 42
16 Assembling: laser diode+copper housing to cavity 4516.1 Preparation: Cat's eye mount to cavity . . . . . . . . . . . . . . 4516.2 Assembling . . . . . . . . . . . . . . . . . . . . . . . . . . . . . . 45
17 Optical setup for testing and optimization 46
18 Collimation lens 47
19 �Cat's eye� lenses 4819.1 Preparation . . . . . . . . . . . . . . . . . . . . . . . . . . . . . . 4819.2 Observing the threshold . . . . . . . . . . . . . . . . . . . . . . . 4919.3 Optimizing the lens positions . . . . . . . . . . . . . . . . . . . . 49
20 Interference �lter 51
21 Saturation spectroscopy 5221.1 Finding the Potassium line - Fluorescence . . . . . . . . . . . . . 5221.2 Observing saturation spectroscopy signal . . . . . . . . . . . . . . 5221.3 Optimizing external and internal cavity modes . . . . . . . . . . 53
22 What to improve 53
23 Costs for one laser 54
A Photos of Mechanical Parts 56
B Beam pro�le pictures 60
3

Part I
Theory and Measurements
1 Introduction and Motivation
Laser diodes are an attractive light source in many �elds of experimental physicsand technology. They combine the advantage of being very small (smaller than athumb) and due to the industrial use in CD/DVD/Blue Ray, being quite cheap(at least for the wavelength region around 780nm, 767nm and 405nm, whichare important for laser cooling applications with Rb or K). Output powers varyfrom µW to several Watts. The disadvantage of laser diodes are their bad spatialmode pro�le, usually elliptical with di�erent higher TEM modes, and the biglinewidth. Often laser diodes operate in multi mode, meaning they emit laserlight at more than one frequency at the same time.
Since many applications, e.g. laser cooling, need a single laser frequency anda linewidth on the order of a few MHz and lower, people have developed severaltechniques to force a laser diode to single mode operation and to narrow thelinewidth. One is to use an external cavity, to introduce frequency dependendadditional losses to the laser, in order to discriminate most of the modes, sothat the gain for one particular mode is much higher than for all other modes.Due to a certain frequency width of this discriminating element, the linewidthcan also be reduced.
1.1 Littrow con�guration
The most common used external cavity design is called Littrow con�guration(Figure 1). In this setup, the 1st order di�racted light from a di�raction gratinggets fed back to the laser diode and the 0th order light is used for out coupling.Since the angle of the 1st order di�racted light depends on the frequency of thelight, only a very narrow frequency band gets fed back to the laser and thereforethe losses for all other frequencies are much higher. By turning the di�ractiongrating, one can tune the frequency that gets fed back and thus the wavelengthemitted by the laser.
The wavelength dependence of the 1st order angle is given by the Braggcondition λ = 2d · sin θ with θ the angle of incidence and d the grating constanst.Typical values are d−1 = 1200 lines/mm and θ ≈ 28° for a wavelength of 780nm.This leads to a wavelength sensitivity of dλ/dθ ≈ 1.5 nm/mrad for turning thegrating. While turning the grating, the 0th order out coupling beam also moves,which redirects the beam by (dλ/dθ)−1 ≈ 1.3 mrad/nm.
In this con�guration of an external cavity, the amount of feedback and thewavelength selection, since performed by the same element, are not independent,which results in less control over mode hops and mode hop free scanning range.
4

Figure 1: Littrow con�guration, using a di�raction grating for an external cavity
1.2 Interference �lter con�guration
In 2006 Clairon et al. presented a new design of an external cavity (Figure 2)[Clairon] using a narrow-band interference �lter (IF) for wavelength discrimi-nation, instead of using a di�raction grating. The interference �lter has 90%transmission and a FWHM of 0.3nm. The wavelength of the transmission max-imum depends on the angle of incidence (details see 2.1.2). Therefore the wave-length tuning can be performed by turning the �lter. This leads to a sensitivityof dλ/dθ ≈ −0.017 nm/mrad, which is 60 times smaller than for the Littrowcon�guration. Thus the laser design is in principle less sensitive to mechanicalvibrations and disturbances.The feedback is performed by a partial re�ector, which can be displaced by apiezo tube.Still the beam gets displaced while tuning the wavelength, but the displacementis reduced by a factor of 2 compared to the Littrow con�guration. Also the in-dependence of the wavelength selection, using the IF and the optical feedback,using the out coupler mirror (OC) is an advantage of the new con�guration.
In the following sections a more detailed explanation of the laser design, thespectral properties and mode dynamics is given.
5

Figure 2: New con�guration of the external cavity, using an narrow band inter-ference �lter for wavelength discrimination. The focal lengths and re�ectivitiesare given for our speci�c case.
2 Basic Setup and Cavity Modes
2.1 Elements used in the cavity
In this subsection details are given about properties and purpose of the dif-ferent elements in the laser setup (shown in Figure 2), both theoretically andexperimentally.
2.1.1 Laser diode
The laser diode is anti re�ection coated on the out put facet, which leads to alarger total tuning range of the wavelength, using an external cavity (see [Rasel].
Due to the AR-coating on the laser diode, there is just a weak resonator inthe bare laser diode. But it is interesting to look at the characteristic curve to�nd out, if the bare diode still can start lasing without additional feedback froman external cavity and what the threshold current is.To do this, the diode was mounted to a Thorlabs laser diode mount and theemitted light was collimated and send to a power meter. By looking at theoutput power for di�erent laser diode currents one obtains the characteristiccurve shown in Figure 3.
The threshold current is �tted to be Ithr = 65mA.The total tuning range of the laser (using the IF rotation) is determined by
the gain curve of the laser diode, shown in Fig 2.1.1. It basically re�ects theproperties of the laser transition in the band structure of the GaAs semiconduc-tor, the diode is made of.
2.1.2 Interference �lter
The IF takes the part of the wavelength discrimination in the external cavity,meaning it is the part in the resonator which forces the laser to stable single
6

Figure 3: Bare laser diode characteristic curve.
Figure 4: Laser diode gain curve [datasheet]
7

center wavelength 780nm 767nm
angle of incidence ≈5° ≈22°wavelength sensitivity ≈ 0.017 nm/mrad ≈ 0.071 nm/mrad
Table 1: Important properties of the interference �lter
mode and reduces the linewidth. It is also used for coarse wavelength tuning.It works on the basis of the interference of multiple re�ected beams, similar
to a fabry perot interferometer. The �lter is made of a substrat, which is coatedwith many dielectric layers on one side and anti re�ection coated on the otherside. The blue shimmering side is the AR-coated side, because all the red lightgets transmitted, but the AR coating is very bad for blue light, which getsre�ected. The other side is shimmering red, since only a narrow band in the redlight frequency region gets transmitted, the rest is re�ected.Since the laser is planned to run at 767nm, it is important to know, how thewavelength of the transmission maximum depends on the angle of incidence.With that information we can �nd out at what angle the �lter should be usedfor 767nm and what the sensitivity dλ/dθ is. This quantity gives information,how sensitive the system is to vibrations or misalignments.
Theoretically the �lter can be described as a thin fabry perot etalon with ane�ective index of refraction neff . The transmitted wavelength is given by:
λ = λmax
√1− sin2θ
n2eff
(1)
where θ is the angle of incidence (AOI) and λmax is the transmitted wave-length at normal incidence.
The center wavelength vs aoi of the �lter (Figure 5) is measured using awhite light source. The light gets collimated and send through the �lter, whichis mounted to a rotation stage. The transmitted light is spectrally analyzedwith a monochromator. The resolution is 0.1nm, limited by the width of themonochromator slit.
The data can be �tted very well using Equation (1). λmax is measured to780.9nm and the e�ective index of refraction is �tted to be neff = 1.97 ± 0.01,which is a typical value for neff .
With this result, one can �nd the AOI for 767nm and for 780nm. Thewavelength sensitivity can be calculated using the derivative of Eq (1) . Theresults are shown in Table 1 :
The sensitivity at 780nm matches the value in [Clairon], but at 767nm the�lter, and therefore the laser, is 4 times more sensitive!
The FWHM of the transmission maximum at AOI=0° is measured to be0.3nm± 0.1nm. By changing the AOI, the FWHM seems to get bigger (seeFigure 6). But this e�ect can be explained by assuming a not perfectly col-limated beam: An uncertainty ∆θ in the angle of incidence, translates to an
8

Figure 5: The maximum of the transmitted wavelength spectrum is plottedversus the angle of incidence. The AOI is changed, using a rotation stage as theunderlayment of the �lter.
9

Figure 6: FWHM of the transmission maximum in dependence of the angle ofincidence
uncertainty of the center wavelength λ(θ) of
∆λ = | ddθλ(θ)| ·∆θ (2)
and therefore to an e�ective broadening of the transmission curve. In a sim-ple model, the total measured linewidth is given by ∆λ added to the intrinsicFWHM@0°. Assuming λmax = 780.9nm and neff = 1.97, the data can be �ttednicely. The uncertainty in the AOI is �tted to be: ∆θ = 0.7°±0.1°. This agreeswith the measured divergence angle of the white light beam.So as a result, the FWHM of the �lter itself of 0.3nm does not change signi�-cantly, when turning the �lter.
The transmission at 767nm has been measured to be 90.7%± 0.3%.
2.1.3 Lenses
In the laser setup three lenses are used, all with an anti re�ection coating:
1. A Collimation lens with f=4.51mm and high NA=0.55 is used to collimatethe light coming out from the laser diode. Laser diodes emitt stronglydivergent light compared to other laser sources, with an elliptical beampro�le (divergence angles of about 30° parallel and 10° perpendicular).The collimation lens is necessary, to collect as much light from the diode
10

as possible (high NA). But a good collimation is also needed in order toreduce the additional broadening of the FWHM of the interference �lter(see 2.1.2).
2. The optical feedback is provided by a combination of a lens (L1) withf=18.4mm and the out-coupler mirror (OC) in focal distance. This socalled cat's eye con�guration is less sensitive to misalignments of the OC,compared to the case of feeding back without having this lens. Especiallyfor the case, that the OC is slightly tilted (which will usually hold in labreality), it is easy to see that the cat's eye con�guration provides a betterfeedback.
3. The outcoupled beam gets collimated again by a lens with f=11.4mm.This lens has nothing to do with the quality of the external cavity. It isjust needed to provide a nice collimated output beam, to use the laser lightfor experiments, measurements, �ber coupling, etc. The focal length ofL2 is chosen to be smaller than the focal length of L1, in order to decreasethe size of the output beam, since it is more convenient to work with asmaller beam (easier �ber coupling, less problems with apertures, etc).
2.1.4 Out coupler & piezo tube
The out-coupler mirror, which provides the feedback, together with the lens L1(cat's eye con�guration) is glued to a piezo ring actuator.
The out-coupler has a diameter of 0.500�, a thickness of 0.125� and is �at.It is partial re�ecting on one side and AR-coated on the other side (both madefor 767nm). The re�ectivity of the OC determines the amount of feedback andthereforce e�ects the output power of the laser as well as the instantaneouslinewidth. Higher re�ectances lead to higher intracavity powers, but less outcoupled (usable) light. Considering the external cavity as a fabry perot interfer-ometer/etalon, higher re�ectances give a higher �nesse and thus narrower cavitymodes, meaning a narrower instantaneous linewidth.
Lower re�ectances however, lead to a lower �nesse, but more out coupledlight. But if the re�ectance is too small, the external cavity gets too weak andthe laser properties are given by the bare diode again. This means, that there isa point at which, decreasing OC re�ectivity leads to a decreasing output poweragain!At some point, we expect a nice tradeo� between linewidth and output power,that satis�es the needs for our laser cooling applications. To �nd this point wecharacterized identical laser systems with OC re�ectivitys of R=8%, R=11%,R=17% and R=22%.
The ring actuator has a length of 9mm and a diameter of ≈12mm, includingthe isolation coating. The diameter of the cylindrical hole in the middle is&4.5mm including the isolation coating.
As any other solid state body, a piezo has a resonance frequency. It theo-retically follows a simple spring-mass-system, according to the information onwww.piezomechanik.com:
11

f0 =1
2π
√S
meff(3)
where S is the sti�ness and meff is approximately 1/3 of the mass of theceramic + the mass of all installed pieces.
For our particular piezotube the sti�ness is S = 200 N/µm and for a one side�x oscillation, the axial resonance frequency is given as f0 = 40 kHz [Datasheet].
The goal is now to calculate the resonance frequency of the piezo �xed onone side and with a mirror glued on the other side.
Since f0 and S is given we can calculate meff ≈ 3g for the piezo withoutmirror.The mass of the out-coupler mirror can be calculated to mOC ≈ 1g, using thedimensions of the mirror and the density of the substrate BK7 (≈ 2.5 g/cm3).
Therefore the new e�ective mass is m′
eff = meff + mOC ≈ 4g and thus theexpected resonance frequency:
f0 =1
2π
√S
m′eff
≈ 35 kHz (4)
Experimentally the resonance frequencies of the piezos (�xed on one endand OC on the other end) are measured to be around 13kHz (see section 6.5).The measured values are approximately 2 times smaller than the theoreticallyexpected ones.REASON?!?!
The external cavity formed by the OC can be described as a Fabry-Perot-Resonator. The modes of such a resonator are spaced by blabla.
2.2 Internal & external cavity modes
The laser frequency is mainly determined by the internal and external cavitymodes as well as the transmission maximum of the IF.
Here some important quantities:The IF maximum has a FWHM of ca 150GHz.The internal cavity has a length of 750µm. The modespacing therefore cal-
culates (taking nGaAs = 3.6 into account) to ∆νinternal ≈ 55GHz.The modespacing for the external cavity is ∆νinternal ≈ 1.7GHz, assuming a
cavity length of 8.5cm.So eventually, the laser should be emitting at the frequency that has the
highest gain. Figure 7 shows the spectral properties of all theses modes inprincipal. The mode spacing, as well as the peak heights are not to scale, butmore to get an idea how mode tuning works.
The situation shown is kind of an ideal situation, the maximum of a internaland external cavity mode matches the maximum of the IF. In fact this perfectsituation will almost never be realized in the lab, the modes will be slightlyshifted agains each other.
To tune the laser frequency one has now three options:
12

Figure 7: IF transmission mode + internal and external cavity modes determinethe actual laser frequency.
1. Rotating the IF leads to a frequency shift of the transmission maximum.This can be used for coarse tuning.
2. To shift the internal cavity modes, one has to change the laser diodetemperature or the laser diode current (what essentially also changes thetemperature of the laser diode but only on a much faster timescale!)
3. By changing the piezo voltage, the OC mirror gets displaced, what essen-tially moves the cavity modes (it also changes the mode spacing, but thate�ect is negligible).
The piezo voltage and the laser diode current can both be used for �ne tuningand feedback in a laser lock scheme. The diode current can be used for veryfast feedback (order of MHz) and the piezo usually for a few kHz. (more detailssee section 6.5)
An idea how to get near to this optimal con�guration is described in section21.1.1.
To get a feeling of how strong the di�erent mode really are and what thefrequency scales are, the internal and external cavity modes are plotted in Figure8
13

Figure 8: Left picture: External cavity modes assuming R=1 for the back faceof the diode: red curve: R=11%, blue curve: R=20%; Right picture: internalcavity modes, assuming R=1 for the back face and R=0.0003 for the AR coatedface (datasheet). Lower picture: Both in one plot (external for R=11%). Theplot range is the FWHM of the interference �lter!
14

Figure 9: Output power vs laser diode current for the laser setup withROC = 10.9% (Laser 1) for di�erent laser diode temperatures.
3 Output Power
The output power has been measured using a power meter.Figure 9 shows the temperature dependence of the output power of Laser 1.
With lower temperatures the output power seems to increase. This could be anintrisical property of the diode. Other than that, it could be that due to thetemperature change, the modes and the emitted frequency are changing. Themodes at the egde of the FWHM of the IF (near a mode jump) have a lowergain and are therefore expected to have less output power. But this e�ect wouldaverage out, since with the current, also the wavelength gets tuned! However,the e�ect could be observed during the measurements, that near mode jumps theslope of the curve gets smaller. This can be nicely seen at high diode currentscurrents in the black curve, that the output power slope goes down every ~20mA(what corresponds to the current needed to scan over the free spectral range ofthe internal cavity - see section 5).
Comparing the output powers of all the laser systems testet (Figure 10), onecan see the following:
The output power of laser 1 is higher than the output power of laser 2, eventhe OC re�ectivity is smaller. One explanation could be the fact that the feed-back of laser 2 was maybe not optimal (see comment in Figure 10). Anotherexplanation could be that with the R=8% mirror, the region of decreasing out-
15

OC re�ectivity Ithreshold with IF
8% 33mA±1mA*11% 26mA±1mA17% 27mA±1mA22% 25mA±1mA
bare diode 65mA±1mA
Table 2: Threshold currents for all laser setups measured with the technique ex-plained in section 19.2 (except the bare diode). (*maybe not optimized feedbackdue to not nicely collimated intracavity beam)
put power, when decreasing R is reached (when R gets too small, the propertiesof the bare diode dominate, what leads to lower output power when decreasingR).
Surprisingly laser 3 (R=22%) has a higher output power than laser 4 (R=17%).This and the result described before, could indicate that in laser 4 (which usesthe same setup as laser 2) is maybe something intrinsically worse than in theother setup. It could be just that the laser diode properties are di�erent or thatthe optics are better in one setup (or less dirty). Also the laser diode in onesetup (which provides the back mirror of the cavity) could have more of an angleto the z-axis than in the other setup, due to imperfections in the mechanicalelements or during the gluing process of the diode.
The threshold currents of laser 4 and 1 are also indicating, that the feedbackin the two setups could be di�erent (Table 2).
However, with all lasers output powers of 40mW are possible below a diodecurrent of 120mA, for laser 1, 3 and 4 even below 100mA, what's only half ofthe maximum diode current!
The limitation on the diode is according to the spec. sheet an extracavitypower of 100mW, but somehow there is no information given about the feedbackof the external cavity, which determines the intracavity power (that's the onethat could kill the diode!). Just for safety I would recommend the diode not torun at more than 100mW intracavity power, so depending on the OC re�ectivityone should set limitations to the current.
4 Beam pro�le
Using the Beam'R the beam pro�le of the four laser setups has been measured.The pictures are in the Appendix B.According to a gaussian �t, all lasers are estimated more than 90% TEM00
mode. The further away you measure, the better the beam quality gets.For example laser 4, the at a distance of 13cm (Figure 11) the pro�le looks
really crappy, but at a distance of 125cm (Figure 12) the beam pro�le looksreally nice!
At short distances I expect e�ects like re�ections of apertures and the �uo-
16

Figure 10: Output power for the 4 di�erent laser systems, tested. The laserdiode temperatures during the measurements were all around room tempera-ture. *After unassembling laser 2, one could see that the beam after the �rstcollimation lens was not nicely collimated, thus the optical feedback could havenot been optimal.
17

Figure 11: Laser 4 beam pro�le, left 13cm
Laser 1 Laser 2 Laser 3 Laser 4
(dν/dI)internal[GHz/mA] -2.2±0.3 -2.3±0.4 -2.1±0.3 -2.2±0.2(dν/dI)external[MHz/mA] 171±25 77 69±17 88±12current tuning rangeinternal ≈ 43GHz ≈ 44GHz ≈ 40GHz ≈ 43GHz
typ. current tuning rangeexternal 0.4-0.5GHz 0.4-0.5GHz 0.4-0.5GHz 0.4-0.5GHzdν/dUpiezo [MHz/V] −53± 2 -41 -52 -42piezo tuning range >7.3GHz >6GHz >7.4GHz >6GHz
Table 3: Tunabilities and sensitivities of all laser setups
rescence of the laser diode (that is still there and has a broad angle distribution)to mess the beam pro�le up.
The beam coming out of the laser diode is usually elliptic, but the externalcavity seems to clean the mode pro�le. The ratio of vertical to horizontal FWHMof the intensity is always measured to be 0.9 < FWHM < 1.1. The FWHM doesnot change signi�cantly, by changing the laser output power.
Due to an astigmatic beam, it is not possible to collimate the output beamin both the horizontal and vertical direction. It seems, that collimating it inthe vertical direction is somehow not nicely doable. So the light was alwayscollimated in horizontal direction
The collimation has been done using an IR card, which might not be theperfect tool to do that, due to saturation e�ects.
5 Wavelength tuning
As described in section 2.2, the �ne tuning of the laser frequency is mainly doneusing the laser diode current and the piezo voltage.
To �nd out what the frequency sensitivities, as well as the mode hop freetuning ranges are for the piezo voltage and the diode current, the setup in Figure13was used.
The measurement results are shown in Table 3Actually all measurements are limited by the 100MHz resolution of the
wavemeter. Especially for the current tunability within one external mode,this limits pretty much the measurement accuracy! (the error bars are just thestandard deviation taken for an average of 2 values!)
Surprisingly the piezo mode hop free tuning range is bigger than the modespacing of the external cavity modes. This is due to the fact that the internalcavity modes are very weak. The advantage of having such a big mode hop freetuning range is at the cost of stability: Imagine the laser starts at the optimalposition shown Figure 7. Assume the external cavity mode gets shifted by morethan the free spectral range without a mode jump. Then the neighboured modeis in this optimal position and should have the highest gain, but the laser is still
18

Figure 12: Laser 4 beam pro�le: upper picture 13cm distance, lower picture125cm distance
19

Figure 13: optical setup used for most of the measurements
emitting in the other mode! One explaination could be, that tuning a runninglaser is di�erent compared to tuning a �not running� laser. In the running laserthere are already many photons in the cavity and if the frequency gets tunedadiabatically, the total gain is not only determined by the cavity modes, but alsoby how many photons are already in the cavity, using the population inversionfor their frequency!
One could test this instability by tuning more than the free spectral range,turning o� the laser and turning it on again to see if it is lasing at the samefrequency or at the one having the �new� optimal frequency. Unfortunately ifthe laser current gets turned down, the internal cavity modes get shifted whatchanges the hole situation and it is not clear how reversible this process is.
What could be done is just blocking the beam in the laser with a piece ofpaper for a short time and therefore �restarting� the laser without chaning anyof the relevant parameters.
6 Noise and linewidth
First a de�nition of important quantities is given, followed by an estimationhow driver noise e�ects the linewidth. Then several measurement results arepresented, to characterize the spectral properties of the di�erent laser systems.
20

noise typical time scale typical frequency scale
temperature drifts &1s .1Hzmechanical vibrations 10ms-50µs 100Hz-20kHz
electrical noise up to a few MHzhmhm
Table 4: Typical frequency scales of noise
6.1 De�nition: Linewidth, Drift and instantaneous linewidth
The light emitted by a laser is not perfectly monochromatic, but has morea gaussian or lorentzian frequency distribution (or a mixture of both calledVoigt distribution) with a center frequency ν0 and a FWHM of ∆ν, called thelinewidth of the laser.
Common e�ects that contribute to this linewidth are the doppler e�ect (forlasers using a gas as gain medium), mechanical vibrations of the cavity (e.g.acoustic vibrations), temperature �uctuations and noise of the controllers (cur-rent supply for laser diode and voltage supply for piezo). The time scales forthis di�erent e�ects can be seen in Table XX.
Depending what the measurement time is compared to the time scale ofthe broadening e�ect, the contribution from this e�ect appears as linewidth ordrift. Frequency �uctuations slower than the measurement time will occur as amovement of the center frequency from measurement to measurement, what iscalled a drift. Frequency �uctuations faster than the measurement time can'tbe resolved as movement of the centerfrequency. They lead to a distributionof the center frequency during the measurement, what e�ectively broadens theline. The width of this distribution is called linewidth.
So stating a result of a linewidth or drift measurement only makes sense, incombination with providing the measurement time.
The linewidth that would be seen, having a measurement time in�nitesimallyshort (in�nite frequency) is called the instantaneous linewidth.
For lasers, a minimum on the instantaneous linewidth is set by Heisenbergsuncertainty principle, but usually there are other limiting e�ects that broadenthe instantaneous linewidth.
6.2 Contribution of driver noise to linewidth
The piezo voltage driver has a noise level of 9.9mVpp and 1.5mVRMS [datasheet](no information about the frequency of the noise), tested without an externalload connected. Adding a capacitive load, such as a piezo will decrease the noise,since the capacitance will create a low pass �lter with the output resistance. Sothis numbers should be seen as an overestimated upper limit. The frequencysensitivity of the piezo is dν/dU = −0.053 GHz/V according to the measurementin 5. Therefore the overestimated expected frequency noise, caused by the noiseof the piezo driver, would be ∆νRMS . 80kHz respectively ∆νpp . 520kHz .
21

The Current driver for the laser diode has a noise level of < 1.5µARMS (rip-ple: 50/60 Hz & noise without ripple 10Hz..10MHz) [datasheet]. The frequencysensitivity is dν/dI ≈ 170 MHz/mA and therefore the expected frequency noise∆ν . 250kHz .
6.3 Noise spectrum
In order to �nd out at what frequencys the dominant noise contributions are, thenoise spectrum has been measured. The trick is to turn �uctuations in the laserfrequency into intensity �uctuations, using the saturation spectroscopy signal.This can be done by tuning the laser frequency to the edge of the crossover peak(red marked region in Figure 14). At this point the intensity is very sensitiveto small movements in frequency, what can be measured using a photodiode(PDA36A, 17MHz bandwidth). By connecting the photodiode to a spectrumanalyzer (HP 3585B, 20Hz-40MHz), the noise spectrum can be obtained.
Since the lasers are free running, I checked once in a while that the frequencyis not drifting away from the slope.
After turning o� the sweep for the sat spec signal, the function generatorwas unplugged from the piezo driver input, to avoid noise caused by the functiongenerator (that gets multiplied by 15 at the input of the piezo driver).
The noise spectra are pretty similar for all laser setups. An example is shownin Figure 15 and Figure 16.
There are some noise peaks in the region around a kHz. This is the spectralrange of sound waves and mechanical vibrations.
Lowering the noise caused by mechanical vibrations could be done by settingthe laser on a rubber pad, to decouple it vibrationally from the laser table.
Although it's not really clear yet where this noise is coming from or overwhat channel it is brought to the cavity (base plate vibrations, cable vibrations,or just sound waves hitting the resonator at a mechanical resonance).
In the region higher than 1.4kHz no measurable noise could be found (maybelimited by the noise �oor of the spectrum analyzer)
The noise peak at 1.4kHz does not change when the casing of the laser isopened, so its not a soundwave resonance property of the casing.
6.4 Beat note measurements
One easy method to �nd out what the linewidths of the lasers are, is to set upa beat note measurement.
6.4.1 Theory
The beams of two lasers, having the same polarization, are superimposed on aphotodiode. The electric �elds of both beams add and the photodiode makes
an intensity measurement: I ∼ |−→E1 +
−→E2|2. Assuming
−→E1and
−→E2 as sinusoidal
with frequencys ν1 and ν2, the intensity has frequencys of ν1 − ν2 and ν1 + ν2.The summed part is much to fast for any photodiode and averages out. If the
22
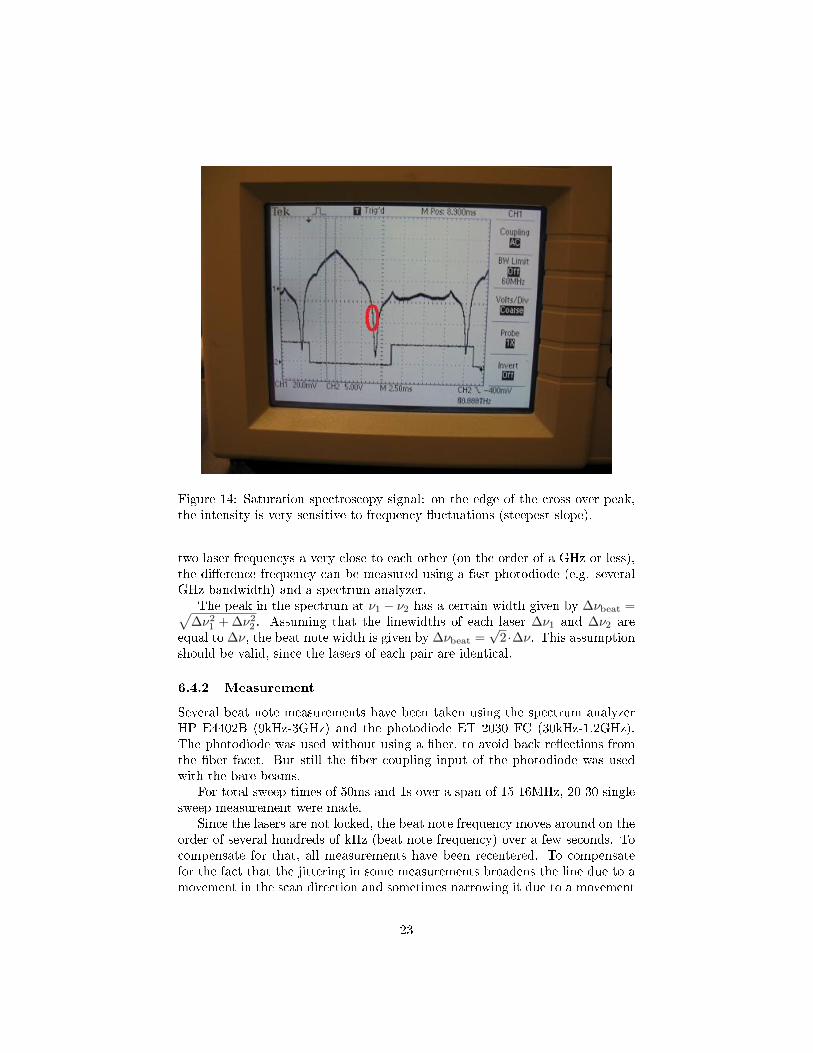
Figure 14: Saturation spectroscopy signal: on the edge of the cross over peak,the intensity is very sensitive to frequency �uctuations (steepest slope).
two laser frequencys a very close to each other (on the order of a GHz or less),the di�erence frequency can be measured using a fast photodiode (e.g. severalGHz bandwidth) and a spectrum analyzer.
The peak in the spectrum at ν1 − ν2 has a certain width given by ∆νbeat =√∆ν2
1 + ∆ν22 . Assuming that the linewidths of each laser ∆ν1 and ∆ν2 are
equal to ∆ν, the beat note width is given by ∆νbeat =√
2 ·∆ν. This assumptionshould be valid, since the lasers of each pair are identical.
6.4.2 Measurement
Several beat note measurements have been taken using the spectrum analyzerHP E4402B (9kHz-3GHz) and the photodiode ET 2030 FC (30kHz-1.2GHz).The photodiode was used without using a �ber, to avoid back re�ections fromthe �ber facet. But still the �ber coupling input of the photodiode was usedwith the bare beams.
For total sweep times of 50ms and 1s over a span of 15-16MHz, 20-30 singlesweep measurement were made.
Since the lasers are not locked, the beat note frequency moves around on theorder of several hundreds of kHz (beat note frequency) over a few seconds. Tocompensate for that, all measurements have been recentered. To compensatefor the fact that the jittering in some measurements broadens the line due to amovement in the scan direction and sometimes narrowing it due to a movement
23

10Hz - 2kHz:
10Hz - 50kHz:
Figure 15: Left: noise spectrum of laser 4, right: noise�oor without signal
Figure 16: Left: noise spectrum from 1Hz to 1MHz for laser 1. Right: noise�oor without signal
24

Laser pair low R high R low R high Rsweep time, span 1s, 15MHz 1s, 16MHz 50ms, 15MHz 50ms, 16MHz
linewidth ∆νGaussian[kHz] 214± 27 193± 13 153± 7 139± 10linewidth ∆νLorentzian[kHz] 24 12 24 12range for �t |ν − ν0|Gaussian <0.7MHz <0.5MHzrange for �t |ν − ν0|Lorentzian >2MHz >2MHzsweeptime over ∆νGaussian ≈ 10ms ≈ 0.5mscontributing noise [kHz] >0.1 >2
Table 5: Beat note measurement results.
opposite to the scan direction during the measurement, an average is made over4-5 single measurements (average in the linear scale!).
The choosing of the single sweep measurements is kind of arbitrary, one couldonly choose the narrowest ones in order to get better data. I tried to choosenarrow ones as well as broader ones. I tried to not choose unsymmetric onesand ones that are obviosly messed up by mechanical or acoustic disturbanceslike hitting a table, slamming a door or Dylan talking and hitting the 1.4kHzresonance (see section 6.3) with his voice.
Examples of the beat notes are shown in Figure 17. All other measurementslook quite similar.
The low frequency noise (around the peak) is due to technical frequencynoise of the drivers and therefore has a gaussian distribution.
The high frequency noise, is due to intrinsical limitations (for example thelinewidth of the laser transition) and is thus given by a lorentzian distribution.
Both regions has been �tted, translating these distributions into logarithmicscales. For the lorentzian �t the boundary condition of matching the peaksvalue was chosen.
Linewidths measured for 1s, 50ms sweep time, as well as the intantaneous one(lorentzian �t of the wings), are getting smaller, with higher OC re�ectivities.
The gaussian linewidth di�erence for the 1s and the 50ms sweep time indi-cates, that there is noise in the frequency region between 100Hz and 2kHz anaddition in linewidth of 21kHz, respectively 14kHz is picked up. In this regionthe main two main noise peaks could be observed (see section 6.3)
By not perfectly recentering the beat note measurements and taking theaverage, the linewidth could be broadened.
6.5 Piezo resonance frequency
The resonance frequency ν0 of the piezo is a very important quantity to know, es-pecially for locking the laser frequency to an atomic transition. Locking means,that small �uctuations of the laser frequency are corrected, using a very fastelectrical loop circuit.
The idea is, that whenever a small change in laser frequency is detected, thepiezo voltage and/or the laser diode current get slightly changed in order to cor-
25

Figure 17: Upper picture: Beat note measurement: average over 5 single sweeps,1s sweep time for laser 3&4; Lower picture: Beat note measurement: averagedover 5 single sweeps, 50ms sweep time for laser 3&4.
26

rect for the frequency movement. The higher the frequency of the �uctuations,the higher the bandwidth of the lock circuit needs to be.
The piezo is usually used for feedback in the frequency region up to a few kHz.This means, that the lock circuit can correct for laser frequency �uctuations ordrifts on a time scale down to several hundreds of µs. That region includestemperature drifts and most of the accustic noise.
Since the response of the piezo gets a phase shift in the region around theresonance frequency, the piezo would perform the reaction to �uctiations at thewrong time. So one should cut the bandwidth of the piezo lock signal below ν0.This can be done using a low pass �lter and designing the -3dB threshold to bebelow ν0.What's also important to know in this context is the width of the resonance∆ν. This quantity gives information about the region of non negligible phaseshift around the resonance frequency.
6.5.1 Measurement
The measurement is done using the same setup as in REFF, but instead of usingthe voltage driver for the piezo, the function generator is directly connected tothe piezo. It drives it sinusoidally with an o�set of 3V and an amplitude of 4V.The laser wavelength was set to the edge of the doppler broadened absorptionline, so that a change of voltage translates to a small change in intensity. Thenthe intensity shows the same sinusoidally modulation as the voltage.The resonance frequency can be found by looking at the nonlinear amplituderesponse or second by looking at the phase di�erence between the driving voltageand the photodiode signal.
We've chosen the second possibility, since a drift in the laser wavelengthwould change the position on the edge of the doppler broadened absorptionline and therefore the slope and thus the amplitude response. The phase shifthowever is independent of wavelength drifts. It is well described by the followingformular:
ϕ = −arctan
(2νν0γ
ν2 − ν20
)(5)
where ν is the driving frequency, ν0 is the resonance frequency and γ is a di-mensionless damping factor.
Driving below the resonance frequency leads to a phase shift ϕ < 90°, drivingabove to ϕ > 90° and at the resonance frequency ϕ = 90°. Equation (5) is usedto �t the experimental data (Figure 18), obtained for piezo 1 (the one in Laser1 and 3) with the out-coupler R=22% glued on top.
The damping �ts to γ = 0.025 ± 0.002 and the resonance frequency toν0 = 13.9kHz± 0.1kHz.The width of the resonance (FWHM) is given by ∆ν ≈ 2 · γ · ν0 ≈ 0.7kHz
Similar measurements has been done for all used laser setups. Table 6 showsthe measured resonance frequencys and the FWHM of the resonance.
27

Figure 18: Phase shift between driving and driven signal for piezo 1 with OCR=11%
28

Piezo Outcoupler Resonance Frequency [kHz] FWHM [kHz]
1 R=11% 15.6± 0.1 0.62 R=8% 13.0± 0.5 -1 R=22% 13.9± 0.1 0.72 R=17% 13.0± 0.1 0.5
Table 6: Piezo resonance frequencys and width of resonance. The OC R=22%is accidentally glued a little bit o� center to piezo 1.
The OC R=22% was accidentally glued o� center to piezo 1, what mightexplain the decreasing of the resonance frequency compared to the OC R=11%on top. But this also shows, that gluing a OC o� center has just a small e�ecton the resonance frequency.
For piezo 2 the resonance frequency stays the same for both OC's.
6.5.2 Consequences for laser locking
For the piezo to expand and contract, a certain current is needed. This currentdepends on the driving frequency (sinusoidal driving assumed) as follows:
� max current needed/provided by driver (one should do this calculationjust to see if the bandwidth is limited by the maximum current providedby the piezo driver!!)
Part II
Instructions for building the ECDL
This part explains step by step, how to build an external cavity diode laser withan interference �lter as the wavelength selective element. It is assumed that allmechanical parts are already machined and the reader has an idea of how theyshould �t together. Details about the theory behind the laser can be read inPart I
29

7 Schematic of the laser
Figure 19: Optical setup of the laser
8 Needed items
8.1 Drivers & controllers
- Current driver for laser diode (ref: Thorlabs ITC502)
- Temperature controller for laser diode (ref: Thorlabs ITC502)
- Temperature controller for base (ref: Thorlabs TED200C)
- Voltage driver for piezo (ref: Thorlabs MDT694A - Single Axis)
8.2 Mechanical parts
- Base plate
- Cavity main part
- Mounts for �cat's eye� lenses (brass)
- Mount for piezo + out-coupler
30

- Mount for laser diode (copper)
- Copper tube for heat conduction
- Mount for collimation lens
- Mount for SUB-D & BNC connectors
For Pictures see Appendix A
8.3 Optics & electronics
- Collimation lens (ref: Thorlabs C230TME-B)
- Cat eye lens 1 (ref: Thorlabs 52280-B)
- Cat eye lens 2 (ref: Thorlabs 52220-B)
- Laser diode socket (ref: Thorlabs S8060)
- Piezo ring actuator (ref: Piezomechanik HPSt500/10-5/5 length 9mm)
- Peltier for base (ref: Digi-key 102-1682-ND)
- Peltier for laser diode (ref: TeTech CH-41-1.0-0.8)
- Out-coupler (ref: CVI Melles Griot PR1-767-08-0512)
- Heat sink (ref: Digi-key 504222b00000)
- Interference Filter (ref: Research electrooptics)
- Laser diode (ref: Eagleyard EYP-RWE-0790-04000-0750-SOT01-0000 AR-coated)
- 2 thermistors (ref: Newark 30C7947)
8.4 Miscellaneous
- Thermal conductive glue (ref: Loctite 384)
- Thermal grease (ref: )
- BNC connectors with soldering cups
- BNC cables (RG58)
- Acetone & tissues (for cleaning purposes)
- SUB-D15 & SUB-D9 connectors both male & female with soldering cups
- Wires
- Misc screw drivers and hex keys
31

Figure 20: Ultrasonic bath: Water in the outside bowl and acetone in the insidebowl.
- Water level
- Shrink tubes
- Misc nylon washers
9 Cleaning of mechanical parts
After machining, the mechanical parts are often dirty, oily and chips are stickingin small corners and threads. So all parts have to be cleaned before assemblingthe laser:
9.1 Prepare an ultrasonic bath and �ll it with water.
9.2 Put some of the parts into a beaker and �ll it with acetone until everypart is covered. Place the beaker into the water �lled bowl of the bath(see Figure 20) Turn it on and wait for 10-15 minutes.Note: The dirt has the tendency to fall down to the bottom of the beaker,so in order to clean all faces of the parts, turn them around after each runand do the cleaning again (letting them stand diagonal in the beaker mightsafe some runs).
9.3 Dry the parts after cleaning and store them on a clean surface, for examplein aluminum foil.
Do these steps until every part is cleaned.
10 Wiring - Electric Connections
For electronic connection from the laser to the voltage/current supplies and thetemperature controllers the following con�guration is used: On the back of thelaser are two spaces for BNC connectors (laser diode current, piezo voltage) andone for a SUB-D15 connector (for thermal management) (see Figure 10)
32

Figure 21: Back part of the laser
Purpose Designation Pin # Pin #(SUB-D15 f) (SUB-D9 m)
LD - Thermistor (+) 2 2Laser LD - Thermistor (-) Ground 10 3Diode LD - Peltier (+) 1 4
LD - Peltier (-) Ground 9 5
Base - Thermistor (+) 5 2Base Base - Thermistor (-) Ground 13 3
Base - Peltier (+) 4 4Base - Peltier (-) Ground 12 5
Table 7: Pin allocations for thermal management cable
Get some SUB-D9 (female/male) and SUB-D15 (female/male) connectorswith soldering cups on the back ready.
In principle all critical soldering connections, meaning connections that couldpossibly touch each other or that carry high voltage, should be covered withshrink tubes.
10.1 Thermal management wiring
The SUB-D15 connector is used for the thermal management, meaning thepeltiers and thermistors for the base and the laser diode. For the pin allocationsee Table 10.1. Since the peltier and thermistor for the base are connected to adi�erent temperature controller than the ones for the laser diode, you have tosplit the cable into two parts as shown in Figure 10.1.
The double end of this cable gets connected to the delivered cables of thetemperature controllers via the SUB-D9 male connectors. Table 10.1 shows the
33

Figure 22: Cable for thermal management: SUB-D15 female on one side and 2xSUB-D9 male on the other side
Figure 23: BNC to SUB-D9 female
pin allocations of the two SUB-D9 male connectors compared with the ones ofthe SUB-D15 female on the other side of the cable. So make sure the cables gothe right pins! Twist the cables before soldering to reduce noise picked up byelectromagnetic �elds in the lab.
Cover the connectors of your self made cable with SUB-D shells.
10.2 Wiring for laser diode current
Use a BNC cable for the laser diode current due to good shielding, since theemitted frequency of the external cavity diode laser is very sensitive to smallchanges of the laser diode current. For the piezo also use a BNC cable. Theoutput connector of the laser diode current driver is a SUB-D9 male, so one hasto transform it to a BNC type connector by using a SUB-D9 female connector(see 10.1). Solder the connections according to Table 10.3. Also solder a smallwire from Pin #1 to Pin #5 to short circuit the Interlock of the Thorlabs ITC502current driver. (check the Pin # in the instructions manaul if you use anothercurrent driver). Cover it with a shielded SUB-D shell. Glue the BNC connectorto one side of the shell, to avoid stress on the wires.
34

Connector Purpose Designation Pin Pin #BNC SUB-D9
BNC for Laser Current (+) inner 8Current Diode Current (-) Ground shield 3
BNC Piezo red (+) innerblack (-) Ground shield
Table 8: Pin allocations for laser diode current and piezo voltage
10.3 Wiring for the piezo
The piezo gets connected to its voltage supply by a BNC cable. So just installa female BNC connector at the back plate for now.
11 Assembling: out-coupler to piezo
Choose a clean, �at and nicely horizontal surface for the gluing. Get some slowglue ready (e.g. Epage 11, regular epoxy). Don't use 5 minute epoxy, since itdegases more than slow epoxy and degassing could damage the coating on themirror.
11.1 Place the out-coupler mirror (OC) on a few layers of optical paper (or foldone paper a few times without touching the relevant section) and makesure the partial re�ecting coated side points up (see the arrows on the sideof the mirror). Make sure the up pointing side is very clean and blow alldust particles away with the �hand dust blower� since after the gluing it'svery hard to clean this side of the mirror!
11.2 Place the piezo on top of the mirror in the right orientation (the cables ofthe piezo should be near the OC mirror) and center it.
11.3 Place a weight very gently on top of the piezo and check by eye if it isstill centered on the out-coupler (see Figure 24). Choose the weight withregard to not damage the out-coupler or the piezo, but heavy enough tokeep a nice, parallel contact between the two. Make sure your weight putspressure uniformly on the piezo!
11.4 Glue the piezo with 3 glue points to the mirror. Make the glue points verysmall, since the glue expands on the mirror surface while curing and onedoesn't want the glue to expand to the center of your mirror!! In Figure25 on the left the expanded glue can be seen (dark spots). One can seethat one glue point has expanded to the inner circle of the piezo, so in thiscase the limit is reached! Figure 25 on the right shows an better example.Hint 1:Use a thin wire and dip the tip into the glue, then dip it to thepoint you want to set your glue point, until both orthogonal faces areconnected by the glue. This should be a reasonable measure of how much
35

Figure 24: Assembling: Piezo to out-coupler with weight on top
Figure 25: Glue expansion (dark spots): On the left picture the limit is reached!On the right picture glue has been set well dosed.
glue you need for one point.Hint 2:Mix the two components of the glue, but wait for approx. 1 hourbefore setting the 3 glue points. During that hour the glue gets moreviscose. Therefore the glue expands less while curing and it is easier tomake very small glue points.If a di�erent glue is used, do some test runs on a glass sample to see theexpansion properties of the glue in dependence of preparation time beforesetting glue points.
11.5 Check again if everything is centered and let it cure over night.
12 Assembling: piezo+out-coupler to �cat's eye�
mount
After �nishing the gluing in chapter 11 check by eye if everything is nice andparallel and still in good condition. If anything went wrong remove the glue by
36

putting some acetone drops on the glue and try to scratch it away with a spikyitem. Then do chapter 11 again. Sometimes also soapy water is a good solventfor glue.
Also check if the glue has expanded to the inside of the piezo ring. If so,contact an experienced person in your lab to discuss further instructions.
If everything is �ne do the following steps:
12.1 Get the mount for the piezo ready and cleaned (especially the surface thepiezo sits on). Also make sure the mirror is still clean and not damaged.Get a mechanical help construction for gluing ready (see Figure 28).
12.2 First get the wires of the piezo through the hole inside the mount whilekeeping the piezo with the OC on it in your hands. This helps the piezoto keep its position later on since the wires are very springy. Don't touchthe mirror on the faces! Now get the piezo down to it's position. Try toplay around with the wires to make the piezo sit in position by itself.
12.3 Prepare a few layers of optical paper (2 or 3 layers, not to thick!) cut it, sothat it �ts into the mount hole and lay it down on the OC mirror. Placethe mechnanical help construction softly upside down on the OC mirrorand center it. Never touch the mirror directly with the metal, make sureoptical paper is always between the two.
12.4 Turn the whole (help construction+piezo+out-coupler+mount) upside down,while keeping little pressure on the help construction to let it all stick to-gether in its position.
12.5 Now that it's upside down, you can see the back of the piezo from theother side of the mount. Center the mounts hole to the piezo hole andcheck if the stick of the mechanical help construction is also still centeredto the hole of the mount! If everything is centered, glue the piezo fromthe back with 3 small glue points to the mount. (see Figure 26).
12.6 Place a weight on top of the mount, to make sure everything stays nice andparallel! Place it gently to not change the centeredness of your assembling!(see Figure 27) Wait one night to cure.
13 Soldering and testing: peltiers, thermistors
and laser diode socket
Before assembling the whole laser, the peltier and thermistor should be tested,�rst to make sure they work at all, second to �nd out the correct orientation ofthe peltier and third to �nd out if your self made cable works and all solderedconnections are �ne. Therefore proceed as follows:
37
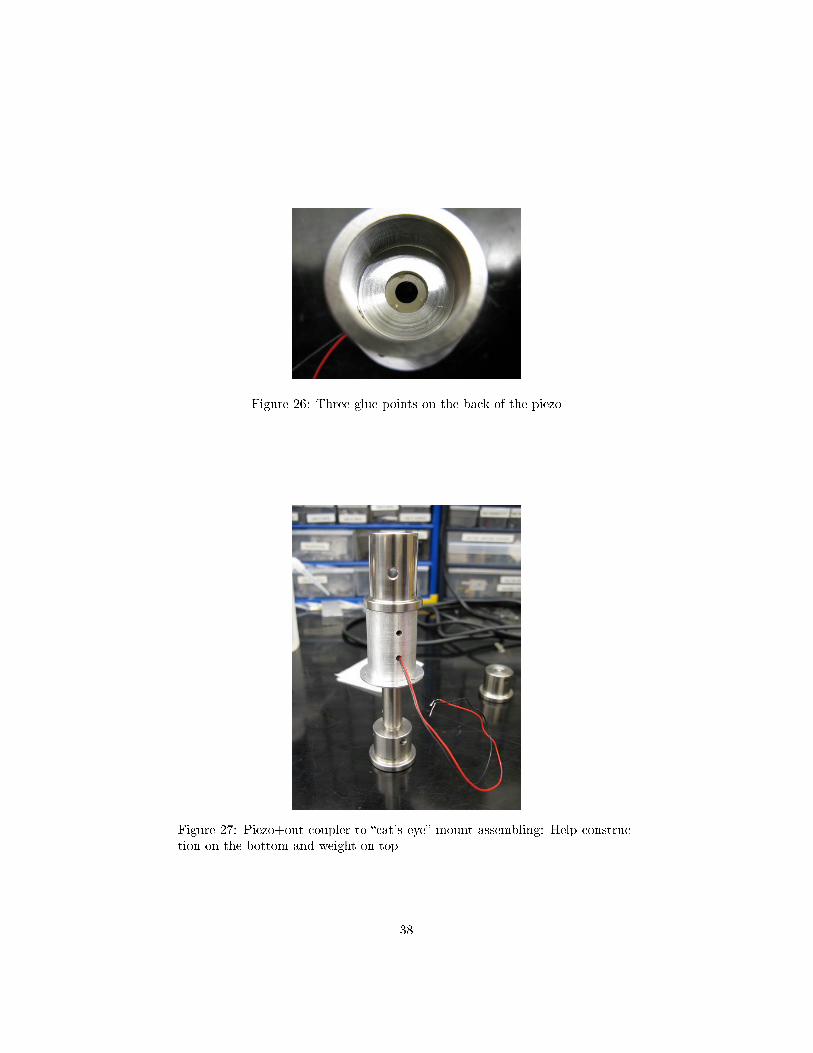
Figure 26: Three glue points on the back of the piezo
Figure 27: Piezo+out-coupler to �cat's eye� mount assembling: Help construc-tion on the bottom and weight on top
38

Figure 28: Mechanical help construction to keep the piezo+out-coupler in posi-tion while gluing
13.1 Soldering
13.1.1 Screw a male SUB-D15 connector with soldering cups to the back plate ofthe laser.
13.1.2 Cut some shrink tubes to a reasonable length and put them over the wiresof the peltier for the base. Solder the peltier to the right pins of the SUB-D15 (see Table 10.1). Check the datasheet for the polarity (should be:red = +, black = - )
13.1.3 Do step 13.1.2 with the peltier for the laser diode.
13.1.4 Since the leads of the thermistors are to short, add a thin piece of wireto each lead. The best way to connect these two is to twist them aroundeach other and solder the connection.
13.1.5 Solder the added wires to the SUB-D15 (both the base & laser diodethermistor). Make sure to put the shrink tubes for every solder joint onthe wires before, but do not heat them up yet.
13.1.6 Take a female BNC connector and solder two small wires to it, one to theshield pin and one to the inner pin. The length should be so, that theycan reach the back of the laser diode which sits on the copper housinglater on, better a few cm longer! Connect these two wires to the laserdiode socket with the con�guration shown in Figure 30. Twist the twowires around each other to avoid noise pickup!
13.2 Testing
Do the testing of the thermal management without any use of thermal greaseor glue!
39

Figure 29: Peltiers and thermistors soldered
Figure 30: View from the back of the laser diode socket
40

13.2.1 Screw the back part of the laser to the base plate and get the peltier forthe base in its position.
13.2.2 Place the cavity main part on top (no need to screw it) and get the ther-mistor for the base in its hole.
13.2.3 Connect your self made cable to the SUB-D15 and the part for the baseto one of the temperature controllers, using the original output cable.
13.2.4 To test if the thermistor works, simply touch it with your hands andwatch if the temperature controller changes the Tact value. To test theorientation of the peltier, set Tset to a value near room temperature, turnthe peltier control on and watch if the temperature converges towards thispoint. If it diverges, turn the peltier around and do the same test again.
13.2.5 Repeat the same procedure with the peltier and thermistor for the laserdiode. If possible do this testing without having the diode glued to thecopper mount, to not damage it.
13.2.6 Test the laser diode socket and its wiring with a simple LED using thecurrent controller.
Twisted pair wiring is at least for the thermistor wires recommended!
14 Assembling: cavity to base plate
Now it's time to get the cavity main part on top of the base plate.
14.1 Cavity, peltier and base plate
14.1 Clean the surfaces the peltier gets pressed to and the surfaces of the peltieras well.
14.2 Cover the down pointing surface of the peltier with heat sink compound/heatconductive paste (for example GC electronics Type Z9 Heat Sink Com-pound) with a very thin layer (use a razor blade or a sharp knife). Pressthe peltier softly and symmetrically from the top into its place on the baseplate. It should stick to the base plate quite tightly, so that lifting thepeltier up again should be hard. If not, do it again and use little moreheat sink compound.
14.3 Cover the second surface of the peltier also with a thin layer of heat sinkcompound and press the cavity main part on top. Use the M4 nylon screwsto tighten it down on the peltier. Don't screw it hard, since peltier surfacescan be cracked easily. Try to apply the force symmetrically by screwingevery nylon screw one by one just a little bit. Use a level to make surethe force is symmetrically and the output beam will be aligned straight.To get a feeling for a reasonable amount of force use a small screw driver
41

Figure 31: Cavity on top of base plate (peltier in between)
and screw without putting pressure on top of the screw driver and waituntil it jumps out of the notch by itself. Then give it a little bit more tillyou feel a resistance.Don't squeeze the wires of the peltier!
14.4 The excess of the compound on the side of the peltier should be minimal!
14.2 Thermistor for base
14.1 Clean the hole for the thermistor and put some heat conductive glue intoit.
14.2 Try to �ll the hole without bubbles, using a sti� thin wire (or solid solder).
14.3 Cover the thermistor with activator and stick it into the hole.
14.4 Give it a few hours to cure.
15 Assembling: laser diode to copper housing
The laser diode gets glued into the copper housing as shown in Figure 32. Whileassembling keep the following rules in mind:
� Never touch the laser diodes face
� Laser diodes are very sensitive to electrostatics. Always wear the handwrist thing to ground yourself!
� Never wear rubber gloves while touching the laser diode, since rubbergloves can carry electrostatics, even if you wear the hand wrist thing.
For the assembling you can twist the pins of the laser diode around eachother to reduce the in�uence of electrostatics. Test carefully if the laser diode�ts into its mount and take it out again.
42

Figure 32: Laser diode glued to copper mount
15.1 Prepare some tape (which sticks well to metal) and cut a small roundpiece out of it with the size, to cover the laser diodes front head. Alsocut a smaller round piece of lens cleaning tissue and put it onto the tapewith the size to fully cover the diodes front face (see Figure 33). Tapeit carefully to the diodes front head, so that the lens tissue part coversthe hole diode face and the tape sits tight at the edges of the head. (seeFigure 34)
15.2 Take some thermal conductive glue (for example Loctite384) and coverthe upper part of the hole in the copper mount with the glue. Don't useto much glue, since to much excess is a mess and could get onto the diodesface!
15.3 Cover the laser diode with the activator and stick it slowly into the hole.Watch the excess and clean eventually before pushing the diode completelyinside. Keep in mind that the orientation of the laser diode determines theorientation of the polarization. The polarization axis is important, becausethe interference �lter has di�erent re�ectivitys for di�erent orientations ofpolarization according to Fresnel's formulas, when it sits on an angle lateron. The electric �eld is polarized in the plane of the small notch on theside. (see Figure 32 for the right orientation)
15.4 Clean the excessed glue from all surfaces and remove the tape from thediodes face.
15.5 Give it one night to cure.
43

Figure 33: Cover for laser diode face (round is better see Figure 34)
Figure 34: Laser diode with face cover
44

16 Assembling: laser diode+copper housing to
cavity
16.1 Preparation: Cat's eye mount to cavity
This assembling will take place on the optical table to avoid electrostatics dam-aging the diode. ALWAYS USE THE HANDWRIST THING!
First glue the copper ring to the heat sink, using thermal conductive glue.Just put a thin layer of glue on one side of the ring, put the activator to theheat sink and glue them together centered. Put a weight on top and let it curea few hours (or better one night).
Then take the mount for the �cat's eye� con�guration and use a tweezer toget the wires of the piezo out of the hole again, because you can't attach it tothe cavity with the leads hanging out. Try not to touch the mirror.Push the part into place and use three M2 screws to screw it tight into position.After that, use the tweezers to get the piezo leads through the hole again. Solderthem to the BNC connector (or better solder some wires to the BNC connectorand then the leads to this wires). Cover all connections with shrink tubes.
16.2 Assembling
To get an overview of how the laser will look like after the following steps seeFigure 35. This might help understanding how the parts �t together. Thisassembling is one of the most di�cult and delicate ones in this instructionsmanual.
16.2.1 First clean the surfaces the peltier gets attached to and the peltier's itself.
16.2.2 Make sure you have tested the orientation of the peltier!
16.2.3 Now put thermal grease on the face of peltier which gets attached to thelaser diode copper housing. Make a very thin layer, using a razor blade,similar to step 14.1.2. Try to avoid thermal grease spreading into theregion between the two peltier surfaces. If you want to, you can try tocover this part with tape, but you should remove it before assembling!
16.2.4 Also cover the surface of the copper ring with a thin layer of thermalgrease. Get the copper ring in place and stick the socket through the hole,without the copper rings surface touching anything!
16.2.5 Untwist the laser diode pins and cut them to a reasonable length accordingto the size of the socket.
16.2.6 Push the peltier to the copper housing in its place and make sure thesurface contact is nice (maybe take it o� again just to see how much ofthe surface has had contact). The contact should be good if the peltiersticks to the housing and it's hard to get it o� again. Next connect thesocket to laser diode pins.
45
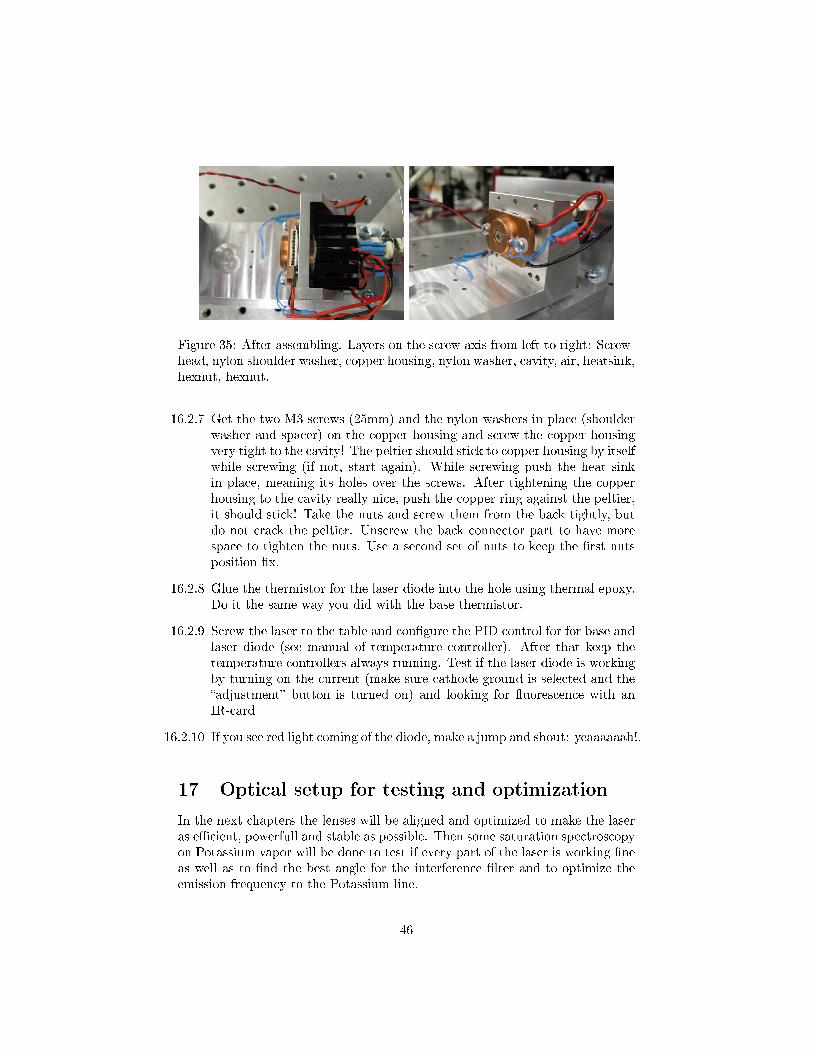
Figure 35: After assembling. Layers on the screw axis from left to right: Screw-head, nylon shoulder washer, copper housing, nylon washer, cavity, air, heatsink,hexnut, hexnut.
16.2.7 Get the two M3 screws (25mm) and the nylon washers in place (shoulderwasher and spacer) on the copper housing and screw the copper housingvery tight to the cavity! The peltier should stick to copper housing by itselfwhile screwing (if not, start again). While screwing push the heat sinkin place, meaning its holes over the screws. After tightening the copperhousing to the cavity really nice, push the copper ring against the peltier,it should stick! Take the nuts and screw them from the back tightly, butdo not crack the peltier. Unscrew the back connector part to have morespace to tighten the nuts. Use a second set of nuts to keep the �rst nutsposition �x.
16.2.8 Glue the thermistor for the laser diode into the hole using thermal epoxy.Do it the same way you did with the base thermistor.
16.2.9 Screw the laser to the table and con�gure the PID control for for base andlaser diode (see manual of temperature controller). After that keep thetemperature controllers always running. Test if the laser diode is workingby turning on the current (make sure cathode ground is selected and the�adjustment� button is turned on) and looking for �uorescence with anIR-card
16.2.10 If you see red light coming of the diode, make a jump and shout: yeaaaaaah!.
17 Optical setup for testing and optimization
In the next chapters the lenses will be aligned and optimized to make the laseras e�cient, powerfull and stable as possible. Then some saturation spectroscopyon Potassium vapor will be done to test if every part of the laser is working �neas well as to �nd the best angle for the interference �lter and to optimize theemission frequency to the Potassium line.
46

All these steps can be done with the optical setup shown in Figure 36 with-out changing, moving or realigning components. There may be hundreds ofother setups to perform the optimization but this uses a minimum of opticalcomponents and it's very easy to set it up, but feel free to create an own setup;)
It might be convenient to align the setup as recently as going through thefollowing sections, just because a collimated beam is needed to align it.
Figure 36: Optical setup for optimization
18 Collimation lens
The light coming out of the laser diode is divergent and needs to be collimated.Always turn the laser o�, while changing or adding parts to the cavity. Assemblethe collimation lens as follows:
18.1 Wrap some te�on tape around the thread of the lens to have a betteradjustability due to more screwing resistance (see Figure 37 ). Screw thelens into the round brass mount and push the brass mount into the holein the aluminum mount.
18.2 Get the aluminum mount over the diode copper housing and use 4 M3screws (25mm) and metal washers to attach it to the cavity. You mayhave to cut one edge of the washers �at for the lower ones in order tomake them �t.
47

18.3 The fact that the holes for the screws are bigger than the screws themselvesgives you a certain freedom in x-y-alignment for the collimation lens. Youde�netely need this freedom, because you want to align the beam, comingfrom the collimation lens, nicely through the middle of the piezo ring.Is the aligning freedom not enough, modify the aluminum mount in themachine shop.
18.4 Turn the laser diode current on to a value of ca 100mA. Try to coarselyalign the aluminum collimation lens mount, that the beam is going throughthe piezo and tighten the screws.
18.5 Now push/pull the movable round brass mount to coarsely collimate thebeam. Keep in mind, the bigger the observation distance, the easier it isto collimate the beam.Bring the brass mount to a position, that the beam is slightly not colli-mated in a way that you can correct it by screwing the lens a tiny bitout. Glue the brass mount in this position with 3 glue points of 5 minuteepoxy.
18.6 Then collimate the beam nicely by using the screwing degree of freedom ofthe lens. If the beam has astigmatism, collimate it just in the horizontaldirection. After some alignment you may feel that the screwing resistancegets less and less, so change the te�on tape once you have the feeling it'sto sensitive to align the lens.
18.7 Rise the laser diode current up to 150mA so that you can see the edges ofthe elliptic beam pro�le on the edges of the piezo ring. Losen the screws ofthe mount a bit and try to center the beam as nice as possible to the centerof the piezo by symmetrisizing the re�ections on the edges. Thighten thescrews and keep in mind that the beam moves slightly while tighteningthem.
18.8 Once again test if the beam is nicely collimated. If not collimate it andcheck if the beam is still centered to the piezos center.
19 �Cat's eye� lenses
19.1 Preparation
In this section you don't need the vapor cell, so take it out.Put the two �cat's eye� lenses into their mounts. If they don't �t, use some
very �ne sand paper to make the hole for the lens slightly bigger. Make sureto also press the sand paper against the outer wall deep inside the hole whilerubbing it , to take o� material homogeneously! Get the lens in place above thehole. If it doesn't fall in by itself, lay down some layers of optical paper on thelens and try to push it softly with your �nger. Once it's in, make sure by eyeit has gone all the way to the bottom of the mount. Then use 3 glue points of
48

Figure 37: Te�on tape around collimation lens thread
slow glue on the side of the lens (less degassing and therefore less damaging ofthe coating of the lenses) to �x its position in the mount.
19.2 Observing the threshold
The goal in this subsection is to actually modulate the current around the laserthreshold and make the threshold visible on the osci. The reason is, that thethreshold current is a measure for the quality of your external cavity feedback,the better your feedback is the lower the threshold. Therefore you can optimizethe lens positions by minimizing the threshold current.
Turn the laser o� and screw the lenses into the �cat's eye� mount. Turn thecurrent on again to 50-100mA and align the distances between the lenses andthe out-coupler coarsely, use the second lens to collimate the out coming beam.
Now set the laser diode current to a value around 40mA and modulate thelaser diode current with a triangle signal of 1V peak to peak and 10-100Hz usinga function generator. Simply connect the output of the function generator to themodulation input on the current driver and the sync output to the oscilloscope.Also connect the photodiode to the oscilloscope.
So try to get a signal similar to the one shown in Figure 2. By changingthe laser diode current (o�set) you can move the position of the �ellbow� in thecurve.
To measure the actual threshold, just change the current o�set, so that theellbow is in the middle of the modulation period (think about what you see onthe picture and �nd out where the middle of the modulation period is) and turno� the modulation. The value of the laser diode current shown on the drivernow is the threshold current!
19.3 Optimizing the lens positions
By turning the �rst cat's eye lens you can probably see the threshold movingtowards smaller oder bigger values. Try to optimize the lens positions by min-
49

Figure 38: Threshold observation
imizing the threshold current. You basically have two degrees of freedom, theposition of the lens in the cat's eye and the collimation lens rigth after the laserdiode. Use the following steps to optimize both positions (�nding a minimumin a 2D search space)*:
19.3.1 Minimize the threshold by turning the �rst lens.
19.3.2 Slightly change the position of the collimation lens (the one right after thediode) by screwing it in.
19.3.3 Re-optimize the threshold current by turning the cats eye lens. Sometimesthe laser beam moves when you are turning the lenses and you couldtherefore lose the signal on the photodiode. Try to compensate this beammovement by realigning the mirrors to always have the full picture asshown in Figure 2
19.3.4 There are two possible cases now:1. the threshold current is bigger than before2. the threshold current is smaller than beforeIf case 1 is observed, do steps 19.3.5, 19.3.6 and 19.3.7.If case 2 is observed, iterate the steps 19.3.2 and 19.3.3 until the thresh-old currents gets bigger again and get the collimation lens back into theposition of the lowest threshold. Now the feedback of the external cavityis optimized. You can also try to maybe �nd an even smaller minimumby screwing the collimation lens more and more out again (speaking goinginto the other direction), but its not very likely to �nd more than oneminimum. Go on with step 19.3.8
19.3.5 Screw the collimation lens slightly out.
19.3.6 Re-optimize the threshold current by turning the cats eye lens.
19.3.7 Iterate steps 19.3.5 and 19.3.6 until the threshold current gets bigger.Then get the collimation lens back to the position where the minimum
50

Figure 39: Assembling of the interference �lter to the barrel
has been observed and re-optimize the cats eye lens. Now the feedback isoptimized!
*At the end I just collimated the beam with the �rst collimation lens (and noother lens in the laser) very nicely in the horizontal axis and then put the cat'seye lens and the outer collimation lens in and optimize only the cat's eye lens.
The reason is, that the FWHM of the interference �lter gets e�ectively broad-ened when the beam is not nicely collimated inside the cavity.
Second reason is, that the threshold doesn't change signi�cantly change whenyou change the collimation lens. In other words, the maximum in the 2D searchspace is very �at in the direction of �beam collimation�.
20 Interference �lter
The interference �lter is the wavelength selective element in the laser.Assemble it according to the following steps:
20.1 Use tweezers to place the �lter into the notch in the barrel.
20.2 Fix the �lters position with an helping construction as shown in Figure39. Make sure it is nicely aligned vertically without an angle.
20.3 Take slow glue (low degasing) to glue the �lter with two very small gluepoints on the side to the barrel.
20.4 Let it cure one night.
20.5 Wrap some te�on tape near the bottom around the barrel. This makesthe angle alignment easier, due to more resistance, once the �lter is sittingin the round notch in the cavity main part.
51

21 Saturation spectroscopy
Get the interference �lter into the notch in the cavity and bring the laser diodecurrent to 50-100mA. This should be enough to observe the saturation spec-troscopy signal.
21.1 Finding the Potassium line - Fluorescence
21.1.1 Filter angle - centering the transmission maximum
With the angle of the interference �lter one can coarsely tune the wavelength.The following steps can be very hard, since you may need a very good feeling inyou �ngers. Make sure the te�on tape provides enough turning resistance, to beable to rotate the �lter barrel by very small angles. With too much resistancethe barrel �jumps� from angle to angle, what's also bad.
Rotate the �lter and watch the wavelength changing on the wavemeter. Thegoal frequency for the potassium line is ca 391015GHz. Try to rotate the �l-ter, so that the 391015GHz is in the middle between the two mode jumps ofthe internal cavity. Since the free spectral range of the interal cavity is about40GHz, mode jumps should occur at 391035GHz and at 390995GHz. Simplyvary the temperature on the laser diode to �nd these mode jumps. Now the�lter transmission maximum should be centered right at the potassium line.
After adding the interference �lter to the cavity, the threshold current getsless. But usually you can optimize the threshold slightly again. Just modulatethe current around the threshold again and turn the cat's eye lens to optimizeit.
The idea with the symmetric mode jumps holds for centering the �lter trans-mission maximum to any frequency.
21.1.2 Fluorescence
Now that the frequency is coarsely aligned, the next step uses the laser diodetemperature or the laser diode current to do some �ner tuning.
Watch the vapor cell with an infrared camera and tune the frequency aroundthe 391015GHz using the current and/or the temperature till you can see �u-orescence on the IR camera. The �uorescence should occure right where thebeam is going through the cell. Write down all settings!
21.2 Observing saturation spectroscopy signal
Modulate the piezo voltage with a frequency of 50-200Hz and an amplitude ofapproximately 10V peak to peak (10Vpp should be on the piezo, think aboutgain of modulation input of the driver!) sinusoidally or triangular.
Connect the sync output of the function generator to the osci and triggerthe photodiode signal to it. Use AC coupling for the photodiode signal. Nowone should see a drop in intensity on the AC photodiode signal at some pointof the modulation period and little peaks next to it (see Figure 40). If not, use
52

Figure 40: Saturation spectroscopy signal, with a heated K cell (ca 50°C)
the piezo voltage o�set knob to scan �left� and �right� of the spectrum for it.Once it has been found, center it in the spectrum and have fun identi�ing thelittle peaks you see ;)
To improve the visibility of the peaks in the saturation spectroscopy signal,you can heat up the vapor cell to 40°C or 50°C.
Using the saturation spectroscopy signal, one can play around with di�erentparameters (laser diode current, piezo voltage, temperature) to get a feeling forthe mode hop and wavelength tuning behaviour of the laser.
21.3 Optimizing external and internal cavity modes
22 What to improve
� 3 screws for copper item instead of 2 could improve vibration stability ofthe diode copper housing, even if it is not clear if this is an issue... justfor safety. This would also reduce the possibilty of a tilting of the dioderelative to the optical axis.
� Better adjustability for the collimation lens in z direction, using a screw-able brass mount, instead of a movable.
� Better adjustability for the collimation lens in x-y-directions, without loos-ing the rigidity of the mount in z direction, relative to the laser diode! I'mnot sure yet how to do that. It is not mandatory, more a nice to have butit would de�nitely improve the hole design and adjustability.
� (More safety in apertures, maybe a piezo with thinner walls, but aperturesmake it more likely to be in TEM00)
� Make sure a very good job in the machine shop is done, setting importantscrew holes and dimensions which de�ne the optical axis!!
53
� The assembling of the heat sink, copper housing etc (section 16) is verytough!! Easier screwing of the hex nuts would be nice.
� Heat sink vertical.
� Adapt the cavity main part hole to the shape of the peltier and adapt thecopper cylinder for heat conduction to that shape.
� Use thinner wires for thermistors and especially laser diode, to reducein�uence of cable movement to cavity.
� (Hole for the piezo wires in the cat's eye mount slightly bigger & set it ata nice position)
� Use rubber pad for vibration damping and foam inside the setup when thecover is on, to reduce soundwave resonator e�ects.
� Filter @ 767nm
23 Costs for one laser
54

Item
Company&Partnumber
Description
Price
collimationlens
ThorlabsC230TME-B
f=4.51mm,NA=0.55
$87,00
lensL1
Thorlabs352280-B
f=18.4,NA=0.15
$75,00
lensL2
Thorlabs352220-B
f=11.0,NA=0.26
$84,00
laserdiodesocket
ThorlabsS8060
for9mm
diode
$4,21
voltagesupportPiezo
ThorlabsMDT694A-SingleAxis
150Voutput,sm
allsignalbwdth
10kHz(noload)
$712,00
current&temperaturcontrolLD
ThorlabsITC502
I=200mA,TEC16W
$1.860,00
temperature
controlbase
ThorlabsTED200C
12W
$968,00
piezo
ring
Piezomechanik
HPSt500/10-5/59mm
OD10mm,ID
5mm,L=9mm,0-500V,stroke7µm
$342,00
peltier
forbase
Digi-key102-1682-ND
40mm
x40mm,50W
$16,10
peltier
forlaserdiode
TE-Tec
CH-41-1.0-0.8
22.5mm
x17.5mm,ID
=9.5mm
(hole)
$26,40
out-couplermirror
CVIMellesGriotPR1-767-8-0512
R=8%,DIA=0.500",Thickness=
0.125",767nm
$205,00
thermistor
New
ark
41K9376
10kOhm,isolatedleads,twoneeded
$1,60
heatsink
Digi-key504222b00000
thermalResistance@75°@natural:6.4°C/W
$0,61
laserdiode
EYP-RWE-0790-04000-0750-SOT01-0000
Eagleyard,ARcoated,λc≈770nm
$604,55
mechanicalparts
Machineshop
seelabbookfordrawings,appendix
forphotos
≈$2000
interference
�lter
Researchelectrooptics
λcenter,
0°
=781nm
(better767nm),FWHM
0.3nm
unknow
nnylonshoulder
washer
Seastrom
5607-225
twoneeded
$3,00
nylonwasher
Seastrom
5610-10-93
twoneeded
$2,00
miscwires
andconnectors
Digikey
SUB-D15&SUB-D9connectors,shells,wires
.$30
screws
inventory
M4nylon,M5,M325mm,M2,
glues
inventory
5min
epoxy,slow
glue,thermalconductiveglue
te�ontape,thermalgrease
inventory
te�ontape,thermalgrease
Overallprice(w
ithoutIF,discountforThorlabsproducts
notappliedyet)
≈$7000
with15%
Thorlabsdiscount
≈$6500
Tutionfortheeducation:$50000,Buyingalltheparts:$7000,seeingitwork
forthe�rsttime:
priceless
;)
Table9:Listofneeded
item
sforonelaserincludingpricesandoverallprice
tobuildonelaser
55

References
[Clairon]
[Rasel]
[1]
A Photos of Mechanical Parts
Figure 41: Copper housing for the laser diode; the thermistor hole should betterbe set on a small angle!
Figure 42: Mount for collimation lens mount
56

Figure 43: �cat's eye� mount
Figure 44: Base plate
57

Figure 45: Laser cover
58

Figure 46: Cavity main part
Figure 47: Back part for electronic connections
59

Figure 48: Mounts for the collimation lens (middle) and the two �cat's eye�lenses
Figure 49: Heat sink
B Beam pro�le pictures
60

Figure 50: Laser 1 beam pro�le, 60cm distance
Figure 51: Laser 2 beam pro�le, 30cm distance
61

Figure 52: Laser 3 beam pro�le, 30cm distance
Figure 53: Laser 3 beam pro�le, 110cm distance
62

Figure 54: Laser 4 beam pro�le, left 13cm
Figure 55: Laser 4 beam pro�le, 125cm distance
63


