1 Introduction In recent years, mobile phones and other mobile com- munication services have expanded their roles in society more and more. Due to the convenience and advanced functions of mobile phones, there are studies for using these for disaster prevention, damage reduction, safety countermeasures, etc. But due to problems such as the vulnerability of terrestrial communication systems in disas- ters, their use is limited. Satellite communication systems are not easily affected by disasters, etc. So their use is es- sential when terrestrial base stations fail, to ensure reliable communications for rescue and checking safety status anywhere, including in mountain areas and on the sea, and also for countermeasures for residents in mobile phone dead zones, and for use on ships navigating near a coast, mountain climbers in mountain areas, etc. NICT is study- ing a mobile communication system that seamlessly inte- grates the same frequency band for terrestrial systems and a satellite system, called a “Satellite-Terrestrial Integrated mobile Communication System (STICS).” [1] To achieve this system, as a technical issue, one needs to aim to achieve a system that maximizes total communication throughput by controlling resources such as the satellite system’s frequency, transmitting power, and antenna beam, while avoiding interference between the terrestrial and satellite systems, in accordance with wide area traffic distribution and changes. is is being done with the aim of establishing device and algorithm infrastructure technologies that are essential to achieve this [2][3] . On the other hand, to build technologies for terrestrial and satellite frequency sharing, it is important to assess the amount of interference on the satellite system from the terrestrial communication systems that are sharing the same frequencies. As part of the assessment of the terres- trial communication system’s interference with the satellite system, in addition to assessment by simulator and ter- restrial reception power measurements that were done until then, we also conducted experiments measuring power from the air using an airplane [4] . e experiments were done above urban areas, and also above the sea and low population density areas. is paper gives a general expla- nation of these experiments, and describes the results ob- tained in the experiments. 2 STICS frequency sharing technology and interference between systems Frequency sharing technology for using the same fre- quency band is essential infrastructure technology. For example, if we consider a Mobile Satellite Service (MSS) uplink at 1980 to 2010 MHz, we can assume two types of frequency sharing systems: In a frequency concurrent use system in which the terrestrial system and satellite system share the frequency band, the terrestrial system and satel- lite system can each use the entire band, resulting in high efficiency frequency use, but interference between the terrestrial system and satellite system creates a requirement for advanced interference avoidance technology. On the other hand, in a frequency separation system, the terrestrial system and satellite system have separated frequency bands, so frequency use efficiency is low, but interference Interference Power Measurement of Mobile Terminals and Base Stations using an Aircraft Hiroyuki TSUJI, Amane MIURA, Yoshiyuki FUJINO, and Naokazu HAMAMOTO The interference from terrestrial base stations or mobile terminals to the satellite system is one of the important parameters for realization of STICS, in which terrestrial mobile and satellite communication systems coexist and which is seamlessly integrated in the same frequency band. We have conducted several experiments to measure the radiation powers of the existing mobile base stations and mobile terminals toward satellites using aircrafts as part of the interference evaluation. This paper gives the overview of the experiment and some of the results which were obtained over urban, the ocean and in low populated areas. 29 2 Satellite/Terrestrial Cooperation Control Technologies
Transcript
1 Introduction
In recent years, mobile phones and other mobile com-munication services have expanded their roles in society more and more. Due to the convenience and advanced functions of mobile phones, there are studies for using these for disaster prevention, damage reduction, safety countermeasures, etc. But due to problems such as the vulnerability of terrestrial communication systems in disas-ters, their use is limited. Satellite communication systems are not easily affected by disasters, etc. So their use is es-sential when terrestrial base stations fail, to ensure reliable communications for rescue and checking safety status anywhere, including in mountain areas and on the sea, and also for countermeasures for residents in mobile phone dead zones, and for use on ships navigating near a coast, mountain climbers in mountain areas, etc. NICT is study-ing a mobile communication system that seamlessly inte-grates the same frequency band for terrestrial systems and a satellite system, called a “Satellite-Terrestrial Integrated mobile Communication System (STICS).”[1] To achieve this system, as a technical issue, one needs to aim to achieve a system that maximizes total communication throughput by controlling resources such as the satellite system’s frequency, transmitting power, and antenna beam, while avoiding interference between the terrestrial and satellite systems, in accordance with wide area traffic distribution and changes. This is being done with the aim of establishing device and algorithm infrastructure technologies that are essential to achieve this[2][3].
On the other hand, to build technologies for terrestrial
and satellite frequency sharing, it is important to assess the amount of interference on the satellite system from the terrestrial communication systems that are sharing the same frequencies. As part of the assessment of the terres-trial communication system’s interference with the satellite system, in addition to assessment by simulator and ter-restrial reception power measurements that were done until then, we also conducted experiments measuring power from the air using an airplane[4]. The experiments were done above urban areas, and also above the sea and low population density areas. This paper gives a general expla-nation of these experiments, and describes the results ob-tained in the experiments.
2 STICS frequency sharing technology and interference between systems
Frequency sharing technology for using the same fre-quency band is essential infrastructure technology. For example, if we consider a Mobile Satellite Service (MSS) uplink at 1980 to 2010 MHz, we can assume two types of frequency sharing systems: In a frequency concurrent use system in which the terrestrial system and satellite system share the frequency band, the terrestrial system and satel-lite system can each use the entire band, resulting in high efficiency frequency use, but interference between the terrestrial system and satellite system creates a requirement for advanced interference avoidance technology. On the other hand, in a frequency separation system, the terrestrial system and satellite system have separated frequency bands, so frequency use efficiency is low, but interference
Interference Power Measurement of Mobile Terminals and Base Stations using an Aircraft
Hiroyuki TSUJI, Amane MIURA, Yoshiyuki FUJINO, and Naokazu HAMAMOTO
The interference from terrestrial base stations or mobile terminals to the satellite system is one of the important parameters for realization of STICS, in which terrestrial mobile and satellite communication systems coexist and which is seamlessly integrated in the same frequency band. We have conducted several experiments to measure the radiation powers of the existing mobile base stations and mobile terminals toward satellites using aircrafts as part of the interference evaluation. This paper gives the overview of the experiment and some of the results which were obtained over urban, the ocean and in low populated areas.
2 Satellite/Terrestrial Cooperation Control Technologies
avoidance technology is not needed. Also, two types of frequency duplex methods can be considered for each frequency sharing system: Fig. 1 shows a normal method in which the terrestrial system and satellite system have up/down links that are each the same, and Fig. 2 shows a reverse method in which the terrestrial system and satellite system have up/down links that are reversed. As for fre-quency concurrent use systems, the normal method and reverse method have different interference routes, as shown in Figs. 1 and 2.
In the normal method of a frequency concurrent use system, with the huge number of terrestrial terminals, the total amount of transmission power can create large inter-ference on the satellite system. In the reverse method of the same system, base station downlink interference on the satellite system becomes a problem. Until now, several
statistical data have been published on terrestrial terminals’ transmission power characteristics, but detailed data re-garding type, time, place, etc. of voice and data communi-cation services has not been published nor surveyed. Also, there are far fewer mobile base stations than terminals, but the base stations have large output, and there are no cases in which their radiation in the direction of satellites has been studied.
3 Interference measurement from air
3.1 Interference measurement by airplaneAs described above, the goal of this experiment is to
assess the amount of interference on satellites by the downlinks of mobile terminal base stations and uplinks from mobile terminals. It is ideal to measure the amount of interference directly from the geostationary satellite orbit, but this is difficult in practice. Therefore, one can use an airplane, etc. to measure part of the service area of a satellite cell determined by one imagined spot beam of STICS, and thereby measure the interference amount.
Figure 3 shows an outline of this experiment’s measure-ment method. We mounted a directional antenna (a horn antenna for this experiment) on the airplane, and from the
Fig.F 1 Interference paths in the frequency concurrent use and normal system
2 Satellite/Terrestrial Cooperation Control Technologies
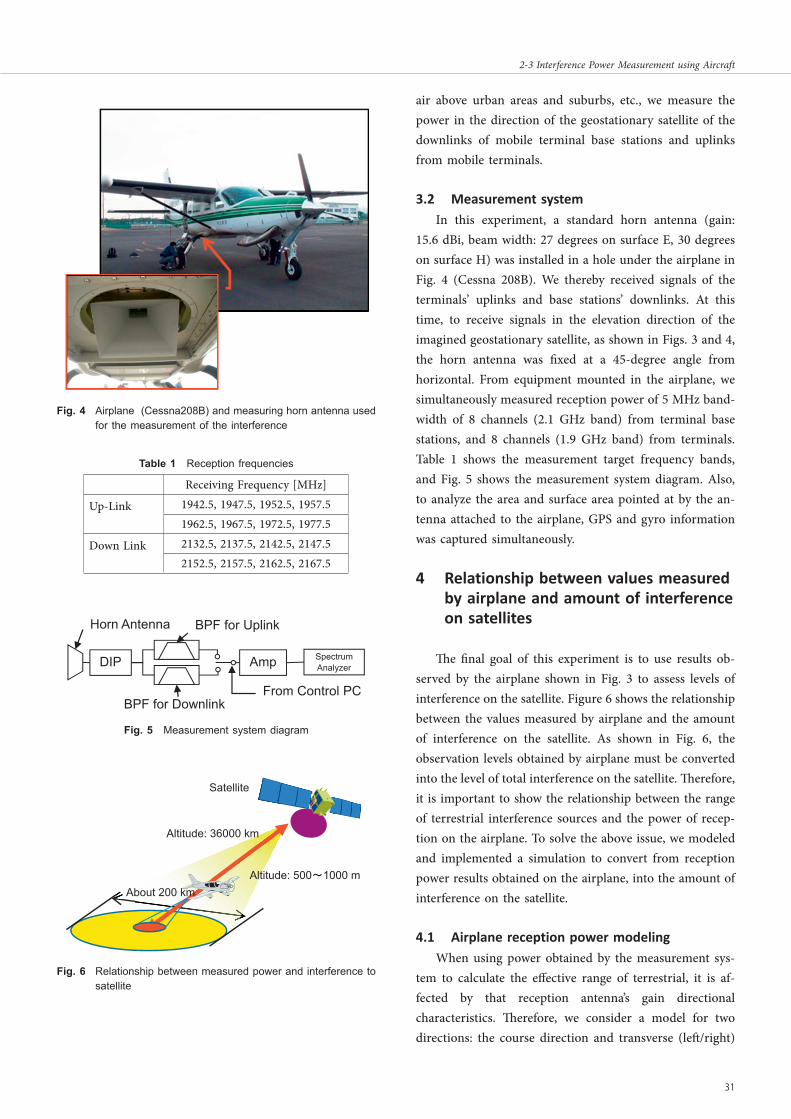
air above urban areas and suburbs, etc., we measure the power in the direction of the geostationary satellite of the downlinks of mobile terminal base stations and uplinks from mobile terminals.
3.2 Measurement systemIn this experiment, a standard horn antenna (gain:
15.6 dBi, beam width: 27 degrees on surface E, 30 degrees on surface H) was installed in a hole under the airplane in Fig. 4 (Cessna 208B). We thereby received signals of the terminals’ uplinks and base stations’ downlinks. At this time, to receive signals in the elevation direction of the imagined geostationary satellite, as shown in Figs. 3 and 4, the horn antenna was fixed at a 45-degree angle from horizontal. From equipment mounted in the airplane, we simultaneously measured reception power of 5 MHz band-width of 8 channels (2.1 GHz band) from terminal base stations, and 8 channels (1.9 GHz band) from terminals. Table 1 shows the measurement target frequency bands, and Fig. 5 shows the measurement system diagram. Also, to analyze the area and surface area pointed at by the an-tenna attached to the airplane, GPS and gyro information was captured simultaneously.
4 Relationship between values measured by airplane and amount of interference on satellites
The final goal of this experiment is to use results ob-served by the airplane shown in Fig. 3 to assess levels of interference on the satellite. Figure 6 shows the relationship between the values measured by airplane and the amount of interference on the satellite. As shown in Fig. 6, the observation levels obtained by airplane must be converted into the level of total interference on the satellite. Therefore, it is important to show the relationship between the range of terrestrial interference sources and the power of recep-tion on the airplane. To solve the above issue, we modeled and implemented a simulation to convert from reception power results obtained on the airplane, into the amount of interference on the satellite.
4.1 Airplane reception power modelingWhen using power obtained by the measurement sys-
tem to calculate the effective range of terrestrial, it is af-fected by that reception antenna’s gain directional characteristics. Therefore, we consider a model for two directions: the course direction and transverse (left/right)
Fig.F 5 Measurement system diagram
5
Amp Spectrum Analyzer DIP
Horn Antenna
From Control PC
BPF for Uplink
BPF for Downlink
Fig.F 4 Airplane (Cessna208B) and measuring horn antenna used for the measurement of the interference
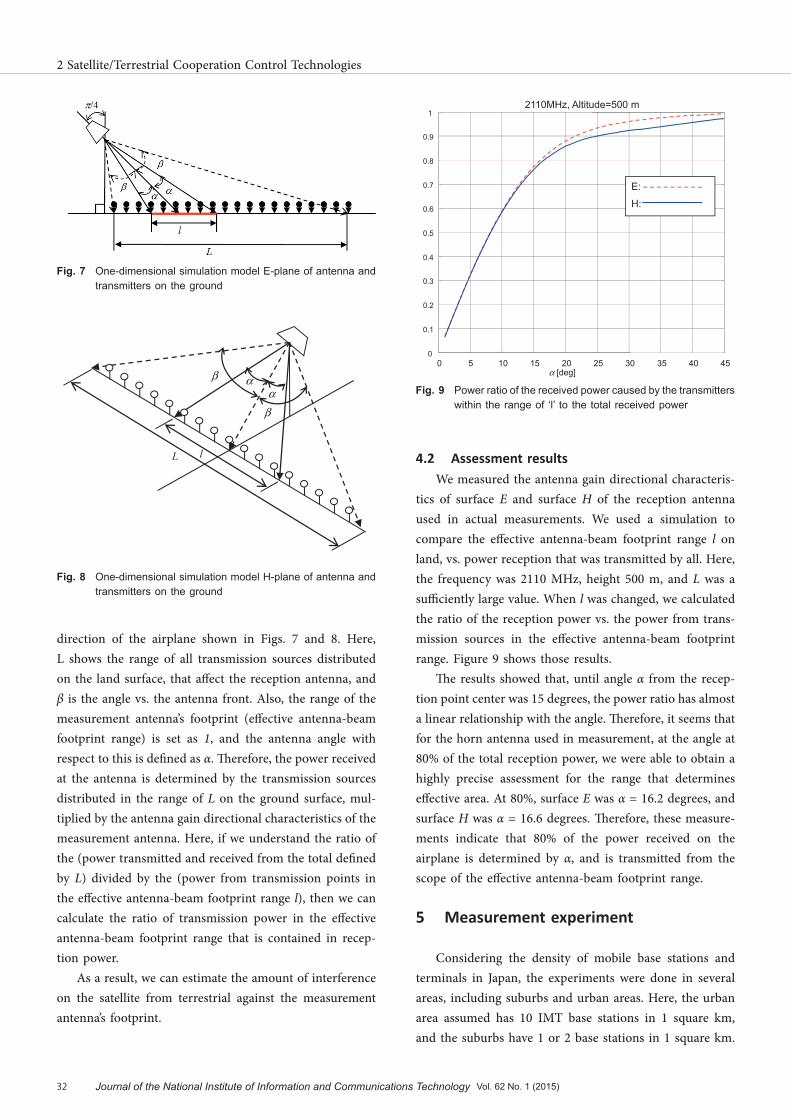
direction of the airplane shown in Figs. 7 and 8. Here, L shows the range of all transmission sources distributed on the land surface, that affect the reception antenna, and β is the angle vs. the antenna front. Also, the range of the measurement antenna’s footprint (effective antenna-beam footprint range) is set as 1, and the antenna angle with respect to this is defined as α. Therefore, the power received at the antenna is determined by the transmission sources distributed in the range of L on the ground surface, mul-tiplied by the antenna gain directional characteristics of the measurement antenna. Here, if we understand the ratio of the (power transmitted and received from the total defined by L) divided by the (power from transmission points in the effective antenna-beam footprint range l), then we can calculate the ratio of transmission power in the effective antenna-beam footprint range that is contained in recep-tion power.
As a result, we can estimate the amount of interference on the satellite from terrestrial against the measurement antenna’s footprint.
4.2 Assessment resultsWe measured the antenna gain directional characteris-
tics of surface E and surface H of the reception antenna used in actual measurements. We used a simulation to compare the effective antenna-beam footprint range l on land, vs. power reception that was transmitted by all. Here, the frequency was 2110 MHz, height 500 m, and L was a sufficiently large value. When l was changed, we calculated the ratio of the reception power vs. the power from trans-mission sources in the effective antenna-beam footprint range. Figure 9 shows those results.
The results showed that, until angle α from the recep-tion point center was 15 degrees, the power ratio has almost a linear relationship with the angle. Therefore, it seems that for the horn antenna used in measurement, at the angle at 80% of the total reception power, we were able to obtain a highly precise assessment for the range that determines effective area. At 80%, surface E was α = 16.2 degrees, and surface H was α = 16.6 degrees. Therefore, these measure-ments indicate that 80% of the power received on the airplane is determined by α, and is transmitted from the scope of the effective antenna-beam footprint range.
5 Measurement experiment
Considering the density of mobile base stations and terminals in Japan, the experiments were done in several areas, including suburbs and urban areas. Here, the urban area assumed has 10 IMT base stations in 1 square km, and the suburbs have 1 or 2 base stations in 1 square km.
Fig.F 9 Power ratio of the received power caused by the transmitters within the range of ‘l’ to the total received power
10
0 5 10 15 20 25 30 35 40 45 0
0.1
0.2
0.3
0.4
0.5
0.6
0.7
0.8
0.9
1
α [deg]
2110MHz, Altitude=500 m
E:
H:
Fig.F 7 One-dimensional simulation model E-plane of antenna and transmitters on the ground
8
Fig.F 8 One-dimensional simulation model H-plane of antenna and transmitters on the ground
9
α α
β
β
l L
32 Journal of the National Institute of Information and Communications Technology Vol. 62 No. 1 (2015)
2 Satellite/Terrestrial Cooperation Control Technologies
The measurement experiments were done by the steps below.
(i) With the aim of obtaining data in the air over the ocean, we took measurements above the Pacific Ocean near Choshi City.
(ii) With the aim of obtaining data in long intervals, we took measurements round trip between Chofu Airport and Nagoya.
(iii)With the aim of obtaining data from low population density areas, we took measurements from Nagoya, along the Kumano Sea, to Shionomisaki.
5.1 Measurement results in air above urban areas and the sea
First, we obtained data in the air above the ocean, to correct for the horn antenna’s direction and distance char-acteristics, and to correct the data measured at urban areas. Figure 10 shows a map of one of the routes that gave measurement results: After takeoff from Chofu Airport, we flew over Shibuya, then flew from the North Kanto Plain to Southern Kasumigaura, then along the Tonegawa River until we reached Choshi and the sea near Choshi, then returned to the Choshi Cape, then flew over Chiba. Figure 11 shows the reception power obtained then. Point a and point b are above Shibuya, while from point c to
point d, and from point f to point g are regions with rela-tively low population density for the Kanto Plain. From point d to point f gives measurement values above the sea. And point e is the turnaround point.
Above the Kanto Plain, we found that the reception strength from mobile terminal uplinks is about 25 to 30 dB lower than mobile base station downlinks. We also found that for downlinks from mobile phone base stations, recep-tion strength in suburbs is about 15 dB lower than over urban areas.
The next example is Fig. 12, which shows observations over the sea near Choshi: We maintained an altitude of about 600 m, and setting Choshi Cape as the starting point (0 m), it shows round trip reception power. As an overall trend, we see that the return path (when flying from turnaround point e towards point f) tends to be about 10 dB lower than during the outbound path. This could be because of directionality, as the horn antenna is attached facing towards the rear of the aircraft. On the outbound path, there is only about 5 dB attenuation per distance until 40 km, but after it passed 40 km, attenuation was nearly inversely proportional to the square of the distance. And on the return path, about 5 dB attenuation was seen until the same 40 km, but after it passed 40 km, attenuation was a little less than inversely proportional to the square of the distance. However, compared to the outbound route, the amount of change in the level was large, so we conjecture that the power addition of the noise caused such characteristics.
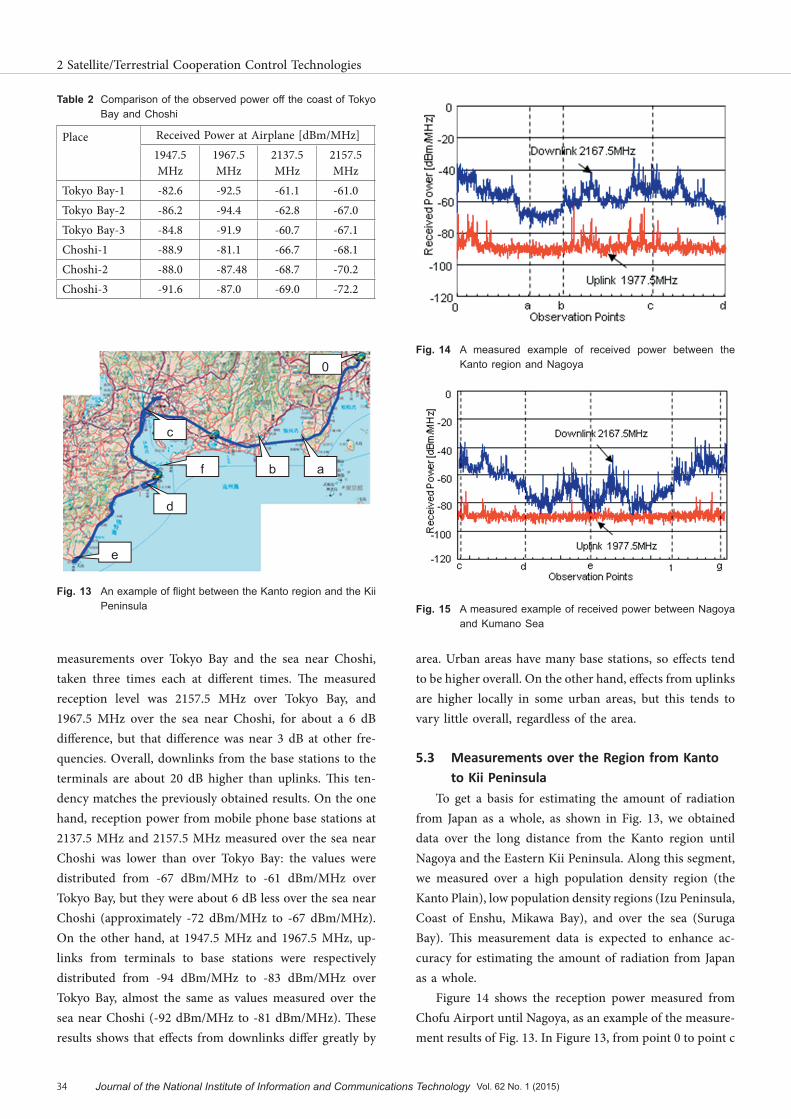
5.2 Comparison with measurement results at Tokyo Bay
Table 2 summarizes a comparison vs. the measurement results above Tokyo Bay. This table shows the results from
Fig.F 10 An example of flight route off the coast of Choshi
11
e
c d
fa 0 b
g
Fig.F 11 A measured example of received power between Chofu and off the coast of Choshi
12
0 b c d e gObservation Points
Down Link: 2167.5MHz
Up Link: 1977.5MHz
a f
0
-100
-80
-60
-40
-20
Received P
ower [dB
m/M
Hz]
Fig.F 12 A measured example of received power between Choshi cape and the turn-around point
measurements over Tokyo Bay and the sea near Choshi, taken three times each at different times. The measured reception level was 2157.5 MHz over Tokyo Bay, and 1967.5 MHz over the sea near Choshi, for about a 6 dB difference, but that difference was near 3 dB at other fre-quencies. Overall, downlinks from the base stations to the terminals are about 20 dB higher than uplinks. This ten-dency matches the previously obtained results. On the one hand, reception power from mobile phone base stations at 2137.5 MHz and 2157.5 MHz measured over the sea near Choshi was lower than over Tokyo Bay: the values were distributed from -67 dBm/MHz to -61 dBm/MHz over Tokyo Bay, but they were about 6 dB less over the sea near Choshi (approximately -72 dBm/MHz to -67 dBm/MHz). On the other hand, at 1947.5 MHz and 1967.5 MHz, up-links from terminals to base stations were respectively distributed from -94 dBm/MHz to -83 dBm/MHz over Tokyo Bay, almost the same as values measured over the sea near Choshi (-92 dBm/MHz to -81 dBm/MHz). These results shows that effects from downlinks differ greatly by
area. Urban areas have many base stations, so effects tend to be higher overall. On the other hand, effects from uplinks are higher locally in some urban areas, but this tends to vary little overall, regardless of the area.
5.3 Measurements over the Region from Kanto to Kii Peninsula
To get a basis for estimating the amount of radiation from Japan as a whole, as shown in Fig. 13, we obtained data over the long distance from the Kanto region until Nagoya and the Eastern Kii Peninsula. Along this segment, we measured over a high population density region (the Kanto Plain), low population density regions (Izu Peninsula, Coast of Enshu, Mikawa Bay), and over the sea (Suruga Bay). This measurement data is expected to enhance ac-curacy for estimating the amount of radiation from Japan as a whole.
Figure 14 shows the reception power measured from Chofu Airport until Nagoya, as an example of the measure-ment results of Fig. 13. In Figure 13, from point 0 to point c 16
Fig.F 14 A measured example of received power between the Kanto region and Nagoya
17
Fig.F 15 A measured example of received power between Nagoya and Kumano Sea
Fig.F 13 An example of flight between the Kanto region and the Kii Peninsula
15
e
c
d
f a
0
b
Place Received Power at Airplane [dBm/MHz]1947.5MHz
2 Satellite/Terrestrial Cooperation Control Technologies
shows where measurement data was obtained during a long distance flight.
Here also, similar to measurement results previously obtained, mobile base station uplink reception strength was found to be about 25 dB to 30 dB less than for mobile base station downlinks.
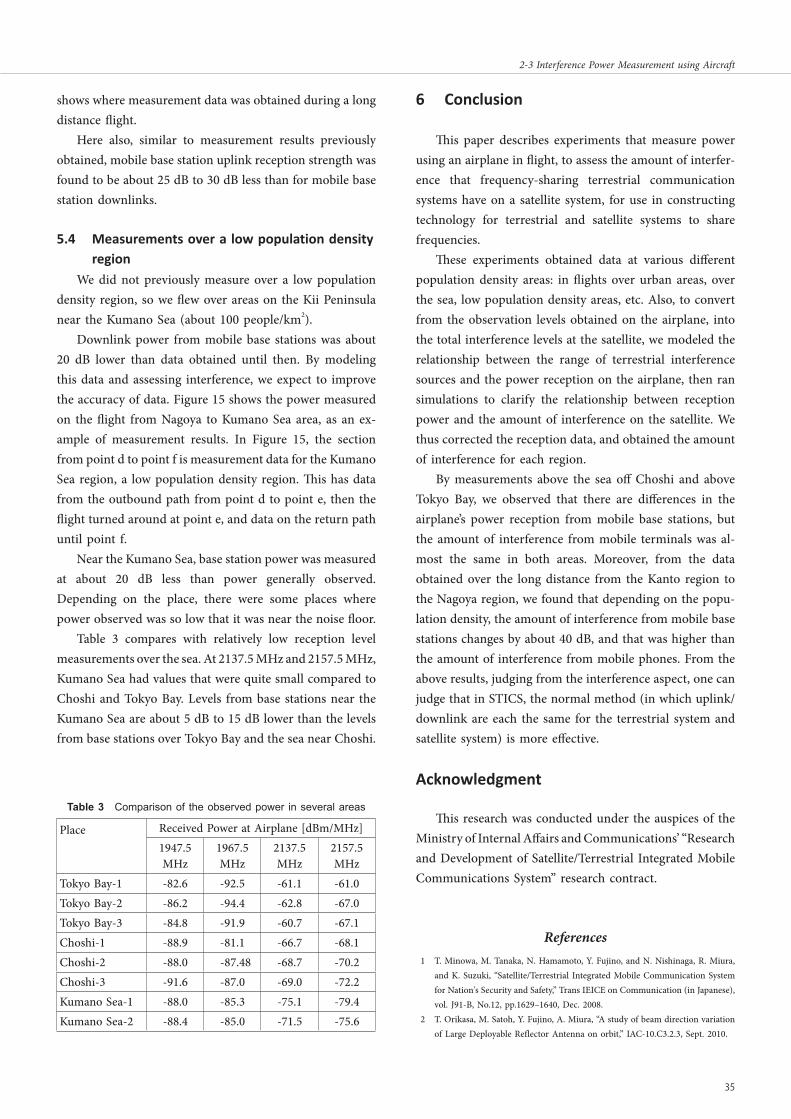
5.4 Measurements over a low population density region
We did not previously measure over a low population density region, so we flew over areas on the Kii Peninsula near the Kumano Sea (about 100 people/km2).
Downlink power from mobile base stations was about 20 dB lower than data obtained until then. By modeling this data and assessing interference, we expect to improve the accuracy of data. Figure 15 shows the power measured on the flight from Nagoya to Kumano Sea area, as an ex-ample of measurement results. In Figure 15, the section from point d to point f is measurement data for the Kumano Sea region, a low population density region. This has data from the outbound path from point d to point e, then the flight turned around at point e, and data on the return path until point f.
Near the Kumano Sea, base station power was measured at about 20 dB less than power generally observed. Depending on the place, there were some places where power observed was so low that it was near the noise floor.
Table 3 compares with relatively low reception level measurements over the sea. At 2137.5 MHz and 2157.5 MHz, Kumano Sea had values that were quite small compared to Choshi and Tokyo Bay. Levels from base stations near the Kumano Sea are about 5 dB to 15 dB lower than the levels from base stations over Tokyo Bay and the sea near Choshi.
6 Conclusion
This paper describes experiments that measure power using an airplane in flight, to assess the amount of interfer-ence that frequency-sharing terrestrial communication systems have on a satellite system, for use in constructing technology for terrestrial and satellite systems to share frequencies.
These experiments obtained data at various different population density areas: in flights over urban areas, over the sea, low population density areas, etc. Also, to convert from the observation levels obtained on the airplane, into the total interference levels at the satellite, we modeled the relationship between the range of terrestrial interference sources and the power reception on the airplane, then ran simulations to clarify the relationship between reception power and the amount of interference on the satellite. We thus corrected the reception data, and obtained the amount of interference for each region.
By measurements above the sea off Choshi and above Tokyo Bay, we observed that there are differences in the airplane’s power reception from mobile base stations, but the amount of interference from mobile terminals was al-most the same in both areas. Moreover, from the data obtained over the long distance from the Kanto region to the Nagoya region, we found that depending on the popu-lation density, the amount of interference from mobile base stations changes by about 40 dB, and that was higher than the amount of interference from mobile phones. From the above results, judging from the interference aspect, one can judge that in STICS, the normal method (in which uplink/downlink are each the same for the terrestrial system and satellite system) is more effective.
Acknowledgment
This research was conducted under the auspices of the Ministry of Internal Affairs and Communications’ “Research and Development of Satellite/Terrestrial Integrated Mobile Communications System” research contract.
References 1 T. Minowa, M. Tanaka, N. Hamamoto, Y. Fujino, and N. Nishinaga, R. Miura,
and K. Suzuki, “Satellite/Terrestrial Integrated Mobile Communication System for Nation's Security and Safety,” Trans IEICE on Communication (in Japanese), vol. J91-B, No.12, pp.1629–1640, Dec. 2008.
2 T. Orikasa, M. Satoh, Y. Fujino, A. Miura, “A study of beam direction variation of Large Deployable Reflector Antenna on orbit,” IAC-10.C3.2.3, Sept. 2010.
Place Received Power at Airplane [dBm/MHz]1947.5MHz
3 Y. Fujino, T. Minowa, N. Hamamoto, H. Tsuji, and R. Suzuki, “Research and Development plan for Satellite/Terrestrial Integrated mobile Communication System,” AIAA International Communications Satellite Systems Conference, 1.2.4, AIAA, Edinburgh, June 2009.
4 H. Tsuji, Y. Fujino, N. Hamamoto, and R. Suzuki, “Interference Measurement Experiment of Mobile Base Station Downlinks Using an Aircraft in Satellite-Terrestrial Integrated Mobile Communication systems,” Proc. 2009 International Symposium on Antennas and Propagation (ISAP 2009), Bangkok, Thailand, Oct. 2009.
Hiroyuki TSUJI, Ph.D.Senior Researcher, Space Communication Systems LaboratoryWireless Network Research InstituteAircraft/Unmanned Aircraft Wireless Communication Systems, Millimeter-wave Broadband Mobile Communication Systems
Amane MIURA, Ph.D.Senior Researcher, Space Communication Systems Laboratory, Wireless Network Research InstituteSatellite Communications, Antenna
Yoshiyuki FUJINO, Dr. Eng.Professor, Department of Electrical and Electronic Engineering, Faculty of Science and Engineering, Toyo University/Former: Senior Researcher, Space Communication Systems Laboratory, Wireless Network Research Institute (–April 2013)Satellite Communication, Antenna, Wireless Power Transmission
Naokazu HAMAMOTOChief Engineer, Spacecraft Systems Department, Japan Manned Space Systems Corporation/Former: Research Manager, Project Promotion Office, New Generation Wireless Communications Research Center (April 2006–March 2012)Satellite Communications
36 Journal of the National Institute of Information and Communications Technology Vol. 62 No. 1 (2015)