INTERFEROMETRY OF THE COSMIC MICROWAVE BACKGROUND RAFAEL REBOLO 1,2 and the VSA consortium 1,3,4 1 Instituto de Astrof´ ısica de Canarias, E-38200 La Laguna, Tenerife, SPAIN 2 Consejo Superior de Investigaciones Cient´ ıficas, SPAIN 3 Astrophysics Group, Cavendish Laboratory, University of Cambridge, Madingley R oad, CB3 OHE, UK 4 Jodrell Bank Observatory, University of Manchester, Macclesfield, Cheshire, SK 11 9DL, UK Abstract: We describe the Very Small Array (VSA) and review the recent results on the angular power spectrum of the Cosmic Microwave Background (CMB) obtained in the Ka-band (ν ≈ 33 GHz) with this instrument. This array has covered an ℓ- range of 150 to 1500 with a relatively high resolution in ℓ compared to previous measurements at ℓ ≥ 1000; this is achieved by using mosaiced observations in 7 regions covering a total of approximately 82 sq. degrees. Our resolution of Δℓ ≈ 60 between ℓ = 300 and ℓ = 1500 allows the first 3 acoustic peaks to be identified. Contamination by extragalactic radiosources brighter than 20 mJy has been taken into account by simultaneously monitoring identified sources with a high resolution interferometer. In addition, it has been performed a statistical correction for the small residual contribution from weaker sources that are below this flux limit. There is good agreement between the VSA power spectrum and that obtained by WMAP and other higher resolution experiments like ACBAR and CBI. We have set constraints on cosmological parameters using VSA data and combi- nations with other CMB data and external priors. Within the flat ΛCDM model, the combined VSA+WMAP data without external priors gives Ω b h 2 =0.0234 +0.0012 −0.0014 , Ω dm h 2 =0.111 +0.014 −0.016 , h =0.73 +0.09 −0.05 , n S =0.97 +0.06 −0.03 , 10 10 A S = 23 +7 −3 and τ =0.14 +0.14 −0.07 . We also find evidence for a running spectral index of density fluctuations, n run = −0.069 ± 0.032 at a level of more than 95% confidence. However, inclusion of prior information from the 2dF galaxy redshift survey reduces the significance of the result. When a general cosmological model with 12 parameters is considered we find consis- tency with other analyses available in the literature. The evidence for n run < 0 is only marginal within this model. The fraction of dark matter in neutrinos is constrained to f ν < 0.087 (95% confidence limit) which implies that m ν < 0.32 eV if all the three neutrino species have the same mass. 1
Transcript
INTERFEROMETRY OF THE COSMIC
MICROWAVE BACKGROUND
RAFAEL REBOLO 1,2 and the VSA consortium1,3,4
1 Instituto de Astrofısica de Canarias, E-38200 La Laguna, Tenerife, SPAIN
2 Consejo Superior de Investigaciones Cientıficas, SPAIN
3 Astrophysics Group, Cavendish Laboratory, University of Cambridge, Madingley R
oad, CB3 OHE, UK
4 Jodrell Bank Observatory, University of Manchester, Macclesfield, Cheshire, SK
11 9DL, UK
Abstract: We describe the Very Small Array (VSA) and review the recent resultson the angular power spectrum of the Cosmic Microwave Background (CMB) obtainedin the Ka-band (ν ≈ 33 GHz) with this instrument. This array has covered an ℓ-range of 150 to 1500 with a relatively high resolution in ℓ compared to previousmeasurements at ℓ ≥ 1000; this is achieved by using mosaiced observations in 7regions covering a total of approximately 82 sq. degrees. Our resolution of ∆ℓ ≈ 60between ℓ = 300 and ℓ = 1500 allows the first 3 acoustic peaks to be identified.Contamination by extragalactic radiosources brighter than 20 mJy has been takeninto account by simultaneously monitoring identified sources with a high resolutioninterferometer. In addition, it has been performed a statistical correction for thesmall residual contribution from weaker sources that are below this flux limit. Thereis good agreement between the VSA power spectrum and that obtained by WMAPand other higher resolution experiments like ACBAR and CBI.
We have set constraints on cosmological parameters using VSA data and combi-nations with other CMB data and external priors. Within the flat ΛCDM model,the combined VSA+WMAP data without external priors gives Ωbh
2 = 0.0234+0.0012−0.0014,
Ωdmh2 = 0.111+0.014−0.016, h = 0.73+0.09
−0.05, nS = 0.97+0.06−0.03, 1010AS = 23+7
−3 and τ = 0.14+0.14−0.07.
We also find evidence for a running spectral index of density fluctuations, nrun =−0.069 ± 0.032 at a level of more than 95% confidence. However, inclusion of priorinformation from the 2dF galaxy redshift survey reduces the significance of the result.When a general cosmological model with 12 parameters is considered we find consis-tency with other analyses available in the literature. The evidence for nrun < 0 is onlymarginal within this model. The fraction of dark matter in neutrinos is constrainedto fν < 0.087 (95% confidence limit) which implies that mν < 0.32 eV if all the threeneutrino species have the same mass.
1
Rafael Rebolo et al. Interferometry of the Cosmic Microwave Background
1 Introduction
The CMB is a relic of the primitive Universe observed today as a largely isotropic ra-diation with Planckian spectral energy distribution of temperature T0=2.726±0.004K (95 % C.L.) [1]. It carries the imprint of the primordial density fluctuations thatoriginated the large scale structure of the Universe providing extremely valuable in-formation on the physical conditions of the very hot and dense early Universe. Peaksin the CMB angular power spectrum are a consequence of the evolution of pressurewaves in the primordial plasma before the recombination epoch [2, 3]. These peaksprovide information about the primordial density fluctuations, geometry, matter andradiation content and ionization history of the Universe. Their amplitudes and posi-tions are sensitive to many of the most important cosmological parameters.
Following the detection of large angular scale fluctuations in the CMB temper-ature distribution by the Differential Microwave Radiometer on board the CosmicBackground Explorer (COBE) satellite [4], a major effort has been devoted to mea-sure the angular power spectrum of primordial anisotropies. Several experiments haveconsistently detected acoustic peaks in the power spectrum in the ℓ-range 100− 1000[5, 6, 7, 8, 9, 10] and a fall-off in power at high-ℓ from the damping tail [11, 12, 13].The Wilkinson Microwave Anisotropy Probe, henceforth WMAP , has provided thehighest sensitivity measurements [14, 15] over the ℓ-range 2−700. The resulting powerspectrum is cosmic variance limited up to ℓ = 350 and delineates the first 2 peaks (atℓ ∼ 220 and 550) with excellent signal-to-noise. These recent CMB measurementshave brought impressive detailed cosmological information on a wide range of param-eters [16], but WMAP is limited in angular resolution and hence has not measuredthe power spectrum above ℓ ∼ 800 with good signal-to-noise. Additional observationsat high angular resolution (angular scales and multipoles are related according to theexpression θ ∼ 120
ℓ) are still required to break some of the degeneracies inherent in
the CMB power spectrum. Here, we review the recent measurements obtained byVSA out to a multipole of ℓ = 1500 [17] and discuss their cosmological implications.
2 Interferometry and basic CMB formalism
The temperature fluctuations of the CMB on the sky ∆TT0
(~n) ≡ T (~n)−T0
T0are usually
expressed in terms of an expansion into spherical harmonics
∆T
T0(~n) =
∞∑
ℓ=1
ℓ∑
m=−ℓ
aℓmYℓm(~n) (1)
where ~n is a unity vector that indicates the line of sight. Most of the models predictthe temperature field to be gaussian. In that case, the statistical properties are
2
Rafael Rebolo et al. Interferometry of the Cosmic Microwave Background
completely characterized by the angular correlation function: the expectation valueof the product of temperatures at pairs of points separated by an angle θ
C(θ) =
⟨
∆T
T0
(~n1)∆T
T0
(~n2)
⟩
=∑
ℓ
(2ℓ + 1)
4πCℓPℓ(cos θ) (2)
where cos θ = ~n1 · ~n2, and Pℓ is the Legendre polynomial of order ℓ.The angular power spectrum is defined as the set of Cℓ that verify:
< aℓma∗
ℓ′m′ >= Cℓδℓℓ′δmm′ (3)
where ∗ indicates the conjugate.Experiments measure the aℓm corresponding to the last scattering surface seen
from our position in the Universe. However, the ergodicity property of gaussian fields,allow to determine the angular power spectrum by averaging over the last scatteringsurface:
< |aℓm|2 >≈
∑
m |aℓm|2
2ℓ + 1(4)
The power at each ℓ is (2ℓ + 1)Cℓ/4π. The observing strategy and resolution of eachinstrument limit the range of angular scales which can be measured as described bythe window function [20]:
Wℓ(~n1, ~n2) ≡∫
d~m1
∫
d~m2A(~n1, ~m1)A(~n2, ~m2)Pℓ(~m1 · ~m2) (5)
where A(~n1, ~m1) is the instrument response function to signals coming from direction~n1 when pointing towards direction ~m1. The particular case Wℓ(~n1, ~n1) is frequentlyreferred as window function. The variance of the observed temperature field, orcorrelation at zero lag (θ = 0), results
< (∆T
T0
)2 >=∑
ℓ
(2ℓ + 1)
4πCℓWℓ (6)
where the window function is denoted as Wℓ.An interferometer provides a direct measurement of the Fourier transform of the
intensity distribution on the sky and hence, a determination of the Cℓ. For a baselined , the interferometer is sensitive to CMB structure with multipole ℓ = 2πd/λ, whereλ is the wavelength of observations. The instantaneous field of view is determinedby the primary beam of the antennas. Comprehensive descriptions of the analysistechniques involved in interferometric observations can be found in the literature (seee.g. [18]). Interferometers with different number of dishes/horns, bandwiths, size ofprimary beam and approximate multipole range have been used in the search for CMB
3
Rafael Rebolo et al. Interferometry of the Cosmic Microwave Background
anisotropies from various locations [19]. These instruments are rather insensitive toatmospheric distorsion of the microwave signals (see e.g. [21, 22]).
In the early 90s, the Jodrell Bank-IAC 33 GHz interferometer, a pioneer two-element instrument installed at Teide Observatory clearly demonstrated the feasibilityof high-sensitivity interferometric measurements of the CMB anisotropy from this site.This precursor of VSA measured CMB fluctuations with amplitude ∆Tℓ = 43±13µKand 63 ± 7µK at ℓ = 109 and 208, respectively [23, 24]. A new generation of CMBinterferometers has started operation very recently: the Cosmic Background Imager(CBI, [25]) in the Atacama desert, the Degree Angular Scale Interferometer (DASI,[8]) in Antartic and the Very Small Array (VSA, [26]) in Tenerife have achieved verysensitive measurements of the angular power spectrum in the range 200 ≤ ℓ ≤ 4000.
3 The VSA
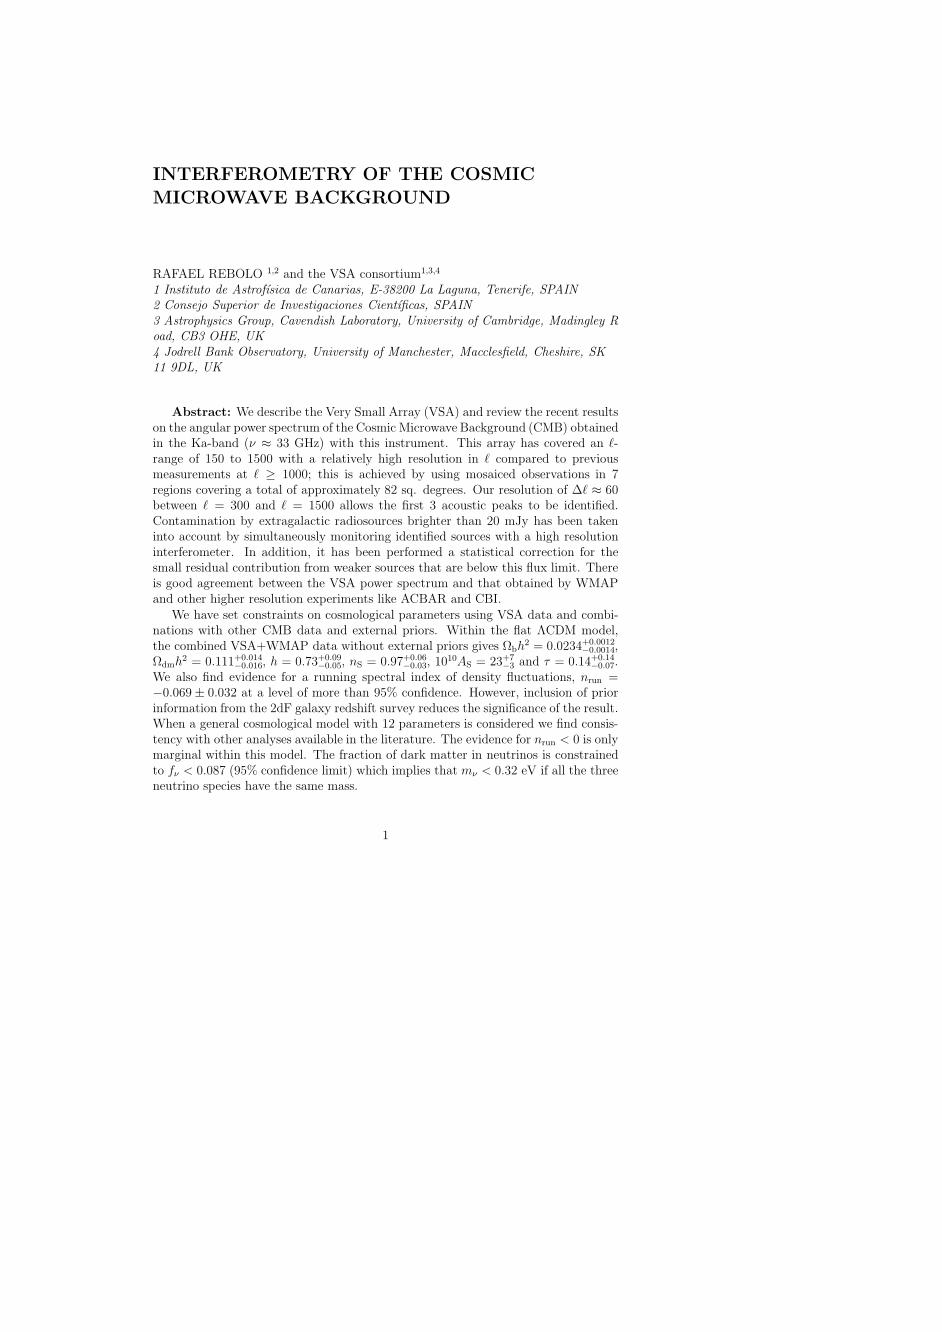
The VSA is a purpose-built 14-element radio interferometer (see Figure 1) that hasmeasured the CMB angular power spectrum between ℓ = 150 and 900 in a compactarray configuration [10] and more recently up to ℓ = 1400 in an extended arrayconfiguration [12]. It is located at Teide Observatory (Tenerife) at an altitude of2340 m. It can operate in the Ka-band (26 − 36 GHz), however, to minimize thecontribution of foregrounds to the signal recorded it was decided to operate with abandwidth of 1.5 GHz at the higher end of the band (∼ 33 GHz). Each antennaconsists of a conical corrugated horn feeding a paraboloidal mirror and is placed on a4-m×3-m tip-tilt table surrounded by a metal enclosure to supress as much as possibleground emission. The VSA can observe any sky region between declination −5 and+60. It has been used in two major modes: in the compact configuration, the mirrorswere 143-mm in diameter giving a primary beam of 4.6 FWHM; in the extended one,the 322-mm diameter apertures allow longer baselines and therefore higher resolutionsto be obtained, with a primary beam of 2 FWHM. This configuration has a totalof 91 baselines with lengths ranging from 0.6 m to 2.5 m, although the maximumpossible baseline length, set by the size of the main tip-tilt table, is ∼ 4 m. Thesynthesized beam of a typical VSA field has FWHM ∼ 11 arcmin over the primarybeam.
Combining all 91 baselines the VSA point source sensitivity is ∼ 6 Jy s1/2. Thiscorresponds to a temperature sensitivity, over a synthesized beam area (Ωsynth ≈1× 10⁻⁵ sr) of ∼ 15 mK s1/2. The exact value depends on the beam area and on theu, v coverage which in turns depends on the declination and the flagging/filtering ofthe visibility data.
An important feature of the VSA is the ability to subtract radio sources whichcontaminate CMB data with a dedicated facility. Combined with map-making capa-bilities, this makes the VSA ideal for making precise CMB measurements, particularly
4
Rafael Rebolo et al. Interferometry of the Cosmic Microwave Background
Figure 1: The VSA at Teide Observatory.
at higher ℓ-values.
4 Observations
The observations with the compact configuration [27] and the initial three regionsobserved in the extended configuration [12] are already published. During the period2001-July 2003 VSA conducted observations of 33 additional pointings with the ex-tended configuration. These pointings conform three 7-field mosaics and four 3-fieldmosaics giving a total area coverage of 82 sq. degrees. The new observations extendthe initial regions with a further 4 pointings per region and incorporate a further 4new regions each with 3 pointings. This corresponds to a factor of ∼ 4 in the amountof extended array data and a significant increase in sensitivity over the previous re-sults. Furthermore, the increase in sky-coverage and mosaicing in each field allows animprovement in ℓ-resolution, or reduced bin-bin correlations, using mosaicing tech-niques. The total effective integration time is ≈ 6000 hours (250 days) after filteringand flagging of the data. About ∼ 30 per cent of data was flagged.
The fields were chosen to avoid as much as possible contamination from Galacticand extragalactic emission. High Galactic latitude (|b| ≥ 27) fields with low emissionas predicted from maps of synchrotron, free-free and dust emission were chosen tominimize Galactic contamination. Fields with bright galaxy clusters were excludedbased on existing catalogues [28, 29]. Similarly, fields with bright radio sources (≥500 mJy) in the NVSS 1.4 GHz survey [30] and GB6 survey at 4.85 GHz [31] werediscarded. Avoiding galaxy clusters is important due to the potential for Sunyaev-Zeldovich Effect (SZE) decrements to contaminate VSA data.
5
Rafael Rebolo et al. Interferometry of the Cosmic Microwave Background
5 Data reduction and calibration
The VSA data reduction and calibration procedures are described for the compactand extended configuration in several papers [27, 12]. In [17] full details are givenabout the reduction of the new extended data. Fourier filtering is used to remove themajority of local undesired signals. The filtering removes typically 10 − 20 per centof the data. The same fringe-rate filtering technique is also applied to the Sun andMoon. Data are filtered if the Sun and Moon are within 27 and 18 respectively,while if the Sun or Moon are within 9 of the field centre then the entire observationis flagged. No residual Sun or Moon contamination was detected after stacking thedata typically integrated over 50− 100 days. The data are then further smoothed bya factor of 4 to give 64 sec samples and a correction is applied for the atmosphericcontribution to the system noise.
Noise figures vary significantly between baselines, so the final step for each ob-servation is the re-weighting of the data based on the r.m.s. noise of each baseline.This is essential to achieve the optimum overall noise level. The data are then stackedtogether either in hour angle or in the u, v plane. The final data for each field contains∼ 106 visibilities, each of 64 sec integration, which are used directly to make maps.For power spectrum estimation, the data are binned in the u, v plane to reduce thenumber of data points. Each visibility has an associated weight calculated by thereduction pipeline.
The first important step in the calibration of the VSA data is to obtain a precisegeometric description of the instrument, i.e. to know the positions for each hornewith a precission better than 1/10 the wavelength of observation. This also requiresthe calculation of corrections for amplitudes, phases and the observing frequency. Amaximum-likelihood method [32] is used to solve simultaneously all these parameters.Typically, data from an intense radiosource (like Tau-A) are collected for this purpose.The results are checked via observations of other bright radio sources. Amplitude andphase corrections are usually calculated from a single calibrator for each of the 91baselines. An unresolved, non-variable bright radio source allows the measured fringesto be corrected for amplitude and phase.
The absolute flux calibration of VSA is made using observations of Jupiter. Inthe first years of observations we assumed for this planet a brightness temperatureTJup = 152±5 K (3 per cent accuracy in temperature) at 32 GHz [33]. However, datafrom WMAP gives a more precise determination of the brightness temperature forJupiter of TJup = 146.6± 2.0 K at 33.0 GHz [34] corresponding to an accuracy of 1.5per cent in temperature terms, or equivalently 3 per cent in the CMB power spectrum(∆T 2). We have adopted this WMAP temperature for Jupiter in the calibration ofthe new extended array data, and consistently scaled our earlier measurements of thepower spectrum.
A number of data checks are systematically applied to the data (stacking data in
6
Rafael Rebolo et al. Interferometry of the Cosmic Microwave Background
various ways, splitting in different subsets, non-Gaussian tests to search for residualsystematics, etc.), but more importantly, a parallel independent reduction for themajority of the data is performed by the three institutions in the VSA collaboration.The comparison of this independent data reduction showed good agreement for bothmaps and power spectrum measurements.
6 Foregrounds
Radiosources in the fields observed by VSA are first surveyed with the Ryle Telescopeat 15 GHz to a limiting flux density of ∼ 10 mJy [35]. Then these sources are followedwith the Source Subtractor (SS), a two-element interferometer located next to theVSA main array operating at the same frequency. It consists of two 3.7 m disheswith a baseline of 9 m providing a resolution of ∼ 3 arcmin. The observations areconducted simultaneously with VSA, so each source is observed many times duringthe period of time dedicated to each VSA field. The SS data are calibrated using theflux of the planetary nebula NGC7027, assuming a flux density of (5.45 ± 0.20) Jyat 32.0 GHz and a flat spectral index α = 0.1 ± 0.1 [33]. The SS flux densities ofthe sources in the VSA fields are subtracted from the visibility data down to a levelof 20 mJy (∼ 8 µK over the synthesized beam area. The complete source survey ispresented by [70]. These source counts are also used to re-scale the 30 GHz differentialsource count model [36] and to make an estimate of the contribution from faint sourcesbelow the source subtraction limit of 20 mJy. The residual source power spectrum(∼ 210 µK2 at ℓ = 1000) is subtracted from the VSA band-power estimates as anuncorrelated statistical correction.
6.1 Galactic foregrounds
At the frequency and high angular resolution of the VSA observations it is not ex-pected a significant contribution of the diffuse Galactic foregrounds: synchrotronemission, free-free emission from ionized gas and vibrational dust emission. Thepower spectrum of these well known foregrounds decreases with increasing ℓ [37] andthe VSA fields have been selected in regions of high galactic latitude in order tominimize these potential contaminants. Estimates for these foregrounds in the VSAfields have been obtained using three template maps: the 408 MHz all-sky map forsynchrotron [38], the Hα data from the Wisconsin H-Alpha Mapper (WHAM, [39])for free-free emission and the 100 µm map [40] for dust-correlated emission. Sim-ilar considerations as in previous work [27] lead to synchrotron and free-free r.m.s.power values for the VSA extended fields of less than (10 µK2) compared to the CMBfluctuations ( >
∼ 1000 µK2).
In addition, we have to consider a more controversial foreground, the so called
7
Rafael Rebolo et al. Interferometry of the Cosmic Microwave Background
“foreground X” [41], which appears to be correlated with far infrared dust emission.The characteristics of this foreground have not been fully established yet. Somemodels [42] predict that spinning dust particles may be the carrier with maximumemission in the range 20-30 GHz. For the dust-correlated component, we smoothedthe [40] 100 µm map to 22 arcmin (ℓ ∼ 1000) and assumed a nominal couplingcoefficient between brightness temperature at 33 GHz and the 100 µm intensity ofTb/I100 = 10 µK/(MJy sr−1). This is a nominal value averaged for the high latitudesky. The r.m.s. power fluctuations estimates for the VSA fields range between 1 and90 µK2 at ℓ = 1000, typically <
∼ 10 µK2 while the CMB fluctuations are ∆T 2rms ∼
1000 µK2 thus, for most of the VSA regions, the Galactic emission is essentiallynegligible.
6.2 SZ clusters
The VSA fields are selected to avoid known galaxy clusters and minimize any contri-bution to the CMB temperature from inverse Compton scattering of hot electrons inthe intracluster medium, the Sunyaev-Zeldovich (SZ) effect [43, 3]. At the frequencyof VSA obsrvations, the SZ effect, produces temperature decrements in the line ofsight of the galaxy clusters. The confusion noise produced by a Poisson distributionof unknown high redshift clusters has been estimated using available models [44]. Ifwe adopt σ8 = 0.9, we obtain a contribution of ≈ 1 mJy beam−1, approximately sixtimes lower than the noise level in typical VSA maps.
7 Results
7.1 Maps
The maps are produced using a maximum entropy method (MEM) [45]. The binnedvisibility data used for deriving the power spectrum are also the starting point formap making. First, the Fourier modes in the u, v-plane are reconstructed, then theseare Fourier transformed to obtain the maps. The MEM algorithm assumed a flat skyas prior. The signal-to-noise ratio of the maps is in the range SNR∼ 1−3, the changebeing primarily due to the varying integration times after flagging and filtering of thedata [17]. The sensitivity of the mosaiced maps is slightly higher than this, due tothe overlapping of the individual fields.
The VSA maps allow a comparison to be made with other CMB data. The recentWMAP data release [14] has provided 5 all-sky maps at frequencies centred at 22.8(K-band), 33 (Ka-band), 40.7 (Q-band), 60.8 (V-band) and 93.5 GHz (W-band) withresolutions ranging from 49.2 arcmin (K-band) to 12.6 arcmin (W-band). The signal-to-noise ratio of WMAP data at the VSA resolution is ∼ 1 and hence much of theCMB signal is lost in the noise. The actual noise level in the WMAP data depends on
8
Rafael Rebolo et al. Interferometry of the Cosmic Microwave Background
position due to the scanning strategy of the WMAP satellite. For the 1-year WMAPdata release, the noise is ∼ 100 − 200 µK per 12.6 arcmin pixel in the VSA regions,compared to ∼ 20 µK beam−1 in the VSA mosaiced maps.
7.2 Power spectrum
The final visibility data are binned into u, v square cells, each 9 wavelengths on aside, to oversample the data. This reduces the number of data points by a factor of>∼ 1000. Sources are subtracted using position and flux density information from theSource Subtractor. For each VSA pointing there is a final visibility file with ∼ 103
data points.
Figure 2: The CMB power spectrum as measured by the VSA by combining the datafrom all 7 VSA regions [17]. The first 3 bins are included from earlier VSA datain a compact array. The errors represent 1 σ limits. Two alternate binnings (greyand black) are displayed. Absolute calibration is accurate to 3 per cent and is notincluded in the errors.
The binned visibilities form the basic input to the maximum likelihood analysisfor the CMB power spectrum. We used the Microwave Anisotropy Dataset Compu-tational sOftWare (MADCOW) [46] which can deal with mosaiced observations andvariable bin-widths.The band powers calculated from the complete VSA data set,both the compact and extended arrays are available at the following URL:http://www.jb.man.ac.uk/research/vsa/vsa results.html.
The extended array data have little sensitivity at ℓ <∼ 300. The 3 bins at ℓ < 300
are therefore dominated by data from the compact array [10]. The error bars werecalculated from the probability likelihood functions by enclosing 68 per cent of thearea centred on ℓh, the median ℓ value for each bin. Calibration uncertainty (≈ 3per cent) is not included. Sample variance is included in the error estimates. The
9
Rafael Rebolo et al. Interferometry of the Cosmic Microwave Background
VSA power spectrum (Figure 2) clearly shows the existence of the first three acousticpeaks and the fall-off in power towards higher ℓ.
8 Cosmological implications
We first consider the standard six-parameter flat ΛCDM model, and then includeextra parameters as in the approach adopted by the WMAP team [16, 47, 48]. In thecase where we do not impose external priors on the CMB data (WMAP+VSA), wefind that there is significant evidence (> 2σ) for negative running; something whichis not implied by the WMAP data alone. The significance of this result is sensitiveto the inclusion of external priors, the relative calibration of WMAP and VSA, andpossible source/cluster contamination of the measured power spectrum. Second, weconsider a 12-parameter model fit to WMAP, WMAP+VSA and all available CMBdata beyond ℓ > 1000, illustrating the effects of external priors on the estimatedparameters.
8.1 Methodology
Cosmological model
The ΛCDM model assumes that the Universe is flat and dominated by cold darkmatter (CDM), baryons and a cosmological constant, Λ. The densities of thesecomponents relative to critical are denoted Ωdm, Ωb and ΩΛ respectively and wedefine Ωm = Ωdm + Ωb to be the overall matter density (CDM and baryons) inthe same units. The expansion rate is quantified in terms of the Hubble constantH0 = 100hkmsec−1 Mpc−1 and we allow for instantaneous reionization at some epochzre(< 30) which can also be quantified in terms of an optical depth τ . The so-called physical densities of the CDM and baryons are defined as ωdm = Ωdmh2 andωb = Ωbh
2. We will consider only adiabatic models and parameterize the initialfluctuation spectrum of this model by
P (k) = AS
(
k
kc
)nS
, (7)
where kc = 0.05Mpc−1 is the arbitrarily chosen pivot point of the spectrum, nS is thespectral index and AS is the scalar power spectrum normalization.
We will also consider a model with a running spectral index,
P (k) = AS
(
k
kc
)nS+ 1
2nrun log(k/kc)
, (8)
10
Rafael Rebolo et al. Interferometry of the Cosmic Microwave Background
so that the overall spectral index of fluctuations is a function of scale, nS(k), givenby
nS(k) =d(log P )
d(log k)== nS + nrun log
(
k
kc
)
, (9)
where nrun is known as the running of the spectral index. For slow roll inflation to bewell defined, one requires that |nrun| ≪ |1−nS|/2 [49]. Under certain choices of priorswe find that there is some evidence that this inequality is violated by the preferredfits to the data.
The other parameters which we will consider in our analyses are: fν = Ων/Ωdm,the fraction of the dark matter which is massive neutrinos; Ωk = 1 − Ωtot (Ωtot =Ωdm + Ωb + Ων + ΩΛ), the curvature in units of the critical density; w = PQ/ρQ, theequation-of-state parameter for a dark energy component modelled as a slowly rollingscalar field; nT the spectral index of tensor fluctuations specified at the pivot pointkc = 0.002 Mpc−1; R = AT/AS, the ratio of the amplitude of the scalar fluctuations,AS, evaluated at kc = 0.05 Mpc−1, and that of the tensor fluctuations evaluated atkc = 0.002 Mpc−1. In addition to these parameters, for which we fit, we will alsocomment on various derived quantities: t0, the age of the universe; σ8, the amplitudeof density fluctuations in the spheres of 8h−1 Mpc.
8.2 CMB data
Four different combinations of CMB data have been considered.
• The first data set, denoted COBE+VSA contains the VSA data as describedin the previous sections [17] combined with the COBE data [4, 50].
• The second data set, denoted WMAP contains only the WMAP temperature(TT) data [15] and temperature-polarization cross-correlation (TE) data [51].
• The third data set contains WMAP data and the new VSA data and is referredto as WMAP+VSA. This allows to illustrate the relevance of measurementsof the power spectrum on small angular scales.
• Finally, we combine the previous two with all important CMB experimentsproviding measurements in the region of the second peak of the spectrum andbeyond, namely CBI, ACBAR, Boomerang, Maxima, DASI [11, 13, 7, 52, 8].This last data set is hereafter referred to as AllCMB.
External priors
In addition to the CMB data sets described above, we consider the effects of othercosmological data, not only to break the degeneracies, but also to see how the mea-
11
Rafael Rebolo et al. Interferometry of the Cosmic Microwave Background
sured CMB power spectrum fits in the wider cosmological context. The externalpriors used are:
• The constraint on the expansion rate of the Universe from the Hubble SpaceTelescope (HST) Key project value of H0 = 72 ± 8 kmsec−1 Mpc−1 [53]. Theerror-bar includes both statistical and systematic uncertainty.
• Constraints on large scale structure from the 2dF Galaxy Redshift Survey [54,55, 56], which provides measurements on scales 0.02 < k/(hMpc−1) < 0.15.
• Constraints from Type Ia Supernovae (SNeIa) [57, 58].
• Constraints from the gas fraction (fgas) in dynamically relaxed clusters of galax-ies [59] and from the observed local X-ray luminosity function (XLF) of galaxyclusters [60].
• Constraints from cosmic shear (CS) measurements [61].
Parameter estimation
The parameter estimation has been performed using the cosmomc software package[62]. The calculations were performed on LAM clusters with a total of 42 CPUs at theIAC in La Laguna, Tenerife and the COSMOS supercomputer facility at the Uni-versity of Cambridge. The cosmomc software uses the Markov Chain Monte Carlo(MCMC) algorithm to explore the hypercube of parameters on which we impose flatpriors. These priors are listed in Table 8.2. Additionally, the software automaticallyimposes the physical prior ΩΛ > 0, which can significantly affect the marginalizedprobability distributions (see [63] for further discussion).
8.3 Flat ΛCDM models
Standard six-parameter model
We begin our discussion in the context of the standard flat ΛCDM model with sixfree parameters (ωb, ωdm, h, nS, AS, τ) with no external priors.
The constraints derived for the parameters are tabulated in Table 8.3. The valuesfor WMAP alone can be compared with those in [16]. Noting that they presentωm = Ωmh2, instead of ωdm, there are only minor discrepancies in the central values,although some of the limits appear to be somewhat larger. The preferred valueof the redshift of reionization is zre = 17+8
−6. The inclusion of the high-resolutiondata from the VSA modifies the limits on each of the parameters and these aremost significant for nS, whose best fitting value reduces from 1.00 to 0.97. Theresult for nS will be central to our subsequent discussion of the primordial power
12
Rafael Rebolo et al. Interferometry of the Cosmic Microwave Background
Table 1: Priors used on each cosmological parameter when it is allowed to vary. Thenotation (a, b) for parameter x denotes a top-hat prior in the range a ≤ x ≤ b.
Parameter COBE+VSA WMAP WMAP+VSA
ωb 0.0328+0.0073−0.0071 0.0240+0.0027
−0.0016 0.0234+0.0019−0.0014
ωdm 0.125+0.031−0.027 0.117+0.018
−0.018 0.111+0.014−0.016
h 0.77+0.15−0.17 0.73+0.10
−0.06 0.73+0.09−0.05
nS 1.05+0.12−0.08 1.00+0.09
−0.04 0.97+0.06−0.03
1010AS 25+11−6 27+9
−5 23+7−3
τ Unconstrained 0.18+0.16−0.08 0.14+0.14
−0.07
Table 2: Parameter estimates and 68% confidence limits for the standard six-parameter flat ΛCDM model.
13
Rafael Rebolo et al. Interferometry of the Cosmic Microwave Background
CMB External nS nrun
COBE+VSA None 0.93+0.13−0.12 −0.081+0.049
−0.049
WMAP None 0.94+0.07−0.06 −0.060+0.037
−0.036
WMAP+VSA None 0.96+0.07−0.07 −0.069+0.032
−0.032
COBE+VSA HST 0.92+0.11−0.12 −0.081+0.048
−0.048
WMAP HST 0.95+0.06−0.07 −0.060+0.037
−0.037
WMAP+VSA HST 0.93+0.06−0.05 −0.069+0.036
−0.036
COBE+VSA 2dF 1.00+0.12−0.13 −0.044+0.058
−0.061
WMAP 2dF 0.95+0.05−0.06 −0.038+0.025
−0.037
WMAP+VSA 2dF 0.93+0.05−0.05 −0.049+0.035
−0.034
Table 3: Limits on nS and nrun in the flat ΛCDM model with a running spectral indexfor different CMB data sets and external priors.
spectrum. The results from WMAP+VSA are very similar to those presented in[16] for WMAP+ACBAR+CBI. We also find a larger value for ωb than suggested byWMAP, WMAP+VSA and standard Big Bang Nucleosynthesis, ωb = 0.020± 0.002,[64].
Running spectral index models
In the previous section we saw that the inclusion of the VSA data to that of WMAPshifts the derived limits on the spectral index. Standard, slow-roll models of inflationpredict that the spectral index will be a function of scale, albeit at a very low level,and it seems a sensible parameter to allow as the first beyond the standard model. Theanalysis of [16, 48] provided evidence for a non-zero value of nrun(= −0.031+0.016
−0.017) whenusing CMB data from WMAP, ACBAR and CBI, along with large-scale structure data
14
Rafael Rebolo et al. Interferometry of the Cosmic Microwave Background
from the 2dF galaxy redshift survey and the Lyman-α forest.
We will start our discussion by considering the same model as in the previoussection with no external priors, but with nrun allowed to vary. The derived limitson nS and nrun are presented in the first three rows of Table 8.3 for COBE+VSA,WMAP and WMAP+VSA. The derived limits on ωb, ωdm and h are not changedappreciably and the other parameters, AS and τ (or zre) are strongly degenerate andzre will feature in our discussion below.
The values of nS and nrun are not particularly well constrained by COBE+VSA,but it is worth noting that even in this case there is a definite preference for a valueof nrun < 0. The results have been included for completeness and provide a usefulcross-check. The results for WMAP are somewhat different to those presented in[16]. In particular we find that nrun = −0.060+0.037
−0.036, a 1.6σ preference for nrun < 0,as opposed to nrun = −0.047± 0.04 from Spergel et al. [16]. The significance of thisresult is improved to 2.2σ by the inclusion of the high resolution data from the VSA.We remark that this result comes from CMB data alone.
We have tested the sensitivity of this apparently result to the inclusion of externalpriors from the HST and 2dF galaxy redshift survey, and the results are also presentedin Table 8.3. We see that the effect of the HST prior is to relax marginally theconstraint on nrun, although there is a significant change in the derived limit on nS.We note that the results for WMAP alone are very similar with and without the HSTprior. The inclusion of 2dF does significantly affect our results. Using just WMAPwe find that there is only a marginal preference for nrun < 0 and the inclusion of VSAonly yields a 1.4σ result. We note that this is a shift in the derived value and theerror bars do not change significantly.
We have also considered the effects of including other CMB information from thetwo other high resolution experiments ACBAR and CBI. We find that the inclusionof their results does not appear to be as significant as the VSA in preferring a valueof nrun < 0 and that the result of considering WMAP+ACBAR+CBI+VSA is verysimilar to just WMAP+VSA. We note that the ACBAR and CBI experiments quotelarge global calibration uncertainties (20% and 10% in power), which we believe is atleast as responsible for this result as their errors on the individual power spectrumband powers.
Neutrino fraction
As a final extension to our flat ΛCDM model, it is of interest to include the fractionfν of dark matter in the form of neutrinos. Evidence for a neutrino oscillation, andhence for the existence of massive neutrinos, has been found by solar neutrino andatmospheric neutrino experiments [65, 66, 67, 68]. Further evidence for a non-zerovalue of the neutrino mass has recently been claimed from cosmological data [69].
In addition to obtaining constraints on fν, the inclusion of this parameter will
15
Rafael Rebolo et al. Interferometry of the Cosmic Microwave Background
inevitably lead to some broadening of the marginalized distributions for the otherparameters. Of particular interest is whether the constraints on the running spectralindex derived above are robust to the inclusion of fν . We therefore include fν , withthe top-hat prior given in Table 8.2, into the running spectral index model. In theanalysis of this model, we include the 2dF external prior, since current CMB aloneprovide only a weak constraint on fν .
We find that the 95% upper limit provided by the COBE+VSA data set, fν <0.132, is only marginally larger than that obtained using WMAP data, fν < 0.090.The combination WMAP+VSA gives similar limits to WMAP, namely fν < 0.087,which corresponds to neutrino mass of mν < 0.32eV when the neutrino masses aredegenerate.
For the parameters nS and nrun, the marginalized distributions have indeed beenshifted and broadened by the inclusion of fν although the effects are not very strong.In particular, we note that our earlier finding of a preference for a non-zero value ofnrun has been weakened somewhat. A non-zero nrun is still preferred, but at reducedsignificance. For the WMAP+VSA data set, we obtain nS = 0.94+0.06
−0.06 and nrun =−0.041+0.037
−0.036 with 68% confidence limits.
In the above analysis we used only 2dF as an external prior. It is of interest toinvestigate the effect of including different combinations of the additional externalpriors listed in Table 8.2. The effect of these additional priors has been calculatedby importance sampling our previous results. We also investigate the effect of in-cluding all recent CMB data into our analysis. In Figure 3, we plot confidencelimits on all the model parameters for each of our four CMB data sets, each ofwhich, in turn, includes four different combinations of external priors: 2dF, 2dF+fgas,2dF+fgas+XLF, 2df+HST and 2dF+CS. The points indicate the median of the cor-responding marginalized distribution, and the error bars show the 68% central confi-dence limit. If the distribution peaks at zero, the point is placed on the axis and the95% upper limit is shown.
We see that the inclusion of the fgas and XLF external priors significantly reducesthe error bars on all parameters. The most profound effect is obtained from the XLFprior for the parameters fν , σ8 and zre, as might be expected from [69]. Indeed, itis only with the inclusion of the XLF prior that a non-zero value of fν is preferredand only then at limited significance. For each of the CMB data set combinations,the best-fitting value in this case is fν ≈ 0.05, which corresponds to neutrino mass ofmν ≈ 0.18eV when the neutrino masses are degenerate, with a zero value excluded ataround 96% confidence. For σ8 the inclusion of the XLF prior significantly reducesthe best-fit value and the error bars for all CMB data set combinations. A similar,but less pronounced, effect is seen for zre.
16
Rafael Rebolo et al. Interferometry of the Cosmic Microwave Background
WMAP WMAP+VSA AllCMB
Ωbh2 0.025+0.003
−0.003 0.024+0.003−0.002 0.023+0.002
−0.002
Ωdmh2 0.108+0.022−0.021 0.111+0.021
−0.019 0.113+0.017−0.017
h 0.66+0.07−0.06 0.66+0.06
−0.06 0.65+0.07−0.07
zre 18+7−7 19+7
−7 17+7−8
Ωk −0.02+0.03−0.03 −0.01+0.03
−0.03 −0.02+0.03−0.03
fν < 0.093 < 0.083 < 0.083
w −1.00+0.24−0.27 −0.99+0.24
−0.27 −1.06+0.24−0.25
nS 1.04+0.12−0.11 0.99+0.09
−0.09 0.96+0.07−0.07
nT 0.26+0.53−0.60 0.13+0.49
−0.51 0.12+0.48−0.51
nrun −0.02+0.07−0.05 −0.04+0.05
−0.04 −0.04+0.04−0.05
1010AS 27+8−5 26+9
−5 25+6−5
R < 0.78 < 0.77 < 0.68
ΩΛ 0.71+0.07−0.09 0.70+0.06
−0.08 0.69+0.07−0.09
t0 14.1+1.4−1.1 14.1+1.3
−1.2 14.4+1.4−1.3
Ωm 0.31+0.09−0.07 0.31+0.08
−0.06 0.33+0.10−0.07
σ8 0.76+0.14−0.14 0.77+0.13
−0.13 0.76+0.11−0.12
τ 0.20+0.13−0.11 0.20+0.15
−0.10 0.17+0.12−0.10
Table 4: Parameter estimates and 68% confidence intervals for various cosmologicalparameters. For fν and R, the 95% upper limits are quoted.
17
Rafael Rebolo et al. Interferometry of the Cosmic Microwave Background
Figure 3: Estimates for cosmological parameters in the flat ΛCDM running spectralindex model, extended to include fν . Four CMB data sets are considered and, foreach data set, four determinations are plotted, corresponding to different combina-tions of external priors. From left to right the external priors are: 2dF; 2dF+fgas;2dF+fgas+XLF; 2dF+HST and 2dF+CS. The points indicate the median of the cor-responding marginal distributions. The error bars denote 68% confidence limits. If adistribution peaks at zero then the 95% upper limit is shown. The horizontal dashedlines plotted in some of the panels indicate BBN values for Ωbh
2, the value of hgiven by the HST key project, the Harrison-Zeldovich value of the spectral index offluctuations and a zero value for the running index.
18
Rafael Rebolo et al. Interferometry of the Cosmic Microwave Background
8.4 General ΛCDM model
Thus far we have considered only a limited range of flat ΛCDM models. In principle,one should properly include all the relevant unknowns into the analysis in order toobtain conservative confidence limits. In this section, we consider a more generalΛCDM model. In addition to including fν and nrun, the standard six-parameter flatΛCDM model is further extended by including Ωk, w, R = AT/AS and nT. Thisgives 12 variable parameters in total, for which we adopt the top-hat priors listed inTable 8.2.
For this model, we consider the three CMB data sets WMAP, WMAP+VSA andAllCMB. In addition, we now use both 2dF and SNeIa as our basic external priors,which are required in order to set constraints on our 12-dimensional cosmologicalparameter space. The corresponding confidence limits on the parameter values aregiven in Table 8.3.
For Ωbh2 we see a clear trend towards a lower preferred value (closer to the BBN
estimate) as one adds first VSA data and then all remaining CMB data sets. Thiseffect is accompanied by a gradual upwards trend in the preferred Ωdmh2 value. Theother parameters exhibiting such trends are nS and nrun. As more CMB data areincluded, the preferred value of nS moves slightly below unity, although this value is byno means excluded. Perhaps more importantly, the upper limit on nS is significantlyreduced as more CMB data are added. An analogous effect is observed for nrun, forwhich the addition of VSA data significantly reduces the tail of the distribution forpositive values of nrun.
We see that the inclusion of the fgas and XLF external priors has the greatesteffect on the confidence limits, and that this is most pronounced for the XLF priorand the parameters fν , σ8 and zre. It is reassuring, however, that the derived limits onfν for the general model are very similar to those obtained assuming the simpler flatmodel. We again find fν ≈ 0.05, with a zero-value excluded at about 92% confidencewhich is slightly lower than for the flat case. The effect of the XLF prior on σ8 andzre in the general model is also similar to that observed in the simpler flat case.
9 Conclusions
We have used recent data from the Very Small Array, together with other CMBdatasets and external priors, to set constraints on cosmological parameters. We haveconsidered both flat and non-flat ΛCDM models and the results are consistent.
Within the flat ΛCDM model, we find that the inclusion of VSA data suggeststhat the initial fluctuation spectrum that is not described by a single power-law. Thenegative running, which reduces the amount of power on small scales and hence theamount of structure at early times, leads to predictions for the epoch of reionizationat odds with the best fit to the CMB data. We shall caution that this result may
19
Rafael Rebolo et al. Interferometry of the Cosmic Microwave Background
be affected by the absolute calibration uncertainty of the VSA power spectrum andthe residual point source correction due to sources below out subtraction limit of20mJy. It is possible that an imperfect subtraction, either an over-estimate or anunder-estimate, could lead to inaccuracies in the derived limits on the cosmologicalparameters, in particular on nS and nrun.
For the general 12-parameter ΛCDM model, we find that our marginalized distri-butions for nS and nrun are broadened, as one would expect. Nevertheless, even in thiscase, the addition of VSA data significantly reduces tails of the distributions for nS
greater than unity and for positive nrun, as compared with using WMAP as the onlyCMB data set. Indeed, these effects are reinforced by the use of the AllCMB dataset. The inclusion of additional CMB data beyond WMAP also leads to a noticeablereduction in the preferred value of ωb and a corresponding increase in ωdm.
To summarize, we find that there is evidence for nrun < 0 in a limited classof models, but within the general ΛCDM model with 12 parameters the evidence ismuch weaker. Standard models of inflation are generally incompatible with such largenegative values of nrun, but the data appears to point in that direction, although nottotally conclusively. The inclusion of an external prior from 2dF appears to weakenthe result by fixing Ωm ≈ 0.3 in conjunction with the CMB data. The measurement ofΩmh using the galaxy power spectrum is responsible for this shift. It is an interestingquestion as to how reliable this measurement is since a slight shift in the results, apreference for Ωmh ≈ 0.17 rather than Ωmh ≈ 0.21 would bring their preferred valueinto line with that suggested by the CMB alone and would uphold the possibilityof nrun < 0. Since none of the galaxy redshift surveys have conclusively observedthe turnover in the power spectrum on which this determination of Ωmh is based weassert that there is still room for some doubt. We set an upper limit on the mass ofeach of the three neutrino flavours of mν < 0.32eV (95 C.L.). We have shown thatmeasurements of the CMB power spectrum beyond ℓ = 1000 can have an impacton the estimation of cosmological parameters and that future measurements in thisregion by the VSA, the PLANCK satellite and others will enable us in the future tomake more definitive statements.
Acknowledgements: We thank the staff of Jodrell Bank Observatory, Mullard RadioAstronomy Observatory and IAC for assistance in the day-to-day operation of theVSA. We thank PPARC and the IAC for funding and supporting the VSA project.Partial financial support was provided by Spanish Ministry of Science and Technologyproject AYA2001-1657.
References
[1] Fixen, D. J., Cheng, E. S., Gales, J. M., Mather, J. C., Shafer, R. A., Wright,E. L. 1996, ApJ, 473, 576
20
Rafael Rebolo et al. Interferometry of the Cosmic Microwave Background
[2] Peebles, P.J.E. and Yu, J. T. 1970, ApJ, 162, 815[3] Sunyeav, R. A., Zeldovich, Y. B. 1970, ApJSS, 7, 3[4] Smoot G. F. et al. 1992, ApJ, 396, L1[5] de Bernardis, P. et al. 2000, Nature, 404, 955[6] Lee A. T. et al. 2001, ApJ, 561, L1[7] Netterfield C. B. et al. 2002, ApJ, 571, 604[8] Halverson N. W. et al. 2002, ApJ, 568, 38[9] Benoıt A. et al. 2003, A&A, 399, L19
[10] Scott P. F. et al. 2003, MNRAS, 341, 1076[11] Pearson T. J. et al. 2003, ApJ, 591, 556[12] Grainge K.J.B. et al. 2003, MNRAS, 341, L23[13] Kuo C. L. et al. 2004, ApJ, 600, 32[14] Bennett C. L. et al. 2003a, ApJSS, 148, 1[15] Hinshaw, G. et al. 2003a, ApJSS, 148, 135[16] Spergel D. N. et al. 2003, ApJSS, 148, 175[17] Dickinson C. et al. 2004, MNRAS, submitted[18] White, M., Carlstrom, J. E., Dragovan, M., and Holzapfel, W. L. 1999, ApJ,
514, 12[19] Rebolo R. 2002, Space Sci. Rev., 100, 15[20] White, M., Srednicki, M. 1995, ApJ, 443, 6[21] Webster, A. 1994, MNRAS, 268, 299[22] Church, S. E. 1995, MNRAS, 272, 551[23] Dicker, S. R., Melhuish, S. J., Davies, R. D., Gutierrez, C. M., Rebolo, R.,
Harrison, D. L., Davis, R. J., Wilkinson, A., Hoyland, R. J., Watson, R.A. 1999,MNRAS, 309, 750
[24] Harrison, D. L., Rubino-Martın, J. A., Melhuish, S. J., Watson, R.A., Davies,R.D., Rebolo, R., Davis, R. J., Gutierrez, C. M., Macıas-Perez 2000, MNRAS,316, L24
[25] Padin et al. 2001, ApJ, 549, L1[26] Watson R. A. et al. 2003, MNRAS, 341, 1057[27] Taylor A. C. et al. 2003, MNRAS, 341, 1066[28] Ebeling, H., Edge, A. C., Bohringer, H., Allen, S. W., Crawford, C. S., Fabian,
A. C., Voges, W., Huchra, J. P. 1998, MNRAS, 301, 881[29] Abell G. O. 1958, ApJSS, 3, 211[30] Condon, J. J., Cotton, W. D., Greisen, E. W., Yin, Q. F., Perley, R. A., Taylor,
G. B., Broderick, J. J. 1998, AJ, 115, 1693[31] Gregory, P. C., Scott, W. K., Douglas, K., Condon, J. J. 1996, ApJSS, 103, 427[32] Maisinger, K., Hobson, M. P., Saunders, R.D.E., Grainge, K.J.B. 2003, MNRAS,
345, 800[33] Mason, B. S., Leitch, E. M., Myers, S. T., Cartwright, J. K., Readhead, A.C.S.
1999, AJ, 118, 2908[34] Page L. et al. 2003, ApJSS, 148, 39
21
Rafael Rebolo et al. Interferometry of the Cosmic Microwave Background
[35] Waldram, E. M., Pooley, G. G., Grainge, K.J.B., Jones, M. E., Saunders, R.D.E.,Scott, P. F., Taylor, A. C. 2003, MNRAS, 342, 915
[36] Toffolatti, L., Argueso Gomez, F., de Zotti, G., Mazzei, P., Franceschini, A.,Danese, L., Burigana, C. 1998, MNRAS, 297, 117
[37] Giardino, G., Banday, A.J., Fosalba, P., Gorski, K. M., Jonas, J. L., O’Mullane,W., Tauber, J. 2001, A&A, 371, 708
[38] Haslam, C.G.T., Klein, U., Salter, C. J., Stoffel, H., Wilson, W. E., Cleary,M. N., Cooke, D. J., Thomasson, P. 1981, A&A, 100, 209
[39] Haffner, L. M., Reynolds, R. J., Tufte, S. L., Madsen, G. J., Jaehnig, K. P.,Percival, J. W. 2003, ApJSS, 149, 405
[40] Schlegel, D. J., Finkbeiner, D. P., Davis, M. 1998, ApJ, 500, 525[41] de Oliveira-Costa, A., Tegmark, M., Davies, R. D., Gutierrez, C. M., Lasenby,
A. N., Rebolo, R., Watson, R. A., ApJ, submitted (astro-ph/0312039)[42] Draine, B. T., Lazarian, A. 1998, ApJ, 494, L19[43] Zeldovich, Y. B., Sunyaev, R. A. 1969,ApJSS, 4, 301[44] Battye, R. A., Weller, J. 2003, Phys. Rev. D, 68, 083506[45] Maisinger, K., Hobson, M. P., Lasenby, A. N. 1997, MNRAS, 290, 313[46] Hobson, M. P., Maisinger, K. 2002, MNRAS, 334, 569[47] Verde L. et al. 2003, ApJSS, 148, 195[48] Peiris, H. V. et al. 2003, ApJSS, 148, 213[49] Leach, S., Liddle, A. R. 2003, astro-ph/0306305[50] Bennett, C. L. et al. 1996, ApJ, ApJ, 464, L1[51] Kogut A. et al. 2003, ApJSS, 148, 161[52] Hanany S. et al. 2002, ApJ, 545, L5[53] Freedman W. L. et al. 2001, ApJ, 553, 47[54] Colless M. et al 2001, MNRAS, 328, 1039[55] Percival W. J. et al. 2001, MNRAS, 327, 1297[56] Percival W. J. et al. 2002, MNRAS, 337, 1068[57] Perlmutter S. et al. 1999, ApJ, 517, 565[58] Reiss A. et al. 1998, AJ, 116, 1009[59] Allen, S., Schmidt, R. W., Fabian, A. C. 2002, MNRAS, 334, L11[60] Allen, S., Schmidt, R. W., Fabian, A. C., Ebeling, H. 2003a, MNRAS, 342, 287[61] Hoekstra, H., Yee, H.K.C., Gladders, M. D. 2002, ApJ, 577, 595[62] Lewis, A. L., Bridle S. L. 2002, PRD, 66, 103511[63] Slosar, A. et al. 2003, MNRAS, 341, L29[64] Burles, S., Nollett, K. M., Turner, M. S. 2001,ApJ, 552, L1[65] Fukuda Y. et al. 1998, Phys. Rev. Lett., 81, 1562[66] Fukuda Y. et al. 2002, Phys. Lett. B, 539, 179[67] Allison W.W.M. et al. 1999, Phys. Lett. B, 449, 137[68] Ambrosio M. et al 2000, Phys. Lett. B, 478, 5[69] Allen, S. W., Schmidt, R. W., Bridle, S. L. 2003b, MNRAS, 346, 596[70] Cleary, K. 2003, Ph.D thesis, University of Manchester


![28. Cosmic Microwave Backgroundpdg.lbl.gov/.../rpp2019-rev-cosmic-microwave-background.pdf · 2019. 12. 6. · cosmic microwave background (CMB), discovered in 1965 [1]. The spectrum](https://static.documents.pub/doc/80x56/6143c67b6b2ee0265c02424a/28-cosmic-microwave-2019-12-6-cosmic-microwave-background-cmb-discovered.jpg)