Interim Business Report First half of the fiscal year ending March 31, 2009 April 1, 2008 to September 30, 2008 The 90 th fiscal year of Mitsui & Co., Ltd. Translated document This report has been prepared in English solely for the convenience of foreign readers, based on the Chukanhokokusho for the first half of Mitsui’s 90 th fiscal year. The original report in Japanese is definitive. Terminology In this translated report, the terms the “Company” or “Mitsui” refer to Mitsui & Co., Ltd.
Transcript
Interim Business Report First half of the fiscal year
ending March 31, 2009
April 1, 2008 to September 30, 2008 The 90th fiscal year of Mitsui & Co., Ltd.
Translated document This report has been prepared in English solely for the convenience of
foreign readers, based on the Chukanhokokusho for the first half of
Mitsui’s 90th fiscal year. The original report in Japanese is definitive.
Terminology In this translated report, the terms the “Company” or “Mitsui” refer to
Mitsui & Co., Ltd.
1
From the President
We are pleased to bring you the Interim Business Report for our 90th fiscal year, which ends on March 31, 2009.
For the six-month period under review we achieved consolidated net income of ¥240.5 billion. Although this is ¥11.4 billion lower than for the interim period of the previous year, it nonetheless represents very strong performance when considered in the context of the large profits from asset sales that boosted results in the previous year.
The interim dividend for the period has been increased to ¥25 per share, ¥2 higher than for the previous interim period. Moreover, based on our dividend policy of targeting a consolidated payout ratio of 20% and assuming we achieve the consolidated net income target for the
year of ¥460.0 billion, we plan to increase the total dividend for the full year to ¥50 per share, compared to the ¥46 per share paid for the year ended March 2008.
The business environment has been changing rapidly, with a further escalation of turmoil in the financial markets arising from the U.S. sub-prime problem since late September, share markets falling, and the Japanese yen strengthening. The domestic economy is faltering, and it will be necessary to keep a close watch on the impact the financial market problems make on the real economy, along with the effect of falls in the commodity markets.
Given this environment, we will be working to maintain a sound financial condition. Based on the Medium-Term Management Outlook we announced in May 2006, we will continue efforts to increase our enterprise value by making optimal use of our comprehensive business engineering capabilities and management resources.
We look forward to your continued support.
Shoei Utsuda President and Chief Executive Officer
Contents Trends in key consolidated management
indices 2
I Business Review 2
1. Operating Environment 2. Operating Results, Financial Condition and Etc. 3. Progress on Medium-Term Management Outlook4. Outline of Financing and Capital Expenditure 5. Trends in Value of Group Assets and Profitability
Consolidated Balance Sheets Statements of Consolidated Income Statements of Consolidated Shareholders’
Equity Statements of Consolidated Cash Flows Operating Segment Information
293133 3537
II Corporate Outline 22 1. Principal Group Business 2. Principal Group Offices 3. Shares of Mitsui & Co., Ltd. 4. Group Employees 5. Principal Subsidiaries 6. Senior Company Officers and Auditors
Note: In this translated report, the term “the Group” refers to “corporate organizations” as defined in Clause 2, Article 122 of the enforcement regulations of the Corporate Law of Japan.
2
First half of the fiscal year ending March 31, 2009 (April 1, 2008 to September 30, 2008)
TRENDS IN KEY CONSOLIDATED MANAGEMENT INDICES
(Billions of yen)
Six-month period ended September
30, 2005
Six-month period ended September
30, 2006
Six-month period ended September
30, 2007
Six-month period ended September
30, 2008
Gross profit 359.9 406.0 478.5 628.7
Operating income 105.3 125.1 179.5 310.8 Equity in earnings of associated companies 38.8 74.5 72.4 85.9
Net income 83.2 154.5 251.9 240.5
1. OPERATING ENVIRONMENT
THE GLOBAL ECONOMY
In the six-month period ended September 30, 2008, the real economy in the United States remained
decelerated especially due to a continued decline in residential investment, while supported by an
increase in exports and growth in consumer spending stimulated by income tax rebates. From September
2008, however, the turmoil in financial and capital markets intensified with some financial institutions
going bankrupt, and there was an increasing sense that the economy was slowing down rapidly.
In Europe, housing investment and consumer spending slowed, and the losses posted by financial
PART I: BUSINESS REVIEW
3
institutions increased further.
In Asia, China and other countries continued to post strong growth, with higher levels of construction and
capital investment as well as increases in exports, despite high prices of crude oil and raw materials
causing rising inflation in the region.
Prices for crude oil, non-ferrous metals and other internationally traded commodities reached record
highs in July 2008, and subsequently started to decline.
In order to counteract the turmoil in financial and capital markets, governments and central banks of
various countries implemented coordinated measures, including injecting public funds into financial
institutions, supplying funds to the markets, and lowering policy interest rates.
JAPANESE ECONOMY
In Japan, economic conditions continued to deteriorate, impacted by factors including high crude oil
prices. Consumer spending slowed overall, with lower consumer sentiment resulting from high gasoline
prices, despite strong sales of flat-screen televisions and personal computers.
Construction investment gradually recovered after falling off as a result of the enforcement of the revised
Building Standard Law in 2007, but the slowdown in the domestic economy caused housing sales to stall,
and as a result business confidence in the construction and real estate industries remains low.
Exports of basic materials such as steel products to China and other Asian countries were resilient, while
exports of automobiles to resource-rich countries such as Russia and the Middle East were strong, but
exports to the United States and Europe started to decline.
In foreign exchange markets, the Japanese yen fluctuated within a limited range against the U.S. dollar,
but appreciated sharply against the Euro after reaching a record low against the currency in July 2008.
The Japanese and global economic environment is unstable, due to the global economic downturn
caused by the turmoil in the financial and capital markets, the fall in international commodity prices and
the rapid appreciation of the Japanese yen. These trends and their impact on the real economy would
spread further in the period of this fiscal year.
4
2. OPERATING RESULTS, FINANCIAL CONDITION AND ETC.
BUSINESS PERFORMANCE OVERVIEW
Mitsui and its subsidiaries posted consolidated net income of ¥240.5 billion, ¥11.4 billion lower than the
¥251.9 billion recorded in the corresponding six-month period of the previous fiscal year (“previous
interim period”). This resulted from the following factors. The Mineral & Metal Resources and Energy
Segments posted higher gross profit, equity in earnings of associated companies—net (after income tax
effect) and dividend income, reflecting continued rising prices of related commodities and increases in
production volumes. The Machinery & Infrastructure Projects and Americas Segments also recorded
steady improvements in net income. On the other hand, the Consumer Service & IT Segment performed
unfavorably overall, mainly due to write-downs of inventories in the residential housing business in Japan.
Furthermore, due to the sharp decline in the equity markets, the Group recorded impairment losses of
¥24.7 billion, including those on listed securities such as shares in Mitsui Chemicals, Inc. (Japan) (“Mitsui
Chemicals”). The main factor behind the decline in net income compared to the previous interim period
was the recording of substantial one-off gains on the sale of assets, amounting to approximately ¥93.0
billion in total, in the previous interim period.
FINANCIAL CONDITION
Total assets as of September 30, 2008 were ¥9.7 trillion, an increase of ¥0.2 trillion compared to March
31, 2008, primarily because of higher commodity prices. Investments and plant, property and equipment
(“PPE”) were level with March 31, 2008, with additional investment in Valepar S.A.* (Brazil) (“Valepar”)
and capital expenditure for various expansions in the Mineral & Metal Resources and Energy Segments
offset by the impact of lower stock prices on Japanese stock exchanges and the impact of the
appreciation of the Japanese yen on overseas investments and PPE holdings of overseas subsidiaries.
As of September 30, 2008, shareholders equity remained level with March 31, 2008 at ¥2.2 trillion, with
an increase in retained earnings offset by the impact of foreign exchange rates and stock prices. The Net
Debt-to-Equity Ratio (“Net DER”) was 1.32 times, partly as a result of an increase in interest-bearing debt. *Valepar is the holding company for Brazilian mining company, Companhia Vale do Rio Doce S.A. (“Vale”).
CASH FLOW
Net cash provided by operating activities for the six-month period ended September 30, 2008 was ¥61.9
billion, reflecting, despite steady growth in operating income, a net increase of ¥253.3 billion in Mitsui’s
cash outflow due to increased operating assets less liabilities, including increased inventories and
derivative assets. Net cash used in investing activities was ¥191.5 billion, mainly due to investments for
expansions of projects in the Mineral & Metal Resources and Energy Segments. As a result, free cash
flow, the sum of these two categories, was a net outflow of ¥129.6 billion.
1 EXECUTIVE SUMMARY
5
GROSS PROFIT Gross profit for the six-month period ended September 30,
2008 was ¥628.7 billion, an increase of ¥150.2 billion
compared to the previous interim period. This was due to the
following factors. The Energy Segment recorded substantially
higher profit, which was mainly attributable to solid
performance by oil and gas producing business and coal
business, reflecting continued high prices in the market and
additional production. The Mineral & Metal Resources
Segment also reported higher profit, reflecting higher iron ore
prices.
In addition, the Americas Segment, automotive and other machinery businesses, as well as the Iron &
Steel Products and Chemical Segments showed solid performance, reflecting a favorable economic
environment mainly in emerging economies, despite the slowdown seen since this summer.
OPERATING INCOME Operating income* for the six-month period ended September
30, 2008 was ¥310.8 billion, an increase of ¥131.3 billion
compared to the previous interim period. Factors contributing to
this substantial increase included the large increase in gross
profit noted above, which was partly offset by increases in
selling, general and administrative expenses including higher
expenses pertaining to scale expansions in line with the merger
of energy-business subsidiaries and increases in personnel
costs in Logistics & Financial Markets and Machinery &
Infrastructure Projects Segments. * Operating income = gross profit - selling, general and administrative expenses - provision for doubtful receivables
EQUITY IN EARNINGS OF ASSOCIATED COMPANIES—NET (AFTER INCOME TAX EFFECT) Equity in earnings of associated companies—net (after income tax effect) for the six-month period
ended September 30, 2008 was ¥85.9 billion, an increase of ¥13.5 billion compared to the previous
interim period. This was attributable to the following factors. Earnings increased at Robe River Mining
Company Pty. Ltd. (Australia), reflecting an increase in iron ore prices, and Compania Minera Dona
Ines de Collahuasi SCM (Chile) (“Collahuasi”), reflecting an increase in copper prices and additional
production.
2 RESULTS OF OPERATIONS : Key items of consolidated income
6
Furthermore, overseas power producing businesses recorded
mark-to-market evaluation losses on power contracts,* but
these losses were lower than in the previous interim period.
Meanwhile, although the rise in iron ore prices was a factor
contributing to the increase, earnings were lower at Valepar, due
to a sharp drop in nickel prices and the appreciation of the
Brazilian real against the U.S. dollar . * We recorded mark-to-market evaluation losses, based on wholesale
power market conditions, with respect to power contracts entered into for
the purpose of fixing cash inflows from power sales.
NET INCOME
Net income for the six-month period ended September 30, 2008
was ¥240.5 billion, ¥11.4 billion lower than in the previous
interim period. In addition to the higher operating income and
equity in earnings of associated companies—net (after income
tax effect) outlined above, factors contributing to net income
included the following:
Dividend income for the six-month period under review was ¥38.9 billion, ¥10.5 billion higher than in
the previous interim period. This included dividends from LNG projects in the Middle East and the
receipt of dividends for the first time from an LNG project in Equatorial Guinea which started
commercial shipments in May 2007.
Loss on write-down of securities increased by ¥12.0 billion to ¥24.7 billion. The write-downs were
recorded mainly with respect to holdings of listed securities and resulted from the sharp fall in equity
markets in the six-month period under review.
Gain on sales of securities was ¥18.5 billion, ¥32.5 billion lower than in the previous interim period,
reflecting the major divestitures in the Mineral & Metal Resources and Energy Segments in the previous
interim period, such as the sale of part of the Group’s stake in the Sakhalin II project, as well as its whole
stake in Brazilian iron ore business Empreendimentos Brasileiros de Mineracao S.A. (“EBM”) and Indian
iron ore producer Sesa Goa Limited (“Sesa Goa”). Income from discontinued operations—net (after
income tax effect) was nil, a decrease from ¥65.3 billion in the previous interim period.
7
Iron & Steel Products: Net income for the six-month period ended September 30, 2008 was ¥9.3
billion, ¥2.6 billion lower than in the previous interim period. The small decline in net income was
attributable to lower gains on sales of securities and the recording of write-downs of listed securities.
These factors offset robust overall sales of steel products in Japan as well as robust sales to the Asian
market by Regency Steel Asia Pte. Ltd. (Singapore) under tight market conditions, despite the
slowdown seen after the summer.
Mineral & Metal Resources: Net income for the six-month period decreased ¥26.2 billion to ¥92.0
due to rises in iron ore prices, while Collahuasi also
contributed to net income reflecting rises in copper
prices. Furthermore, increases in prices of other
metal and mineral resources such as iron and steel
scrap and ferrous alloys also contributed to the
increase in gross profits. Operating income was
also higher, reflecting the increase in gross profit,
but net income decreased from the previous interim period as a result of the sale of the Group’s entire
stake of EBM and Sesa Goa in the previous interim period.
Machinery & Infrastructure Projects: Net income for the six-month period was ¥17.1 billion, an increase of ¥4.1 billion. Automotive- and shipping-related business was sound, supported by favorable
global markets, and was not impacted much by the economic recession beginning this summer. Profit
from infrastructure projects-related business increased, due to contributions from gas distribution
Net Income by Operating Segment
3 RESULTS BY OPERATING SEGMENT
From April 1, 2008, some U.S. subsidiaries of fertilizer-related businesses previously included in Chemical Segment and automotive-related businesses previously included in Machinery & Infrastructure Projects Segment were transferred to the Americas Segment, in order to conduct management that focuses more on regional strategies. The operating segment information for the six-month period ended September 30, 2007 has been restated to conform to the current year presentation.
8
business in Brazil and plant business, which offset a decrease in profit at leasing subsidiaries in
Europe due to remodeling and overhaul of rolling stock. Lower mark-to-market evaluation losses on
power contracts at Australian and U.K. power producing businesses also contributed to the increase in
net income.
Chemical: Net income for the six-month period was ¥4.0 billion, a decrease of ¥6.9 billion. Profit from ammonia business increased, driven by rising prices and higher sales volumes, while crop protection
chemicals and fertilizer businesses performed strongly, in keeping with rising global demand for
agricultural products. However, net income decreased as a result of large write-downs of securities,
including shares in Mitsui Chemicals.
Energy: Net income for the six-month period was ¥83.1 billion, an increase of ¥10.6 billion. Profit increased from oil and gas production businesses, due to substantial increases in the price of oil and
higher production volumes resulting from factors including the start of production at the Tui oil field in
New Zealand. Australian coal businesses also made major contributions, supported by rising coal
prices. Furthermore, dividend income from LNG projects increased, and profit on the sale of shares in
Kyushu Oil Co., Ltd. (Japan) (“Kyushu Oil”) also contributed. These factors offset the absence in the
period under review of the major sales of interests in the Sakhalin II project and Wandoo Petroleum Pty.
Ltd. (Australia) in the previous interim period.
Foods & Retail: Net income of ¥5.4 billion was recorded for the six-month period, a gain of ¥0.3 billion from the previous interim period. Raw materials-related businesses trended positively, with
strong performances from soybean and wheat transactions, while broiler business was robust, driven
by increases in product prices. Furthermore, in a challenging environment characterized by a growing
tendency toward price rises to pass on higher crude oil and raw materials costs, logistics and retail
businesses in Japan improved their profitability by reorganizing underperforming businesses and other
means. Mitsui Norin Co., Ltd. (Japan) reported a decrease in net income due to the weaker market of
raw materials of beverages in addition to a loss on write-down on inventories. The slight increase in net
income partly reflected the loss on the write-down of shares of Seven & i Holdings Co., Ltd. (Japan) in
the previous interim period.
Consumer Service & IT: Net loss for the six-month period was ¥4.7 billion, a decrease of ¥12.8 billion compared to net income of ¥8.1 billion in the previous interim period. Gross profit increased at some
IT-related businesses, but profit declined in Consumer Service, impacted by lower sales and a loss on
write-down of inventories in the residential condominium business, while the economic slowdown in
The average crude oil contract price used
by oil and gas producing subsidiaries and
associated companies in this operating
segment for the interim period under review
was US$101 per barrel, US$38 higher than
in the previous interim period. JCC (Japan
Crude Cocktail) is the average CIF price for
oil imported into Japan.
9
Japan led to generally unfavorable performance in apparel and brand-related business and
lifestyle-related business. The substantial decrease in net income also reflected a loss on write-down
of securities, mainly with respect to listed securities.
Logistics & Financial Markets: Net income for the six-month period was ¥1.2 billion, an increase of ¥0.9 billion. Commodity trading was robust in highly volatile commodity markets, mainly driven by
Mitsui & Co. Energy Risk Management Ltd., an energy derivatives subsidiary in the United Kingdom.
Other factors contributing to the slight increase in net income, despite the recording of equity in loss
from investment in NPF-Harmony (Japan), an investment fund, were a gain from the exchange of
shares in Mitsui Leasing & Development, Ltd. (Japan) for shares in JA Mitsui Leasing, Ltd. (Japan) as
well as the recording of a loss on write-down of shares of Central Finance Co., Ltd. (Japan) in the
previous interim period.
Americas: Net income for the six-month period was ¥13.9 billion, an increase of ¥10.8 billion. Profit increased at Novus International Inc., a U.S. subsidiary that manufactures and sells animal feed
additives, due to higher sales volumes and higher prices, supported by global strong demand for feed
additives. Steel Technologies Inc. (“Steel Technologies”), a U.S. steel products subsidiary, posted
higher profit, mainly reflecting increases in steel product prices. Other subsidiaries also contributed to
the increase in net income, supported by robust demand for tubular pipes for the oil and gas industry.
Profits increased at MBK Real Estate, LLC, a U.S. residential housing and real estate subsidiary, as
the company posted only a small loss on write-down of residential housing inventory compared to the
¥4.1 billion such loss it recorded in the previous interim period, despite conditions remaining difficult in
the U.S. residential housing market. In addition to the above factors, interest expense, net of interest
income, decreased at Mitsui & Co. (U.S.A.), Inc. and its subsidiaries resulting from a decline in U.S.
dollar interest rates.
Europe, the Middle East and Africa: Net income for the six-month period was ¥2.9 billion, a decrease of ¥0.7 billion. The decrease was attributable to factors such as higher personnel expenses,
which offset the gain at Mitsui & Co. France S.A.S. from the sale of its office building.
Asia Pacific: Net income for the six-month period was ¥24.8 billion, an increase of ¥12.4 billion. The main factor behind the increase is higher income from the interest held by Mitsui & Co. (AUSTRALIA)
Ltd. in iron ore and coal producing subsidiaries in Australia.
Total assets as of September 30, 2008 were
¥9,717.8 billion, an increase of ¥180.0 billion from
March 31, 2008. Of this, current assets were
¥5,223.8 billion, an increase of ¥165.7 billion. This
was mainly attributable to increases in inventories
and derivative assets pertaining to the Financial
Markets businesses and energy-related business
in the Americas Segment.
4 FINANCIAL CONDITION OF THE GROUP : Key items from the consolidated balance sheets
10
Current liabilities as of September 30, 2008 stood at ¥3,639.0 billion, an increase of ¥197.4 billion. This
was primarily due to increases in current maturities of long-term debt at Mitsui, and increases in
short-term debt at domestic and overseas financial subsidiaries. As a result, working capital, which is
current assets minus current liabilities, as of September 30, 2008 was ¥1,584.8 billion, a decrease of
¥31.7 billion.
The sum of total non-current assets (namely, investments and non-current receivables, property and equipment—at cost, etc.) was ¥4,494.0 billion as of September 30, 2008, an increase of ¥14.2 billion.
This figure was broadly level with March 31, 2008, as active investments for expansions of projects in the
Mineral & Metal Resources and Energy Segments were offset by the impact of falling stock prices and the
appreciation of the Japanese yen. A breakdown of principal items is as follows:
Total investments and non-current receivables as of September 30, 2008 was ¥3,235.1 billion, a decrease of ¥2.2 billion. Within this category, investments in and advances to associated companies
totaled ¥1,423.1 billion, ¥90.1 billion more than on March 31, 2008. Major expenditures for the
six-month period under review were: an additional investment of ¥78.4 billion in Valepar; further
acquisition of shares in Sims Group Limited (“Sims Group”), an Australian metal recycler, for ¥23.0
billion; and in MED3000 Group, Inc. (“MED3000 Group”), a U.S. based management and technology
service provider for the healthcare industry, for ¥6.5 billion. Equity in earnings of associated
companies (before income tax effect) increased, supported by strong performances at these
companies in the six-month period under review, while the main factor for decrease was foreign
currency translation adjustment, given the appreciation of the Japanese yen.
Other investments were ¥1,181.5 billion, a decrease of ¥100.0 billion. Major increases included an
additional investment of ¥7.0 billion (net of capital redemption) in the Sakhalin II project. On the other
hand, the fair value of listed securities decreased by ¥102.4 billion, due to the decline in the equity
markets.
Property and equipment—at cost as of September 30, 2008 was ¥1,041.9 billion, an increase of ¥25.6 billion. Significant items contributing to this increase were iron ore businesses in Australia and
oil and gas developments and expansions in various regions.
Long-term debt as of September 30, 2008 was ¥2,862.3 billion, a decrease of ¥82.1 billion compared to
March 31, 2008, with the decrease mainly occurring at Mitsui. Net interest-bearing debt (interest-bearing
debt minus cash and cash equivalents and time deposits) as of September 30, 2008 was ¥2,936.5 billion,
an increase of ¥162.5 billion. The Net DER was 1.32 times, an increase of 0.05 percentage points.
Shareholders’ equity as of September 30, 2008 was ¥2,232.2 billion, an increase of ¥48.5 billion. This
increase was primarily due to a ¥198.8 billion increase in retained earnings, a net decrease in foreign
currency translation adjustments due to the depreciation of the Australian dollar and the Brazilian real
against the Japanese yen since the end of March 2008, and a net decrease in unrealized holding gains
on available-for-sale securities.
11
As a result, the ratio of shareholders’ equity to total assets as of September 30, 2008 was 23.0%, 0.1
percentage points higher than as of March 31, 2008. Return on equity (“ROE”) during this interim period
on an annualized basis was 21.8%.
CASH FLOW FROM OPERATING ACTIVITIES Net cash provided by operating activities for the six-month period ended September 30, 2008 was ¥61.9
billion, a decrease of ¥63.3 billion from the previous interim period. The Group posted strong net income
of ¥240.5 billion for the period, led by robust performance in the Mineral & Metal Resources and Energy
Segments, but this was offset by an increase in cash outflows, reflecting an increase in operating assets
such as inventories and derivative assets.
CASH FLOW FROM INVESTMENT ACTIVITIES Net cash used in investment activities for the six-month period ended September 30, 2008 was ¥191.5
billion, an increase in net expenditure of ¥249.3 billion from the net cash of ¥57.8 billion provided from
such activities in the previous interim period. The primary factors contributing to this outcome were as
follows:
The net outflow of cash that corresponded to investments in and advances to associated companies was ¥95.3 billion, which included additional investments of ¥78.4 billion in Valepar
and further acquisition of shares in Sims Group for ¥23.0 billion.
The net inflow of cash that corresponded to other investments (net of acquisitions of other investments) was ¥14.6 billion. The main expenditure was an additional investment of ¥7.0
billion (net of capital redemption) in the Sakhalin II project, while the main inflow was proceeds of
¥8.2 billion from the sale of shares in Kyushu Oil.
The net outflow of cash that corresponded to purchases of property leased to others and property and equipment (net of sales of those assets) was ¥109.0 billion. This was mainly due to
iron ore and coal mining businesses in Australia and oil and gas developments in various
regions.
As a result, free cash flow, the sum of cash flow from operating activities and cash flow from investment
activities, was a net outflow of ¥129.6 billion.
CASH FLOW FROM FINANCING ACTIVITIES Net cash provided by financing activities was ¥40.8 billion, an increase in net cash provided of ¥227.6
billion compared with the net cash outflow of ¥186.8 billion in the previous interim period. Cash inflow
from the borrowing of short-term debt mainly at overseas subsidiaries was ¥92.6 billion, which offset cash
outflow of ¥9.1 billion due to the repayment of long-term debt and payments of cash dividends of ¥41.8
billion.
5 CASH FLOWS : Key items of consolidated cash flows
12
3. PROGRESS ON MEDIUM-TERM MANAGEMENT OUTLOOK
We announced Medium-Term Management Outlook in May 2006, based on a company-wide consideration of the kind of business models that we should seek to develop over the next three to five
years, namely the period from 2009 to 2011. The key elements of the approach outlined in this plan are:
Building a business portfolio that meets the needs of our stakeholders, including shareholders,
customers and society.
Leveraging business engineering capabilities across Mitsui and its subsidiaries and optimizing
resource allocation.
Prioritizing the development of human resources. In this respect we intend to build on our existing
values of challenge and opportunity and freedom and open-mindedness with additional emphasis on
fairness, humbleness and compliance. We intend to form and foster a diverse pool of capable
personnel.
The four key strategies of the Medium-Term Management Outlook are:
(i) Development of strategic business portfolio
(ii) Evolution of business models leveraging business engineering capabilities
(iii) Implementation of global strategies
(iv) Reinforcing the management framework to support growth
Of these strategies, the development of a strategic business portfolio is the most directly connected to
our business results, financial position and cash flow for the six-month period ended September 30, 2008,
and we are implementing the following policies with regard to this strategy.
We have developed key policies based on dividing up the Group’s business into four areas, as outlined
below. Mineral Resources & Energy
(1) Complete the development of large-scale projects such as the Sakhalin II project
and the Enfield Oil Field. Expand existing projects such as the LNG project in
Western Australia and iron ore and coal production in Australia
(2) Ensure the liquidity of our equity production interests and carry out recycling
(3) Invest selectively in emerging regions and new business domains
Global Marketing Networks (particularly steel
(1) Actively invest in our operating base with the objective of strengthening our
various logistics and IT capabilities and focus allocation of human resources to
growth fields
(2) Strengthen partnerships with quality customers and evolve our SCM capabilities
1 OVERVIEW
13
products, machinery and chemical products)
(3) Strengthen initiatives in growth region Asia and the automotive, IT and energy
business fields
Consumer Services
(1) Pursue initiatives in media and information, healthcare and medical, and senior
living industries
(2) Develop new consumer-oriented businesses and strengthen related logistics
business
Infrastructure (1) Develop business portfolio positioning power generation, water supply, energy
and transportation as strategic industrial fields
(2) Pursue synergies with other business areas
Under the coordination of the Portfolio Management Committee that we established in April 2006, we will further refine our investment evaluation criteria, and seek to recycle existing investments, by
reviewing their viability and taking into account the need to generate cash flow for new investments.
Furthermore, accompanying a review of our business portfolio, we will allocate and shift human resources
from a group-wide perspective in a more dynamic fashion.
Quantitative image 3-5 years ahead (2009-2011) in the Medium-Term Management Outlook
As of May 2006, we envisaged achieving the
parameters over the period from 2009 to 2011 as
illustrated in the chart on the right, based on the
following assumptions, by implementing the four key
strategies on the Medium-Term Management
Outlook:
・ Looking ahead towards 2009-2011, risks in the operating environment included political,
economic and environmental factors.
・ Notwithstanding these risks, we believed that favorable operating environment—with
simultaneous growth in different regions of the
world, and strong upstream markets for mineral
resources, energy and materials—was likely to
continue.
14
Development of strategic business portfolio Progress on investment plans and key policies in each business area During the years ended
March 31, 2007 and 2008,
we actively executed
investments and loans,
and in our investment and
loan plan for the fiscal
year ending March 31,
2009, we forecast a
similar level of new
investments and loans,
with total cash investment
of ¥700.0 billion. Of this
figure, we expect Mineral
Resources & Energy to
account for ¥350.0 billion,
mainly for expansion of
existing projects.
The remainder includes investments of ¥150.0-200.0 billion in Global Marketing Networks,
¥50.0-100.0 billion in Consumer Services and ¥100.0 billion in Infrastructure Projects. At the same
time, we forecast a total of ¥270.0 billion in asset divestitures during the period.
In the six-month period ended September 30, 2008, we executed new investments and loans of
approximately ¥320.0 billion. Concurrently, we have been focusing on divestitures of outstanding
investments and fixed assets, and collected approximately ¥120.0 billion.
We made the following progress in each of the four business areas presented in our Medium-Term
Management Outlook.
1. MINERAL RESOURCES & ENERGY BUSINESS AREA We continued to focus on projects already under development
as well as expansion of existing projects. The work-over
program at the Enfield oil field in Australia was completed in July
2008, the development work was completed and commercial
production started at the Vincent oil field adjacent to the Enfield
2 PROGRESS ON KEY ISSUES IN MEDIUM-TERM MANAGEMENT OUTLOOK
Northwest Shelf LNG JV in Australia
15
oil field in August 2008. Including investments for these two oil fields, we executed total capital
investments of ¥40.0 billion in the oil and gas business. At the same time, we steadily increased our
portion of production volumes for oil and gas, such as through the commencement of production of the
fifth train of the Northwest Shelf LNG JV in September 2008. We also invested an additional ¥15.3 billion
in the Sakhalin II project to be used for proceeding with development work on the project.
In July 2008, we made an additional investment of ¥78.4
billion in Valepar, which has controlling interest at Vale of
Brazil, for the purpose of increasing capital at Vale so
that the company could increase its iron ore and
non-ferrous metal production capacity. We invested
¥23.7 billion and ¥7.0 billion, respectively, in Australian
iron ore and coal mining businesses, as part of our plan
to increase production capacity. We also invested ¥23.0
billion to acquire additional shares in metal recycler
Sims Group during August and September 2008.
2. GLOBAL MARKETING NETWORKS BUSINESS AREA We took further steps to strengthen our multi-functional global operating network in the growth region of
Asia and the strategic business area of automotives.
In the previous fiscal year, we established the Automotive Strategy Department, as part of our decision to
implement a companywide cross-divisional strategy encompassing cooperation from multiple business
units, and started to pursue a variety of initiatives along the automobile value chain, in areas ranging
from parts procurement through to retail financing. We rolled out in India the successful retail financing
business model pursued in partnership with Yamaha Motor Co., Ltd. (Japan) (“Yamaha”) in Indonesia,
acquiring a 30% ownership interest in a motorcycle manufacturing subsidiary of Yamaha in India, while a
retail finance company for the sale of Yamaha motorcycles in India, in which we have a 64% ownership
interest, started business in April 2008. We are also working on the development of a carport in Turkey.
In the steel products business, we took steps to enhance profitability, by consolidating all of our North
American steel sheets and plates business into Steel Technologies of the U.S., which we acquired in
June 2007.
Furthermore, as part of our drive to improve management efficiency, we accelerated the consolidation
and reorganization of domestic subsidiaries, consolidating four domestic steel marketing and distribution
subsidiaries into Mitsui & Co. Steel Ltd. in April 2008. We also engaged in similar reorganization activities
in chemical businesses.
3. CONSUMER SERVICES BUSINESS AREA We are continuing to build our operations in promising new business domains. In medical and healthcare
business, one of our priority areas, we acquired a 47% interest in MED3000 Group in July 2008 for ¥6.5
The Vale iron ore mine in Brazil
16
billion. We aim to expand the management service business for physicians and medical institutions in the
United States and elsewhere throughout the world. In the foods and retail field, we have been taking
measures to improve the performance and competitiveness of domestic businesses such as MITSUI
FOODS CO., LTD. (Japan), and proceeding with investments to secure overseas food sources.
4. INFRASTRUCTURE PROJECTS BUSINESS AREA Our efforts were directed at selectively investing in superior project
opportunities in priority areas. In overseas power generation
business, we further strengthened our strategic alliance with U.K.
independent power producer International Power plc. (“IPR”), and
together with IPR, took steps to strengthen the financial position of a
subsidiary of U.K. power producer IPM Eagle LLP, our joint venture
with IPR. In July 2008, we acquired a Mexican water and
wastewater treatment company Atlatec Holdings, S.A. de C.V.,
formerly Earth Tech Mexican Holdings S.A. de C.V., jointly with Toyo
Engineering Corporation (Japan). We are also expanding our rolling
stock leasing business in the Americas and Europe.
Our Medium-Term Management Outlook originally set the achievement of positive free cash flow in the
fiscal year ending March 31, 2009 as a key future challenge. For the fiscal year ending March 31, 2009,
we expect cash flow from operating activities to be positive, resulting in free cash flow being break-even
or marginally positive.
Continuous review of business portfolio based on Mitsui’s business strategy
Twice a year, Mitsui’s management examines each business unit’s strategic portfolio development,
including asset recycling, referring to key performance indicators at subsidiaries, associated companies
and other investments, as well as Mitsui’s guidelines for investment in and withdrawal from business
operations. The Portfolio Management Committee develops and maintains the relevant data and
guidelines. In the six-month period under review, particularly important initiatives were as follows:
In the fiscal year ended March 31, 2008, major emphasis was put on the companywide reallocation of human resources. Plans were made to reallocate 100 junior and mid-level staff within Mitsui to focus
areas and this was implemented in April, 2008. In the current fiscal year we are monitoring the progress
of this reallocation and following up as appropriate. We will continue to pursue policies for reallocating
staff within the company.
We have decided to pursue a cross-divisional strategy encompassing cooperation among various business units with respect to certain key products and services. Following on from the previous fiscal
year, during which we created new divisions in automotive-related and medical and healthcare business,
in the current fiscal year we established dedicated divisions to pursue agri-food business and solar
business.
Atlatec waste water treatment
plant in Mexico
17
Net income for the six-month period under review was ¥240.5 billion. For the year ending March 31, 2009,
we forecast net income of ¥460.0 billion. Our forecasts for key items in the consolidated statement of
income are as follows.
(Billions of yen) Current full-year
forecast Forecast at start of
year Increase (Decrease)
Gross profit
1,160.0
1,080.0
80.0
Operating income
540.0
470.0
70.0
Equity in earnings of associated companies
200.0
220.0
(20.0)
Net income
460.0
460.0
0
Foreign exchange rates for the six month period ending March 31, 2009 are assumed to be ¥100/US$,
¥70/AU$ and ¥48/BRL, while average rates for the six-month period ended September 30, 2008 were
¥106.23/US$, ¥96.65/AU$ and ¥63.55/BRL. Also, we assume that the oil price will be US$68/barrel
through March 31, 2009, resulting in an average price of US$104/barrel of Japan Crude Cocktail (JCC)
applicable to our financial results for the six-month period ending March 31, 2009. We forecast gross
profit of ¥1,160.0 billion, ¥80.0 billion higher than our original forecast. Although the real economy has
decelerated, caused by the financial crisis, and commodity prices have declined sharply since this
summer, we expect higher prices in Mineral Resources & Energy than our original forecast, as iron ore
and coal prices are contracted on an annual basis and the oil price is reflected in our financial results with
a certain time lag. We project equity in earnings of associated companies—net (after income tax effect) of
¥200.0 billion, ¥20.0 billion lower than our original forecast, taking into consideration impairment losses
on listed securities and appreciation of the Japanese yen against the Australian dollar and Brazilian real.
We anticipate a loss of ¥25.0 billion in gains/losses from the sale/impairment of securities, PPE, and other
assets, ¥40.0 billion lower than our original forecast for a gain of ¥15 billion. As a result of the above, we
forecast net income of ¥460.0 billion for the year ending March 31, 2009, the same as our original
forecast.
Following the bankruptcy of one of the largest investment banks in the United States in September 2008,
equity markets fell sharply, and have since been highly volatile and at very low levels. Should these levels
continue for a long time, there is a risk of additional impairment losses on listed securities. We will also
closely monitor the impact of the appreciation of the Japanese yen, further declines in commodity prices,
and economic slowdown, and steadily proceed with the implementation of the business strategies
outlined in the Medium-Term Management Outlook.
3 FORECASTS FOR THE YEAR ENDING MARCH 31, 2009
18
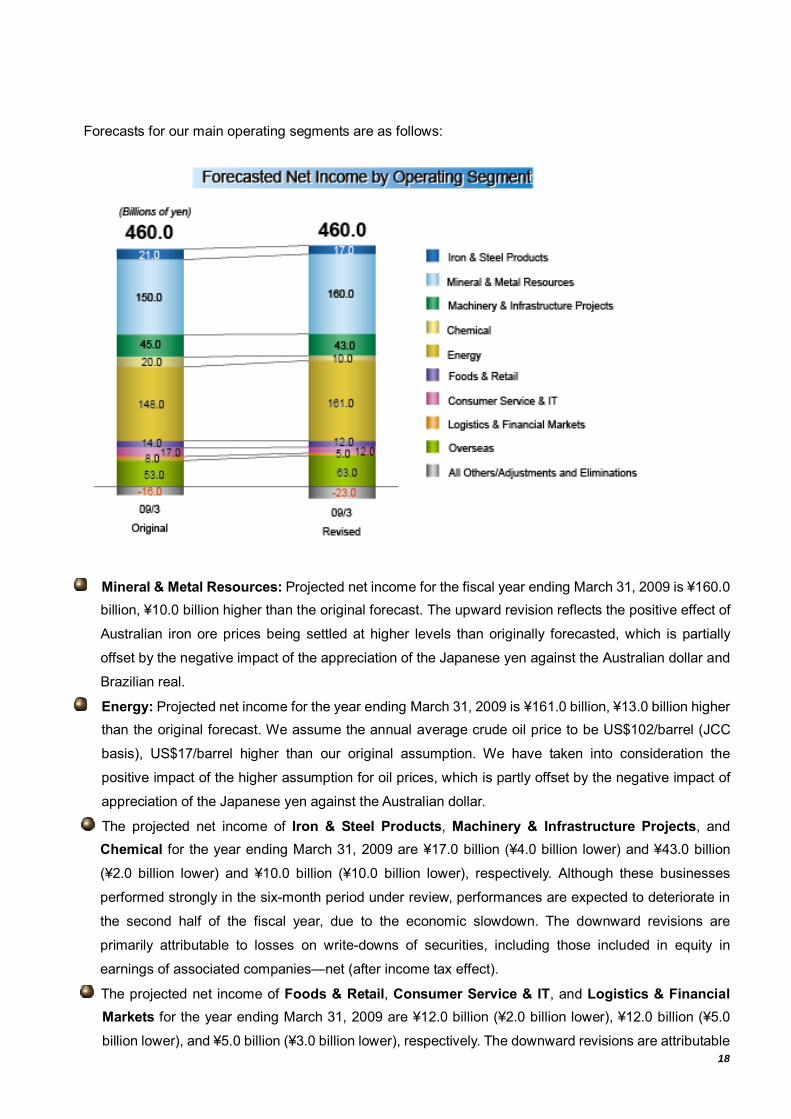
Forecasts for our main operating segments are as follows:
Mineral & Metal Resources: Projected net income for the fiscal year ending March 31, 2009 is ¥160.0 billion, ¥10.0 billion higher than the original forecast. The upward revision reflects the positive effect of
Australian iron ore prices being settled at higher levels than originally forecasted, which is partially
offset by the negative impact of the appreciation of the Japanese yen against the Australian dollar and
Brazilian real.
Energy: Projected net income for the year ending March 31, 2009 is ¥161.0 billion, ¥13.0 billion higher than the original forecast. We assume the annual average crude oil price to be US$102/barrel (JCC
basis), US$17/barrel higher than our original assumption. We have taken into consideration the
positive impact of the higher assumption for oil prices, which is partly offset by the negative impact of
appreciation of the Japanese yen against the Australian dollar.
The projected net income of Iron & Steel Products, Machinery & Infrastructure Projects, and Chemical for the year ending March 31, 2009 are ¥17.0 billion (¥4.0 billion lower) and ¥43.0 billion
(¥2.0 billion lower) and ¥10.0 billion (¥10.0 billion lower), respectively. Although these businesses
performed strongly in the six-month period under review, performances are expected to deteriorate in
the second half of the fiscal year, due to the economic slowdown. The downward revisions are
primarily attributable to losses on write-downs of securities, including those included in equity in
earnings of associated companies—net (after income tax effect).
The projected net income of Foods & Retail, Consumer Service & IT, and Logistics & Financial Markets for the year ending March 31, 2009 are ¥12.0 billion (¥2.0 billion lower), ¥12.0 billion (¥5.0
billion lower), and ¥5.0 billion (¥3.0 billion lower), respectively. The downward revisions are attributable
19
to poor conditions in domestic consumer markets, and impairment losses recognized in the six-month
period ended September 30, 2008.
The projected net income for Americas for the year ending March 31, 2009 is ¥19.0 billion, ¥10.0 billion higher than the original forecast. The upward revision is attributable to continued contributions to
results from feed additive manufacturing and sales business and energy business, offsetting the
inclusion of losses on derivative contracts at a Brazilian subsidiary that manufactures and sells
fertilizers. The projected net income for Europe, the Middle East and Africa and Asia Pacific are
1. The figures shown in this table have been prepared on the basis of accounting principles generally accepted in the United States of America (“U.S. GAAP”). Total Trading Transactions is a voluntary disclosure and represents the gross transaction volume of the nominal aggregate value of the sales contracts in which Mitsui & Co., Ltd. and its subsidiaries (collectively “the Group”) act as principal and transactions in which the Group serves as agent. Total Trading Transactions is not meant to represent sales or revenues in accordance with U.S. GAAP.
2. In accordance with Statement of Financial Accounting Standards No. 144, “Accounting for the Impairment or Disposal of Long-Lived Assets,” the prior year figures relating to discontinued operations have been reclassified.
3. Figures less than ¥1 million and figures less than ¥1/100 (in the case of Net Income per Share) are rounded.
22
1. PRINCIPAL GROUP BUSINESS (AS OF SEPTEMBER 30, 2008) The Group is engaged in its business through the product segments comprised of the business units of
the Head Office and the regional segments comprised of overseas offices and subsidiaries. Along with its
domestic and overseas subsidiaries and associated companies, the Group is engaged in the sale, import,
export, international trading and manufacturing of various products from the Iron and Steel Products,
Mineral and Metal Resources, Machinery and Infrastructure Projects, Chemical, Energy, Foods and Retail,
and Consumer Service and IT business areas. The Group also provides a diversified range of services
including transport and financial services in addition to the development of natural resources and
investment in operations.
2. PRINCIPAL GROUP OFFICES (AS OF SEPTEMBER 30, 2008) Mitsui has 11 domestic offices and branches in Japan in addition to the Head Office, and 145 trading
subsidiaries overseas and branches, including the principal entities outlined below.
Domestic: Head Office Chiyoda-ku, Tokyo
Offices and Branches Sapporo Office, Tohoku Office (Sendai), Nagoya Office,
Note: For information regarding the overseas offices, subsidiaries and associated companies, including the above-listed entities and important subsidiaries and associated companies, please refer to page 24-25, Principal Subsidiaries.
3. SHARES OF MITSUI & CO., LTD. (AS OF SEPTEMBER 30, 2008)
Number of shares authorized: 2,500,000,000 shares
Number of shares outstanding: 1,824,912,274 shares (including 3,703,404 treasury
shares)
Number of shareholders: 109,521 shareholders
PART II: CORPORATE OUTLINE
23
4.GROUP EMPLOYEES Operating segment Number of
Employees as of September 30,
2008
Number of Employees as
of March 31, 2008
Change in Number of Employees
Iron & Steel Products 2,412 2,255 +157
Mineral & Metal Resources 573 757 (184) Machinery & Infrastructure Projects 13,827 13,177 +650 Chemical 2,908 3,489 (581)
Energy 1,332 1,633 (301) Foods & Retail 5,888 6,008 (120) Consumer Service & IT 4,504 4,540 (36)
Europe, the Middle East and Africa 1,360 1,299 +61 Asia Pacific 2,303 2,196 +107
Total 44,166 42,621 +1,545
Notes: 1. The above employee figures do not include temporary staff, seconded or part-time staff. 2. Of the 44,166 employees as of September 30, 2008, 5,906 were employed by the Company, (37 more than at March 31, 2008).
24
5. PRINCIPAL SUBSIDIARIES
Subsidiary(S)/
Associated Company(A) Operating Segment
Common Stock Percentage owned by Mitsui
& Co., Ltd.
Main Business
Mitsui & Co. Steel Ltd. (Japan) (S)
Iron & Steel Products
¥2,400 million 100 Sales of iron and steel products
Mitsui Iron Ore Development Pty. Ltd. (Australia) (S)
Mineral & Metal Resources
A$20,000 thousand 100 (20)
Production and marketing of Australian iron ore
Valepar S.A. (Brazil) (A)
Mineral & Metal Resources
R$7,889,000 thousand 18.2 Investments in Brazilian natural resources company Vale
Mitsui Automotive Europe B. V. (Netherland) (S)
Machinery & Infrastructure Projects
Euro65,595 thousand 100 (40)
Investments in automobile businesses
IPM Eagle LLP (United Kingdom) (A)
Machinery & Infrastructure Projects
US$752,171 thousand 30 (30)
Investments in power generation business
Japan-Arabia Methanol Co., Ltd. (Japan) (S)
Chemical ¥5,000 million 55 Investments in methanol producing businesses in Saudi Arabian
Mitsui Sakhalin Holdings B.V. (Netherlands) (S)
Energy US$1,998,841 thousand 100 Investment in Sakhalin Energy Investment
Mitsui Oil Exploration Co., Ltd. (Japan) (S)
Energy ¥33,133 million 51.0 Exploration, development and production of oil and natural gas resources
Japan Australia LNG (MIMI) Pty. Ltd. (Australia) (A)
Energy A$369,050 thousand 50 (50)
Exploration, development and marketing of oil and natural gas
MITSUI FOODS CO., LTD. (Japan) (S)
Foods & Retail ¥12,031 million 99.9 Wholesale of food products
MIKUNI COCA-COLA BOTTLING CO., LTD.(Japan) (A)
Foods & Retail ¥5,407 million 34.7 Production and sale of soft drinks
QVC JAPAN INC.(Japan) (A)
Consumer Service & IT
¥11,500 million 40 TV shopping business
Mitsui Knowledge Industry Co., Ltd.(Japan) (S)
Consumer Service & IT
¥4,114 million 58.4 Development and sale of computer systems
JA MITSUI LEASING, LTD. (Japan) (A)
Logistics & Financial Markets
¥2,000 million 34.2 (0.6)
Leasing business
TRI-NET INC.(Japan) (S)
Logistics & Financial Markets
¥400 million 100 International integrated transportation business
Steel Technologies Inc. (United States) (S)
Americas US$1 thousand 100 (100)
Sale of steel products
1 PRINCIPAL SUBSIDIARIES AND ASSOCIATED COMPANIES (AS OF SEPTEMBER 30, 2008)
25
Notes: 1. The companies listed above are the major subsidiaries and associated companies of the main business segments. 2. The figures in brackets represent indirect ownership through other subsidiaries. 3. The figures for capital have been rounded. 4. JA MITSUI LEASING, LTD. was established as a 100% parent company of Mitsui Leasing and Development Ltd. through a share
transfer in April 2008.
The number of subsidiaries and associated companies as of September 30, 2008, along with the interim
periods of the last three years, is as follows: (Unit: companies)
Six-month period
ended September
30, 2005
Six-month period
ended September
30, 2006
Six-month period
ended September
30, 2007
Six-month period
ended September
30, 2008
Subsidiaries 383 377 359 334 Associated companies accounted for under the equity method
212 188 197 209
Note: Some of subsidiaries and associated companies report their financial statements with further consolidating their subsidiaries and
associated companies. The number of companies in the table do not include the latter, namely, those consolidated to other subsidiaries and associated companies.
Furthermore, from the interim period under review, those companies that are managed by overseas trading companies have not been
included with their managing company, and the date for the last three years has been updated and presented in the same way.
2 THE NUMBER OF SUBSIDIARIES AND ASSOCIATED COMPANIES
26
6. SENIOR COMPANY OFFICERS AND AUDITORS
*indicates a Representative Director
Notes: 1. Akishige Okada, Nobuko Matsubara, Ikujiro Nonaka and Hiroshi Hirabayashi are external Directors. 2. Ko Matsukata, Hideharu Kadowaki, Naoto Nakamura and Kunihiro Matsuo are external Corporate Auditors. Tasuku Kondo,
Satoru Miura and Motonori Murakami are full-time Corporate Auditors.
Name Title Principal position(s)/Areas overseen Nobuo Ohashi Chairman and Director Chairman, Governance Committee Shoei Utsuda* President and
Toshihiro Soejima* Director Motor Vehicles Business Unit; Marine & Aerospace Business Unit; First Consumer Service Business Unit; Second Consumer Service Business Unit; IT Business Unit
Motokazu Yoshida* Director Chief Information Officer; Corporate Staff Division (Information Strategic Planning Division, Corporate Planning & Strategy Division, CSR Promotion Division, Corporate Communication Division,); New Business Promotion; Environmental Matters
Ken Abe* Director Iron & Steel Products Business Unit; Infrastructure Projects Business Unit; Financial Markets Business Unit; Transportation Logistics Business Unit; Director, Mitsui & Co. (U.S.A), Inc.
Yoshiyuki Izawa* Director First Chemicals Business Unit; Second Chemicals Business Unit; Foods & Retail Business Unit; Domestic Offices and Branches; Director, Mitsui & Co. Europe Holdings PLC
Junichi Matsumoto* Director Chief Financial Officer; Chief Compliance Officer; Corporate Staff Division (Financial Planning Division, Accounting Division, Finance Division, Investment Administration Division, Credit Risk Management Division, Market Risk Management Division, First Business Process Control Division, Second Business Process Control Division, Third Business Process Control Division, Investor Relations Division)
Masami Iijima* Director Mineral & Metal Resources Business Unit; Energy Business Unit I; Energy Business Unit II
Seiichi Tanaka* Director Chief Privacy Officer; Corporate Staff Division (Secretariat, Corporate Auditor Division, Human Resources & General Affairs Division, Legal Division, Logistics Management Division); Business Continuity Plan Management; Director, Mitsui & Co. (Asia Pacific) Pte. Ltd.
Akishige Okada Director Advisor to Board of Sumitomo Mitsui Banking Corporation Chairman, Remuneration Committee
Nobuko Matsubara Director Chairman, Japan Institute of Workers’ Evolution
Ikujiro Nonaka Director Professor Emeritus, Hitotsubashi University Hiroshi Hirabayashi Director President, The Japan-India Association Tasuku Kondo Corporate Auditor Satoru Miura Corporate Auditor Motonori Murakami Corporate Auditor Ko Matsukata Corporate Auditor Honorary Advisor, Mitsui Sumitomo Insurance Company, Limited Hideharu Kadowaki Corporate Auditor Special Advisor & Senior Fellow, The Japan Research Institute,
Limited Naoto Nakamura Corporate Auditor Attorney at Law Kunihiro Matsuo Corporate Auditor Attorney at Law
1 DIRECTORS AND CORPORATE AUDITORS (AS OF NOVEMBER 1, 2008)
27
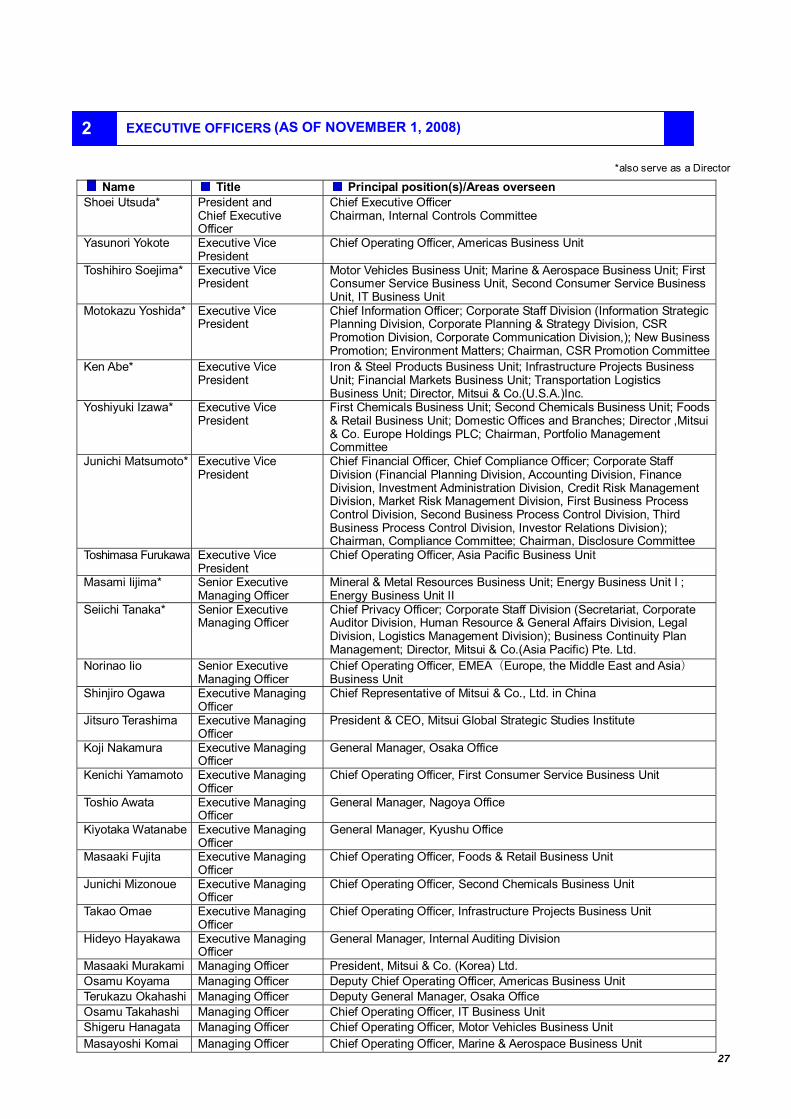
2 EXECUTIVE OFFICERS
*also serve as a Director
Name Title Principal position(s)/Areas overseenShoei Utsuda* President and
Motor Vehicles Business Unit; Marine & Aerospace Business Unit; First Consumer Service Business Unit, Second Consumer Service Business Unit, IT Business Unit
Motokazu Yoshida* Executive Vice President
Chief Information Officer; Corporate Staff Division (Information Strategic Planning Division, Corporate Planning & Strategy Division, CSR Promotion Division, Corporate Communication Division,); New Business Promotion; Environment Matters; Chairman, CSR Promotion Committee
Ken Abe* Executive Vice President
Iron & Steel Products Business Unit; Infrastructure Projects Business Unit; Financial Markets Business Unit; Transportation Logistics Business Unit; Director, Mitsui & Co.(U.S.A.)Inc.
Yoshiyuki Izawa* Executive Vice President
First Chemicals Business Unit; Second Chemicals Business Unit; Foods & Retail Business Unit; Domestic Offices and Branches; Director ,Mitsui & Co. Europe Holdings PLC; Chairman, Portfolio Management Committee
Junichi Matsumoto* Executive Vice President
Chief Financial Officer, Chief Compliance Officer; Corporate Staff Division (Financial Planning Division, Accounting Division, Finance Division, Investment Administration Division, Credit Risk Management Division, Market Risk Management Division, First Business Process Control Division, Second Business Process Control Division, Third Business Process Control Division, Investor Relations Division); Chairman, Compliance Committee; Chairman, Disclosure Committee
Toshimasa Furukawa Executive Vice President
Chief Operating Officer, Asia Pacific Business Unit
Masami Iijima* Senior Executive Managing Officer
Mineral & Metal Resources Business Unit; Energy Business Unit I ; Energy Business Unit II
Seiichi Tanaka* Senior Executive Managing Officer
Chief Privacy Officer; Corporate Staff Division (Secretariat, Corporate Auditor Division, Human Resource & General Affairs Division, Legal Division, Logistics Management Division); Business Continuity Plan Management; Director, Mitsui & Co.(Asia Pacific) Pte. Ltd.
Norinao Iio Senior Executive Managing Officer
Chief Operating Officer, EMEA(Europe, the Middle East and Asia)Business Unit
Shinjiro Ogawa Executive Managing Officer
Chief Representative of Mitsui & Co., Ltd. in China
Jitsuro Terashima Executive Managing Officer
President & CEO, Mitsui Global Strategic Studies Institute
Koji Nakamura Executive Managing Officer
General Manager, Osaka Office
Kenichi Yamamoto Executive Managing Officer
Chief Operating Officer, First Consumer Service Business Unit
Toshio Awata Executive Managing Officer
General Manager, Nagoya Office
Kiyotaka Watanabe Executive Managing Officer
General Manager, Kyushu Office
Masaaki Fujita Executive Managing Officer
Chief Operating Officer, Foods & Retail Business Unit
Junichi Mizonoue Executive Managing Officer
Chief Operating Officer, Second Chemicals Business Unit
Takao Omae Executive Managing Officer
Chief Operating Officer, Infrastructure Projects Business Unit
Hideyo Hayakawa Executive Managing Officer
General Manager, Internal Auditing Division
Masaaki Murakami Managing Officer President, Mitsui & Co. (Korea) Ltd. Osamu Koyama Managing Officer Deputy Chief Operating Officer, Americas Business Unit Terukazu Okahashi Managing Officer Deputy General Manager, Osaka Office Osamu Takahashi Managing Officer Chief Operating Officer, IT Business Unit Shigeru Hanagata Managing Officer Chief Operating Officer, Motor Vehicles Business Unit Masayoshi Komai Managing Officer Chief Operating Officer, Marine & Aerospace Business Unit
(AS OF NOVEMBER 1, 2008)
28
(Continued from previous page)
Name Title Principal position(s)/Areas overseenKatsumi Ogawa Managing Officer Chief Operating Officer, Financial Markets Business Unit Akio Yamamoto Managing Officer President, Mitsui & Co. (Thailand) Ltd. Yoshinori Setoyama Managing Officer Chief Operating Officer, First Chemicals Business Unit Noriaki Sakamoto Managing Officer President, MITSUI &CO. (CANADA) LTD. Masahiko Okamura Managing Officer Chief Operating Officer, Second Consumer Service Business Unit Fuminobu Kawashima
Managing Officer Chief Operating Officer, Energy Business Unit I
Masaaki Iida Managing Officer Chief Operating Officer, Transportation Logistics Business Unit Joji Okada Managing Officer General Manager, Accounting Division Takashi Fukunaga Managing Officer Deputy Chief Operating Officer, EMEA(Europe, the Middle East and
Africa) Business Unit Takashi Yamauchi Managing Officer Chief Operating Officer, Iron & Steel Products Business Unit Shuji Nakura Managing Officer General Manager, Investment Administration Division Mitsuhiko Kawai Managing Officer Chief Operating Officer, Energy Business Unit II Daisuke Saiga Managing Officer General Manager, Human Resources & General Affairs Division Masayuki Kinoshita
Managing Officer Chief Operating Officer, Mineral & Metal Resources Business Unit
Total current assets ....................................................................... 5,223,774 5,058,064Investments and Non-current Receivables:
Investments in and advances to associated companies ........................ 1,423,134 1,333,042
Other investments ............................................................................... 1,181,482 1,281,476
Non-current receivables, less unearned interest ................................... 487,533 497,265
Allowance for doubtful receivables ....................................................... (55,763) (58,957)
Property leased to others―at cost, less accumulated depreciation....... 198,731 184,447
Total investments and non-current receivables............................ 3,235,117 3,237,273Property and Equipment―at Cost:
Land, land improvements and timberlands ........................................... 169,393 188,848
Buildings, including leasehold improvements........................................ 358,517 385,104Equipment and fixtures........................................................................ 844,909 815,202Mineral rights ...................................................................................... 167,442 146,120Vessels............................................................................................... 36,841 33,789Projects in progress............................................................................. 219,611 176,987
Advances from customers ...................................................................... 200,494 113,939Derivative liabilities................................................................................. 210,418 238,684Other current liabilities............................................................................ 88,808 75,111
Total current liabilities................................................................... 3,638,968 3,441,563Long-term Debt, less Current Maturities ................................................. 2,862,256 2,944,383Accrued Pension Costs and Liability for Severance Indemnities............................................................................................. 32,348 32,754
Defined benefit pension plans.............................................................. (30,724) (32,160)Net unrealized gains and losses on derivatives .................................... (18,589) 1,135
Total accumulated other comprehensive loss.................................... (179,218) (25,775)
Treasury stock, at cost:........................................................................... (6,109) (5,130)
Total shareholders' equity............................................................. 2,232,244 2,183,660Total........................................................................................................ ¥ 9,717,800 ¥ 9,537,829
31
STATEMENTS OF CONSOLIDATED INCOME (Unaudited)
(Millions of Yen)Six-Month Period Ended
September 30, 2008 Six-Month Period Ended
September 30, 2007
Revenues:
Sales of products .................................................................... ¥ 2,944,856 ¥ 2,375,900
Sales of services..................................................................... 284,094 277,721
Other sales ............................................................................. 103,675 83,662
Total revenues ................................................................. 3,332,625 2,737,283
Total Trading Transactions:
Six-month period ended September 30, 2008: ¥8,536,664 million
Six-month period ended September 30, 2007: ¥8,202,179 million
Cost of Revenues:
Cost of products sold .............................................................. 2,572,265 2,136,173
Cost of services sold............................................................... 85,945 75,521
Cost of other sales .................................................................. 45,728 47,065
Total cost of revenues ...................................................... 2,703,938 2,258,759
Selling, general and administrative .......................................... 312,101 296,370
Provision for doubtful receivables............................................ 5,786 2,639
Interest expense, net of interest income................................... 18,370 23,627
Dividend income ..................................................................... (38,906) (28,419)
Gain on sales of securities—net .............................................. (18,467) (51,032)
Loss on write-down of securities .............................................. 24,746 12,663
Gain on disposal or sales of property and equipment—net ....... (5,160) (1,202)
Impairment loss of long-lived assets ........................................ 1,133 2,232
Other (income) expense—net.................................................. 18,896 (1,452)
Total other expenses........................................................ 318,499 255,426
Income from Continuing Operations before Income Taxes, Minority Interests and Equity in Earnings ...................................
310,188 223,098
[Continued on next page]
32
[Continued from previous page]
(Millions of Yen)Six-Month Period Ended
September 30, 2008 Six-Month Period Ended
September 30, 2007
Income Taxes .................................................................................. 124,790 88,221
Income from Continuing Operations before Minority Interests and Equity in Earnings ...............................................................
185,398 134,877
Minority Interests in Earnings of Subsidiaries ............................... (30,715) (20,678)Equity in Earnings of Associated Companies—Net
(After Income Tax Effect).............................................................85,865 72,375
Income from Continuing Operations .............................................. 240,548 186,574
Income from Discontinued Operations—Net (After Income Tax Effect) ...........................................................
- 65,347
Net Income ...................................................................................... ¥ 240,548 ¥ 251,921
Note: In accordance with SFAS No.144, the figures for the six-month period ended September 30, 2007 relating to discontinued
operations have been reclassified.
33
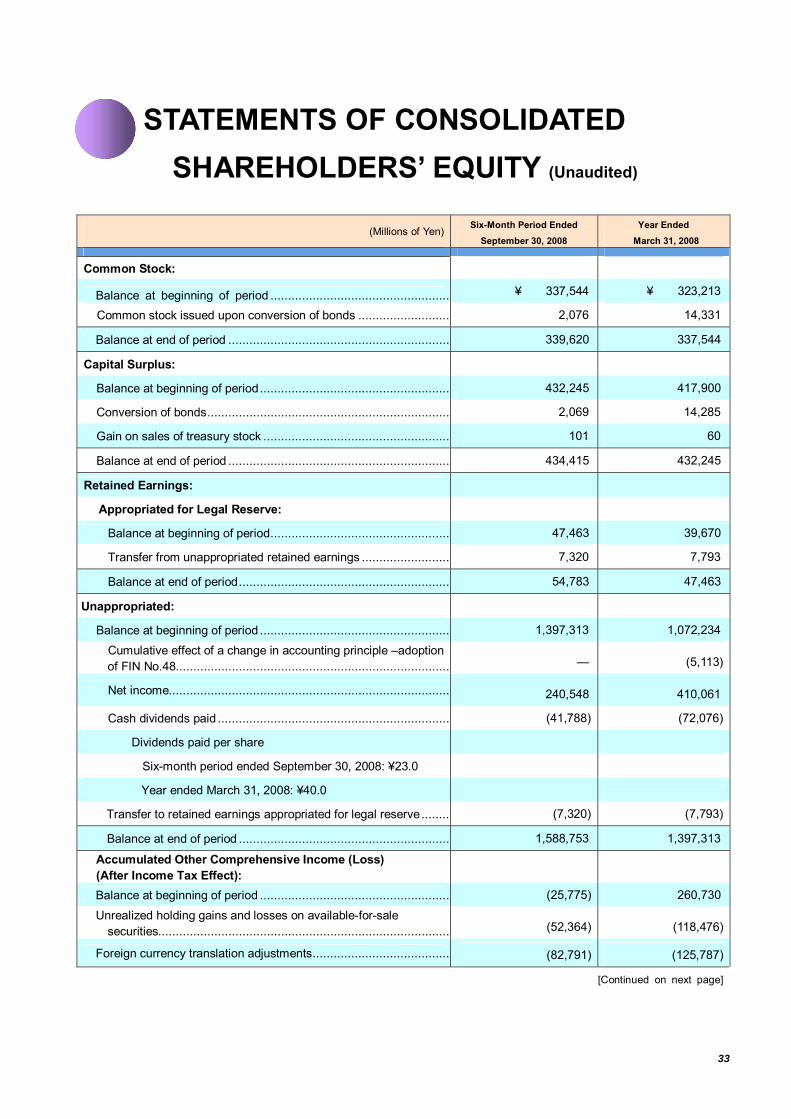
STATEMENTS OF CONSOLIDATED SHAREHOLDERS’ EQUITY (Unaudited)
(Millions of Yen)Six-Month Period Ended
September 30, 2008 Year Ended
March 31, 2008
Common Stock:
Balance at beginning of period ................................................... ¥ 337,544 ¥ 323,213
Common stock issued upon conversion of bonds .......................... 2,076 14,331
Balance at end of period ............................................................... 339,620 337,544
Capital Surplus:
Balance at beginning of period...................................................... 432,245 417,900
Conversion of bonds..................................................................... 2,069 14,285
Gain on sales of treasury stock ..................................................... 101 60
Balance at end of period ............................................................... 434,415 432,245
Retained Earnings:
Appropriated for Legal Reserve:
Balance at beginning of period................................................... 47,463 39,670
Transfer from unappropriated retained earnings ......................... 7,320 7,793
Balance at end of period............................................................ 54,783 47,463
Unappropriated:
Balance at beginning of period ...................................................... 1,397,313 1,072,234
Cumulative effect of a change in accounting principle –adoption of FIN No.48.............................................................................. — (5,113)
Net income................................................................................ 240,548 410,061
Transfer to retained earnings appropriated for legal reserve........ (7,320) (7,793)
Balance at end of period ............................................................ 1,588,753 1,397,313
Accumulated Other Comprehensive Income (Loss) (After Income Tax Effect):
Balance at beginning of period ...................................................... (25,775) 260,730
Unrealized holding gains and losses on available-for-sale securities................................................................................... (52,364) (118,476)
Note: Appropriations of retained earnings are reflected in the consolidated financial statements upon shareholders’ approval.
[Continued from previous page]
(Millions of Yen)Six-Month Period Ended
September 30, 2008 Year Ended
March 31, 2008
Defined benefit pension plans ........................................................ 1,436 (34,447)Net unrealized gains and losses on derivatives............................... (19,724) (7,795)
Balance at end of period ................................................................ (179,218) (25,775)
Treasury Stock, at cost:
Balance at beginning of period....................................................... (5,130) (3,468)
Purchases of treasury stock........................................................... (1,262) (1,757)
Sales of treasury stock................................................................... 283 95
Balance at end of period ................................................................ (6,109) (5,130)
Comprehensive income:
Net income.................................................................................... 240,548 410,061 Other comprehensive income (loss) (After income tax effect):
Unrealized holding gains and losses on available-for-sale securities ............................................................................... (52,364) (118,476)
Comprehensive Income ................................................................. ¥ 87,105 ¥ 123,556
35
STATEMENTS OF CONSOLIDATED CASH FLOWS (Supplementary Information) (Unaudited)
(Millions of Yen)Six-Month Period Ended
September 30, 2008 Six-Month Period Ended
September 30, 2007*
Operating Activities:
Net Income.................................................................................... ¥ 240,548 ¥ 251,921
Adjustments to reconcile net income to net cash provided by operating activities:
Income from discontinued operations—net (after income tax effect) ........................................................................................ — (65,347)
Depreciation and amortization..................................................... 70,594 66,649
Pension and severance costs, less payments.............................. 3,331 (2,432)
Provision for doubtful receivables................................................ 5,786 2,639
Gain on sales of securities—net.................................................. (18,467) (51,032)
Loss on write-down of securities ................................................. 24,746 12,663
Gain on disposal or sales of property and equipment—net........... (5,160) (1,202)
Impairment loss of long-lived assets............................................ 1,133 2,232
Deferred income taxes................................................................ (13,494) (11,644)
Minority interests of earnings of subsidiaries................................ 30,715 20,678
Equity in earnings of associated companies, less dividends received.................................................................................. (24,528) (29,007)
Changes in operating assets and liabilities:
Increase in trade receivables ............................................. (12,368) (93,328)
Increase in inventories ....................................................... (90,483) (19,882)
(Decrease) increase in trade payables .............................. (15,358) 21,703
Net cash used in operating activities of discontinued operations ....................................................................... — (2,096)
Net cash provided by operating activities................... 61,876 125,221
Investing Activities:
Net decrease (increase) in time deposits ........................................ 2,660 (302)
Net (increase) decrease in investments in and advances to associated companies ................................................................
(95,329) 124,924
Net decrease (increase) in other investments ................................. 14,637 (985)
Net (increase) decrease in long-term loan receivables ................ (4,456) 1,025
Net increase in property leased to others and property and equipment.................................................................................. (109,045) (66,834)
Net cash (used in) provided by investing activities…... (191,533) 57,828
[Continued on next page]
36
Note: In accordance with SFAS No.144, the figures for the six-month period ended September 30, 2007 relating to discontinued operations have been reclassified.
[Continued from previous page]
Financing Activities:
Net increase (decrease) in short-term debt ................................... 92,571 (151,942)
Net decrease in long-term debt ........................................................ (9,147) (3,564)
Purchases of treasury stock—net................................................ ... (880) (991)
Payments of cash dividends ............................................................ (41,788) (30,342)
Net cash provided by (used in) financing activities..... 40,756 (186,839)Effect of Exchange Rate Changes on Cash and Cash Equivalents .................................................................................. (5,165) 1,613
Net decrease in Cash and Cash Equivalents.................................... (94,066) (2,177)
Cash and Cash Equivalents at Beginning of Period......................... 899,264 800,032
Cash and Cash Equivalents at End of Period................................... ¥ 805,198 ¥ 797,855
37
OPERATING SEGMENT INFORMATION
(Supplementary information) (Unaudited) The companies allocate their resources and review their performance by operating segments comprised of the business units of the Head Office and region-focused operating segments comprised of the regional business units. The companies’ operating segments have been aggregated based on the nature of the products and other criteria into eight product-focused reportable operating segments and three region-focused reportable operating segments.
Six-month period ended September 30, 2008 (from April 1, 2008 to September 30, 2008) (Millions of Yen)
Net Income 3,140 3,612 12,365 259,146 3,514 (10,739) 251,921Total Assets at
September 30, 2007 734,297 202,799 390,362 9,475,523 2,789,912 (2,234,600) 10,030,835
Notes: 1. The “Consolidated Total” figures for the six-month period ended September 30, 2007 have been reclassified to conform to the
change in current year presentation for discontinued operations in accordance with SFAS No. 144. The reclassification to income (loss) from discontinued operation—net (after income tax effect) is included in “Adjustments and Eliminations.”
2. “All Other” includes business activities which primarily provide services, such as financing services and operations services to external customers and/or to the companies and associated companies. Total assets of “All Other” at September 30, 2008 and 2007 consisted primarily of cash and cash equivalents and time deposits related to financing activities, and assets of certain subsidiaries related to the above services.
3. Net loss of “Adjustments and Eliminations” includes income and expense items that are not allocated to specific reportable operating segments, such as certain expenses of the corporate departments, and eliminations of intersegment transactions.
4. Transfers between operating segments are made at cost plus a markup. 5. Operating Income (Loss) reflects the companies' a) Gross Profit, b) Selling, general and administrative expenses, and c)
Provision for doubtful receivables as presented in the Statements of Consolidated Income. 6. Reflecting a management focus on regional strategies, feed-related operations previously included in “Chemical”, along with
certain US-based automotive-related subsidiaries that were formerly included in “Machinery and Infrastructure Projects”, have from April 1, 2008 been transferred to “Americas”. The operating segment information for the six-month period ended September 30, 2007 has been restated to conform to the current period presentation.
39
Shareholders’ information
Fiscal year end March 31 Record date March 31 Interim dividend record date September 30 General Shareholders’ Meeting June Manager of the Register of Shareholders (head office)
The Chuo Mitsui Trust and Banking Company, Limited 33-1 Shiba, 3-chome Minato-ku, Tokyo
Contact information for above The Chuo Mitsui Trust and Banking Company Limited, Stock Transfer Agency Division 8-4 Izumi, 2-chome Suginami-ku, Tokyo 168-0063 Tel: 0120-78-2031 (free dial)
Representative branches for above The Chuo Mitsui Trust and Banking Company Limited (various locations around the country) JAPAN SECURITIES AGENTS, LTD. (main office, various locations around the country)
Stock exchange listings Tokyo, Osaka, Nagoya, Sapporo, Fukuoka
Procedures after implementation of the electronic share certification system From Monday, January 5, 2009, the new central clearing system for shares of listed companies will be established. On that day, all existing share certificates of listed companies will become null and void and shareholders’ rights will be managed electronically via accounts at securities companies and other financial institutions. In this connection, administrative procedures will be changed as follows:
1. Payment of unpaid dividends Please contact the Manager of the Register of Shareholders as it used to be.
2. Change of address; sale or purchase of shares less than one unit; selection of method to receive
dividend, etc. (1) For shareholders using the Japan Securities Depository Center, Incorporated.(“JASDEC”): Please contact
your securities company, etc. (2) For shareholders not using the JASDEC: Please contact the Account Management Institution for a special
account. Please note that with regard to shareholders in category (2), any application including the one for transfer from the accounts at securities companies or other such financial institutions to your individual accounts will only be accepted after the scheduled registration to such special account on Monday January 26, 2009.
Account Management Institution The Chuo Mitsui Trust and Banking Company Limited
33-1 Shiba, 3-chome Minato-ku, Tokyo
Contact information for above The Chuo Mitsui Trust and Banking Company Limited, Stock Transfer Agency Division 8-4 Izumi, 2-chome Suginami-ku, Tokyo 168-0063 Tel: 0120-78-2031 (free dial)
Representative branches for above
The Chuo Mitsui Trust and Banking Company Limited (various locations around the country) JAPAN SECURITIES AGENTS, LTD. (main office, various locations around the country)
40
Procedures for applications to buy or sell shares less than one unit around implementation of the electronic share certification system In connection with the transfer to the electronic share certification system, any application from shareholders not using JASDEC will be changed as follows: 1. For shareholders requiring the Company to purchase share less than one unit, payments will take place on Monday January 26, 2009, if the request is made between Thursday December 25, 2008 and Sunday January 4, 2009*. (Any application for such request will be returned if there is no available closing price by Tuesday December 30, 2008.) Moreover, no applications will be accepted between Monday January 5, 2009 and Sunday January 25, 2009. *The office will be closed between Wednesday December 31, 2008 and Sunday January 4, 2009. 2. No Request to the Company for additional shares less than one unit will be accepted between Friday December 12, 2008 and Sunday January 25, 2009. Please also note that any requests for sale and purchase of shares less than one unit by shareholders using JASDEC will be similarly restricted immediately prior to the electronic share certification system. For details please contact your securities company or other financial institution. Dividend receipt procedures after the electronic share certification system Under the electronic share certification system, new options for receiving dividends will be available, including receipt at a newly registered account designated for the receipt of dividends from all your shares and the receipt an account with a securities company, in addition to the current method of electronic transfer to your account. We recommend any of these transfer methods above to ensure receipt of all dividends. Please contact your securities company, etc. for further information.
41
Management Philosophy (MVV)
Mitsui & Co., Ltd. 2-1, Ohtemachi 1-chome
Chiyoda-ku, Tokyo 100-0004 Tel: 03-3285-1111 (general) Website: www.mitsui.co.jp
Mission We will contribute to the creation of a future where the dreams of the inhabitants of our irreplaceable Earth can
be fulfilled.
Vision We aim to become a global business enabler that can meet the needs of our customers throughout the world.
Values Making it a principle to be fair and humble, we, with sincerity and in good faith, will strive to be worthy of the
trust society places in us.
With lofty aspirations and from an honest perspective, we will pursue business that benefits society.
Always taking on the challenge of new fields, we will dynamically create business that can lead the times.
Making the most of our corporate culture that fosters "Freedom and Open-mindedness," we will fully
demonstrate our abilities as a corporation as well as individuals.
In order to nurture human resources full of creativity and a superior sense of balance, we will provide our
people with a workplace for self-development as well as self-realization.