15
Qurain Petrochemical Industries Company K.S.C.P. and its Subsidiaries INTERIM CONDENSED CONSOLIDATED FINANCIAL INFORMATION 31 DECEMBER 2017 (UNAUDITED)
Qurain Petrochemical Industries Company
K.S.C.P. and its Subsidiaries
INTERIM CONDENSED CONSOLIDATED FINANCIAL
INFORMATION
31 DECEMBER 2017 (UNAUDITED)
The attached notes 1 to 15 form part of this interim condensed consolidated financial information.
3
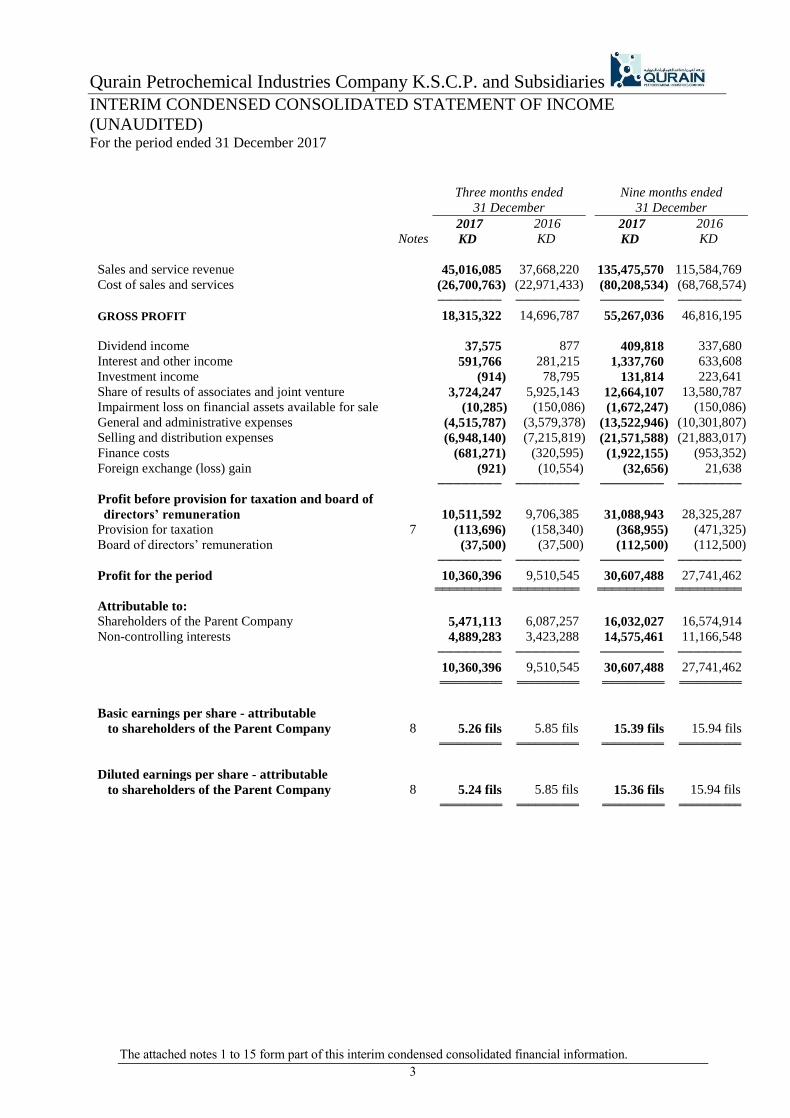
Qurain Petrochemical Industries Company K.S.C.P. and Subsidiaries
INTERIM CONDENSED CONSOLIDATED STATEMENT OF INCOME
(UNAUDITED) For the period ended 31 December 2017
Three months ended
31 December
Nine months ended
31 December
2017 2016 2017 2016
Notes KD KD KD KD
Sales and service revenue 45,016,085 37,668,220 135,475,570 115,584,769
Cost of sales and services (26,700,763) (22,971,433) (80,208,534) (68,768,574)
──────── ──────── ──────── ────────
GROSS PROFIT 18,315,322 14,696,787 55,267,036 46,816,195
Dividend income 37,575 877 409,818 337,680
Interest and other income 591,766 281,215 1,337,760 633,608
Investment income (914) 78,795 131,814 223,641
Share of results of associates and joint venture 3,724,247 5,925,143 12,664,107 13,580,787
Impairment loss on financial assets available for sale (10,285) (150,086) (1,672,247) (150,086)
General and administrative expenses (4,515,787) (3,579,378) (13,522,946) (10,301,807)
Selling and distribution expenses (6,948,140) (7,215,819) (21,571,588) (21,883,017)
Finance costs (681,271) (320,595) (1,922,155) (953,352)
Foreign exchange (loss) gain (921) (10,554) (32,656) 21,638
──────── ──────── ──────── ────────
Profit before provision for taxation and board of
directors’ remuneration 10,511,592 9,706,385
31,088,943 28,325,287
Provision for taxation 7 (113,696) (158,340) (368,955) (471,325)
Board of directors’ remuneration (37,500) (37,500) (112,500) (112,500)
──────── ──────── ──────── ────────
Profit for the period 10,360,396 9,510,545 30,607,488 27,741,462
═════════ ═════════ ═════════ ═════════
Attributable to:
Shareholders of the Parent Company 5,471,113 6,087,257 16,032,027 16,574,914
Non-controlling interests 4,889,283 3,423,288 14,575,461 11,166,548
──────── ──────── ──────── ────────
10,360,396 9,510,545 30,607,488 27,741,462
══════════ ══════════ ══════════ ══════════
Basic earnings per share - attributable
to shareholders of the Parent Company 8 5.26 fils 5.85 fils 15.39 fils 15.94 fils
══════════ ══════════ ══════════ ══════════
Diluted earnings per share - attributable
to shareholders of the Parent Company 8 5.24 fils 5.85 fils 15.36 fils 15.94 fils
══════════ ══════════ ══════════ ══════════
The attached notes 1 to 15 form part of this interim condensed consolidated financial information.
4
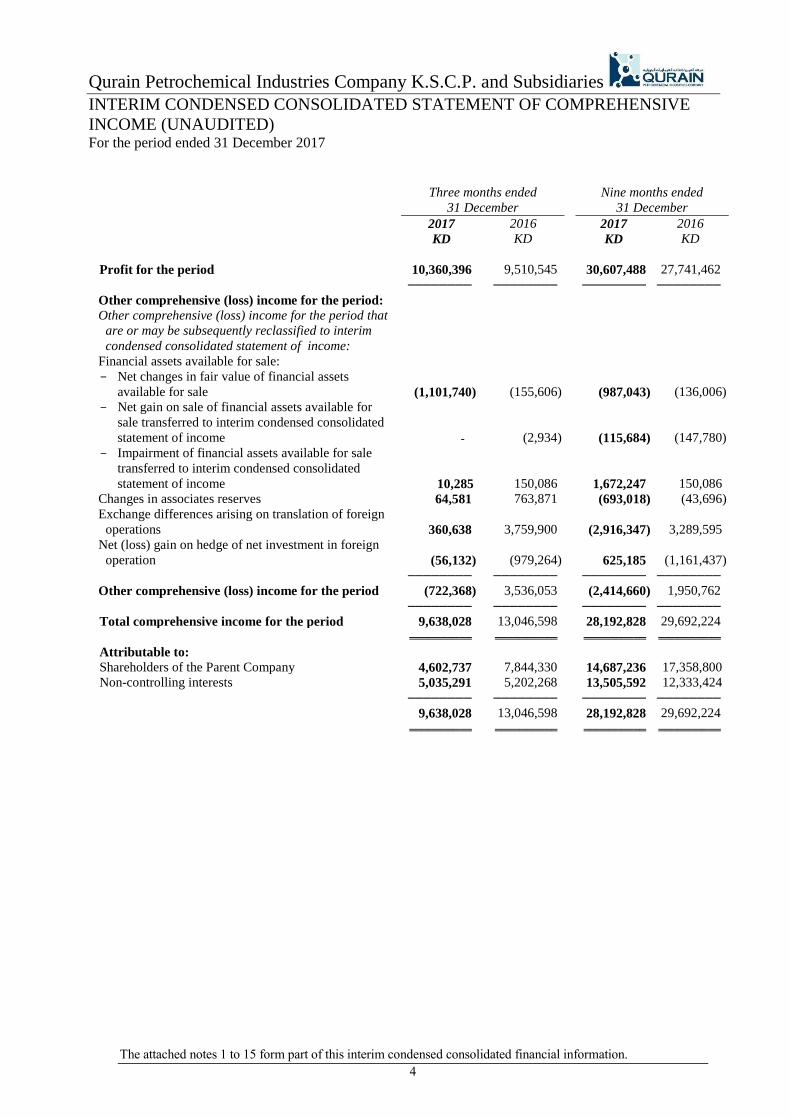
Qurain Petrochemical Industries Company K.S.C.P. and Subsidiaries
INTERIM CONDENSED CONSOLIDATED STATEMENT OF COMPREHENSIVE
INCOME (UNAUDITED) For the period ended 31 December 2017
Three months ended
31 December
Nine months ended
31 December
2017 2016 2017 2016
KD KD KD KD
Profit for the period 10,360,396 9,510,545 30,607,488 27,741,462
──────── ──────── ──────── ────────
Other comprehensive (loss) income for the period:
Other comprehensive (loss) income for the period that
are or may be subsequently reclassified to interim
condensed consolidated statement of income:
Financial assets available for sale:
Net changes in fair value of financial assets
available for sale (1,101,740) (155,606)
(987,043) (136,006)
Net gain on sale of financial assets available for
sale transferred to interim condensed consolidated
statement of income - (2,934)
(115,684) (147,780)
Impairment of financial assets available for sale
transferred to interim condensed consolidated
statement of income 10,285 150,086
1,672,247 150,086
Changes in associates reserves 64,581 763,871 (693,018) (43,696)
Exchange differences arising on translation of foreign
operations 360,638 3,759,900
(2,916,347) 3,289,595
Net (loss) gain on hedge of net investment in foreign
operation (56,132) (979,264)
625,185 (1,161,437)
──────── ──────── ──────── ────────
Other comprehensive (loss) income for the period (722,368) 3,536,053 (2,414,660) 1,950,762
──────── ──────── ──────── ────────
Total comprehensive income for the period 9,638,028 13,046,598 28,192,828 29,692,224
══════════ ══════════ ══════════ ══════════
Attributable to:
Shareholders of the Parent Company 4,602,737 7,844,330 14,687,236 17,358,800
Non-controlling interests 5,035,291 5,202,268 13,505,592 12,333,424
──────── ──────── ──────── ────────
9,638,028 13,046,598 28,192,828 29,692,224
══════════ ══════════ ══════════ ══════════
The attached notes 1 to 15 form part of this interim condensed consolidated financial information.
5
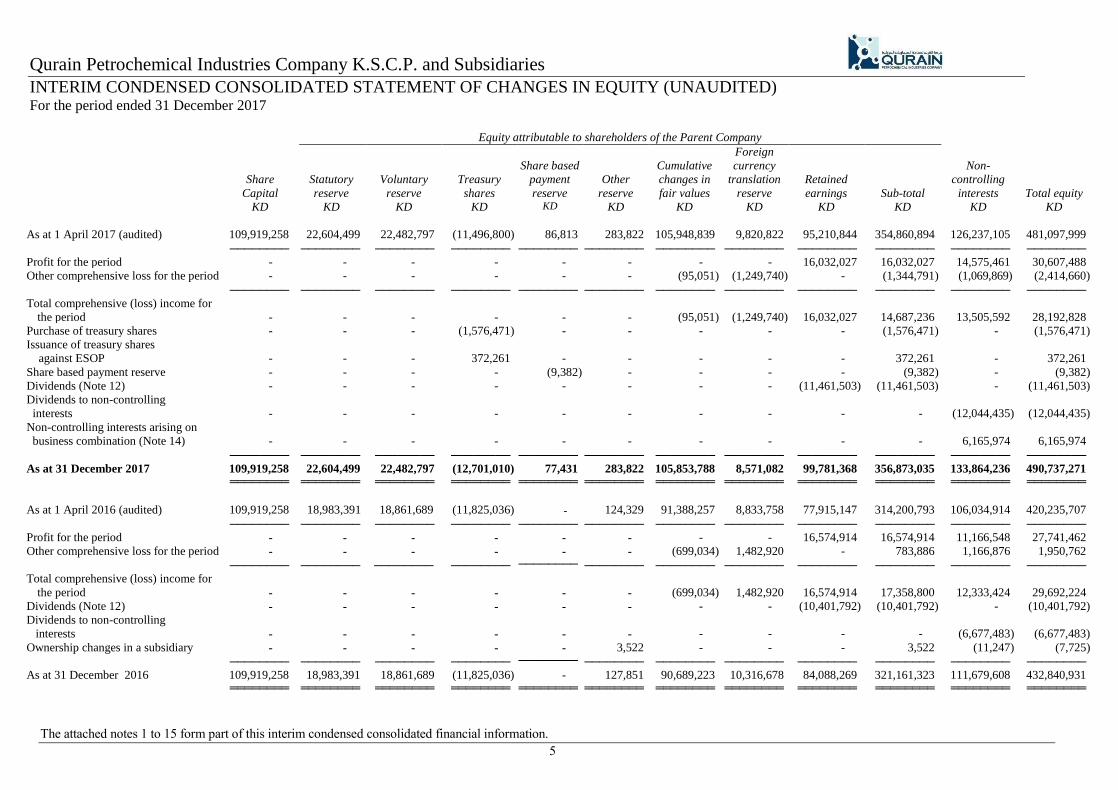
Qurain Petrochemical Industries Company K.S.C.P. and Subsidiaries
INTERIM CONDENSED CONSOLIDATED STATEMENT OF CHANGES IN EQUITY (UNAUDITED) For the period ended 31 December 2017
Equity attributable to shareholders of the Parent Company
Share
Capital
Statutory
reserve
Voluntary
reserve
Treasury
shares
Share based
payment
reserve
Other
reserve
Cumulative
changes in
fair values
Foreign
currency
translation
reserve
Retained
earnings Sub-total
Non-
controlling
interests
Total equity
KD KD KD KD KD KD KD KD KD KD KD KD
As at 1 April 2017 (audited) 109,919,258 22,604,499 22,482,797 (11,496,800) 86,813 283,822 105,948,839 9,820,822 95,210,844 354,860,894 126,237,105 481,097,999
──────── ──────── ──────── ──────── ──────── ──────── ──────── ──────── ──────── ──────── ──────── ──────── Profit for the period - - - - - - - - 16,032,027 16,032,027 14,575,461 30,607,488
Other comprehensive loss for the period - - - - - - (95,051) (1,249,740) - (1,344,791) (1,069,869) (2,414,660)
──────── ──────── ──────── ──────── ──────── ──────── ──────── ──────── ──────── ──────── ──────── ────────
Total comprehensive (loss) income for
the period
-
-
-
-
-
- (95,051) (1,249,740) 16,032,027 14,687,236 13,505,592 28,192,828
Purchase of treasury shares - - - (1,576,471) - - - - - (1,576,471) - (1,576,471)
Issuance of treasury shares
against ESOP - - - 372,261 - - - - - 372,261 - 372,261
Share based payment reserve - - - - (9,382) - - - - (9,382) - (9,382)
Dividends (Note 12) - - - - - - - - (11,461,503) (11,461,503) - (11,461,503)
Dividends to non-controlling
interests
-
-
-
-
-
-
-
-
-
-
(12,044,435)
(12,044,435)
Non-controlling interests arising on
business combination (Note 14)
-
-
-
-
-
-
-
-
-
-
6,165,974
6,165,974
──────── ──────── ──────── ──────── ──────── ──────── ──────── ──────── ──────── ──────── ──────── ────────
As at 31 December 2017 109,919,258 22,604,499 22,482,797 (12,701,010) 77,431 283,822 105,853,788 8,571,082 99,781,368 356,873,035 133,864,236 490,737,271
════════ ════════ ════════ ════════ ════════ ════════ ════════ ════════ ════════ ════════ ════════ ════════
As at 1 April 2016 (audited) 109,919,258 18,983,391 18,861,689 (11,825,036) - 124,329 91,388,257 8,833,758 77,915,147 314,200,793 106,034,914 420,235,707
──────── ──────── ──────── ──────── ──────── ──────── ──────── ──────── ──────── ──────── ──────── ──────── Profit for the period - - - - - - - - 16,574,914 16,574,914 11,166,548 27,741,462
Other comprehensive loss for the period - - - - - - (699,034) 1,482,920 - 783,886 1,166,876 1,950,762
──────── ──────── ──────── ──────── ──────── ──────── ──────── ──────── ──────── ──────── ──────── ────────
Total comprehensive (loss) income for
the period
-
-
-
-
-
- (699,034) 1,482,920 16,574,914 17,358,800 12,333,424 29,692,224
Dividends (Note 12) - - - - - - - - (10,401,792) (10,401,792) - (10,401,792)
Dividends to non-controlling
interests - - - - - - - - - - (6,677,483) (6,677,483)
Ownership changes in a subsidiary - - - - - 3,522 - - - 3,522 (11,247) (7,725)
──────── ──────── ──────── ──────── ──────── ──────── ──────── ──────── ──────── ──────── ──────── ────────
As at 31 December 2016 109,919,258 18,983,391 18,861,689 (11,825,036) - 127,851 90,689,223 10,316,678 84,088,269 321,161,323 111,679,608 432,840,931
════════ ════════ ════════ ════════ ════════ ════════ ════════ ════════ ════════ ════════ ════════ ════════

Qurain Petrochemical Industries Company K.S.C.P. and Subsidiaries INTERIM CONDENSED CONSOLIDATED STATEMENT OF CASH FLOWS
(UNAUDITED) For the period ended 31 December 2017
The attached notes 1 to 15 form part of this interim condensed consolidated financial information.
6
Nine months ended
31 December
Notes 2017 2016
KD KD OPERATING ACTIVITIES
Profit before taxation and Board of Directors’ remuneration 31,088,943 28,325,287
Adjustments for:
Depreciation and amortization 6,515,178 6,107,354
Investment income (131,814) (223,641)
Impairment loss on financial assets available for sale 1,672,247 150,086
Share of results of associates (12,664,107) (13,580,787)
Provision for employees’ end of service benefits 1,521,032 1,340,520
Share based payment reserve 46,267 - Finance costs 1,922,155 953,352
──────── ────────
29,969,901 23,072,171 Working capital adjustments:
Trade and other receivables (1,540,264) (1,560,437)
Inventories (7,084,768) 3,201,526
Trade and other payables 5,266,309 2,841,114
──────── ────────
Cash from operations 26,611,678 27,554,374
Employees’ end of service benefits paid (1,184,813) (414,852)
Dividends received from associates 6,706,450 1,338,528
──────── ────────
Net cash flows from operating activities 32,133,315 28,478,050
──────── ────────
INVESTING ACTIVITIES
Net movement of financial assets available for sale (886,303) (5,180,535)
Purchase of property, plant and equipment (9,358,167) (5,085,927)
Purchase of investment in associate - (3,651,148)
Sale proceeds from disposal of property, plant and equipment 48,586 114,163
Acquisition of subsidiary, net of cash acquired 14 (5,608,706) - Purchase of additional investment in a subsidiary - (7,725)
──────── ────────
Net cash flows used in investing activities (15,804,590) (13,811,172) ──────── ────────
FINANCING ACTIVITIES
Dividends paid (10,369,817) (9,143,308)
Proceeds from term loans 28,861,450 18,626,950
Repayment of term loans (28,630,743) (11,632,775)
Purchase of treasury shares (1,576,471) - Proceeds from issuance of treasury shares against ESOP 325,994 - Payment of finance costs (1,922,155) (953,352)
Dividend paid to non-controlling interest of a subsidiary (11,963,930) (6,444,927)
Movement in non-controlling interest (52,248) (45,763)
──────── ────────
Net cash flows used in financing activities (25,327,920) (9,593,175) ──────── ──────── Effect of foreign currency translation (458,901) 588,563
Net (decrease) increase in bank balances and cash (9,458,096) 5,662,266
Bank balances and cash at 1 April 57,790,106 35,460,196
──────── ────────
Bank balances and cash at 31 December 4 48,332,010 41,122,462
════════ ════════
Qurain Petrochemical Industries Company K.S.C.P. and Subsidiaries
NOTES TO THE INTERIM CONDENSED CONSOLIDATED FINANCIAL
INFORMATION (UNAUDITED) As at and for the period ended 31 December 2017
7
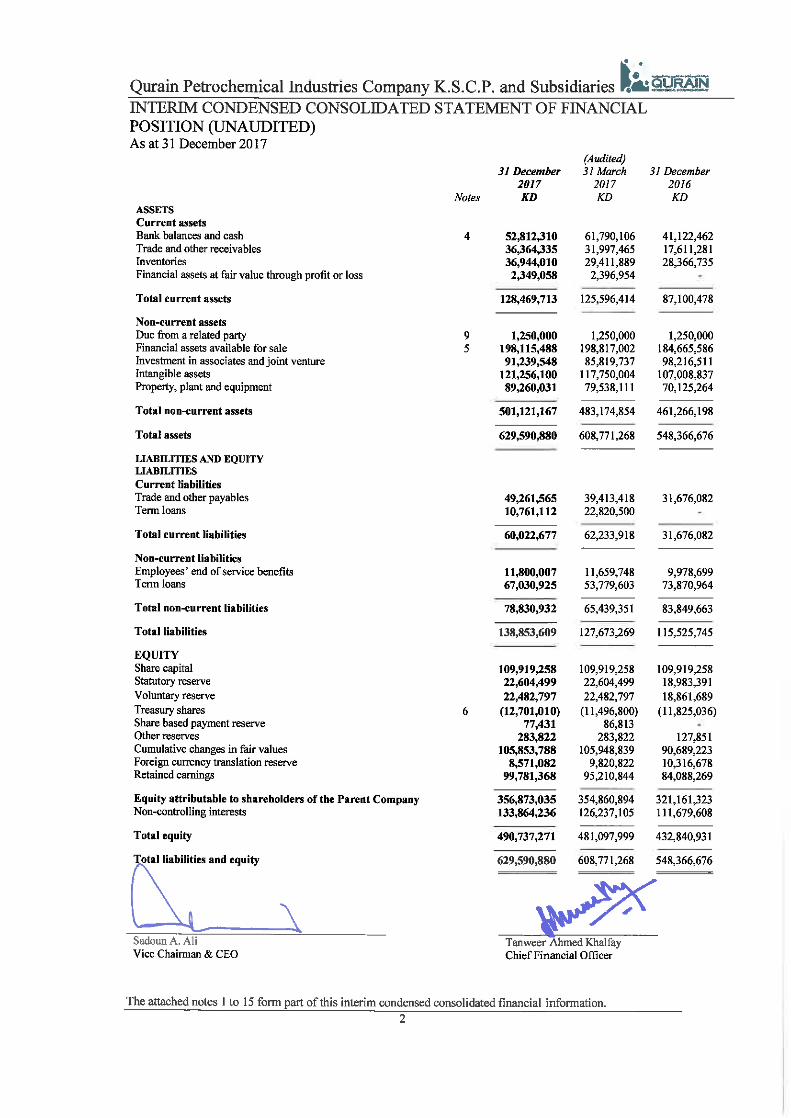
1 GENERAL INFORMATION
Qurain Petrochemical Industries Company K.S.C.P. (the “Parent Company”) is a Kuwaiti shareholding company
established by Amiri Decree No 332/2004 on 10 November 2004. The Parent Company’s shares were issued for public
subscription by the Ministerial Decree No. 347/2004 on 28 November 2004. The Parent Company’s shares are listed on
the Kuwait Stock Exchange.
The Parent Company’s objectives are as follows:
To manufacture all types of chemical and petrochemical materials and any other derivatives.
To sell, purchase, supply, distribute, export and store these materials and participate in all the activities relating to the
same including the establishment and lease of the necessary services.
To participate in Equate Petrochemical Company K.S.C. (Closed), Kuwait Aromatics Company K.S.C. (Closed),
Kuwait Styrene Company K.S.C. (Closed) and Kuwait Olefins Company K.S.C. (Closed).
To contribute in industrial companies as well as finance, manage and trade in its shares.
To develop industrial and craft zones and projects launched by the State or private sector.
To establish industrial projects or contribute therein after obtaining the necessary approvals from the Public Authority
for Industry and the concerned authorities.
The Parent Company may pursue the above mentioned activities in the State of Kuwait and abroad, originally or by proxy.
It may have an interest in or participate in any manner with entities that carry on business activities similar to its own or
which may assist the Parent Company in realising its objectives in Kuwait or abroad, and it may buy or otherwise acquire
such companies.
The address of the Parent Company’s registered office and principal place of business is: 26th Floor, KIPCO Tower,
Khalid Bin Al Waleed Street, Sharq, P.O. Box No 29299, Safat 13153, State of Kuwait.
The interim condensed consolidated financial information of the Parent Company and subsidiaries (collectively the
“Group”) for the nine months period ended 31 December 2017 was authorised for issue in accordance with a resolution
of the Board of Directors on 28 January 2018.
2 BASIS OF PREPARATION
The interim condensed consolidated financial information of the Group has been prepared in accordance with International
Accounting Standard 34 “Interim Financial Reporting”.
The interim condensed consolidated financial information does not contain all information and disclosures required for
full consolidated financial statements prepared in accordance with International Financial Reporting Standards (“IFRS”)
and should be read in conjunction with the Group’s consolidated financial statements for the year ended 31 March 2017.
In the opinion of the Parent Company’s management, all adjustments consisting of normal recurring accruals considered
necessary for a fair presentation have been included. Operating results for the nine months period ended 31 December
2017 are not necessarily indicative of the results that may be expected for the financial year ending 31 March 2018. The
interim condensed consolidated financial information is presented in Kuwaiti Dinars (“KD”) which is also the functional
currency of the Parent Company.
The accounting policies used in the preparation of this interim condensed consolidated financial information are consistent
with those used in the preparation of the annual consolidated financial statements for the year ended 31 March 2017, except
for the adoption of the amendments and annual improvements to IFRSs, relevant to the Parent Company which are effective
for annual reporting period starting from 1 April 2017 and did not result in any material impact on the accounting policies,
financial position or performance of the Parent Company.
The Group has not early adopted any other standards, interpretations or amendments that have been issued but are not yet
effective.
Qurain Petrochemical Industries Company K.S.C.P. and Subsidiaries
NOTES TO THE INTERIM CONDENSED CONSOLIDATED FINANCIAL
INFORMATION (UNAUDITED) As at and for the period ended 31 December 2017
8
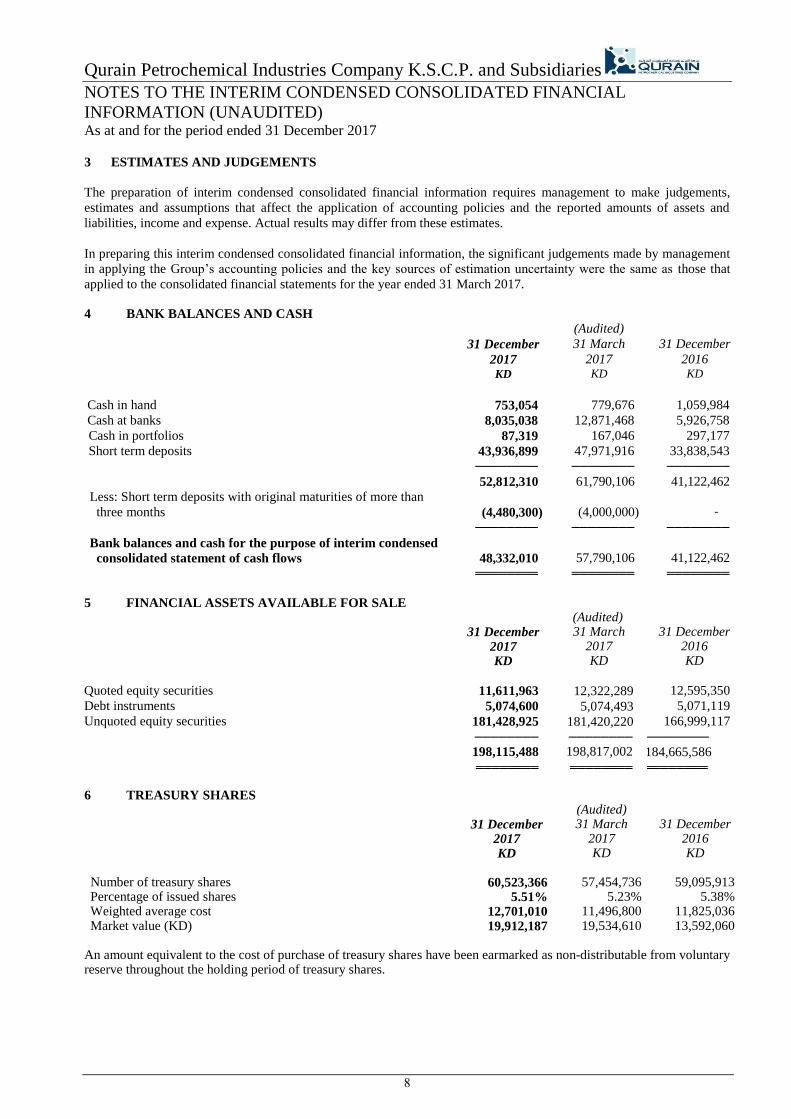
3 ESTIMATES AND JUDGEMENTS
The preparation of interim condensed consolidated financial information requires management to make judgements,
estimates and assumptions that affect the application of accounting policies and the reported amounts of assets and
liabilities, income and expense. Actual results may differ from these estimates.
In preparing this interim condensed consolidated financial information, the significant judgements made by management
in applying the Group’s accounting policies and the key sources of estimation uncertainty were the same as those that
applied to the consolidated financial statements for the year ended 31 March 2017. 4 BANK BALANCES AND CASH
31 December
2017
(Audited)
31 March
2017
31 December
2016
KD KD KD
Cash in hand 753,054 779,676 1,059,984
Cash at banks 8,035,038 12,871,468 5,926,758
Cash in portfolios 87,319 167,046 297,177
Short term deposits 43,936,899 47,971,916 33,838,543
──────── ──────── ────────
52,812,310 61,790,106 41,122,462
Less: Short term deposits with original maturities of more than
three months
(4,480,300)
(4,000,000)
-
──────── ──────── ────────
Bank balances and cash for the purpose of interim condensed
consolidated statement of cash flows
48,332,010
57,790,106
41,122,462
════════ ════════ ════════
5 FINANCIAL ASSETS AVAILABLE FOR SALE (Audited) 31 December 31 March 31 December 2017 2017 2016 KD KD KD
Quoted equity securities 11,611,963 12,322,289 12,595,350
Debt instruments 5,074,600 5,074,493 5,071,119
Unquoted equity securities 181,428,925 181,420,220 166,999,117
──────── ──────── ────────
198,115,488 198,817,002 184,665,586 ════════ ════════ ════════
6 TREASURY SHARES (Audited)
31 December
2017
31 March 2017
31 December 2016
KD KD KD Number of treasury shares 60,523,366 57,454,736 59,095,913 Percentage of issued shares 5.51% 5.23% 5.38% Weighted average cost 12,701,010 11,496,800 11,825,036 Market value (KD) 19,912,187 19,534,610 13,592,060
An amount equivalent to the cost of purchase of treasury shares have been earmarked as non-distributable from voluntary reserve throughout the holding period of treasury shares.
Qurain Petrochemical Industries Company K.S.C.P. and Subsidiaries
NOTES TO THE INTERIM CONDENSED CONSOLIDATED FINANCIAL
INFORMATION (UNAUDITED) As at and for the period ended 31 December 2017
9
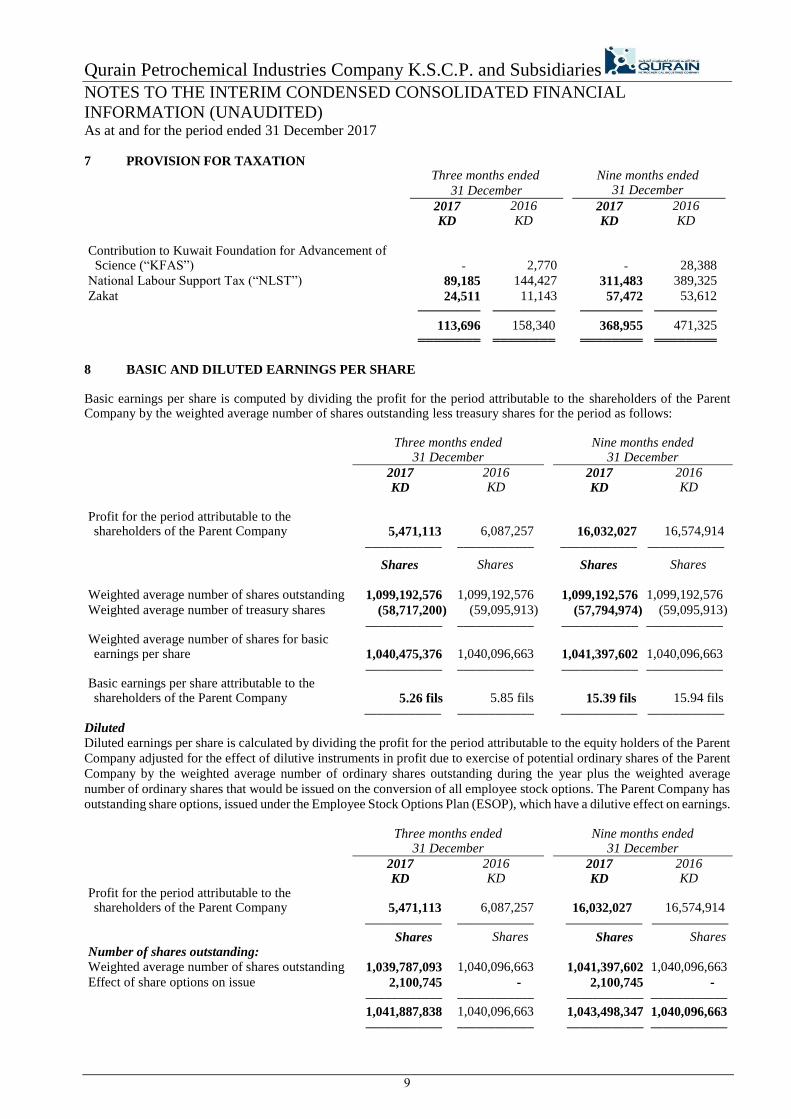
7 PROVISION FOR TAXATION
Three months ended
31 December
Nine months ended 31 December
2017 2016 2017 2016
KD KD KD KD
Contribution to Kuwait Foundation for Advancement of Science (“KFAS”) - 2,770
- 28,388
National Labour Support Tax (“NLST”) 89,185 144,427 311,483 389,325
Zakat 24,511 11,143 57,472 53,612 ──────── ──────── ──────── ────────
113,696 158,340 368,955 471,325 ════════ ════════ ════════ ════════
8 BASIC AND DILUTED EARNINGS PER SHARE Basic earnings per share is computed by dividing the profit for the period attributable to the shareholders of the Parent Company by the weighted average number of shares outstanding less treasury shares for the period as follows:
Three months ended 31 December
Nine months ended 31 December
2017 2016 2017 2016
KD KD KD KD
Profit for the period attributable to the shareholders of the Parent Company 5,471,113 6,087,257
16,032,027 16,574,914
──────────── ──────────── ──────────── ────────────
Shares Shares Shares Shares
Weighted average number of shares outstanding 1,099,192,576 1,099,192,576 1,099,192,576 1,099,192,576
Weighted average number of treasury shares (58,717,200) (59,095,913) (57,794,974) (59,095,913) ──────────── ──────────── ──────────── ──────────── Weighted average number of shares for basic earnings per share 1,040,475,376 1,040,096,663
1,041,397,602 1,040,096,663
──────────── ──────────── ──────────── ──────────── Basic earnings per share attributable to the shareholders of the Parent Company 5.26 fils 5.85 fils
15.39 fils 15.94 fils
──────────── ──────────── ──────────── ──────────── Diluted
Diluted earnings per share is calculated by dividing the profit for the period attributable to the equity holders of the Parent
Company adjusted for the effect of dilutive instruments in profit due to exercise of potential ordinary shares of the Parent
Company by the weighted average number of ordinary shares outstanding during the year plus the weighted average
number of ordinary shares that would be issued on the conversion of all employee stock options. The Parent Company has
outstanding share options, issued under the Employee Stock Options Plan (ESOP), which have a dilutive effect on earnings.
Three months ended 31 December
Nine months ended 31 December
2017 2016 2017 2016
KD KD KD KD Profit for the period attributable to the shareholders of the Parent Company 5,471,113 6,087,257
16,032,027 16,574,914
──────────── ──────────── ──────────── ──────────── Shares Shares Shares Shares Number of shares outstanding:
Weighted average number of shares outstanding 1,039,787,093 1,040,096,663 1,041,397,602 1,040,096,663
Effect of share options on issue 2,100,745 - 2,100,745 - ──────────── ──────────── ──────────── ──────────── 1,041,887,838 1,040,096,663 1,043,498,347 1,040,096,663 ──────────── ──────────── ──────────── ────────────
Qurain Petrochemical Industries Company K.S.C.P. and Subsidiaries
NOTES TO THE INTERIM CONDENSED CONSOLIDATED FINANCIAL
INFORMATION (UNAUDITED) As at and for the period ended 31 December 2017
10
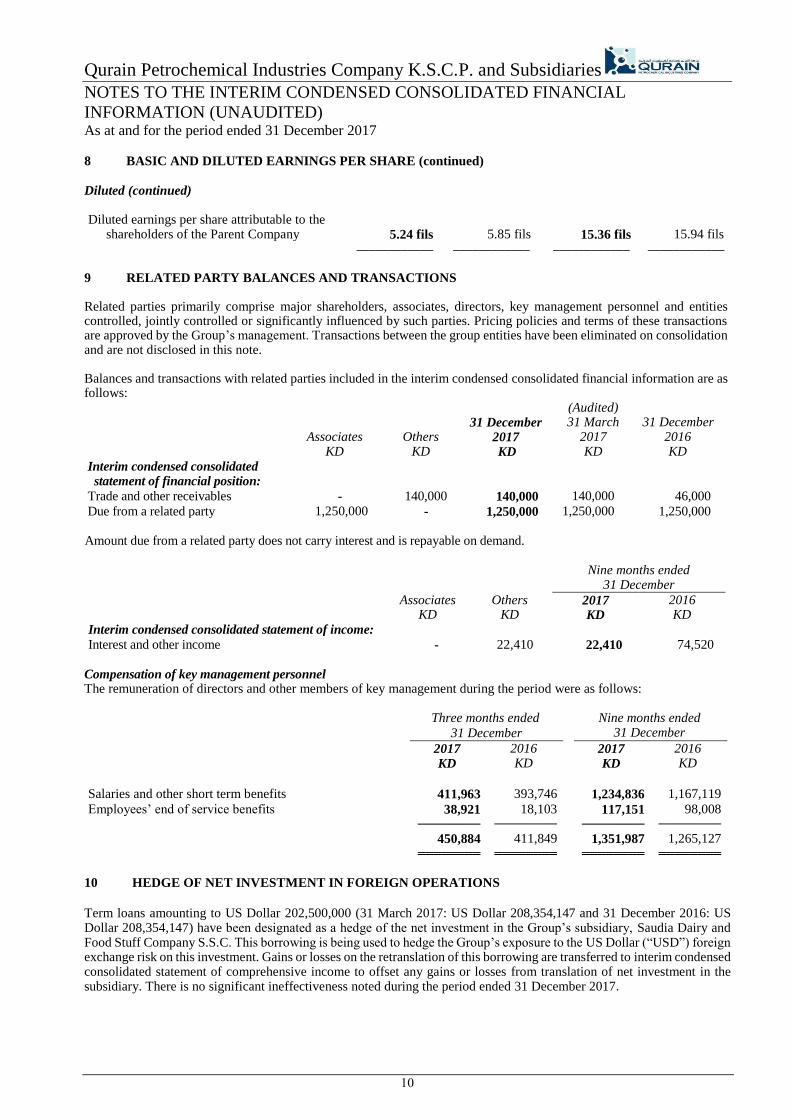
8 BASIC AND DILUTED EARNINGS PER SHARE (continued)
Diluted (continued) Diluted earnings per share attributable to the
shareholders of the Parent Company 5.24 fils 5.85 fils
15.36 fils 15.94 fils ──────────── ──────────── ──────────── ────────────
9 RELATED PARTY BALANCES AND TRANSACTIONS Related parties primarily comprise major shareholders, associates, directors, key management personnel and entities controlled, jointly controlled or significantly influenced by such parties. Pricing policies and terms of these transactions are approved by the Group’s management. Transactions between the group entities have been eliminated on consolidation and are not disclosed in this note. Balances and transactions with related parties included in the interim condensed consolidated financial information are as follows: (Audited)
Others 31 December 31 March 31 December
Associates 2017 2017 2016 KD KD KD KD KD Interim condensed consolidated statement of financial position:
Trade and other receivables - 140,000 140,000 140,000 46,000
Due from a related party 1,250,000 - 1,250,000 1,250,000 1,250,000 Amount due from a related party does not carry interest and is repayable on demand.
Nine months ended 31 December
Associates Others 2017 2016 KD KD KD KD Interim condensed consolidated statement of income:
Interest and other income - 22,410 22,410 74,520 Compensation of key management personnel The remuneration of directors and other members of key management during the period were as follows:
Three months ended
31 December
Nine months ended 31 December
2017 2016 2017 2016 KD KD KD KD
Salaries and other short term benefits 411,963 393,746 1,234,836 1,167,119
Employees’ end of service benefits 38,921 18,103 117,151 98,008 ──────── ──────── ──────── ────────
450,884 411,849 1,351,987 1,265,127 ════════ ════════ ════════ ════════
10 HEDGE OF NET INVESTMENT IN FOREIGN OPERATIONS
Term loans amounting to US Dollar 202,500,000 (31 March 2017: US Dollar 208,354,147 and 31 December 2016: US Dollar 208,354,147) have been designated as a hedge of the net investment in the Group’s subsidiary, Saudia Dairy and Food Stuff Company S.S.C. This borrowing is being used to hedge the Group’s exposure to the US Dollar (“USD”) foreign exchange risk on this investment. Gains or losses on the retranslation of this borrowing are transferred to interim condensed consolidated statement of comprehensive income to offset any gains or losses from translation of net investment in the subsidiary. There is no significant ineffectiveness noted during the period ended 31 December 2017.
Qurain Petrochemical Industries Company K.S.C.P. and Subsidiaries
NOTES TO THE INTERIM CONDENSED CONSOLIDATED FINANCIAL
INFORMATION (UNAUDITED) As at and for the period ended 31 December 2017
11
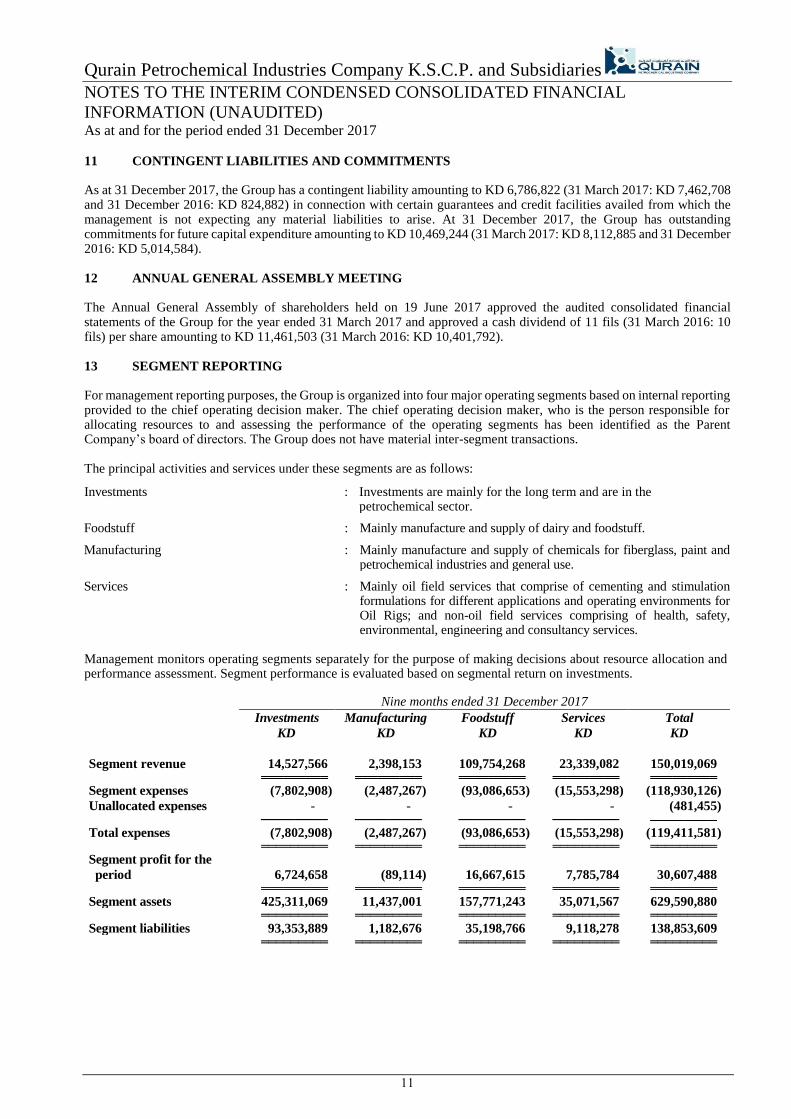
11 CONTINGENT LIABILITIES AND COMMITMENTS As at 31 December 2017, the Group has a contingent liability amounting to KD 6,786,822 (31 March 2017: KD 7,462,708 and 31 December 2016: KD 824,882) in connection with certain guarantees and credit facilities availed from which the management is not expecting any material liabilities to arise. At 31 December 2017, the Group has outstanding commitments for future capital expenditure amounting to KD 10,469,244 (31 March 2017: KD 8,112,885 and 31 December 2016: KD 5,014,584). 12 ANNUAL GENERAL ASSEMBLY MEETING The Annual General Assembly of shareholders held on 19 June 2017 approved the audited consolidated financial statements of the Group for the year ended 31 March 2017 and approved a cash dividend of 11 fils (31 March 2016: 10 fils) per share amounting to KD 11,461,503 (31 March 2016: KD 10,401,792). 13 SEGMENT REPORTING For management reporting purposes, the Group is organized into four major operating segments based on internal reporting provided to the chief operating decision maker. The chief operating decision maker, who is the person responsible for allocating resources to and assessing the performance of the operating segments has been identified as the Parent Company’s board of directors. The Group does not have material inter-segment transactions. The principal activities and services under these segments are as follows:
Investments : Investments are mainly for the long term and are in the petrochemical sector.
Foodstuff : Mainly manufacture and supply of dairy and foodstuff.
Manufacturing : Mainly manufacture and supply of chemicals for fiberglass, paint and petrochemical industries and general use.
Services : Mainly oil field services that comprise of cementing and stimulation formulations for different applications and operating environments for Oil Rigs; and non-oil field services comprising of health, safety, environmental, engineering and consultancy services.
Management monitors operating segments separately for the purpose of making decisions about resource allocation and performance assessment. Segment performance is evaluated based on segmental return on investments.
Nine months ended 31 December 2017
Investments Manufacturing Foodstuff Services Total
KD KD KD KD KD
Segment revenue 14,527,566 2,398,153 109,754,268 23,339,082 150,019,069
═════════ ═════════ ═════════ ═════════ ═════════ Segment expenses (7,802,908) (2,487,267) (93,086,653) (15,553,298) (118,930,126)
Unallocated expenses - - - - (481,455)
──────── ──────── ──────── ──────── ──────── Total expenses (7,802,908) (2,487,267) (93,086,653) (15,553,298) (119,411,581)
═════════ ═════════ ═════════ ═════════ ═════════ Segment profit for the
period 6,724,658 (89,114) 16,667,615 7,785,784 30,607,488
═════════ ═════════ ═════════ ═════════ ═════════ Segment assets 425,311,069 11,437,001 157,771,243 35,071,567 629,590,880
═════════ ═════════ ═════════ ═════════ ═════════ Segment liabilities 93,353,889 1,182,676 35,198,766 9,118,278 138,853,609
═════════ ═════════ ═════════ ═════════ ═════════
Qurain Petrochemical Industries Company K.S.C.P. and Subsidiaries
NOTES TO THE INTERIM CONDENSED CONSOLIDATED FINANCIAL
INFORMATION (UNAUDITED) As at and for the period ended 31 December 2017
12
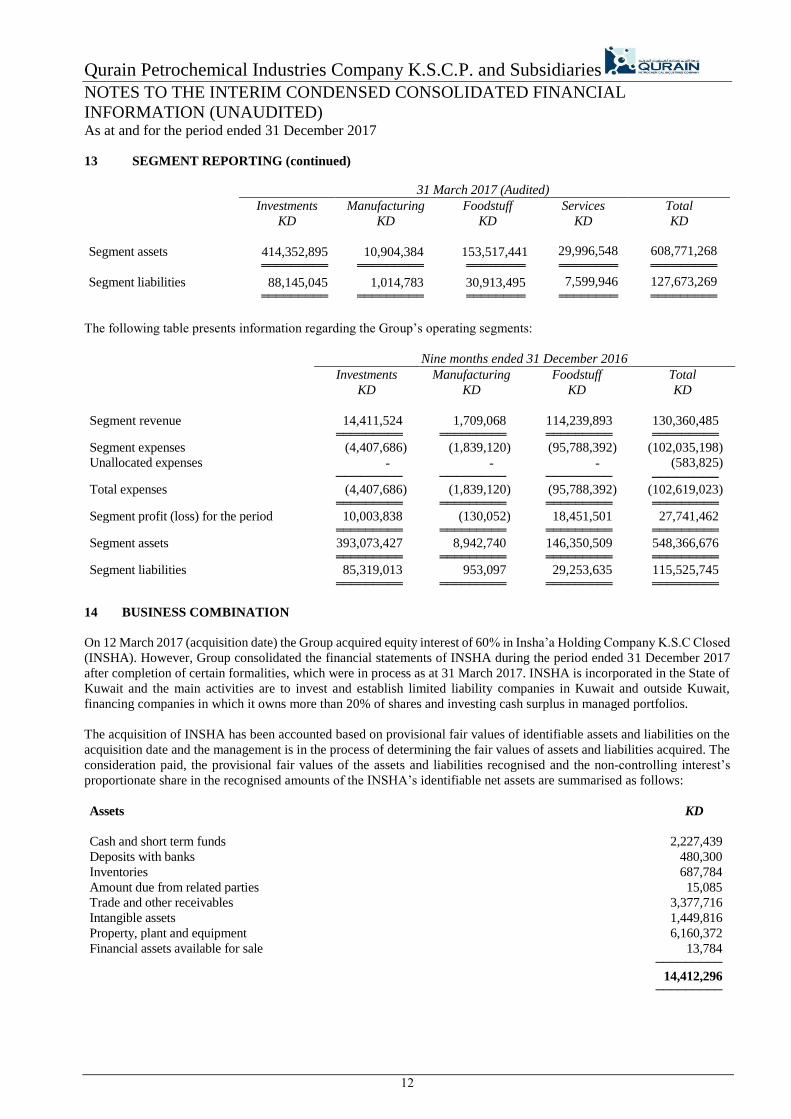
13 SEGMENT REPORTING (continued)
The following table presents information regarding the Group’s operating segments:
Nine months ended 31 December 2016
Investments Manufacturing Foodstuff Total
KD KD KD KD
Segment revenue 14,411,524 1,709,068 114,239,893 130,360,485
═════════ ═════════ ═════════ ═════════ Segment expenses (4,407,686) (1,839,120) (95,788,392) (102,035,198)
Unallocated expenses - - - (583,825)
──────── ──────── ──────── ──────── Total expenses (4,407,686) (1,839,120) (95,788,392) (102,619,023)
═════════ ═════════ ═════════ ═════════ Segment profit (loss) for the period 10,003,838 (130,052) 18,451,501 27,741,462
═════════ ═════════ ═════════ ═════════ Segment assets 393,073,427 8,942,740 146,350,509 548,366,676
═════════ ═════════ ═════════ ═════════ Segment liabilities 85,319,013 953,097 29,253,635 115,525,745
═════════ ═════════ ═════════ ═════════
14 BUSINESS COMBINATION
On 12 March 2017 (acquisition date) the Group acquired equity interest of 60% in Insha’a Holding Company K.S.C Closed
(INSHA). However, Group consolidated the financial statements of INSHA during the period ended 31 December 2017
after completion of certain formalities, which were in process as at 31 March 2017. INSHA is incorporated in the State of
Kuwait and the main activities are to invest and establish limited liability companies in Kuwait and outside Kuwait,
financing companies in which it owns more than 20% of shares and investing cash surplus in managed portfolios.
The acquisition of INSHA has been accounted based on provisional fair values of identifiable assets and liabilities on the
acquisition date and the management is in the process of determining the fair values of assets and liabilities acquired. The
consideration paid, the provisional fair values of the assets and liabilities recognised and the non-controlling interest’s
proportionate share in the recognised amounts of the INSHA’s identifiable net assets are summarised as follows:
Assets KD
Cash and short term funds 2,227,439
Deposits with banks 480,300
Inventories 687,784
Amount due from related parties 15,085
Trade and other receivables 3,377,716
Intangible assets 1,449,816
Property, plant and equipment 6,160,372
Financial assets available for sale 13,784 ─────────
14,412,296
─────────
31 March 2017 (Audited)
Investments Manufacturing Foodstuff Services Total
KD KD KD KD KD
Segment assets 414,352,895 10,904,384 153,517,441 29,996,548 608,771,268
═════════ ═════════ ════════ ════════ ═════════
Segment liabilities 88,145,045 1,014,783 30,913,495 7,599,946 127,673,269
═════════ ═════════ ════════ ════════ ═════════

Qurain Petrochemical Industries Company K.S.C.P. and Subsidiaries
NOTES TO THE INTERIM CONDENSED CONSOLIDATED FINANCIAL
INFORMATION (UNAUDITED) As at and for the period ended 31 December 2017
13
14 BUSINESS COMBINATION (continued) KD Liabilities
Trade and other payables 3,000,918
Term loans 1,586,412
Employees’ end of service benefits 293,244 ─────────
4,880,574 ─────────
Net assets 9,531,722
Non-controlling interests (6,165,974)
───────── Provisional fair value of net assets acquired by the Group 3,365,748
═════════ Consideration paid 7,836,145
Less: net assets acquired by the Group (3,365,748)
─────────
Provisional goodwill 4,470,397
═════════
Cash and cash equivalents in subsidiary acquired 2,227,439
Consideration paid (7,836,145)
─────────
Net cash outflow on acquisition 5,608,706
═════════
The interim condensed consolidated statement of income of the Group for the period includes profit attributable to the
equity holders of the Parent Company amounting to KD 532,742 of INSHA. Had the acquisition of INSHA taken place at
the beginning of the year, the revenue of the Group for the period and the profit attributable to the equity holders of the
Parent Company would not have been materiality impacted.
15 FAIR VALUE OF FINANCIAL INSTRUMENTS
Financial instruments comprise of financial assets and financial liabilities.
For financial assets and financial liabilities that are liquid or having a short-term maturity (less than three months), the
carrying amount approximates their fair value. The fair values of other financial instruments, are not materially different
from their carrying values.
Fair value is defined as the price that would be received to sell an asset or paid to transfer a liability in orderly transactions between market participants at the measurement date. Fair values are obtained from quoted market prices, discounted cash flow models and other models as appropriate. Fair value hierarchy The Group uses the following hierarchy for determining and disclosing the fair values of financial instruments by valuation technique:
Level 1: quoted (unadjusted) prices in an active market for identical assets and liabilities;
Level 2: other techniques for which all inputs which have a significant effect on the recorded fair value are observable, either directly or indirectly; and
Level 3: other techniques which use inputs which have a significant effect on the recorded fair value are not based on observable market data.
Qurain Petrochemical Industries Company K.S.C.P. and Subsidiaries
NOTES TO THE INTERIM CONDENSED CONSOLIDATED FINANCIAL
INFORMATION (UNAUDITED) As at and for the period ended 31 December 2017
14
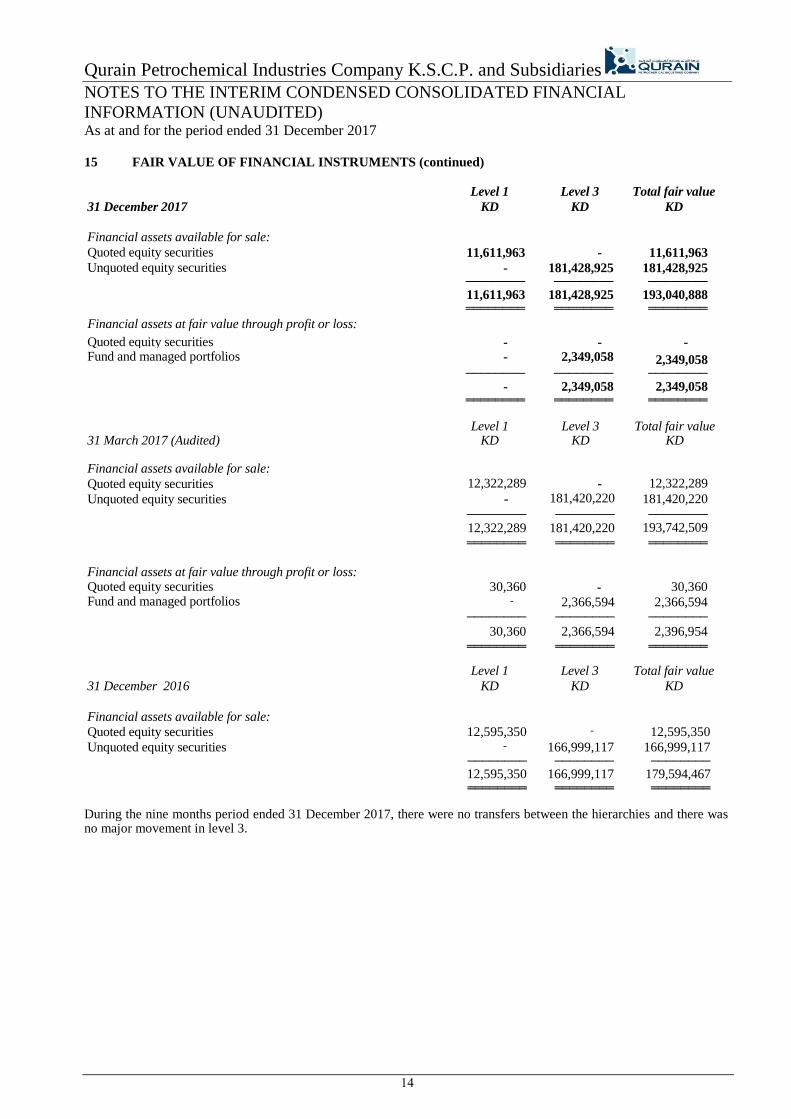
15 FAIR VALUE OF FINANCIAL INSTRUMENTS (continued)
Level 1 Level 3 Total fair value
31 December 2017 KD KD KD
Financial assets available for sale:
Quoted equity securities 11,611,963 - 11,611,963
Unquoted equity securities - 181,428,925 181,428,925
──────── ──────── ────────
11,611,963 181,428,925 193,040,888
════════ ════════ ════════
Financial assets at fair value through profit or loss:
Quoted equity securities - - - Fund and managed portfolios
- 2,349,058 2,349,058
──────── ──────── ────────
- 2,349,058 2,349,058
════════ ════════ ════════
Level 1 Level 3 Total fair value 31 March 2017 (Audited) KD KD KD Financial assets available for sale:
Quoted equity securities 12,322,289 - 12,322,289
Unquoted equity securities - 181,420,220 181,420,220
──────── ──────── ──────── 12,322,289 181,420,220 193,742,509
════════ ════════ ════════
Financial assets at fair value through profit or loss:
Quoted equity securities 30,360 - 30,360
Fund and managed portfolios - 2,366,594 2,366,594
──────── ──────── ────────
30,360 2,366,594 2,396,954
════════ ════════ ════════
Level 1 Level 3 Total fair value
31 December 2016 KD KD KD
Financial assets available for sale:
Quoted equity securities 12,595,350 - 12,595,350
Unquoted equity securities - 166,999,117 166,999,117
──────── ──────── ────────
12,595,350 166,999,117 179,594,467
════════ ════════ ════════
During the nine months period ended 31 December 2017, there were no transfers between the hierarchies and there was no major movement in level 3.


