Interim Consolidated Statements of Financial Position................................................. 3 - 5
Interim Consolidated Statements of Profit or Loss........................................................ 6
Interim Consolidated Statements of Comprehensive Income........................................ 7
Interim Consolidated Statements of Changes in Equity................................................. 8 - 11
Interim Consolidated Statements of Cash Flows............................................................ 12 - 13
Notes to the Interim Consolidated Financial Statements................................................ 14 - 68
1
INDEPENDENT AUDITOR’S REVIEW REPORT
To the Board of Directors and Shareholders of
Samsung Electronics Co., Ltd.
Reviewed Financial Statements
We have reviewed the accompanying interim consolidated financial statements of Samsung
Electronics Co., Ltd. and its subsidiaries (collectively referred to as the “Group”). These interim
consolidated financial statements consist of the interim consolidated statements of financial position
of the Group as at March 31, 2017, and the related interim consolidated statements of profit or loss,
comprehensive income, changes in equity and cash flows for the three months ended March 31, 2017
and 2016, and a summary of significant accounting policies and other explanatory information.
Management’s responsibility for the financial statements
Management is responsible for the preparation and fair presentation of the interim consolidated
financial statements in accordance with International Financial Reporting Standards as adopted by the
Republic of Korea (“Korean IFRS”) 1034, Interim Financial Reporting, and for such internal control
as management determines is necessary to enable the preparation of consolidated financial statements
that are free from material misstatement, whether due to fraud or error.
Auditor’s responsibilities
Our responsibility is to issue a report on these interim consolidated financial statements based on our
reviews.
We conducted our reviews in accordance with the quarterly and semi-annual review standards
established by the Securities and Futures Commission of the Republic of Korea. A review of interim
financial information consists of making inquiries, primarily of persons responsible for financial and
accounting matters, and applying analytical and other review procedures. A review is substantially
less in scope than an audit conducted in accordance with auditing standards generally accepted in the
Republic of Korea and consequently does not enable us to obtain assurance that we would become
aware of all significant matters that might be identified in an audit. Accordingly, we do not express an
audit opinion.
2
Conclusion
Based on our reviews, nothing has come to our attention that causes us to believe the accompanying
interim consolidated financial statements are not presented fairly, in all material respects, in
accordance with the Korean IFRS 1034, Interim Financial Reporting.
Other Matters
We have audited the consolidated statement of financial position of the Group as at December 31,
2016, and the related consolidated statements of profit or loss, comprehensive income, changes in
equity and cash flows for the year then ended, in accordance with Korean Standards on Auditing. We
expressed an unqualified opinion on those financial statements in our audit report dated February 27,
2017. The consolidated statement of financial position as at December 31, 2016, presented herein for
comparative purposes, is consistent, in all material respects, with the above mentioned audited
consolidated statement of financial position as at December 31, 2016.
Review standards and their application in practice vary among countries. The procedures and practices
used in the Republic of Korea to review such financial statements may differ from those generally
accepted and applied in other countries.
May 12, 2017Seoul, Korea
This report is effective as at May 12, 2017, the review report date. Certain subsequent events or circumstances,which may occur between the review report date and the time of reading this report, could have a materialimpact on the accompanying interim consolidated financial statements and notes thereto. Accordingly, thereaders of the review report should understand that there is a possibility that the above review report may haveto be revised to reflect the impact of such subsequent events or circumstances, if any.
3
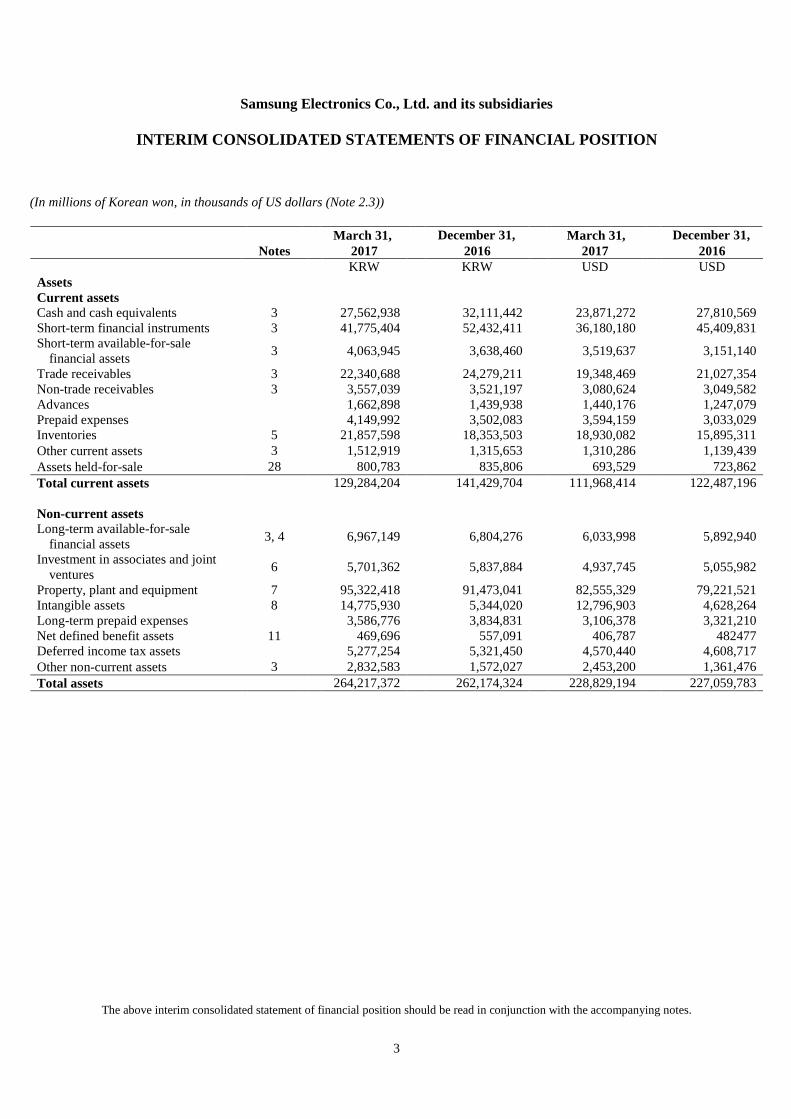
Samsung Electronics Co., Ltd. and its subsidiaries
INTERIM CONSOLIDATED STATEMENTS OF FINANCIAL POSITION
(In millions of Korean won, in thousands of US dollars (Note 2.3))
March 31, December 31, March 31, December 31,Notes 2017 2016 2017 2016
The above interim consolidated statement of changes in equity should be read in conjunction with the accompanying notes.
9
Samsung Electronics Co., Ltd. and its subsidiaries
INTERIM CONSOLIDATED STATEMENTS OF CHANGES IN EQUITY
(In thousands of US dollars (Note 2.3))
2016 USDPreference
sharesOrdinary
sharesShare
premiumRetainedearnings
Othercomponents
of equity
Accumulatedother
comprehensiveincome
attributable toassets held-for-
sale
Equityattributableto owners ofthe parent
Non-controlling
interests TotalNotes
Balance as at January 1, 2016 103,466 673,839 3,814,054 160,336,200 (15,225,799) 20,610 149,722,370 5,354,908 155,077,278Profit for the period - - - 4,558,534 - - 4,558,534 (9,270) 4,549,264
Changes in value of available-for-salefinancial assets, net of tax
- - - - 53,671 (20,610) 33,061 31,543 64,604
Share of other comprehensive loss ofassociates and joint ventures, net oftax
- - - - (96,632) - (96,632) (3) (96,635)
Foreign currency translation, net of tax - - - - (84,167) - (84,167) (3,676) (87,843)
Remeasurement of net defined benefitliabilities (assets), net of tax
- - - - (19,730) - (19,730) (1) (19,731)
Total comprehensive income (loss) - - - 4,558,534 (146,858) (20,610) 4,391,066 18,593 4,409,659
Total transactions with owners - - - (3,850,352) (2,045,698) - (5,896,050) (1,333) (5,897,383)
Balance as at March 31, 2017 119,467 778,047 4,403,893 196,724,497 (18,892,482) (13,815) 183,119,607 6,698,348 189,817,955
The above interim consolidated statement of changes in equity should be read in conjunction with the accompanying notes.
11
Samsung Electronics Co., Ltd. and its subsidiaries
INTERIM CONSOLIDATED STATEMENTS OF CHANGES IN EQUITY
(In thousands of US dollars (Note 2.3))
2017 USDPreference
sharesOrdinary
sharesShare
premiumRetainedearnings
Othercomponents
of equity
Accumulatedother
comprehensiveincome
attributable toassets held-for-
sale
Equityattributableto owners ofthe parent
Non-controlling
interests TotalNotes
Balance as at January 1, 2017 103,466 673,839 3,814,054 167,225,137 (10,336,117) (24,952) 161,455,427 5,662,938 167,118,365Profit for the period - - - 6,485,549 - - 6,485,549 169,595 6,655,144
Changes in value of available-for-salefinancial assets, net of tax
16 - - - - 148,357 - 148,357 (5,322) 143,035
Share of other comprehensive loss ofassociates and joint ventures, net oftax
16 - - - - (47,815) - (47,815) (224) (48,039)
Foreign currency translation, net of tax 16 - - - - (4,313,689) - (4,313,689) (24,629) (4,338,318)Remeasurement of net defined benefit
liabilities (assets), net of tax16 - - - - (33,858) - (33,858) (4) (33,862)
Gain (loss) on valuation of derivatives 16 - - - - 5,713 - 5,713 - 5,713Classified as held-for-sale 28 - - - - (12,987) 12,987 - - -
Total comprehensive income (loss) - - - 6,485,549 (4,254,279) 12,987 2,244,257 139,416 2,383,673
Dividends - - - (3,334,652) - - (3,334,652) (863) (3,335,515)Capital transaction under common
According to Korean IFRS 1109, debt investments are measured at amortized cost if: a) the objective of the
business model is to hold the financial asset for the collection of the contractual cash flows, and b) the contractual
terms of cash flows solely represent payments of principal and interest. As at March 31, 2017, the Group
measured loan and trade receivables amounting to\96,633,992 million held at amortized costs.
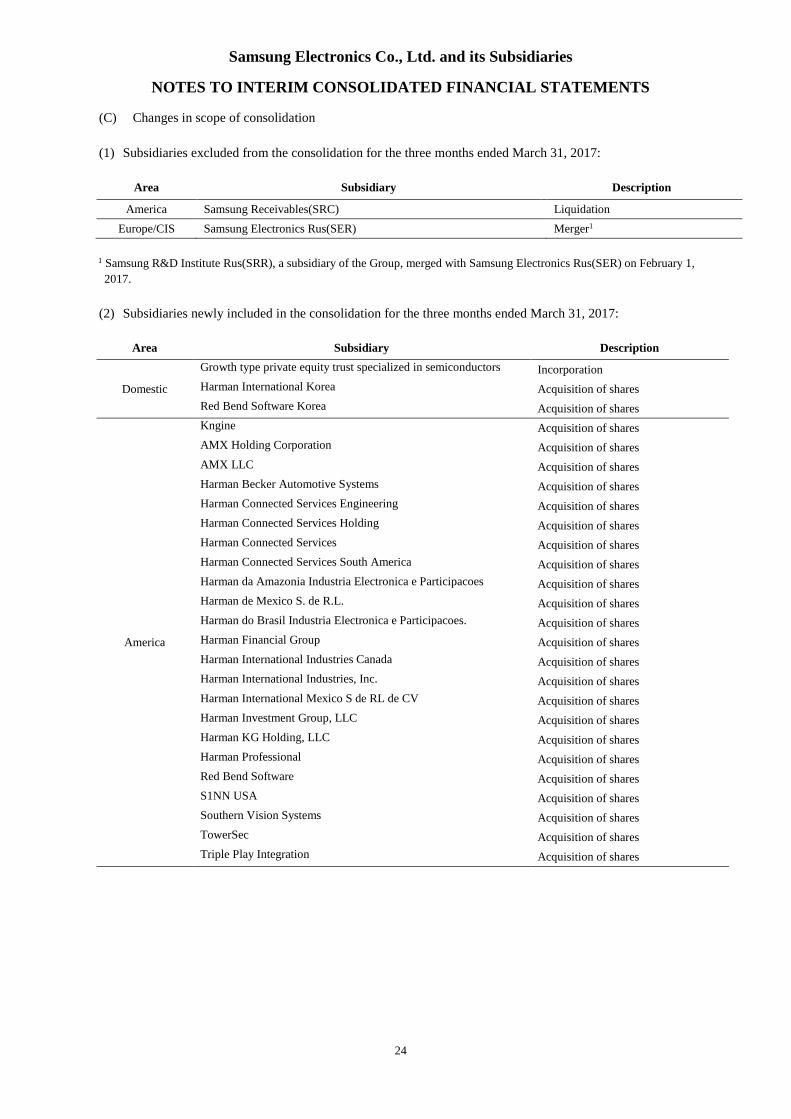
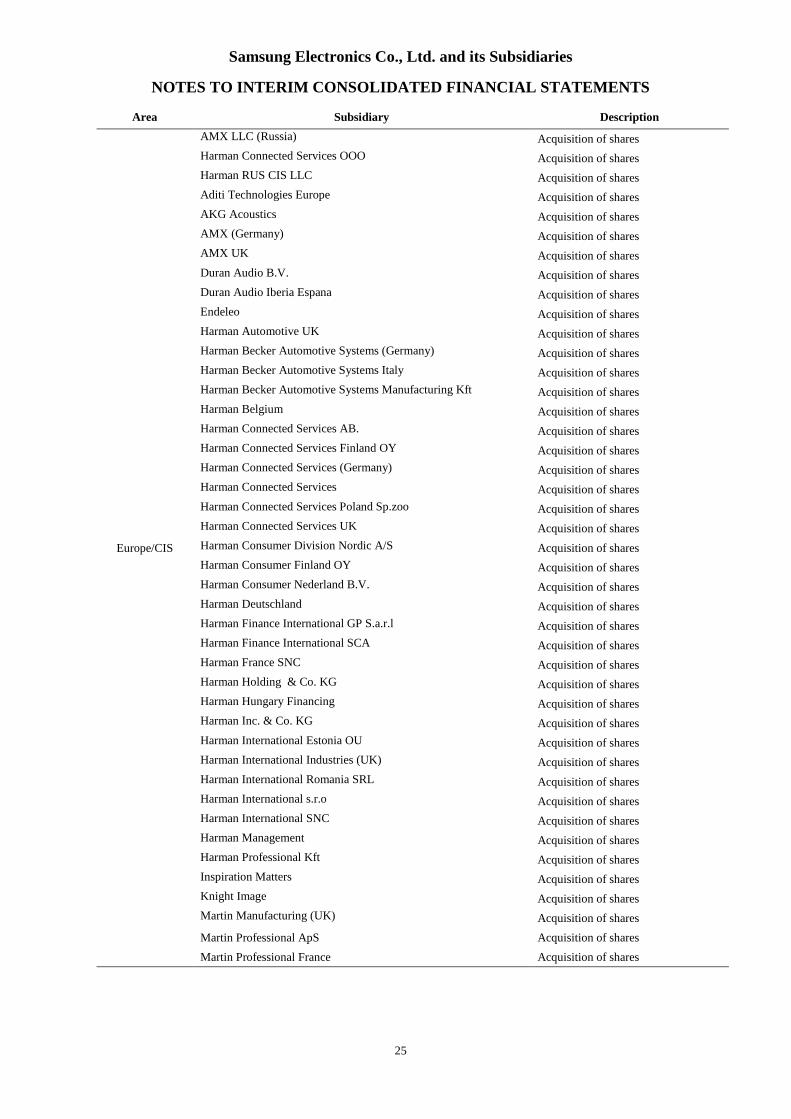
Samsung Electronics Co., Ltd. and its Subsidiaries
NOTES TO INTERIM CONSOLIDATED FINANCIAL STATEMENTS
29
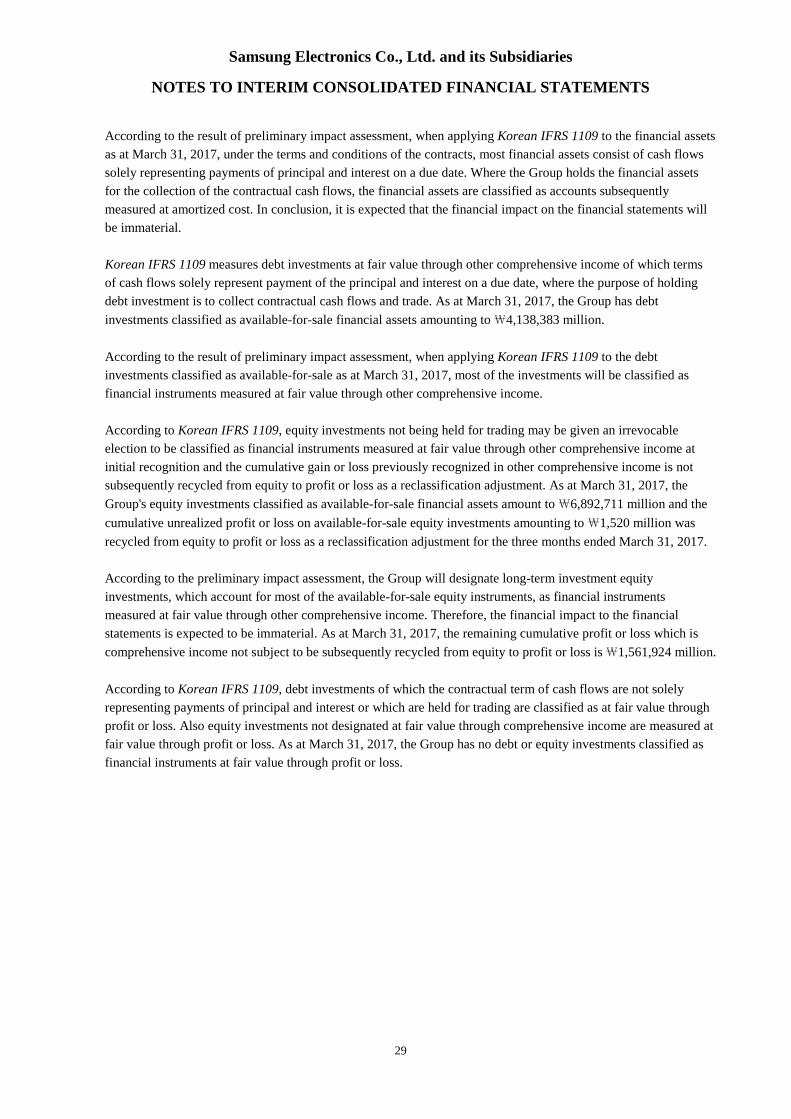
According to the result of preliminary impact assessment, when applying Korean IFRS 1109 to the financial assets
as at March 31, 2017, under the terms and conditions of the contracts, most financial assets consist of cash flows
solely representing payments of principal and interest on a due date. Where the Group holds the financial assets
for the collection of the contractual cash flows, the financial assets are classified as accounts subsequently
measured at amortized cost. In conclusion, it is expected that the financial impact on the financial statements will
be immaterial.
Korean IFRS 1109 measures debt investments at fair value through other comprehensive income of which terms
of cash flows solely represent payment of the principal and interest on a due date, where the purpose of holding
debt investment is to collect contractual cash flows and trade. As at March 31, 2017, the Group has debt
investments classified as available-for-sale financial assets amounting to\4,138,383 million.
According to the result of preliminary impact assessment, when applying Korean IFRS 1109 to the debt
investments classified as available-for-sale as at March 31, 2017, most of the investments will be classified as
financial instruments measured at fair value through other comprehensive income.
According to Korean IFRS 1109, equity investments not being held for trading may be given an irrevocable
election to be classified as financial instruments measured at fair value through other comprehensive income at
initial recognition and the cumulative gain or loss previously recognized in other comprehensive income is not
subsequently recycled from equity to profit or loss as a reclassification adjustment. As at March 31, 2017, the
Group's equity investments classified as available-for-sale financial assets amount to\6,892,711 million and the
cumulative unrealized profit or loss on available-for-sale equity investments amounting to \1,520 million was
recycled from equity to profit or loss as a reclassification adjustment for the three months ended March 31, 2017.
According to the preliminary impact assessment, the Group will designate long-term investment equity
investments, which account for most of the available-for-sale equity instruments, as financial instruments
measured at fair value through other comprehensive income. Therefore, the financial impact to the financial
statements is expected to be immaterial. As at March 31, 2017, the remaining cumulative profit or loss which is
comprehensive income not subject to be subsequently recycled from equity to profit or loss is\1,561,924 million.
According to Korean IFRS 1109, debt investments of which the contractual term of cash flows are not solely
representing payments of principal and interest or which are held for trading are classified as at fair value through
profit or loss. Also equity investments not designated at fair value through comprehensive income are measured at
fair value through profit or loss. As at March 31, 2017, the Group has no debt or equity investments classified as
financial instruments at fair value through profit or loss.
Samsung Electronics Co., Ltd. and its Subsidiaries
NOTES TO INTERIM CONSOLIDATED FINANCIAL STATEMENTS
30
(b) Classification and Measurement of Financial Liabilities
Korean IFRS 1109 requires the change in the liability’s fair value attributable to changes in the credit risk to be
recognized in other comprehensive income, unless this treatment of the credit risk component creates or enlarges a
measurement mismatch. Amounts presented in other comprehensive income are not subsequently transferred to
profit or loss.
Under Korean IFRS 1039, all financial liabilities designated at fair value through profit or loss recognized their
fair value movements in profit or loss. However, under Korean IFRS 1109, certain fair value movements will be
recognized in other comprehensive income thus profit or loss from fair value movements may decrease.
As at March 31, 2017, total financial liabilities account for \48,324,683 million of which \376,319 million are
designated to be measured at fair value through profit or loss.
According to the result of the preliminary impact assessment, financial liabilities measured at fair value through
profit and loss for the current terms as at March 31, 2017 have mostly short maturities and the credit risk
fluctuation of financial liabilities is insignificant. Therefore, it is expected that the impact of adopting Korean
IFRS 1109 will not be significant.
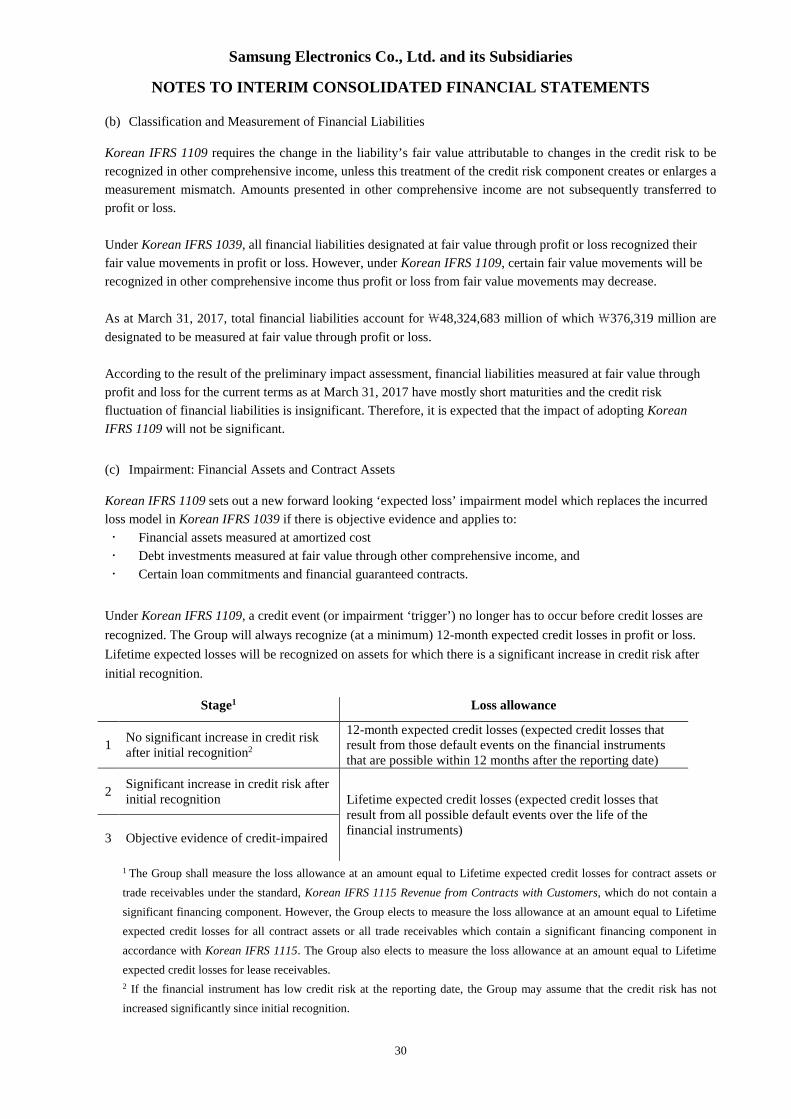
(c) Impairment: Financial Assets and Contract Assets
Korean IFRS 1109 sets out a new forward looking ‘expected loss’ impairment model which replaces the incurred
loss model in Korean IFRS 1039 if there is objective evidence and applies to:
Financial assets measured at amortized cost
Debt investments measured at fair value through other comprehensive income, and
Certain loan commitments and financial guaranteed contracts.
Under Korean IFRS 1109, a credit event (or impairment ‘trigger’) no longer has to occur before credit losses are
recognized. The Group will always recognize (at a minimum) 12-month expected credit losses in profit or loss.
Lifetime expected losses will be recognized on assets for which there is a significant increase in credit risk after
initial recognition.
Stage1 Loss allowance
1No significant increase in credit riskafter initial recognition2
12-month expected credit losses (expected credit losses thatresult from those default events on the financial instrumentsthat are possible within 12 months after the reporting date)
2Significant increase in credit risk afterinitial recognition Lifetime expected credit losses (expected credit losses that
result from all possible default events over the life of thefinancial instruments)
3 Objective evidence of credit-impaired
1 The Group shall measure the loss allowance at an amount equal to Lifetime expected credit losses for contract assets or
trade receivables under the standard, Korean IFRS 1115 Revenue from Contracts with Customers, which do not contain a
significant financing component. However, the Group elects to measure the loss allowance at an amount equal to Lifetime
expected credit losses for all contract assets or all trade receivables which contain a significant financing component in
accordance with Korean IFRS 1115. The Group also elects to measure the loss allowance at an amount equal to Lifetime
expected credit losses for lease receivables.
2 If the financial instrument has low credit risk at the reporting date, the Group may assume that the credit risk has not
increased significantly since initial recognition.
Samsung Electronics Co., Ltd. and its Subsidiaries
NOTES TO INTERIM CONSOLIDATED FINANCIAL STATEMENTS
31
Under Korean IFRS 1109, the asset that is credit-impaired at initial recognition would recognize all changes in
lifetime expected credit losses since the initial recognition as a loss allowance with any changes recognized in
profit or loss.
The Group owns loan and trade receivables amounting to\97,132,662 million and debt investments classified as
available-for-sale financial assets measured at fair value through other comprehensive income amounting to
\4,138,383 million. The relative loss allowance is\498,670 million as at March 31, 2017.
(d) Hedge Accounting
Hedge accounting mechanics (fair value hedges, cash flow hedges and hedge of net investments in a foreign
operations) required by Korean IFRS 1039 remains unchanged in Korean IFRS 1109, however, the new hedge
accounting rules will align the accounting for hedging instruments more closely with the Group’s risk
management practices. As a general rule, more hedge relationships might be eligible for hedge accounting, as the
standard introduces a more principles-based approach. Korean IFRS 1109 allows more hedging instruments and
hedged items to qualify for hedge accounting, and relaxes the hedge accounting requirement by removing two
hedge effectiveness tests that are a prospective test to ensure that the hedging relationship is expected to be highly
effective and a quantitative retrospective test (within range of 80~125%) to ensure that the hedging relationship
has been highly effective throughout the reporting period.
With implementation of Korean IFRS 1109, volatility in profit or loss may be reduced as some items that were not
eligible as hedged items or hedging instruments under Korean IFRS 1039 are now eligible under Korean IFRS
1109.
When the Group first applies Korean IFRS 1109, it may choose its accounting policy to continue to apply all of
the hedge accounting requirements of Korean IFRS 1039 instead of the requirements of Korean IFRS 1109.
The Group has performed preliminary assessment based on the assumption to apply hedge accounting in Korean
IFRS 1109, although the Group has not decided whether to choose Korean IFRS 1109 or Korean IFRS 1039 when
first adopting Korean IFRS 1109. The Group applies hedge accounting for risk of changes in cash flows from
various transactions including inventory purchase. As most of the hedge transactions meet retrospective
qualification of high effectiveness (80~125%) for hedge accounting in Korean IFRS 1039, there would be no
material impact adopting Korean IFRS 1109.
Samsung Electronics Co., Ltd. and its Subsidiaries
NOTES TO INTERIM CONSOLIDATED FINANCIAL STATEMENTS
32
Korean IFRS 1115, Revenue from Contracts with Customers
Korean IFRS 1115, Revenue from Contracts with Customers issued on November 6, 2015 is effective for annual
periods beginning on or after January 1, 2018 with early application permitted. This standard replaces Korean
IFRS 1018 Revenue, Korean IFRS 1011 Construction Contracts, Interpretation 2031 Revenue-Barter
2115 Agreements for the Construction of Real Estate and Interpretation 2118 Transfers of assets from customers.
The Group will apply Korean IFRS 1115 Revenue from Contracts with Customers for annual reporting periods
beginning on or after January 1, 2018. Accumulated effects for first adoption of Korean IFRS 1115 would be
reflected in beginning retained earnings or other equity components, if applicable. Based on the transition rule in
Korean IFRS 1115, the Group will apply the standard retrospectively to prior periods only for the ongoing
contracts at the first adoption date, with no restatement for completed contracts.
The new standard is based on the principle that revenue is recognized when control of goods or services transfers
to a customer – so the notion of control replaces the existing notion of risks and rewards. A new five-step process
must be applied before revenue from contract with customer can be recognized:
Identify contracts with customers
Identify the separate performance obligation
Determine the transaction price of the contract
Allocate the transaction price to each of the separate performance obligations, and
Recognize the revenue as each performance obligation is satisfied.
In course of preparation for applying Korean IFRS 1115, the Group has organized specific task force team which
consists of finance and IT personnel, if necessary, as at March 31, 2017. The Group will analyze financial impact
of Korean IFRS 1115 in material way and disclose the results in the notes to the financial statements in 2017.
Based on the information available at the end of the reporting period, the Group is in the process of preliminary
assessment of the potential impact on the financial statements for the year 2017 when applying Korean IFRS 1115,
and the interim results are set out below. The Group will analyze more specific financial impacts based on
additional information in the future.
(a) Identification of performance obligations
The Group's IM (information technology & mobile communications) business consists of mobile phone,communication systems and computers. The Group manufactures and installs network communication systems,and provides them to customers. In 2016, the related revenue from such activities did not account for a largeportion of total revenue. When applying Korean IFRS 1115, performance obligation, such as network systemproduction with customers, distinguished as technical support in the integrated contract such as (1) product sales,(2) installation service, and (3) maintenance, were identified. The timing of revenue recognition may changedepending on whether each performance obligation is fulfilled at one time or over a period of time.
The Group could not identify specific financial impact of separating performance obligation. However, based onthe result of preliminary assessment for the three months ended March 31, 2017, the impact on the Group’srevenue will not be material.
Samsung Electronics Co., Ltd. and its Subsidiaries
NOTES TO INTERIM CONSOLIDATED FINANCIAL STATEMENTS
33
(b) Variable consideration
As the Group allows returns when selling products and merchandise, variability in consideration may occur. Whenapply Korean IFRS 1115, the Group estimates the variable consideration using an expectation-value method thatis expected to better anticipate the consideration to which the Group is entitled, and recognizes revenue byincluding variable consideration in the transaction price only to the amount that it is highly unlikely to reverse asignificant portion of the cumulative revenue amount that has already been recognized, at the end of the returnperiod. Amounts not expected to be consideration received or receivable are recognized as a refund liability.
The Group could not identify specific financial impact of variable consideration. However, based on the result ofpreliminary assessment for the three months ended March 31, 2017, the impact on the Group’s revenue will not bematerial.
(c) Allocation of transaction price
When applying Korean IFRS 1115, the Group allocates transaction prices based on the relative individual sellingprices to the various performance obligations identified in a single contract. The Group will use the 'MarketValuation Adjustment Approach' to estimate the individual selling prices of each performance obligation and willuse the 'Estimated Cost Plus Margin Approach', which predicts the expected costs and adds the appropriate profitsto the transactions.
The Group could not identify specific financial impact of allocating transaction prices based on relative individualselling prices. However, based on the result of preliminary assessment for the three months ended March 31, 2017,the impact on the Group’s revenue will not be material.
2.2 Accounting Policies
Significant accounting policies and estimates adopted in the preparation of the interim consolidated financial
statements are consistent with those adopted in the preparation of the annual consolidated financial statements for
the year ended December 31, 2016, except changes in accounting policies applied in the financial year beginning on
January 1, 2017 (Note 2.1) and as described below.
Income tax expense for the interim period is recognized based on management’s best estimate of the weighted
average annual effective income tax rate expected for the full financial year. The estimated average annual tax rate
is applied to the pre-tax income.
2.3 Convenience Translation into United States Dollar Amounts
The Group operates primarily in Korean won and its official accounting records are maintained in Korean won. The
US dollar amounts provided in the financial statements represent supplementary information solely for the
convenience of the reader. All Korean won amounts are expressed in US dollars at the rate of₩1154.65 to US $1,
the average exchange rate for the three month period ended in March 31, 2017. Such presentation is not in
accordance with generally accepted accounting principles, and should not be construed as a representation that the
Korean won amounts shown could be readily converted, realized or settled in U.S. dollars at this or at any other
rate.
Samsung Electronics Co., Ltd. and its Subsidiaries
NOTES TO INTERIM CONSOLIDATED FINANCIAL STATEMENTS
34
2.4 Critical Accounting Estimates and Assumptions
In preparing the interim consolidated financial statements, the management of the Group makes estimates and
assumptions on matters which affect the application of policies and reported amounts of assets, liabilities, income
and expenses. Estimates and assumptions are continually evaluated and are based on historical experience and other
factors, including expectations of future events that are believed to be reasonable under the circumstances. The
resulting accounting estimates, by definition, seldom equal the related actual results.
Critical accounting estimates and assumptions made in the preparation of the interim consolidated financial
statements are consistent with those made in the preparation of the annual consolidated financial statements for the
year ended December 31, 2016, except for the estimation methodologies applied in deriving corporate income tax.
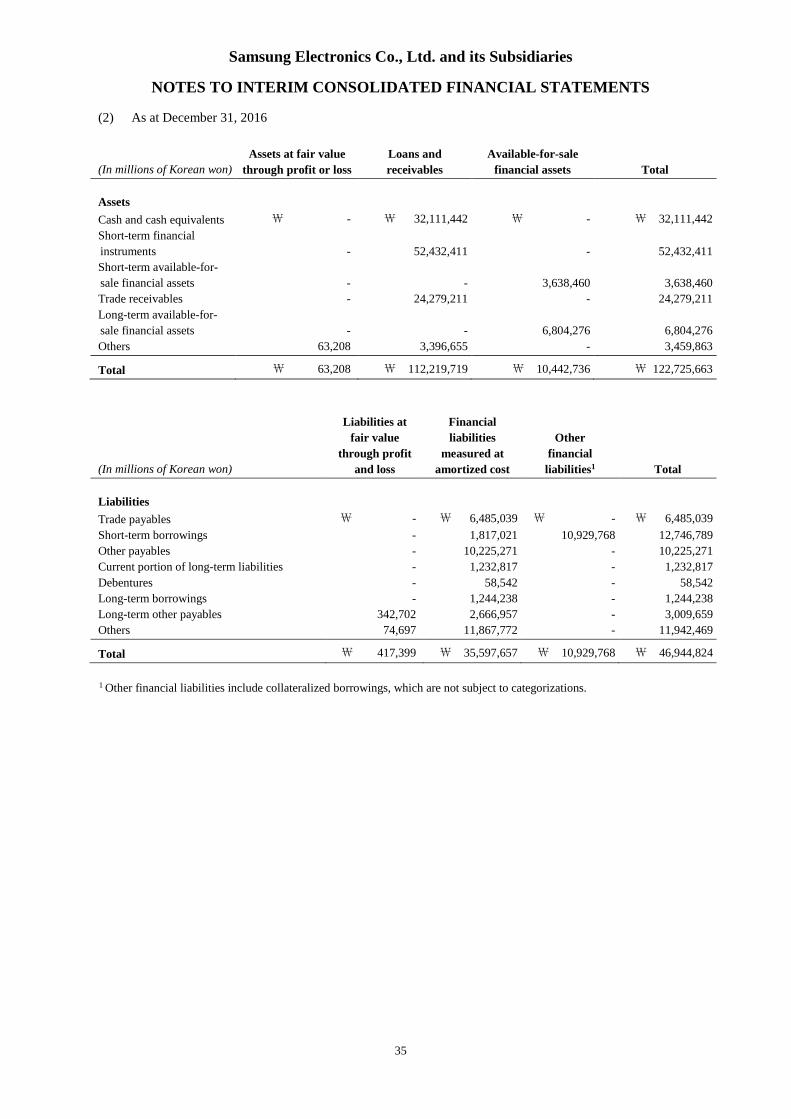
3. Financial Instruments by Category
Categorizations of financial assets and liabilities as at March 31, 2017 and December 31, 2016, are as follows:
1 The maximum exposure to credit risk of available-for-sale debt securities is the carrying value at the reporting date.
(B) Details of listed equity securities as at March 31, 2017 and December 31, 2016, are as follows:
March 31, 2017
December 31,
2016
(In millions of Korean won,
number of shares and
percentage)
Number of
Shares Owned
Percentage of
Ownership (%) Acquisition Cost
Book Amount
(Market Value)
Book Amount
(Market Value)
Samsung Heavy Industries 65,930,982 16.9 473,727 738,427 609,862
Hotel Shilla 2,004,717 5.1 13,957 90,413 96,527
iMarket Korea 647,320 1.8 324 8,642 6,732
SFA 1,822,000 10.2 38,262 131,913 117,519
Wonik Holdings 3,518,342 4.6 30,821 19,316 23,714
Wonik IPS 3,701,872 9.0 32,428 92,177 96,989
ASML 6,297,787 1.5 363,012 934,344 851,395
Wacom 8,398,400 5.2 62,013 33,725 26,647
BYD 52,264,808 1.9 528,665 407,258 449,872
Others 47,306 44,407 82,978
Total ₩ 1,590,515 ₩ 2,500,622 ₩ 2,362,235
Acquisition cost includes impairment loss on available-for-sale financial assets recognized due to the decline inrealizable value below acquisition cost. The difference between the acquisition cost, net of impairment loss and thecurrent fair value is recorded within other components of equity, net of tax effects (unrealized gains or losses onavailable-for-sale financial assets).
5. Inventories
Inventories as at March 31, 2017 and December 31, 2016, are as follows:
Work in process 5,991,069 (318,383) 5,672,686 5,334,607 (317,223) 5,017,384
Raw materials and supplies 10,044,122 (1,036,075) 9,008,047 7,526,608 (1,032,442) 6,494,166
Materials in transit 914,795 - 914,795 936,614 - 936,614
Total ₩25,195,227 ₩(3,337,629) ₩21,857,598 ₩21,780,679 ₩ (3,427,176) ₩18,353,503
1 Inventories for which the Group has suspended sales or production, are evaluated based on net realizable value. Valuation
allowance is recorded if the net realizable value is less than the book amount.
Samsung Electronics Co., Ltd. and its Subsidiaries
NOTES TO INTERIM CONSOLIDATED FINANCIAL STATEMENTS
37
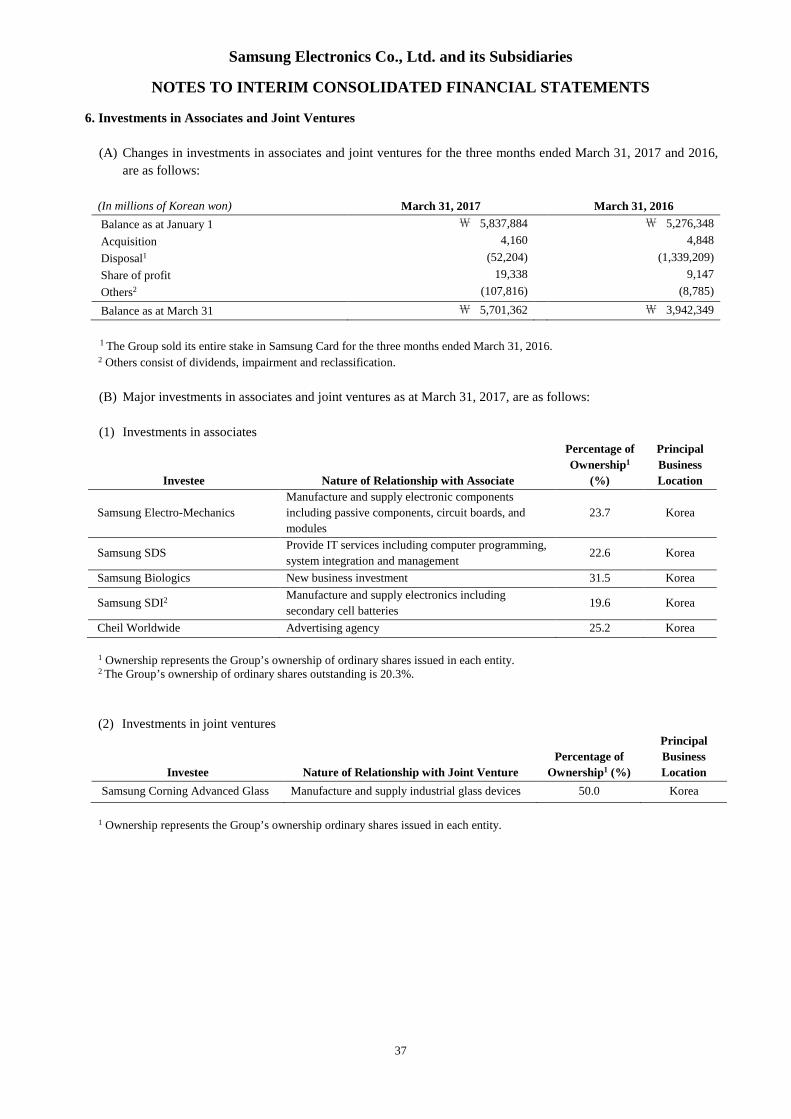
6. Investments in Associates and Joint Ventures
(A) Changes in investments in associates and joint ventures for the three months ended March 31, 2017 and 2016,
are as follows:
(In millions of Korean won) March 31, 2017 March 31, 2016
Balance as at January 1 ₩ 5,837,884 ₩ 5,276,348
Acquisition 4,160 4,848
Disposal1 (52,204) (1,339,209)
Share of profit 19,338 9,147
Others2 (107,816) (8,785)
Balance as at March 31 ₩ 5,701,362 ₩ 3,942,349
1 The Group sold its entire stake in Samsung Card for the three months ended March 31, 2016.2 Others consist of dividends, impairment and reclassification.
(B) Major investments in associates and joint ventures as at March 31, 2017, are as follows:
(1) Investments in associates
Investee Nature of Relationship with Associate
Percentage of
Ownership1
(%)
Principal
Business
Location
Samsung Electro-Mechanics
Manufacture and supply electronic components
including passive components, circuit boards, and
modules
23.7 Korea
Samsung SDSProvide IT services including computer programming,
system integration and management22.6 Korea
Samsung Biologics New business investment 31.5 Korea
Samsung SDI2 Manufacture and supply electronics including
secondary cell batteries19.6 Korea
Cheil Worldwide Advertising agency 25.2 Korea
1 Ownership represents the Group’s ownership of ordinary shares issued in each entity.2 The Group’s ownership of ordinary shares outstanding is 20.3%.
(2) Investments in joint ventures
Investee Nature of Relationship with Joint Venture
Percentage of
Ownership1 (%)
Principal
Business
Location
Samsung Corning Advanced Glass Manufacture and supply industrial glass devices 50.0 Korea
1 Ownership represents the Group’s ownership ordinary shares issued in each entity.
Samsung Electronics Co., Ltd. and its Subsidiaries
NOTES TO INTERIM CONSOLIDATED FINANCIAL STATEMENTS
38
(C) Details of investments in associates and joint ventures as at March 31, 2017 and December 31, 2016, are as
Profit(Loss) from continuing operations1 31,283 127,850 (25,702) - -
Other comprehensive income (loss)1 11,576 (6,583) (1,504) - -
Total comprehensive income (loss)1 42,859 121,267 (27,206) - -
2. Dividends from associates
Dividends ₩ 8,847 ₩ 8,736 ₩ - ₩ - ₩ -
Samsung Electronics Co., Ltd. and its Subsidiaries
NOTES TO INTERIM CONSOLIDATED FINANCIAL STATEMENTS
41
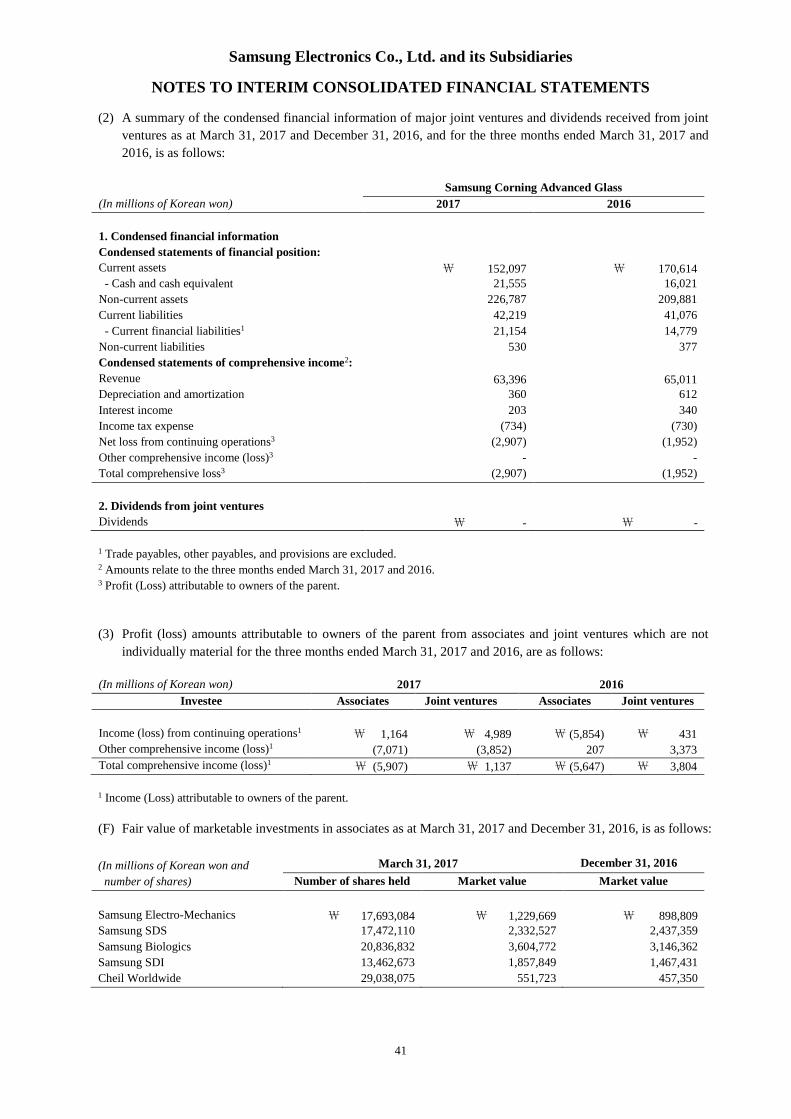
(2) A summary of the condensed financial information of major joint ventures and dividends received from joint
ventures as at March 31, 2017 and December 31, 2016, and for the three months ended March 31, 2017 and
2016, is as follows:
Samsung Corning Advanced Glass
(In millions of Korean won) 2017 2016
1. Condensed financial information
Condensed statements of financial position:
Current assets ₩ 152,097 ₩ 170,614- Cash and cash equivalent 21,555 16,021
Non-current assets 226,787 209,881
Current liabilities 42,219 41,076
- Current financial liabilities1 21,154 14,779
Non-current liabilities 530 377
Condensed statements of comprehensive income2:
Revenue 63,396 65,011Depreciation and amortization 360 612
Interest income 203 340
Income tax expense (734) (730)
Net loss from continuing operations3 (2,907) (1,952)
Other comprehensive income (loss)3 - -
Total comprehensive loss3 (2,907) (1,952)
2. Dividends from joint ventures
Dividends ₩ - ₩ -
1 Trade payables, other payables, and provisions are excluded.2 Amounts relate to the three months ended March 31, 2017 and 2016.3 Profit (Loss) attributable to owners of the parent.
(3) Profit (loss) amounts attributable to owners of the parent from associates and joint ventures which are not
individually material for the three months ended March 31, 2017 and 2016, are as follows:
Samsung Electronics Co., Ltd. and its Subsidiaries
NOTES TO INTERIM CONSOLIDATED FINANCIAL STATEMENTS
42
7. Property, Plant and Equipment
(A) Changes in property, plant and equipment for the three months ended March 31, 2017 and 2016, are as follows:
(In millions of Korean won) 2017 2016
Balance as at January 1 ₩ 91,473,041 ₩ 86,477,110Acquisition and capital expenditures 9,819,857 4,570,445
Business combinations1 858,796 -
Depreciation (4,769,499) (5,121,375)
Disposals/scrap/impairment (48,699) (27,502)
Other2 (2,011,078) (333,331)
Balance as at March 31 ₩ 95,322,418 ₩ 85,565,347
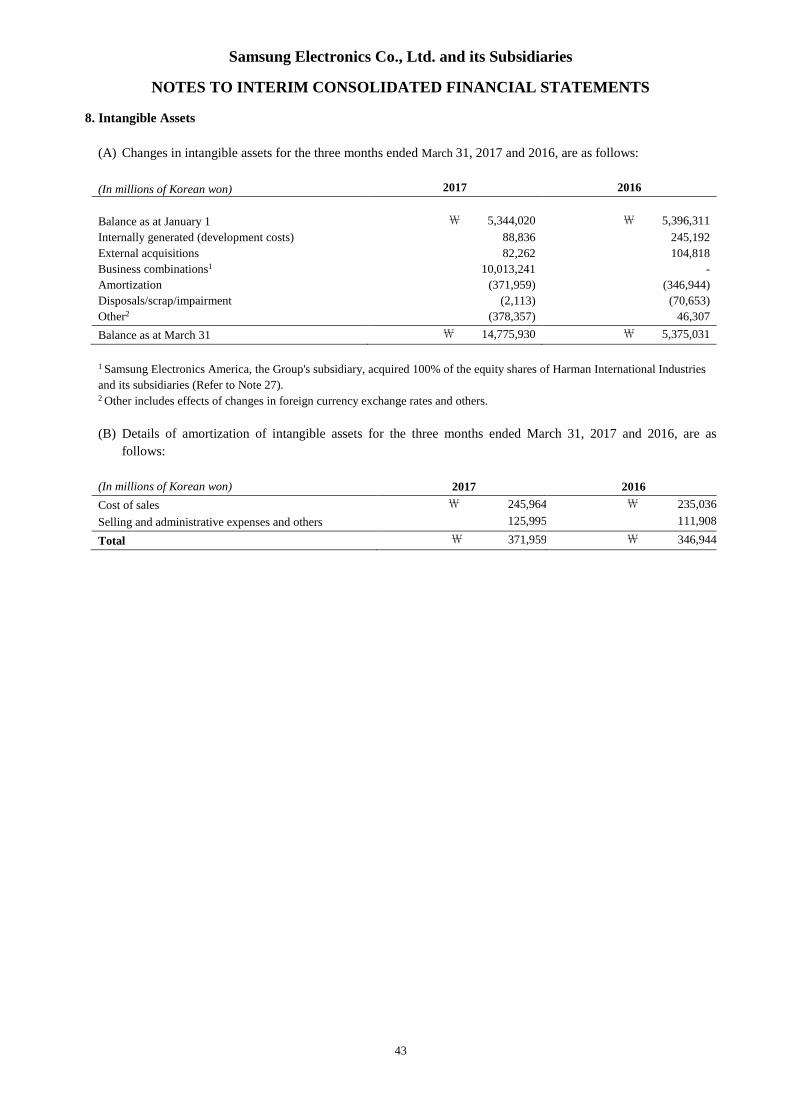
1 Samsung Electronics America, the Group's subsidiary, acquired 100% of the equity shares of Harman International Industries
and its subsidiaries (Refer to Note 27).2 Other includes effects of changes in foreign currency exchange rates and effects of the offset related to government assistance.
(B) Details of depreciation of property, plant and equipment for the three months ended March 31, 2017 and 2016,
are as follows:
(In millions of Korean won) 2017 2016
Cost of sales ₩ 4,252,772 ₩ 4,640,002
Selling and administrative expenses and others 516,727 481,373
Total ₩ 4,769,499 ₩ 5,121,375
Samsung Electronics Co., Ltd. and its Subsidiaries
NOTES TO INTERIM CONSOLIDATED FINANCIAL STATEMENTS
43
8. Intangible Assets
(A) Changes in intangible assets for the three months ended March 31, 2017 and 2016, are as follows:
1 Collateralized borrowings are secured by trade receivables.2 Leased property, plant and equipment were pledged as collateral.
10. Debentures
Details of foreign currency denominated debentures as at March 31, 2017 and December 31, 2016 are as follows:
(In millions of Korean
Won) Issue Date Due Date
Annual Interest Rates (%)
as of March 31, 2017
March 31,
2017
December 31,
2016
US dollar denominated
straight bonds11997.10.2 2027.10.1 7.7 ₩ 61,386
(US$55 million)
₩ 66,468
(US$55 million)
US dollar denominated
unsecured bonds2 2012.4.10 2017.4.10 1.81,116,100
(US$1,000 million)
1,208,500
(US$1,000 million)
US dollar denominated
debenture bonds3 2015.5.11 2025.5.15 4.2446,440
(US$400 million)
-
EURO denominated
debenture bonds42015.5.27 2022.5.27 2.0
417,412
(EUR€350 million)-
Less: Current Portion (1,121,681) (1,214,543)
Less: Discounts (1,675) (1,883)
More: Premium 32,291 -
Total ₩ 950,273 ₩ 58,542
1 US dollar denominated straight bonds are repaid annually for twenty years after a ten-year grace period from the date of
issuance. Interest is paid semi-annually.2 Samsung Electronics America issued dollar denominated unsecured bonds. Repayment of these debentures is due on the date
of maturity and interest is paid semi-annually.3 Harman International Industries issued dollar denominated debenture bonds. Repayment of these debentures is due on the date
of maturity and interest is paid semi-annually.4 Harman International Industries issued euro denominated debenture bonds. Repayment of these debentures is due on the date
of maturity and interest is paid annually.
Samsung Electronics Co., Ltd. and its Subsidiaries
NOTES TO INTERIM CONSOLIDATED FINANCIAL STATEMENTS
45
11. Net Defined Benefit Liabilities (Assets)
(A) Details of net defined benefit liabilities(assets) recognized on the statements of financial position as at March 31,
2017 and December 31, 2016 are as follows:
(In millions of Korean won) March 31, 2017 December 31, 2016
Present value of funded defined benefit obligations ₩ 7,220,320 ₩ 7,167,929
Present value of unfunded defined benefit obligations 396,300 110,885
Subtotal 7,616,620 7,278,814
Fair value of plan assets (7,616,461) (7,662,249)
Total ₩ 159 ₩ (383,435)
(B) The amounts recognized in the statements of profit or loss for the three months ended March 31, 2017 and 2016
relating to defined benefit plans are as follows:
(In millions of Korean won) 2017 2016
Current service cost ₩ 226,348 ₩ 276,583
Net interest cost(income) (3,382) 4,025
Others (2,724) (7,202)
Total ₩ 220,242 ₩ 273,406
(C) The pension expenses related to defined benefit plans by line item recognized on the statements of profit or loss
for the three months ended March 31, 2017 and 2016 are as follows:
(In millions of Korean won) 2017 2016
Cost of sales ₩ 86,733 ₩ 119,656
Selling and administrative expenses and others 133,509 153,750
Total ₩ 220,242 ₩ 273,406
Samsung Electronics Co., Ltd. and its Subsidiaries
NOTES TO INTERIM CONSOLIDATED FINANCIAL STATEMENTS
46
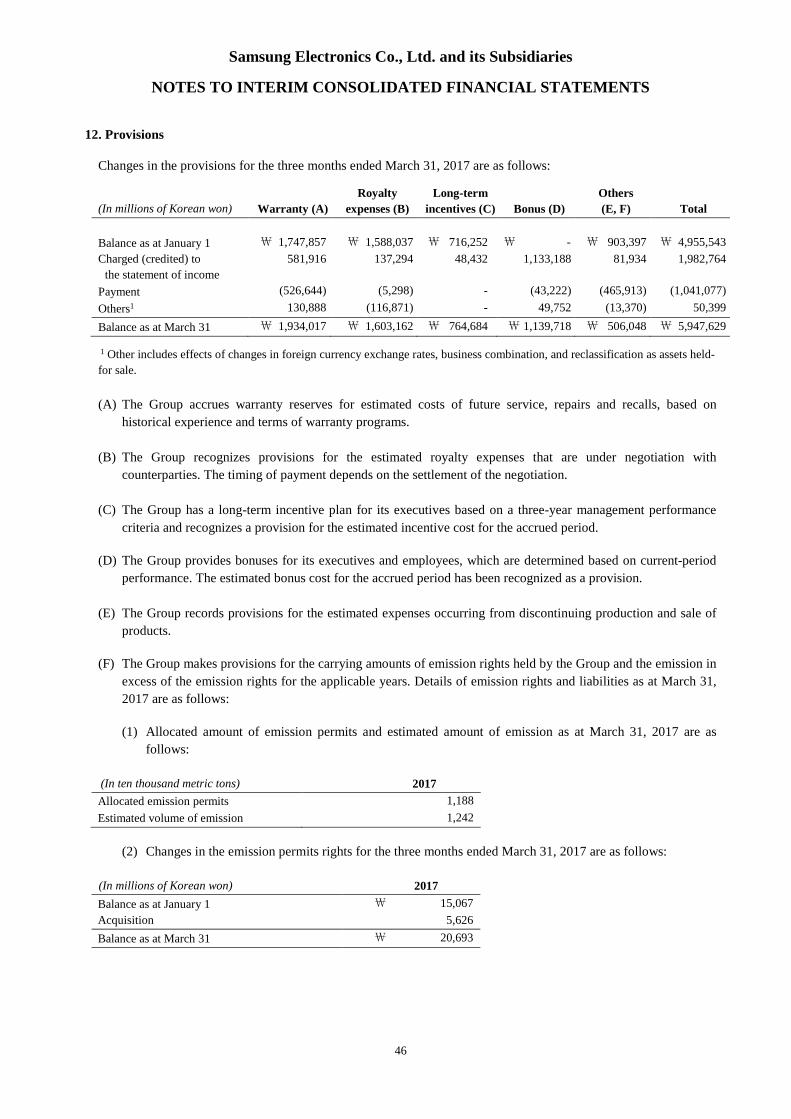
12. Provisions
Changes in the provisions for the three months ended March 31, 2017 are as follows:
(In millions of Korean won) Warranty (A)
Royalty
expenses (B)
Long-term
incentives (C) Bonus (D)
Others
(E, F) Total
Balance as at January 1 ₩ 1,747,857 ₩ 1,588,037 ₩ 716,252 ₩ - ₩ 903,397 ₩ 4,955,543
Expenses by nature for the three months ended March 31, 2017 and 2016 consist of the following:
(In millions of Korean won) 2017 2016
Changes in finished goods and work in process ₩ (1,012,033) ₩ (114,432)
Raw materials used and merchandise purchased and others 17,067,611 18,866,930
Wages and salaries 5,096,752 4,874,819
Pension 236,784 292,363
Depreciation 4,769,499 5,121,375
Amortization 371,959 346,944
Welfare 932,518 911,630
Commission and service charges 1,843,706 2,197,277
Other expenses 11,342,369 10,609,534
Total1 ₩ 40,649,165 ₩ 43,106,440
1 Equal to the sum of cost of sales and selling and administrative expenses on the interim consolidated statements of profit or
loss.
Samsung Electronics Co., Ltd. and its Subsidiaries
NOTES TO INTERIM CONSOLIDATED FINANCIAL STATEMENTS
51
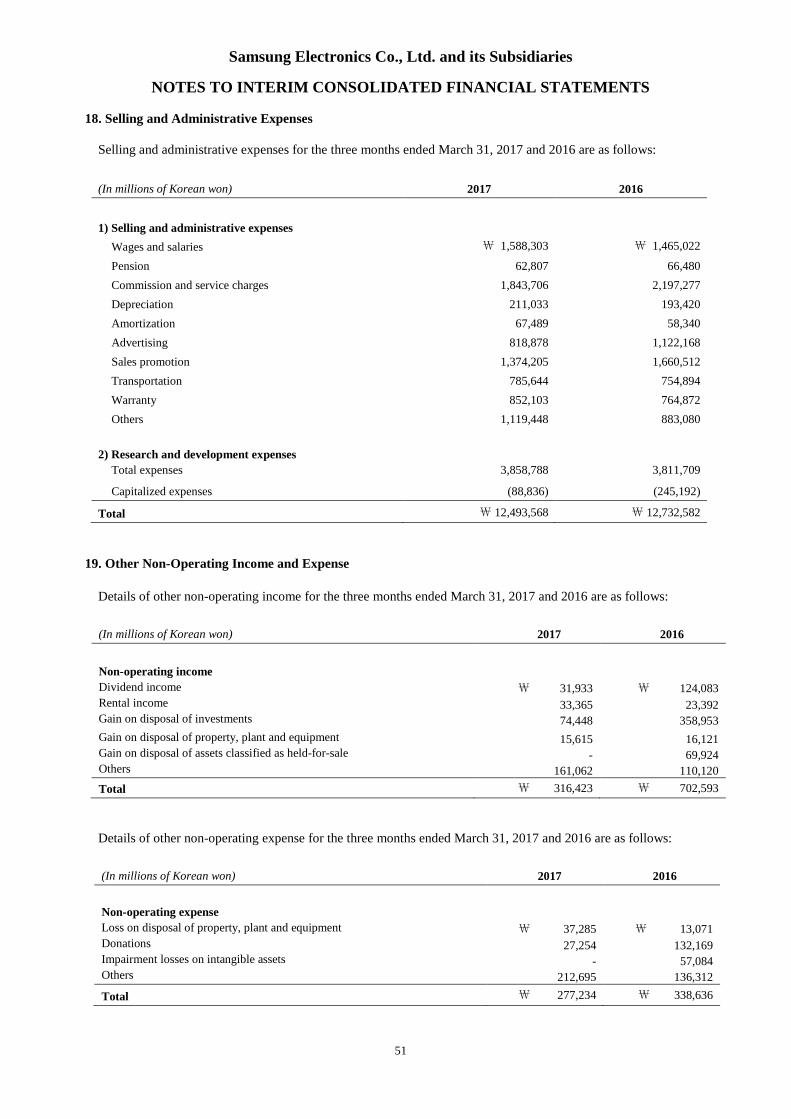
18. Selling and Administrative Expenses
Selling and administrative expenses for the three months ended March 31, 2017 and 2016 are as follows:
(In millions of Korean won) 2017 2016
1) Selling and administrative expenses
Wages and salaries ₩ 1,588,303 ₩ 1,465,022
Pension 62,807 66,480
Commission and service charges 1,843,706 2,197,277
Depreciation 211,033 193,420
Amortization 67,489 58,340
Advertising 818,878 1,122,168
Sales promotion 1,374,205 1,660,512
Transportation 785,644 754,894
Warranty 852,103 764,872
Others 1,119,448 883,080
2) Research and development expenses
Total expenses 3,858,788 3,811,709
Capitalized expenses (88,836) (245,192)
Total ₩ 12,493,568 ₩ 12,732,582
19. Other Non-Operating Income and Expense
Details of other non-operating income for the three months ended March 31, 2017 and 2016 are as follows:
(In millions of Korean won) 2017 2016
Non-operating income
Dividend income ₩ 31,933 ₩ 124,083Rental income 33,365 23,392Gain on disposal of investments 74,448 358,953
Gain on disposal of property, plant and equipment 15,615 16,121Gain on disposal of assets classified as held-for-sale - 69,924Others 161,062 110,120
Total ₩ 316,423 ₩ 702,593
Details of other non-operating expense for the three months ended March 31, 2017 and 2016 are as follows:
(In millions of Korean won) 2017 2016
Non-operating expense
Loss on disposal of property, plant and equipment ₩ 37,285 ₩ 13,071Donations 27,254 132,169Impairment losses on intangible assets - 57,084Others 212,695 136,312
Total ₩ 277,234 ₩ 338,636
Samsung Electronics Co., Ltd. and its Subsidiaries
NOTES TO INTERIM CONSOLIDATED FINANCIAL STATEMENTS
52
20. Financial Income and Costs
(A) Details of financial income and costs for the three months ended March 31, 2017 and 2016 are as follows:
(In millions of Korean won) 2017 2016
Financial income
Interest income: ₩ 400,606 ₩ 392,981
Interest income from loans and receivables 400,129 374,505
Interest income from available-for-sale financial assets 477 18,476
Foreign exchange differences 1,485,057 2,429,440
Gains from derivatives 211,489 257,508
Total ₩ 2,097,152 ₩ 3,079,929
(In millions of Korean won) 2017 2016
Financial costs
Interest expense: ₩ 148,390 ₩ 166,481
Interest expense from financial liabilities measured at amortized cost 90,298 113,590
Other financial liabilities 58,092 52,891
Foreign exchange differences 1,492,524 2,558,627
Losses from derivatives 248,550 281,252
Total ₩ 1,889,464 ₩ 3,006,360
(B) The Group recognizes foreign exchange gains and losses arising from foreign currency transactions and
translation as financial income and costs.
21. Income Tax Expense
Income tax expense is recognized based on management’s best estimate of the weighted average annual effective
income tax rate expected for the full financial year. The average annual tax rate expected as at March 31, 2017 to be
effective for the year ended December 31, 2017 is 24.4%.
Samsung Electronics Co., Ltd. and its Subsidiaries
NOTES TO INTERIM CONSOLIDATED FINANCIAL STATEMENTS
53
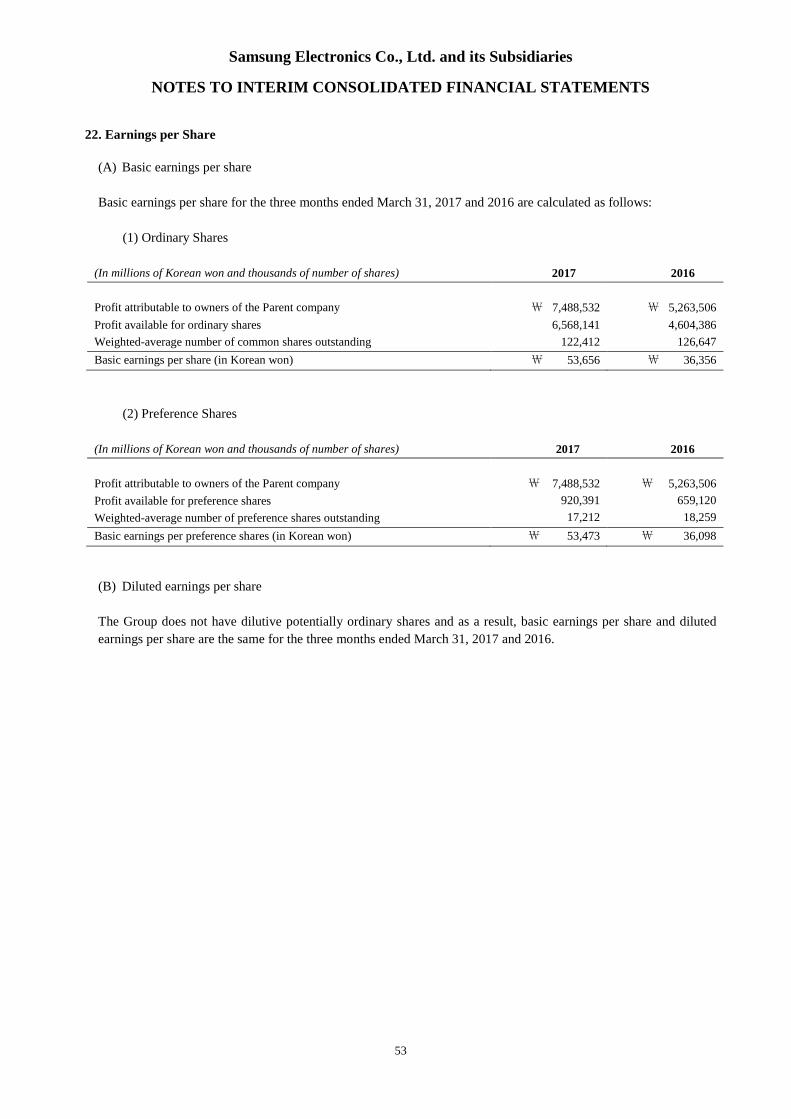
22. Earnings per Share
(A) Basic earnings per share
Basic earnings per share for the three months ended March 31, 2017 and 2016 are calculated as follows:
(1) Ordinary Shares
(In millions of Korean won and thousands of number of shares) 2017 2016
Profit attributable to owners of the Parent company ₩ 7,488,532 ₩ 5,263,506
Profit available for ordinary shares 6,568,141 4,604,386
Weighted-average number of common shares outstanding 122,412 126,647
Basic earnings per share (in Korean won) ₩ 53,656 ₩ 36,356
(2) Preference Shares
(In millions of Korean won and thousands of number of shares) 2017 2016
Profit attributable to owners of the Parent company ₩ 7,488,532 ₩ 5,263,506
Profit available for preference shares 920,391 659,120
Weighted-average number of preference shares outstanding 17,212 18,259
Basic earnings per preference shares (in Korean won) ₩ 53,473 ₩ 36,098
(B) Diluted earnings per share
The Group does not have dilutive potentially ordinary shares and as a result, basic earnings per share and diluted
earnings per share are the same for the three months ended March 31, 2017 and 2016.
Samsung Electronics Co., Ltd. and its Subsidiaries
NOTES TO INTERIM CONSOLIDATED FINANCIAL STATEMENTS
54
23. Cash Generated from Operation
Adjustments and changes in assets and liabilities arising from operating activities for the three months ended March
31, 2017 and 2016 are as follows:
- Adjustments
(In millions of Korean won) 2017 2016
Adjustments for:
Income tax expense ₩ 2,480,222 ₩ 1,869,682
Finance income (1,250,044) (1,264,395)
Finance costs 975,942 1,501,635
Severance and retirement benefits 236,784 292,363
Depreciation 4,769,499 5,121,375
Amortization 371,959 346,944
Bad debt expenses 264,839 184,141
Gain on valuation of equity method (19,338) (9,147)
Gain on disposal of property, plant and equipment (15,615) (16,121)
Loss on disposal of property, plant and equipment 37,285 13,071
Impairment losses on intangible assets - 57,084
Obsolescence and scrapping of inventories 395,869 385,614
Gain on disposal of investments (74,448) (358,953)
Gain on disposal of assets classified as held-for-sale - (69,924)
Dividend income (31,933) (124,083)
Other income/expense (231,509) (125,161)
Total ₩ 7,909,512 ₩ 7,804,125
- Changes in assets and liabilities arising from operating activities
(In millions of Korean won) 2017 2016
Changes in assets and liabilities :
Decrease(increase) in trade receivables ₩ 2,125,284 ₩ (211,494)
Decrease in other receivables 168,469 338,991
Increase in advances (124,697) (19,643)
Decrease(increase) in prepaid expenses 142,215 (978,216)
Increase in inventories (3,893,502) (279,815)
Increase in trade payables 3,083,919 1,180,366
Decrease in other payables (637,142) (369,042)
Decrease in advances received (224,138) (9,973)
Increase(decrease) in withholdings (124,745) 236,360
Decrease in accrued expenses (3,731,064) (2,433,157)
Increase in provisions 1,039,796 76,719
Payment of severance benefits (199,537) (121,902)
Others (835,943) 297,707
Total ₩ (3,211,085) ₩ (2,293,099)
Samsung Electronics Co., Ltd. and its Subsidiaries
NOTES TO INTERIM CONSOLIDATED FINANCIAL STATEMENTS
55
24. Financial Risk Management
The Group’s financial risk management focuses on minimizing market risk, credit risk, and liquidity risk arising
from operating activities. To mitigate these risks, the Group implements and operates a financial risk policy and
program that closely monitors and manages such risks. In addition, the Group uses derivative financial instruments
to hedge certain risk exposure.
The finance team mainly carries out the Group’s financial risk management. With the cooperation of the Group’s
divisions, domestic and foreign subsidiaries, the finance team periodically measures, evaluates and hedges financial
risk and also establishes and implements the global financial risk management policy.
Also, financial risk management officers are dispatched to the regional headquarters of each area including the
United States, United Kingdom, Singapore, China, Brazil and Russia to operate the local finance center in
accordance with global financial risk management.
The Group’s financial assets that are under financial risk management are comprised of cash and cash equivalents,
short-term financial instruments, available-for-sale financial assets, trade and other receivables and other financial
assets. The Group’s financial liabilities under financial risk management are comprised of trade and other payables,
borrowings, debentures, and other financial liabilities.
(A) Market risk
(1) Foreign exchange risk
Revenues and expenses arise from foreign currency transactions and exchange positions, and the most widely used
currencies are the US Dollar, EU’s Euro, Japanese Yen and Chinese Yuan.
To minimize foreign exchange risk arising from operating activities, the Group’s foreign exchange management
policy requires normal business transactions to be in local currency or for the cash-in currency to be matched up
with the cash-out currency. In addition, the Group makes use of derivative instruments to minimize uncertainty of
cash flows and fluctuation of profit or loss occurring from foreign exchange risk. The Group’s foreign exchange
management procedures, hedging period and hedge ratio.
The Group limits all speculative foreign exchange transactions and operates a system to manage receivables and
payables denominated in foreign currency. It evaluates, manages and reports foreign currency exposures to
receivables and payables.
(2) Price risk
The Group’s investment portfolio consists of direct and indirect investments in equity securities classified as
available-for-sale, which is in line with the Group’s strategy.
As at March 31, 2017 and December 31, 2016, a price fluctuation in relation to marketable equity securities by 1%
would result in changes in other comprehensive income (before income tax) of ₩25,006 million and ₩23,622
million, respectively.
Samsung Electronics Co., Ltd. and its Subsidiaries
NOTES TO INTERIM CONSOLIDATED FINANCIAL STATEMENTS
56
(3) Interest rate risk
Risk of changes in interest rates for floating interest rate financial instruments is defined as the risk that the fair
value of components of the statement of financial position, and future cash flows of interest income (expenses) of a
financial instrument, will fluctuate because of changes in market interest rates. The Group is exposed to interest
rate risk mainly through interest bearing liabilities and assets. The Group’s position with regard to interest rate risk
exposure is mainly driven by its floating interest rate debt obligations and interest-bearing deposits. The Group
implemented policies and operates to minimize uncertainty arising from changes in interest rates and finance costs.
In order to avoid interest rate risk, the Group maintains minimum external borrowings by facilitating cash pooling
systems on a regional and global basis. The Group manages exposed interest rate risk via periodic monitoring and
handles risk factors on a timely basis.
(B) Credit risk
Credit risk arises during the normal course of transactions and investing activities where clients or other parties fail
to discharge an obligation. The Group monitors and sets the client’s and counterparty’s credit limit on a periodic
basis based on the client’s and counterparty’s financial conditions, default history and other important factors.
Adequate insurance coverage is maintained for accounts receivables related to trading partners situated in higher
risk countries.
Credit risk can arise from transactions with financial institutions which include financial instrument transactions
such as cash and cash equivalents, savings, and derivative instruments. To minimize such risk, the Group transacts
only with banks which have strong international credit rating (S&P A and above), and all new transactions with
financial institutions with no prior transaction history are approved, managed and monitored by the Group’s finance
team and the local finance center. The Group requires separate approval for contracts with restrictions.
The Group estimates that its maximum exposure to credit risk is the carrying value of its financial assets, net of
impairment losses.
(C) Liquidity risk
Due to large investments made by the Group, maintaining adequate levels of liquidity risk is critical. The Group
strives to achieve this goal by periodically forecasting its capital balance, estimating required cash levels, and
managing income and expenses.
The Group manages its liquidity risk by periodically forecasting projected cash flows. If abnormal signs are
identified, the Group works with the local finance center and provides liquidity support by utilizing a globally
integrated finance structure, such as Cash Pooling. In addition, the Group maintains a liquidity management process
which provides additional financial support by the local finance center and the Group. The Cash Pooling program
allows sharing of surplus funds among entities and contributes to minimizing liquidity risk and strengthening the
Group’s competitive position by reducing capital operation expenses and finance costs.
In addition, the Group mitigates liquidity risk by contracting with financial institutions with respect to bankoverdrafts and foreign trade finance, and by providing payment guarantees to subsidiaries. For large scale facilityinvestments, liquidity risk is minimized by utilizing internal reserves and long term borrowings according to thecapital injection schedule.
Samsung Electronics Co., Ltd. and its Subsidiaries
NOTES TO INTERIM CONSOLIDATED FINANCIAL STATEMENTS
57
(D) Capital risk management
The purpose of capital management is to maintain a sound capital structure. The Group monitors capital on the
basis of the ratio of total liabilities to total equity. This ratio is calculated by dividing total liabilities by total equity
in the consolidated financial statements.
The Group’s capital risk management policy has not changed since the previous fiscal year. The Group has
maintained an A+ and A1 credit rating from S&P and Moody’s, respectively, on its long term debt.
The total liabilities to equity ratios as of March 31, 2017 and December 31, 2016 are as follows:
(In millions of Korean won) March 31, 2017 December 31, 2016
Total liabilities ₩ 74,399,417 ₩ 69,211,291
Total equity 189,817,955 192,963,033
Total liabilities to equity ratio 39.2% 35.9%
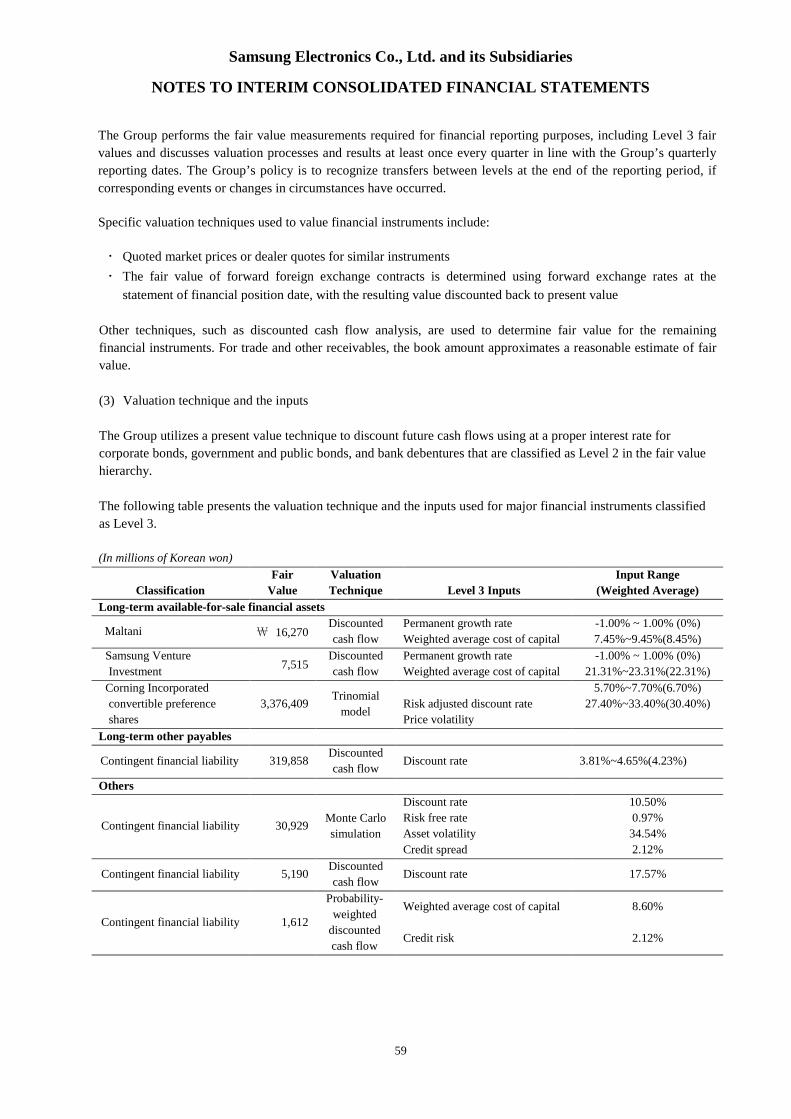
(E) Fair value estimation
(1) Carrying amounts and fair values of financial instruments by category as at March 31, 2017 and December 31,
2016 are as follows:
March 31, 2017 December 31, 2016
(In millions of Korean won) Carrying amount Fair value Carrying amount Fair value
1 For equity securities, changes in fair value are calculated with the correlation between discount rate and growth rate(-1%~1%),
which are significant unobservable inputs.2 The fair value of long-term other payables is calculated by increasing or decreasing the discount rate by 10%, which is
significant unobservable input.
Samsung Electronics Co., Ltd. and its Subsidiaries
NOTES TO INTERIM CONSOLIDATED FINANCIAL STATEMENTS
61
25. Segment Information
(A) Operating segment information
The chief operating decision maker has been identified as the Management Committee. The Management
Committee is responsible for making strategic decisions based on review of the Group’s internal reporting. The
Management Committee has determined the operating segments based on these reports.
The Management Committee reviews operating profits of each operating segment in order to assess performance
and to make decisions about allocating resources to the segment. The operating segments are product based and
include CE, IM, Semiconductor, DP and others.
Depreciation, amortization of intangible assets, and operating profit were prepared after the allocation of internal
transaction adjustments. Total assets and liabilities of each operating segment are excluded from the disclosure as
these have not been provided regularly to the Management Committee.
1 Includes other amounts not included in specific operating segments.2 Segment net revenue includes intersegment revenues.3 CE is restated in correspondence to the reclassification of the Printing Solutions business segment, in which the composition of
reportable segment has been changed from CE to others.
Samsung Electronics Co., Ltd. and its Subsidiaries
NOTES TO INTERIM CONSOLIDATED FINANCIAL STATEMENTS
62
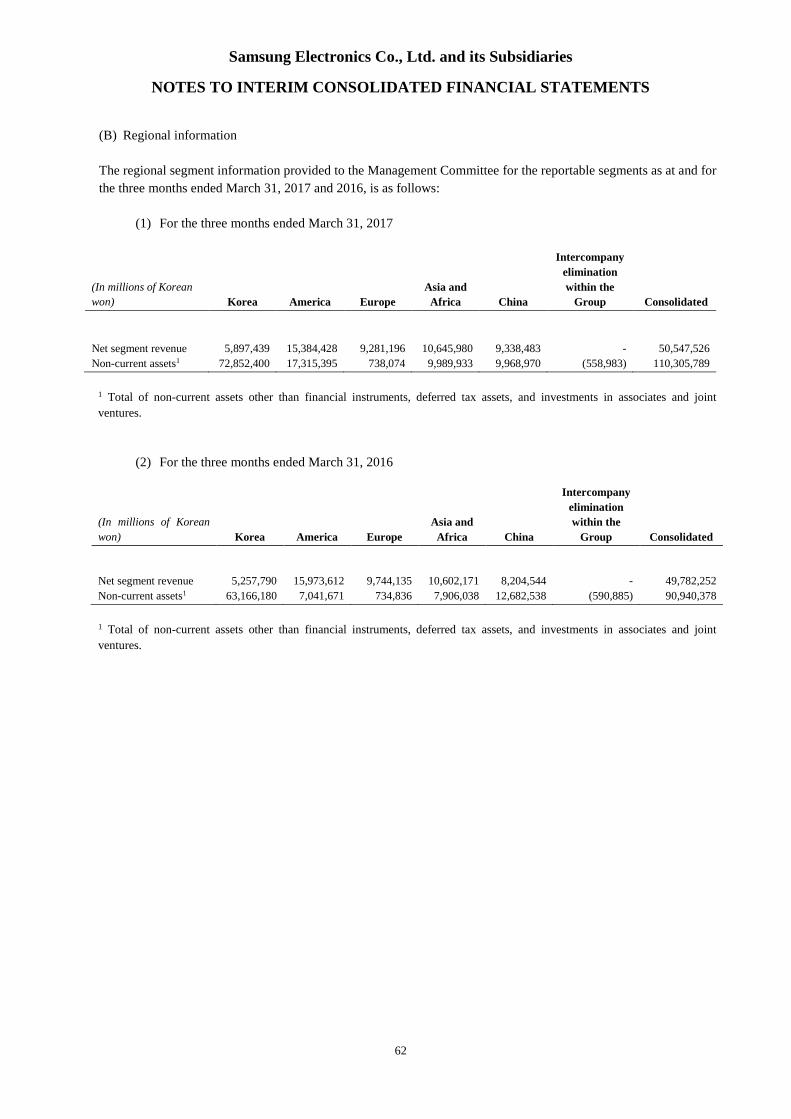
(B) Regional information
The regional segment information provided to the Management Committee for the reportable segments as at and for
the three months ended March 31, 2017 and 2016, is as follows:
(1) For the three months ended March 31, 2017
(In millions of Korean
won) Korea America Europe
Asia and
Africa China
Intercompany
elimination
within the
Group Consolidated
Net segment revenue 5,897,439 15,384,428 9,281,196 10,645,980 9,338,483 - 50,547,526
1 Total of non-current assets other than financial instruments, deferred tax assets, and investments in associates and joint
ventures.
Samsung Electronics Co., Ltd. and its Subsidiaries
NOTES TO INTERIM CONSOLIDATED FINANCIAL STATEMENTS
63
26. Related Party Transactions
(A) Sale and purchase transactions
Sale and purchase transactions with related parties for the three months ended March 31, 2017 and 2016, are as
follows:
2017
(In millions of Korean won) Name of Company1 Sales
Disposal of
fixed assets Purchases
Purchase of
fixed assets
Associates and
Joint ventures
Samsung SDS \ 22,853 \ - \ 425,139 \ 65,017
Samsung Electro-Mechanics 16,435 - 527,080 -
Samsung SDI2 25,767 - 241,148 3,647
Cheil Worldwide3 9,632 - 122,581 667
Other 118,776 - 1,989,777 46,730
Total (Associates and Joint ventures)
ventures )\ 193,463 \ - \3,305,725 \ 116,061
Other related parties
Samsung C&T \ 49,706 \ 68 \ 69,839 \ 531,208
Other 37,604 35 211,202 39,281
Total (Other related parties) \ 87,310 \ 103 \ 281,041 \ 570,489
Others4
Samsung Engineering \ 1,715 \ - \ 3,860 \ 380,680
S-1 8,491 - 81,826 11,395
Other 17,113 - 22,214 -
Total (Others) \ 27,319 \ - \ 107,900 \ 392,075
1 Transactions with separate entities that are related parties of the Group.2 For the year ended December 31, 2016, Samsung SDI was included in associates as the Group’s ownership of ordinary shares
outstanding was increased.3 For the year ended December 31, 2016, Cheil Worldwide was included in associates due to acquisition of shares.4 Although these entities are not related parties of the Group in accordance with Korean IFRS 1024, they belong to same
enterprise group in accordance with the Monopoly Regulation and Fair Trade Act.
2016
(In millions of Korean won) Name of Company1 Sales
Disposal of
fixed assets Purchases
Purchase of
fixed assets
Associates and
Joint ventures
Samsung SDS \ 14,786 \ - \ 356,607 \ 32,752
Samsung Electro-Mechanics 11,219 - 681,842 -
Other 63,112 - 1,248,984 61,923
Total (Associates and Joint ventures) \ 89,117 \ - \2,287,433 \ 94,675
Other related parties
Samsung C&T \ 7,377 \ 74 \ 52,252 \ 436,355
Samsung SDI 24,900 - 305,885 1,073
Other 25,245 - 311,040 125,815
Total (Other related parties) \ 57,522 \ 74 \ 669,177 \ 563,243
Others2
Samsung Engineering \ 5,934 \ - \ 2,608 \ 596,954
S-1 9,529 - 76,147 2,336
Other 18,785 70 156,309 61
Total (Others) \ 34,248 \ 70 \ 235,064 \ 599,351
1 Transactions with separate entities that are related parties of the Group.2 Although these entities are not related parties of the Group in accordance with Korean IFRS 1024, they belong to the same
large enterprise group in accordance with the Monopoly Regulation and Fair Trade Act.
Samsung Electronics Co., Ltd. and its Subsidiaries
NOTES TO INTERIM CONSOLIDATED FINANCIAL STATEMENTS
64
(B) Balances of receivables and payables
Balances of receivables and payables arising from sales and purchases of goods and services as of March 31, 2017
and December 31, 2016, are as follows:
March 31, 2017
(In millions of Korean won) Name of Company1 Receivables Payables
Associates and
Joint ventures
Samsung SDS \ 19,747 \ 358,443
Samsung Electro-Mechanics 9,683 250,656
Samsung SDI2 101,225 89,905
Cheil Worldwide3 8,912 280,546
Other 146,369 802,022
Total (Associates and Joint ventures) \ 285,936 \ 1,781,572
Other related parties
Samsung C&T \ 249,203 \ 294,708
Other 24,497 1,099,230
Total (Other related parties) \ 273,700 \ 1,393,938
Others4
Samsung Engineering \ 4,164 \ 73,674
S-1 5,207 35,338
Other 4,007 19,885
Total (Others) \ 13,378 \ 128,897
1 Balances due from and to separate entities that are related parties of the Group.2 For the year ended December 31, 2016, Samsung SDI was included in associates as the Group’s ownership of ordinary shares
outstanding was increased.3 For the year ended December 31, 2016, Cheil Worldwide was included in associates due to acquisition of shares.4 Although these entities are not related parties of the Group in accordance with Korean IFRS 1024, they belong to the same
large enterprise group in accordance with the Monopoly Regulation and Fair Trade Act.
December 31, 2016
(In millions of Korean won) Name of Company1 Receivables Payables
Associates and Joint
ventures
Samsung SDS \ 5,709 \ 362,062
Samsung Electro-Mechanics 1,143 108,469
Samsung SDI2 89,721 76,211
Cheil Worldwide3 456 436,624
Other 210,891 784,475
Total (Associates and Joint ventures) \ 307,920 \ 1,767,841
Other related parties
Samsung C&T \ 231,089 \ 435,505
Other 31,752 1,932,924
Total (Other related parties) \ 262,841 \ 2,368,429
Others4
Samsung Engineering \ 10,664 \ 115,726
S-1 4,160 47,098
Other 3,058 28,841
Total (Others) \ 17,882 \ 191,665
1 Balances due from and to separate entities that are related parties of the Group.2 For the year ended December 31, 2016, Samsung SDI was included in associates as the Group’s ownership of ordinary shares
outstanding was increased.3 For the year ended December 31, 2016, Cheil Worldwide was included in associates due to acquisition of shares.4 Although these entities are not related parties of the Group in accordance with Korean IFRS 1024, they belong to the same
large enterprise group in accordance with the Monopoly Regulation and Fair Trade Act.
Samsung Electronics Co., Ltd. and its Subsidiaries
NOTES TO INTERIM CONSOLIDATED FINANCIAL STATEMENTS
65
(C) For the three months ended March 31, 2017, the Group invested \4,160 million in associates and joint
ventures. For the three months ended March 31, 2016 the Group invested \4,848 million in associates and
joint ventures.
(D) For the three months ended March 31, 2017, the Group declared \661,516 million of dividends (For the three
months ended March 31, 2016: \481,270 million) to related parties. As at March 31, 2017, \661,516 million
of dividends are remained as unpaid (As at December 31, 2016, there are no unpaid dividends to related
parties). Also, for the three months ended March 31, 2017, the Group declared \51,050 million of dividends
(For the three months ended March 31, 2016:\37,127 million) to the entities that are not related parties of the
Group in accordance with Korean IFRS 1024, but belong to the same conglomerate according to the Monopoly
Regulation and Fair Trade Act. As at March 31, 2017, \51,050 million of dividends are remained as unpaid
(As at December 31, 2016, there are no unpaid dividends to these entities).
(E) Key management compensation
Key management includes directors (executive and non-executive) and members of the Executive Committee. The
compensation paid or payable for employee services for the three months ended March 31, 2017 and 2016 consists
of:
(In millions of Korean won) 2017 2016
Salaries and other short-term employee benefits \ 2,445 \ 2,458
Termination benefits 198 160
Other long-term benefits 2,154 2,079
Samsung Electronics Co., Ltd. and its Subsidiaries
NOTES TO INTERIM CONSOLIDATED FINANCIAL STATEMENTS
66
27. Business Combination
Significant business combination for the three months ended March 31, 2017 are as follow:
To strengthen automotive electronics and audio business, Samsung Electronics America, the Group’s subsidiary,
acquired 100% of the equity shares of Harman and its subsidiaries on March 10, 2017.
(1) Overview of the acquired company
Name of the acquired company Harman International Industries, Inc. and 109 subsidiaries
Headquarters location Stamford, CT, USA
Representative director Dinesh Paliwal
Industry Design, development, manufacture and sale of audio and video system components
(2) Purchase price allocation
Had Harman and the subsidiaries been consolidated from January 1, 2017, ₩2,015,773 million of revenues and
₩28,721 million of net income would be included on the interim consolidated statement of income. The revenue
and net income contributed by Harman and the subsidiaries since acquisition amount to ₩537,749 million and
₩24,449 million, respectively.
(In millions of Korean Won) Amount
I. Consideration transferred ₩ 9,272,702
II. Identifiable assets and liabilities
Cash and cash equivalents 647,729
Trade and other receivables 1,533,437
Inventory 1,068,865
Property, plant and equipment 858,790
Intangible assets 5,564,309
Other assets 902,824
Trade and other payables 3,436,020
Deferred tax liabilities 1,442,527
Other liabilities 873,637
Total net identifiable assets 4,823,770
III. Goodwill (I – II) ₩ 4,448,932
Samsung Electronics Co., Ltd. and its Subsidiaries
NOTES TO INTERIM CONSOLIDATED FINANCIAL STATEMENTS
67
28. Non-current Assets and Liabilities Held-for-Sale (Assets of disposal group)
(A) Summary
- Sale of Printing Solutions business segment
For the year ended December 31, 2016, the management of the Group decided to sell Printing Solutions business
segment to HP Inc. The contract was entered into on September 12, 2016, and the transaction is expected to be
completed within 1 year through the due diligence.
(B) Details of assets and liabilities reclassified as held-for-sale, as at March 31, 2017 and December 31, 2016 are
as follows:
(In millions of Korean Won) March 31, 2017 December 31, 2016
Assets held-for-sale
Trade receivables ₩ 188,200 ₩ 182,738
Inventories 257,991 270,642
Other current assets 100,315 115,037
Property, plant and equipment 84,838 84,869
Intangible assets 122,603 124,571
Other non-current assets 46,836 57,949
Total ₩ 800,783 ₩ 835,806
Liabilities held-for-sale
Current liabilities ₩ 288,141 ₩ 272,726
Non-current liabilities 84,932 83,662
Total ₩ 373,073 ₩ 356,388
(C) Details of cumulative income or expense recognized in other comprehensive income relating to the disposal
group classified as held-for-sale as at March 31, 2017 and December 31, 2016 are as follows:
(In millions of Korean won) March 31, 2017 December 31, 2016
Remeasurement of net defined benefit liabilities ₩ (2,669) ₩ -
Foreign currency translation (11,116) (28,810)
Total ₩ (13,815) ₩ (28,810)
Samsung Electronics Co., Ltd. and its Subsidiaries
NOTES TO INTERIM CONSOLIDATED FINANCIAL STATEMENTS
68
29. Events after the Reporting Period
According to the resolution of the board of directors on January 24, 2017, the Group repurchased 1.275 million shares
(ordinary shares 1.02 million, preference shares 0.255 million) at cost of₩2,452,945 million from January 25, 2017
to April 10, 2017. All repurchased shares were retired in April.
According to the resolution of the board of directors on April 27, 2017, the Group decided the share buyback and
retirement of ordinary and preferred shares. Estimated total number of shares to be repurchased is 1.125 million
(ordinary shares 0.9 million, preferred shares 0.225 million) and the period of repurchase will be expected to end on
July 27, 2017. All repurchased shares will be retired.
Also, according to the resolution of the board of directors on April 27, 2017, 10,605,690 shares of treasury shares
(ordinary shares 8,990,843, preference shares 1,614,847) will be retired in May which are 50% of the total treasury
shares(acquisition cost:₩4,875,163 million) as at April 27, 2017.