42
INTERIM FINANCIAL REPORT 2nd QUARTER 2006/2007

INTERIMFINANCIAL REPORT2 nd Q U A R T E R 2 0 0 6 / 2 0 0 7
15
10
5
0
– 5
– 10
– 15
– 20
Heidelberg
DAX
MDAX
%
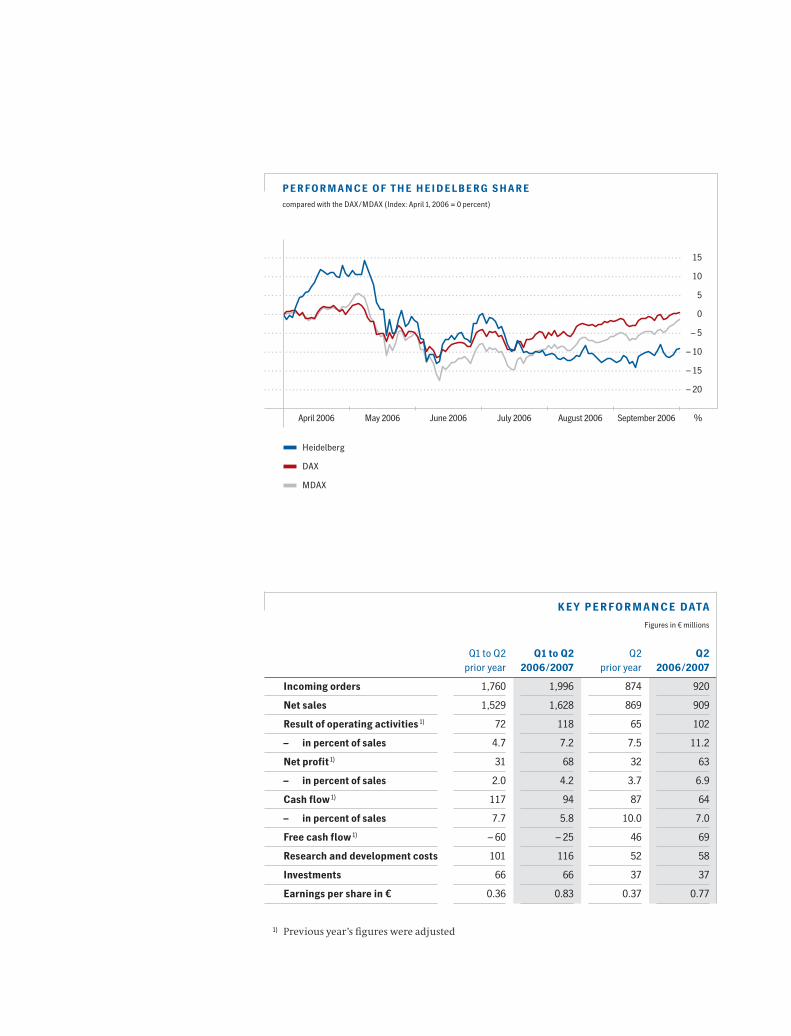
PERFORMANCE OF THE HEIDELBERG SHAREcompared with the DAX/MDAX (Index: April 1, 2006 = 0 percent)
April 2006 May 2006 June 2006 July 2006 August 2006 September 2006
Q1 to Q2 Q1 to Q2 Q2 Q2prior year 2006/2007 prior year 2006/2007
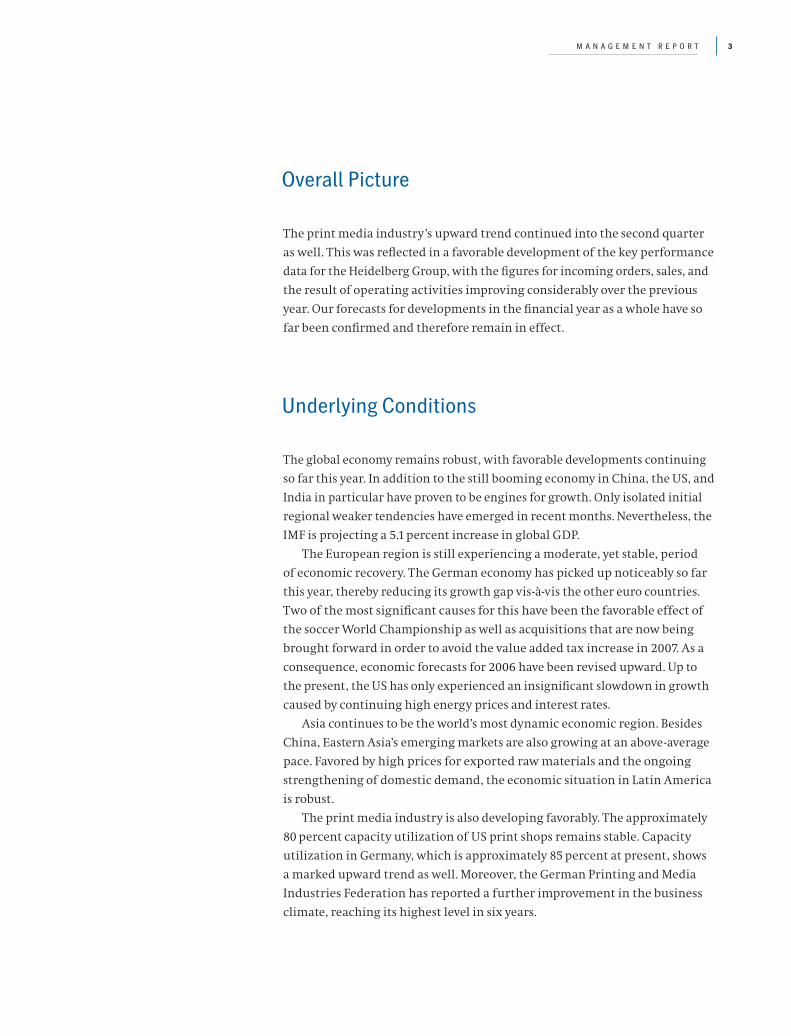
Incoming orders 1,760 1,996 874 920
Net sales 1,529 1,628 869 909
Result of operating activities 1) 72 118 65 102
– in percent of sales 4.7 7.2 7.5 11.2
Net profit 1) 31 68 32 63
– in percent of sales 2.0 4.2 3.7 6.9
Cash flow 1) 117 94 87 64
– in percent of sales 7.7 5.8 10.0 7.0
Free cash flow 1) – 60 – 25 46 69
Research and development costs 101 116 52 58
Investments 66 66 37 37
Earnings per share in € 0.36 0.83 0.37 0.77
KEY PERFORMANCE DATA
Figures in € millions
1) Previous year’s figures were adjusted

2
3
14
18
19
20
21
23
24
25
25
26
28
38
THE HEIDELBERG SHARE
MANAGEMENT REPORT
Overall Picture
Underlying Conditions
Business Development
Results of Operations, Net Assets, and Financial Position
Divisions
Regions
Research and Development
Employees
Risk Report
Future Prospects
THE 2nd QUARTER IN REVIEW
CONSOLIDATED INTERIM FINANCIAL STATEMENTS FOR THE PERIOD APRIL 1, 2006 TO SEPTEMBER 30, 2006
Interim Income Statement – April 1, 2006 to September 30, 2006
Interim Income Statement – July 1, 2006 to September 30, 2006
Interim Income Statement – Quarterly Overview
Interim Balance Sheet
Cash Flow Statement – April 1, 2006 to September 30, 2006
Cash Flow Statement – Quarterly Overview
Statement of Recognized Income and Expense
Development of Shareholders’ Equity
Segment Information
Notes
Supervisory Board and Management Board
C O N T E N T S 1
Contents

The Heidelberg Share
T H E H E I D E L B E R G S H A R E
Q2 Q2prior year 2006/2007
Earnings per share 0.37 0.77
Cash flow per share 1.01 0.78
Share price – high 29.50 36.47
Share price – low 24.30 30.67
Share price – beginning of the quarter 1) 24.30 36.33
Share price – end of the quarter 1) 28.51 32.51
Market capitalization at the end of the quarter in € millions 2,449 2,700
Number of shares in thousands 2) 85,908 81,986
KEY PERFORMANCE DATA OF THE HEIDELBERG SHARE
Figures in €
1) Xetra closing price; source of prices: Bloomberg
2) Weighted number of outstanding shares
2
Following marked declines at the beginning of the second quarter, the two
most important German share indexes – the DAX and the MDAX – subsequently
picked up. The DAX again rose above the 6,000 mark at the end of September,
thereby posting growth of 6 percent during the quarter. The MDAX, which
increased by 8 percent, grew at an even more rapid pace.
Although the Heidelberg share followed the initially negative market
trend, it subsequently came under pressure and was only able to benefit from
the improving market environment in September. Nevertheless, the overall
development was disappointing during the reporting quarter, with a decline
of nearly 7 percent posted.
Approximately 1,200 shareholders, representing some 60 percent of Heidel-
berg’s share capital, attended our Annual General Meeting at Mannheim’s
Congress Center Rosengarten on July 20, 2006. All proposals for resolution
on the agenda items – including a vote on the appropriation of distributable
profit and the related distribution of a dividend of € 0.65 per share – were
approved by a large majority.
The share buyback program, which was launched in November 2005, was
concluded in July 2006. A total of 4,295,424 shares representing 5 percent
of the share capital were repurchased via the stock market. Of this, 2,857,777
shares were already retired on March 31, 2006 within the framework of a
decrease in capital from € 220.0 million to € 212.6 million, apportioned among
83,050,703 shares.
M A N A G E M E N T R E P O R T 3
Overall Picture
The print media industry’s upward trend continued into the second quarter
as well. This was reflected in a favorable development of the key performance
data for the Heidelberg Group, with the figures for incoming orders, sales, and
the result of operating activities improving considerably over the previous
year. Our forecasts for developments in the financial year as a whole have so
far been confirmed and therefore remain in effect.
Underlying Conditions
The global economy remains robust, with favorable developments continuing
so far this year. In addition to the still booming economy in China, the US, and
India in particular have proven to be engines for growth. Only isolated initial
regional weaker tendencies have emerged in recent months. Nevertheless, the
IMF is projecting a 5.1percent increase in global GDP.
The European region is still experiencing a moderate, yet stable, period
of economic recovery. The German economy has picked up noticeably so far
this year, thereby reducing its growth gap vis-à-vis the other euro countries.
Two of the most significant causes for this have been the favorable effect of
the soccer World Championship as well as acquisitions that are now being
brought forward in order to avoid the value added tax increase in 2007. As a
consequence, economic forecasts for 2006 have been revised upward. Up to
the present, the US has only experienced an insignificant slowdown in growth
caused by continuing high energy prices and interest rates.
Asia continues to be the world’s most dynamic economic region. Besides
China, Eastern Asia’s emerging markets are also growing at an above-average
pace. Favored by high prices for exported raw materials and the ongoing
strengthening of domestic demand, the economic situation in Latin America
is robust.
The print media industry is also developing favorably. The approximately
80 percent capacity utilization of US print shops remains stable. Capacity
utilization in Germany, which is approximately 85 percent at present, shows
a marked upward trend as well. Moreover, the German Printing and Media
Industries Federation has reported a further improvement in the business
climate, reaching its highest level in six years.
Q2
M A N A G E M E N T R E P O R T
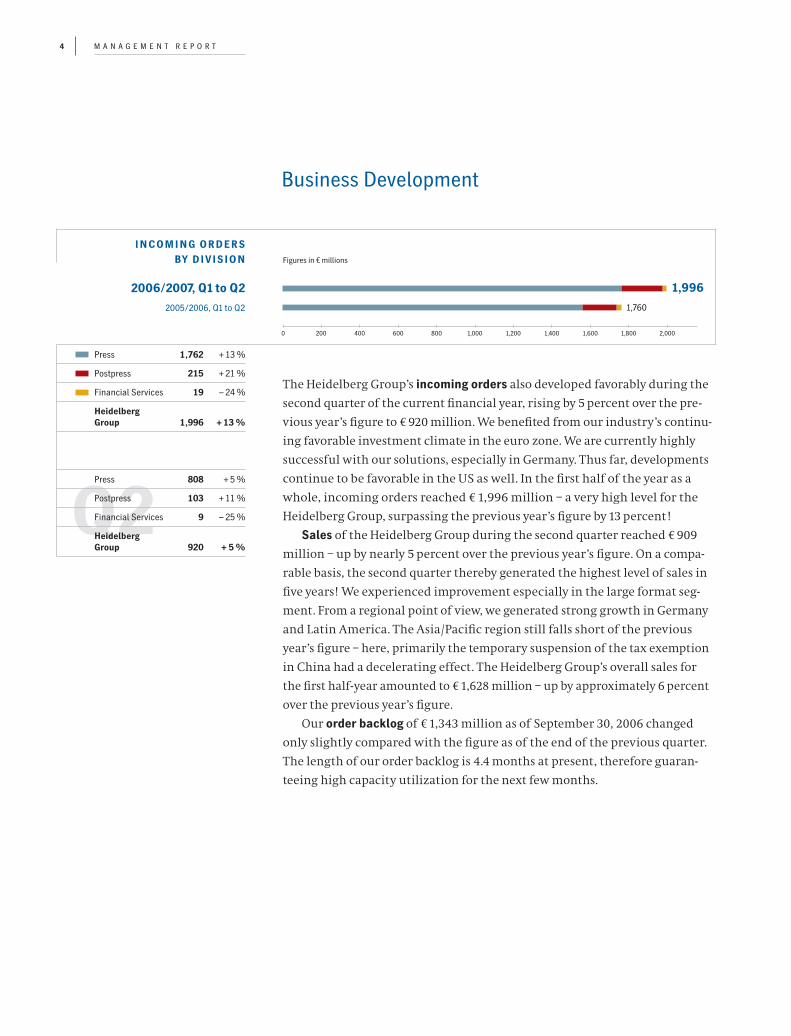
The Heidelberg Group’s incoming orders also developed favorably during the
second quarter of the current financial year, rising by 5 percent over the pre-
vious year’s figure to € 920 million. We benefited from our industry’s continu-
ing favorable investment climate in the euro zone. We are currently highly
successful with our solutions, especially in Germany. Thus far, developments
continue to be favorable in the US as well. In the first half of the year as a
whole, incoming orders reached € 1,996 million – a very high level for the
Heidelberg Group, surpassing the previous year’s figure by 13 percent !
Sales of the Heidelberg Group during the second quarter reached € 909
million – up by nearly 5 percent over the previous year’s figure. On a compa-
rable basis, the second quarter thereby generated the highest level of sales in
five years! We experienced improvement especially in the large format seg-
ment. From a regional point of view, we generated strong growth in Germany
and Latin America. The Asia/Pacific region still falls short of the previous
year’s figure – here, primarily the temporary suspension of the tax exemption
in China had a decelerating effect. The Heidelberg Group’s overall sales for
the first half-year amounted to € 1,628 million – up by approximately 6 percent
over the previous year’s figure.
Our order backlog of € 1,343 million as of September 30, 2006 changed
only slightly compared with the figure as of the end of the previous quarter.
The length of our order backlog is 4.4 months at present, therefore guaran-
teeing high capacity utilization for the next few months.
Business Development
2006/2007, Q1 to Q2
2005/2006, Q1 to Q2
Figures in € millions
INCOMING ORDERS BY DIVISION
Press 1,762 + 13 %
Postpress 215 + 21 %
Financial Services 19 – 24 %
HeidelbergGroup 1,996 + 13 %
1,996
1,760
Press 808 + 5 %
Postpress 103 + 11 %
Financial Services 9 – 25 %
HeidelbergGroup 920 + 5 %
0 200 400 600 800 1,000 1,200 1,400 1,600 1,800 2,000
4

M A N A G E M E N T R E P O R T
Q1 to Q2 Q1 to Q2 Q2 Q2prior year 2006/2007 prior year 2006/2007
Press 1,330 1,423 763 803
Postpress 174 186 94 97
Financial Services 25 19 12 9
Heidelberg Group 1,529 1,628 869 909
NET SALES BY DIVISION
Figures in € millions
Results of Operations, Net Assets, and Financial Position
During the second quarter of the current financial year, the Heidelberg Group
generated a result of operating activities of €102 million. Compared with the
same period the previous year, the result was favored by the increased sales
and the associated higher profit contributions, by the strong result of the Finan-
cial Services Division, and by our improved cost situation. The divestiture of
Linotype GmbH, which we successfully sold to one of its competitors early in
August, also had a favorable impact. The result was restrained by considerable
advance services in the R&D area.
We therefore achieved a result of operating activities of € 118 million for
the first half-year as a whole – more than 60 percent above the previous year’s
figure.
Income before taxes reached € 94 million during the first half of the year.
Net profit of € 68 million was more than double the previous year’s figure.
Earnings per share for the first two quarters amount to € 0.83.
5
2006/2007, Q1 to Q2
2005/2006, Q1 to Q2
118
72
Figures in € millions
RESULT OF OPERATING ACTIVITIES
Press 96 64
Postpress 0 – 2
Financial Services 22 10
HeidelbergGroup 118 72
– 10 0 10 20 30 40 50 60 70 80 90 100 110 120
Q2Press 92 57
Postpress 0 2
Financial Services 10 6
HeidelbergGroup 102 65
M A N A G E M E N T R E P O R T
We undertook investments in tangible and intangible assets of € 66 million
during the first half of the reporting year, thereby matching the previous
year’s figure. The investment ratio up to the present time this financial year
amounts to 4 percent of sales. Work on the construction of the new Hall11 at
our Wiesloch manufacturing facility has been ongoing since early in August,
with completion planned for August 2007.
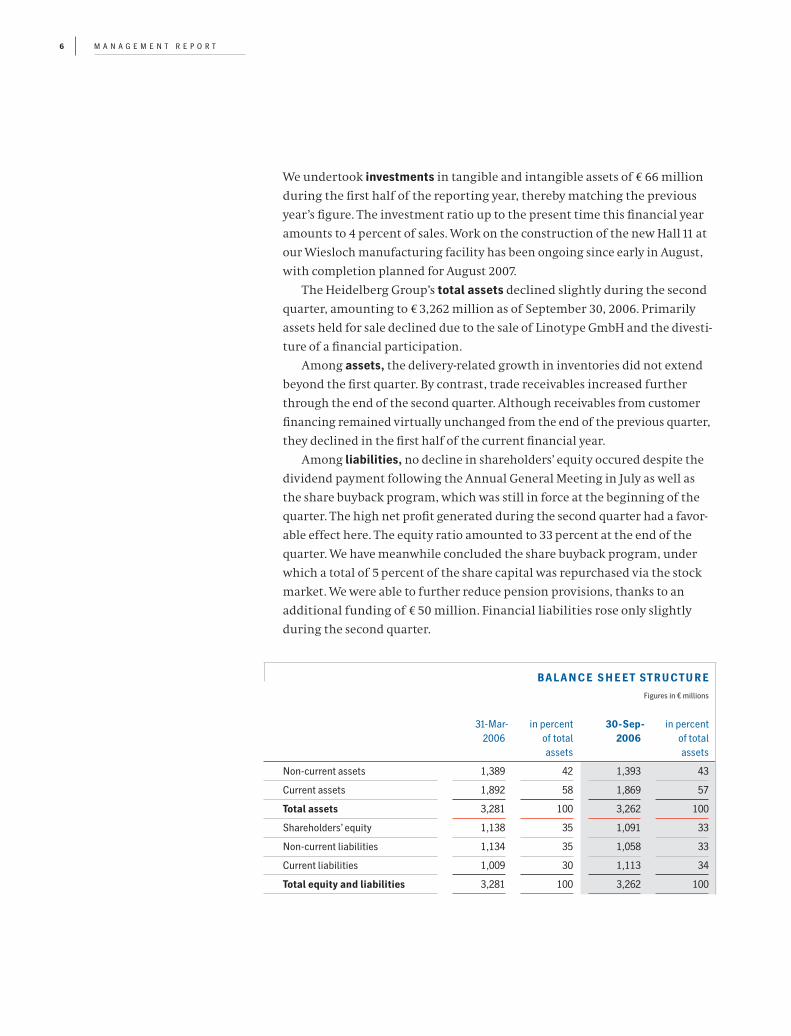
The Heidelberg Group’s total assets declined slightly during the second
quarter, amounting to € 3,262 million as of September 30, 2006. Primarily
assets held for sale declined due to the sale of Linotype GmbH and the divesti-
ture of a financial participation.
Among assets, the delivery-related growth in inventories did not extend
beyond the first quarter. By contrast, trade receivables increased further
through the end of the second quarter. Although receivables from customer
financing remained virtually unchanged from the end of the previous quarter,
they declined in the first half of the current financial year.
Among liabilities, no decline in shareholders’ equity occured despite the
dividend payment following the Annual General Meeting in July as well as
the share buyback program, which was still in force at the beginning of the
quarter. The high net profit generated during the second quarter had a favor-
able effect here. The equity ratio amounted to 33 percent at the end of the
quarter. We have meanwhile concluded the share buyback program, under
which a total of 5 percent of the share capital was repurchased via the stock
market. We were able to further reduce pension provisions, thanks to an
additional funding of € 50 million. Financial liabilities rose only slightly
during the second quarter.
31-Mar- in percent 30-Sep- in percent2006 of total 2006 of total
assets assets
Non-current assets 1,389 42 1,393 43
Current assets 1,892 58 1,869 57
Total assets 3,281 100 3,262 100
Shareholders’ equity 1,138 35 1,091 33
Non-current liabilities 1,134 35 1,058 33
Current liabilities 1,009 30 1,113 34
Total equity and liabilities 3,281 100 3,262 100
BALANCE SHEET STRUCTURE
Figures in € millions
6
M A N A G E M E N T R E P O R T
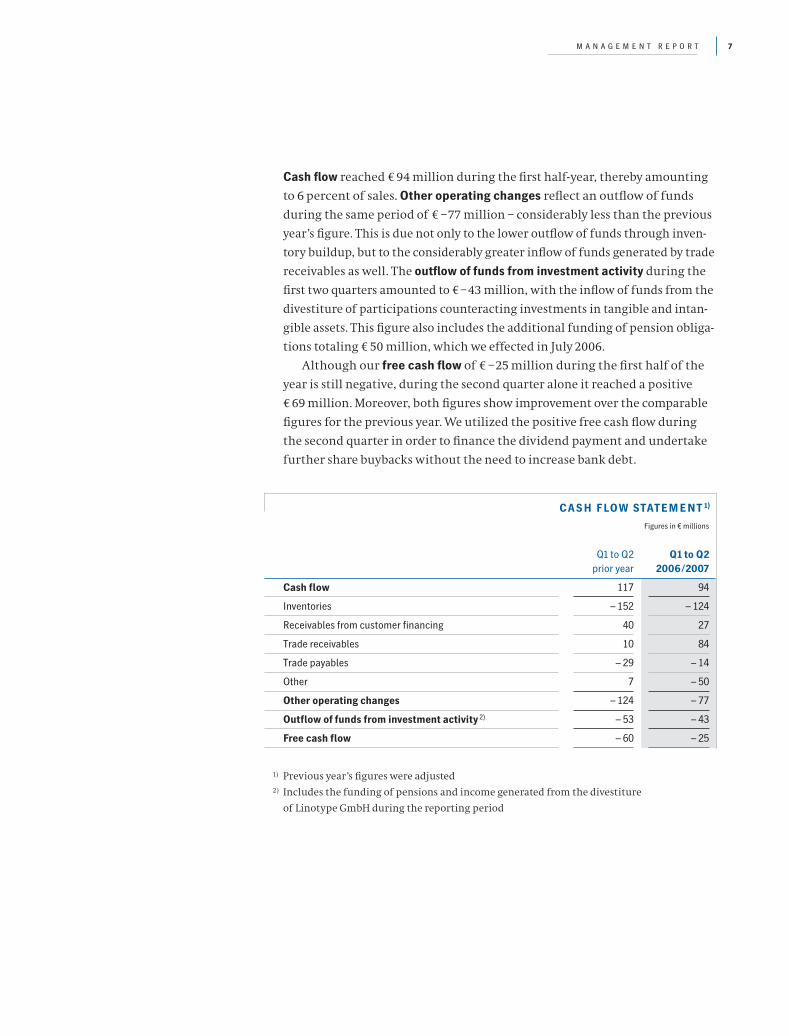
Cash flow reached € 94 million during the first half-year, thereby amounting
to 6 percent of sales. Other operating changes reflect an outflow of funds
during the same period of € –77 million – considerably less than the previous
year’s figure. This is due not only to the lower outflow of funds through inven-
tory buildup, but to the considerably greater inflow of funds generated by trade
receivables as well. The outflow of funds from investment activity during the
first two quarters amounted to € –43 million, with the inflow of funds from the
divestiture of participations counteracting investments in tangible and intan-
gible assets. This figure also includes the additional funding of pension obliga-
tions totaling € 50 million, which we effected in July 2006.
Although our free cash flow of € –25 million during the first half of the
year is still negative, during the second quarter alone it reached a positive
€ 69 million. Moreover, both figures show improvement over the comparable
figures for the previous year. We utilized the positive free cash flow during
the second quarter in order to finance the dividend payment and undertake
further share buybacks without the need to increase bank debt.
7
Q1 to Q2 Q1 to Q2prior year 2006/2007
Cash flow 117 94
Inventories – 152 – 124
Receivables from customer financing 40 27
Trade receivables 10 84
Trade payables – 29 – 14
Other 7 – 50
Other operating changes – 124 – 77
Outflow of funds from investment activity 2) – 53 – 43
Free cash flow – 60 – 25
CASH FLOW STATEMENT 1)
Figures in € millions
1) Previous year’s figures were adjusted
2) Includes the funding of pensions and income generated from the divestiture
of Linotype GmbH during the reporting period

M A N A G E M E N T R E P O R T
Divisions
As already during the first quarter, incoming orders generated by the Press
Division of € 808 million during the second quarter were again in excess of the
previous year’s figure. We benefited here from the ongoing favorable under-
lying conditions, primarily in the euro zone. Demand for our Speedmaster
XL105, which has meanwhile been introduced to all the larger markets, con-
tinues to be especially strong. The division continued its expansionary course
in the area of sales, which exceed the previous year’s figures. The result of
operating activities reached € 92 million during the second quarter, thereby
considerably surpassing the previous year’s figure – a development that was
favorably influenced by the successful sale of Linotype GmbH. The continuing
high level of advance services in the R&D area had a dampening effect. Never-
theless, the overall result of operating activities during the first half-year of
€ 96 million exceeded the previous year’s figure. Among other things due to
the startup of the new training year, the number of employees in the division
had increased to17,031 by September 30, 2006.
During the second quarter, the Postpress Division successfully sustained
its initial favorable start in the current financial year. Incoming orders of
€ 103 million surpassed the previous year’s figure by 11percent, with even
greater improvement posted during the first half-year on a cumulative basis.
We continue to be successful with our folder business, with demand for the
highly automated folder model surpassing our forecast, especially in the US
market. This division’s sales also exceed the previous year’s level – this factor
and the improved cost situation provided the basis for our successful achieve-
ment of a breakeven result during the second quarter. The number of employ-
ees in the division rose slightly to1,977 during the second quarter.
In the Financial Services Division, we will continue our successful strategy:
The consistent attention focused on our external financing partners is result-
ing in further declines in the volume of risks arising from customer financing.
The result of operating activities of €10 million during the second quarter and
€ 22 million during the first half of the year as a whole represent growth over
the same periods of the previous year according to plan. As a result of the more
favorable risk environment in our major financing markets, we were able to
continue to improve the quality of our portfolio. This division had a total of
85 employees as of September 30, 2006.
8

Q2
M A N A G E M E N T R E P O R T
Following the high level of incoming orders in the first quarter in the Europe,
Middle East and Africa region, which resulted from the IPEX trade show,
incoming orders of € 420 million showed strength during the second quarter
as well, surpassing the previous year’s figure by 11percent. The ongoing solid
propensity to invest in Germany was reflected in the outstanding volume of
incoming orders, with Italy and the Benelux countries also realizing an upward
trend. Thus, during the first half of the year we generated overall incoming
orders of € 961million in this region – 28 percent more than in the previous
year. Sales in this region also surpassed the previous year’s figures, both in
the quarter alone as well as for the first half-year on a cumulative basis.
The Eastern Europe region continues to experience an upward trend.
Incoming orders of € 95 million exceeded the previous year’s figure during
the second quarter as well, with growth of 27 percent over the previous year
posted for the first half-year as a whole! Despite a rather restrained second
quarter, sales remained at the previous year’s level for the first half of the year.
Business remained solid in the North America region. Second quarter
incoming orders of €160 million continued at the previous year’s level – and
this despite the fact that Print 05 had been held in September 2005. During
the first half of the year as a whole, incoming orders were up by 10 percent
over the previous year’s figure. We benefited here from the gradual breakup
of the investment backlog in the US. The more favorable underlying condi-
tions are also reflected in the sales of the region, which exceeded the previous
year’s figures by 8 percent for the quarter and by12 percent during the first
half of the year as a whole.
Business in the Latin America region picked up considerably following
the rather restrained first quarter. With incoming orders during the second
quarter amounting to € 54 million, not only was the previous year’s figure
for the quarter surpassed by 42 percent, but incoming orders exceeded the
previous year’s figure on a cumulative basis for the first half of the financial
Regions
9
2006/2007, Q1 to Q2
2005/2006, Q1 to Q2
Figures in € millionsNET SALES BY REGION
Europe, Middle Eastand Africa1) 742 + 11 %
Eastern Europe1) 166 + 1 %
North America 254 + 12 %
Latin America 83 + 20 %
Asia/Pacific 383 – 4 %
HeidelbergGroup 1,628 + 6 %
Europe, Middle Eastand Africa1) 402 + 9 %
Eastern Europe1) 90 – 8 %
North America 142 + 8 %
Latin America 51 + 55 %
Asia/Pacific 224 – 6 %
HeidelbergGroup 909 + 5 %
1,628
1,529
0 200 400 600 800 1,000 1,200 1,400 1,600 1,800
1) Previous year’s figures were adjusted
M A N A G E M E N T R E P O R T
year as well. Our business is especially successful in Brazil at present. This
region has meanwhile shown considerable improvement over the previous
year in terms of sales as well.
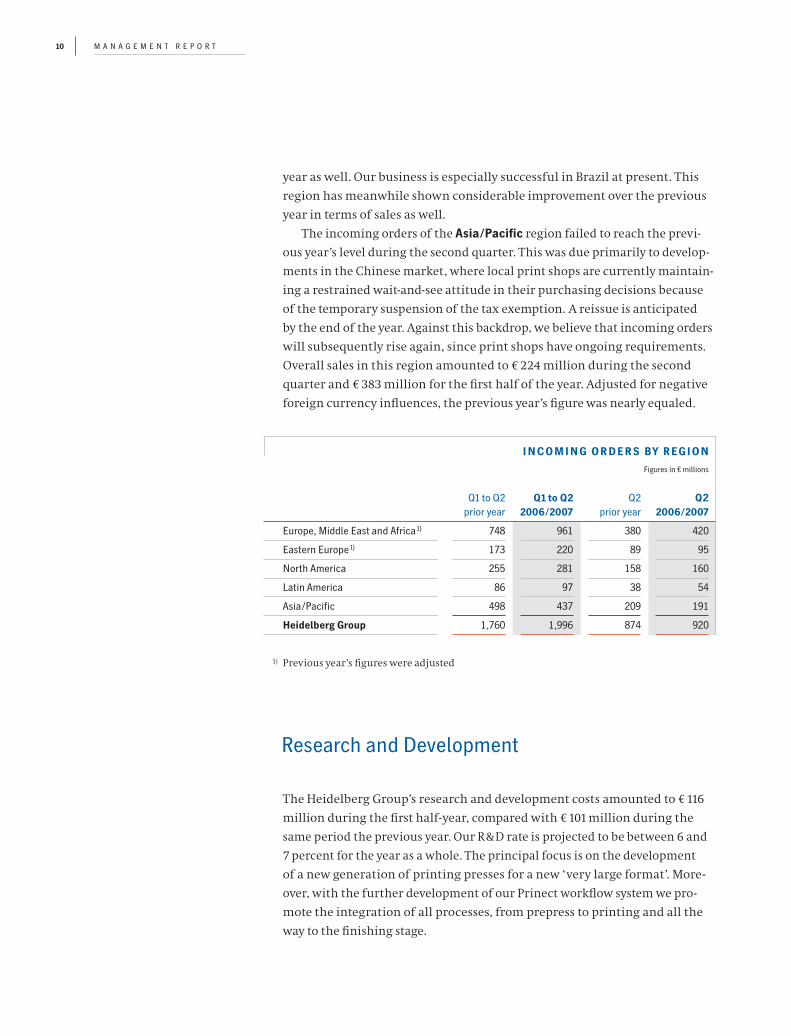
The incoming orders of the Asia/Pacific region failed to reach the previ-
ous year’s level during the second quarter. This was due primarily to develop-
ments in the Chinese market, where local print shops are currently maintain-
ing a restrained wait-and-see attitude in their purchasing decisions because
of the temporary suspension of the tax exemption. A reissue is anticipated
by the end of the year. Against this backdrop, we believe that incoming orders
will subsequently rise again, since print shops have ongoing requirements.
Overall sales in this region amounted to € 224 million during the second
quarter and € 383 million for the first half of the year. Adjusted for negative
foreign currency influences, the previous year’s figure was nearly equaled.
Research and Development
The Heidelberg Group’s research and development costs amounted to €116
million during the first half-year, compared with €101million during the
same period the previous year. Our R&D rate is projected to be between 6 and
7 percent for the year as a whole. The principal focus is on the development
of a new generation of printing presses for a new ‘very large format’. More-
over, with the further development of our Prinect workflow system we pro-
mote the integration of all processes, from prepress to printing and all the
way to the finishing stage.
Q1 to Q2 Q1 to Q2 Q2 Q2prior year 2006/2007 prior year 2006/2007
Europe, Middle East and Africa1) 748 961 380 420
Eastern Europe1) 173 220 89 95
North America 255 281 158 160
Latin America 86 97 38 54
Asia/Pacific 498 437 209 191
Heidelberg Group 1,760 1,996 874 920
INCOMING ORDERS BY REGION
Figures in € millions
10
1) Previous year’s figures were adjusted
M A N A G E M E N T R E P O R T 11
Training has a high priority at Heidelberg. For a number of years, our train-
ing quota has remained stable in Germany at 6 percent or higher. As of Sep-
tember 1, a total of 196 young people began their training at our German
plants. Heidelberg offers a total of 13 varied apprenticeship-based trades and
courses of study.
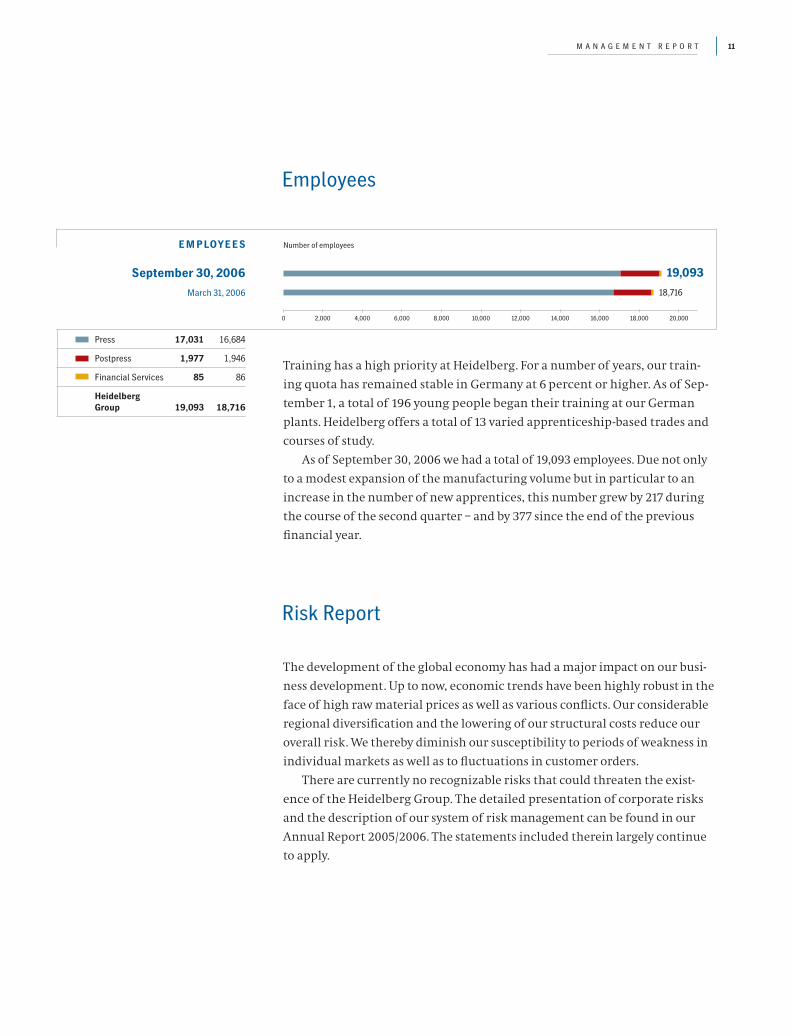
As of September 30, 2006 we had a total of 19,093 employees. Due not only
to a modest expansion of the manufacturing volume but in particular to an
increase in the number of new apprentices, this number grew by 217 during
the course of the second quarter – and by 377 since the end of the previous
financial year.
Employees
September 30, 2006
March 31, 2006
Number of employeesEMPLOYEES
Press 17,031 16,684
Postpress 1,977 1,946
Financial Services 85 86
HeidelbergGroup 19,093 18,716
18,716
19,093
0 2,000 4,000 6,000 8,000 10,000 12,000 14,000 16,000 18,000 20,000
The development of the global economy has had a major impact on our busi-
ness development. Up to now, economic trends have been highly robust in the
face of high raw material prices as well as various conflicts. Our considerable
regional diversification and the lowering of our structural costs reduce our
overall risk. We thereby diminish our susceptibility to periods of weakness in
individual markets as well as to fluctuations in customer orders.
There are currently no recognizable risks that could threaten the exist-
ence of the Heidelberg Group. The detailed presentation of corporate risks
and the description of our system of risk management can be found in our
Annual Report 2005/2006. The statements included therein largely continue
to apply.
Risk Report

M A N A G E M E N T R E P O R T12
We anticipate global economic growth of 5.1percent for calendar year 2006.
Nevertheless, the high and unstable price of oil constitutes a risk to further
growth. In our view, the print media industry will further recover and the
printing volume will grow at least over the next three years. We believe that
the greater demand for printed products and improved capacity utilization
will be reflected in the print media industry by a higher propensity to invest in
producer goods in 2006. However, as in recent years, the greatest contribution
to growth in our industry will come from the emerging markets. Exchange rate
relationships, especially due to the rather weak Japanese yen, will continue
to have an impact on competition among European equipment suppliers to
the print media industry.
Against this backdrop, we are budgeting an overall growth in sales for the
current financial year of approximately 5 percent over the previous year.
We intend to further boost the result of operating activities. We generated an
operating return on sales of 7.7percent during the previous year; this figure
should amount to approximately 10 percent in the current financial year. The
sales increase, our ongoing and unswerving cost reduction measures, the
savings due to the agreement to secure the future, and more favorable con-
ditions for currency hedging, will all have a positive impact. Earnings are
being hampered by advance services in the R&D area. We have ambitious
goals, especially vis-à-vis an increase in corporate value, for which we intend
to again achieve a return on capital employed (ROCE) of over 16 percent.
With a weighted average cost of capital of approximately 10 percent we will
generate an economic value added of over 6 percent – probably during the
current financial year, but otherwise beginning in financial year 2007/2008.
Future Prospects
Disclaimer
This Quarterly Report contains forward-looking statements based on assumptions and estima-
tions by the Management Board of Heidelberger Druckmaschinen Aktiengesellschaft. Even
though the Management Board is of the opinion that these assumptions and estimations are
realistic, the actual future development and results may deviate substantially from these
forward-looking statements due to various factors, such as changes in the macro-economic
situation, in the exchange rates, in the interest rates, and in the print media industry. Heidel-
berger Druckmaschinen Aktiengesellschaft gives no warranty and does not assume liability
for any damages in case the future development and the projected results do not correspond
with the forward-looking statements contained in this Quarterly Report.

> THE 2ND QUARTER IN REVIEWF I N A N C I A L Y E A R 2 0 0 6 / 2 0 0 7

July
7/2006
August
8/2006
> THE 2ND QUARTER 2006/2007 IN REVIEW
July 20, 2006 Annual General Meeting
2006 Annual General Meeting
July 20, 2006 +++ All items on the agenda passed +++
Around 1,200 shareholders – representing approximately 60 per-
cent of the Company’s share capital – attended the Annual Gen-
eral Meeting of Heidelberger Druckmaschinen Aktiengesellschaft
for financial year 2005/2006. The shareholders voted on nine
items on the agenda. These included the appropriation of retained
earnings and the associated issuing of a dividend of € 0.65 per
participating share.
Share Buyback Program Concluded
July 26, 2006 +++ A total of five percent of the capital stock
were bought back +++
Heidelberg concluded the share buyback program launched in
November 2005. A total of five percent of the capital stock were
repurchased for approximately € 150 million – equivalent to an
average price of € 35.
July 26, 2006Share buyback program concluded
‘Award Winning’ Annual Report
September 6, 2006 +++ Annual report achieves best result
of all times +++
For the second time in a row, Heidelberg’s annual report was
awarded the title of best annual report in the MDAX segment by
the German business magazine ‘manager magazin’. Altogether,
Heidelberg has come in first in this segment for the fifth time.
With its second place in the overall ranking, Heidelberg achieved
its best result so far. Already in July, last year’s annual report
had won two prizes at the 2005 Vision Awards of the ‘League of
American Communication Professionals’ (LACP) and came in
first among the top 100 annual reports.

2 0 0 6 / 0 7September
9/2006
September 6, 2006‘manager magazin’ award
September 20, 2006Innovation award
September 19, 2006New Suprasetter
September 28, 2006New plant in Shanghai
New Suprasetter for Small and Medium Formats
September 19, 2006 +++ High-end technology now also
available for entry-level market +++
At a trade press conference, Heidelberg presented the new
Suprasetter A52 and A74 models – the most cost-effective gate-
way to thermal printing plate production for small and medium-
sized commercial print shops. These new models perfectly com-
plement Heidelberg’s portfolio and fill a gap in the entry-level
market. The new platesetter uses the same laser technology –
developed by Heidelberg – as the high-end Suprasetter units.
Innovation Award for Heidelberg Products from the
German Printing Industry
September 20, 2006 +++ Awards for Prinect Inpress Control,
Prinect Integration System, and Anicolor +++
Readers of the trade magazines published by the publishing
company Ebner ranked Heidelberger Druckmaschinen AG’s
solutions and products first and second in the ‘print’ segment.
The majority of readers decided in favor of the inline color
measurement device Prinect
Inpress Control, and the
Anicolor inking unit technol-
ogy came in second. Addi-
tionally, Heidelberg’s Prinect
Integration System achieved
second place in the ‘prepress’
segment.
New Plant in China Inaugurated
September 28, 2006 +++ Production site at the Qingpu
industrial zone near Shanghai +++
Heidelberg has officially inaugurated its new assembly plant
in China. Production at the site already started in spring 2006.
It is the first plant in Asia for the world’s largest manufacturer
of sheetfed offset printing presses which next to Germany also
operates production sites in four other countries.

17I N T E R I M F I N A N C I A L S T A T E M E N T S
> CONSOLIDATED INTERIM FINANCIAL STATEMENTS
for the period April 1, 2006 to September 30, 2006
18
19
20
21
23
24
25
25
26
28
38
Interim income statement –April 1, 2006 to September 30, 2006
Interim income statement – July 1, 2006 to September 30, 2006
Interim income statement – Quarterly overview
Interim balance sheet
Cash flow statement – April 1, 2006 to September 30, 2006
Cash flow statement – Quarterly overview
Statement of recognized income and expense
Development of shareholders’ equity
Segment information
Notes
Supervisory Board and Management Board
I N T E R I M F I N A N C I A L S T A T E M E N T S18
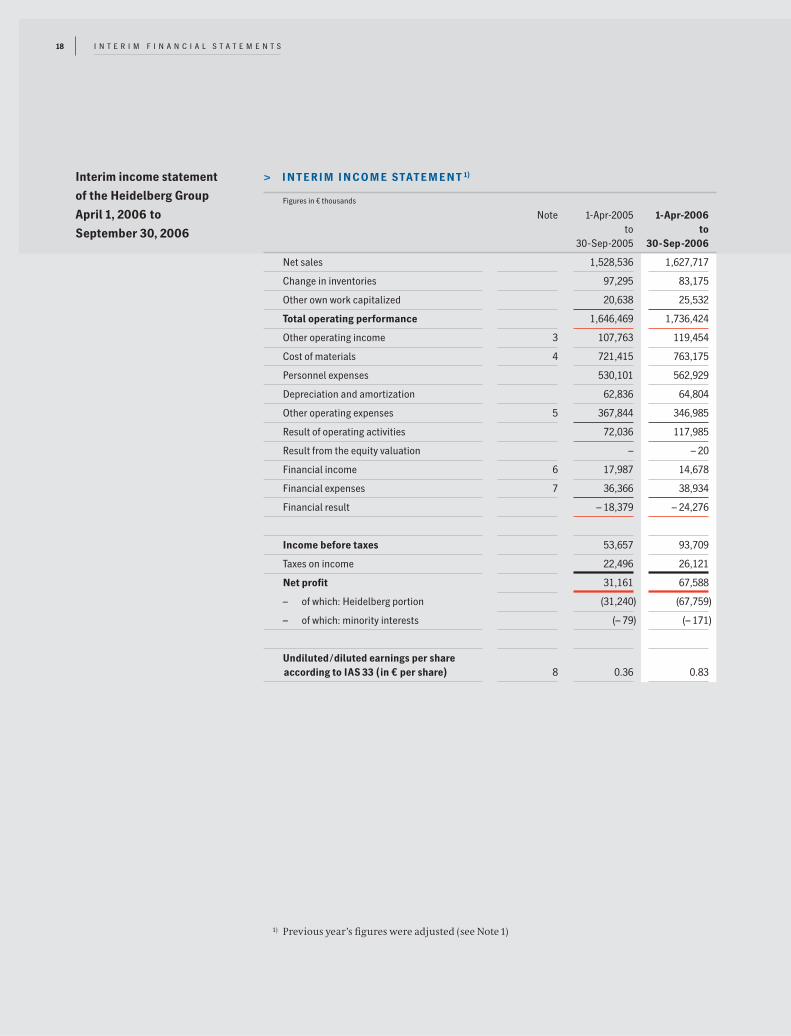
Interim income statement
of the Heidelberg Group
April 1, 2006 to
September 30, 2006
Note 1-Apr-2005 1-Apr-2006to to
30-Sep-2005 30-Sep-2006
Net sales 1,528,536 1,627,717
Change in inventories 97,295 83,175
Other own work capitalized 20,638 25,532
Total operating performance 1,646,469 1,736,424
Other operating income 3 107,763 119,454
Cost of materials 4 721,415 763,175
Personnel expenses 530,101 562,929
Depreciation and amortization 62,836 64,804
Other operating expenses 5 367,844 346,985
Result of operating activities 72,036 117,985
Result from the equity valuation – – 20
Financial income 6 17,987 14,678
Financial expenses 7 36,366 38,934
Financial result – 18,379 – 24,276
Income before taxes 53,657 93,709
Taxes on income 22,496 26,121
Net profit 31,161 67,588
– of which: Heidelberg portion (31,240) (67,759)
– of which: minority interests (– 79) (– 171)
Undiluted/diluted earnings per shareaccording to IAS 33 (in € per share) 8 0.36 0.83
> INTERIM INCOME STATEMENT 1)
Figures in € thousands
1) Previous year’s figures were adjusted (see Note1)

19I N T E R I M F I N A N C I A L S T A T E M E N T S
Interim income statement
of the Heidelberg Group
July 1, 2006 to
September 30, 2006
1-Jul-2005 1-Jul-2006to to
30-Sep-2005 30-Sep-2006
Net sales 868,678 908,762
Change in inventories – 8,076 – 6,154
Other own work capitalized 9,676 11,437
Total operating performance 870,278 914,045
Other operating income 42,414 72,480
Cost of materials 361,684 397,741
Personnel expenses 264,133 278,853
Depreciation and amortization 31,922 33,685
Other operating expenses 190,009 173,891
Result of operating activities 64,944 102,355
Result from the equity valuation – 180
Financial income 7,411 7,208
Financial expenses 18,606 22,083
Financial result – 11,195 – 14,695
Income before taxes 53,749 87,660
Taxes on income 22,008 24,662
Net profit 31,741 62,998
– of which: Heidelberg portion (31,755) (63,075)
– of which: minority interests (– 14) (– 77)
Undiluted/diluted earnings per shareaccording to IAS 33 (in € per share) 0.37 0.77
> INTERIM INCOME STATEMENT 1)
Figures in € thousands
1) Previous year’s figures were adjusted (see Note1)
I N T E R I M F I N A N C I A L S T A T E M E N T S20
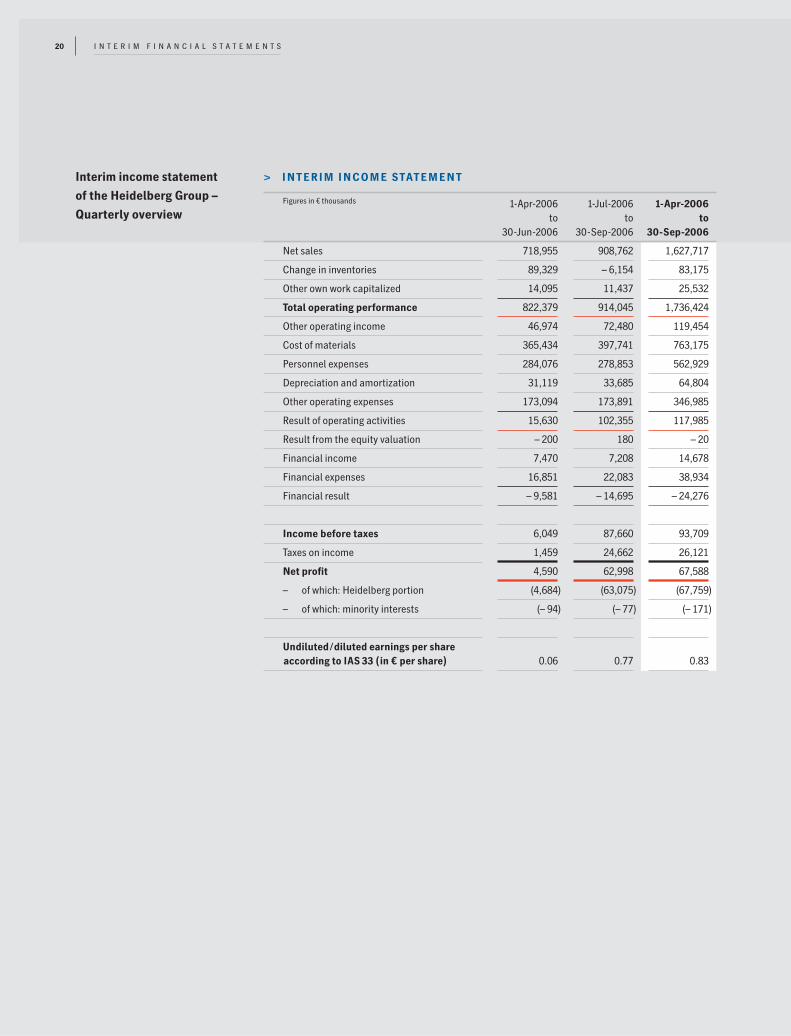
Interim income statement
of the Heidelberg Group –
Quarterly overview1-Apr-2006 1-Jul-2006 1-Apr-2006
to to to30-Jun-2006 30-Sep-2006 30-Sep-2006
Net sales 718,955 908,762 1,627,717
Change in inventories 89,329 – 6,154 83,175
Other own work capitalized 14,095 11,437 25,532
Total operating performance 822,379 914,045 1,736,424
Other operating income 46,974 72,480 119,454
Cost of materials 365,434 397,741 763,175
Personnel expenses 284,076 278,853 562,929
Depreciation and amortization 31,119 33,685 64,804
Other operating expenses 173,094 173,891 346,985
Result of operating activities 15,630 102,355 117,985
Result from the equity valuation – 200 180 – 20
Financial income 7,470 7,208 14,678
Financial expenses 16,851 22,083 38,934
Financial result – 9,581 – 14,695 – 24,276
Income before taxes 6,049 87,660 93,709
Taxes on income 1,459 24,662 26,121
Net profit 4,590 62,998 67,588
– of which: Heidelberg portion (4,684) (63,075) (67,759)
– of which: minority interests (– 94) (– 77) (– 171)
Undiluted/diluted earnings per shareaccording to IAS 33 (in € per share) 0.06 0.77 0.83
> INTERIM INCOME STATEMENT
Figures in € thousands

Note 31-Mar-2006 30-Sep-2006
Non-current assets
Intangible assets 9 258,531 255,526
Tangible assets 9 523,207 513,242
Investment property 9 26,506 19,115
Financial assets 1) 10 55,515 51,547
Receivables from customer financing 11 360,860 374,613
Other receivables and other assets 11 51,886 69,306
Deferred taxes 112,540 109,704
1,389,045 1,393,053
Current assets
Inventories 12 844,738 957,147
Receivables from customer financing 11 135,071 85,965
Trade receivables 11 678,320 579,956
Other receivables and other assets 11 137,896 153,055
Income tax assets 12,262 1,432
Marketable securities 187 688
Cash and cash equivalents 79,492 89,297
1,887,966 1,867,540
Assets held for sale 3,879 1,115
3,280,890 3,261,708
Interim balance sheet
of the Heidelberg Group
as of September 30, 2006
I N T E R I M F I N A N C I A L S T A T E M E N T S 21
>>>
> ASSETS
Figures in € thousands
1) Of which: financial assets carried according to the equity method € 1,793 thousand
(March 31, 2006: € 3,332 thousand)
I N T E R I M F I N A N C I A L S T A T E M E N T S 22
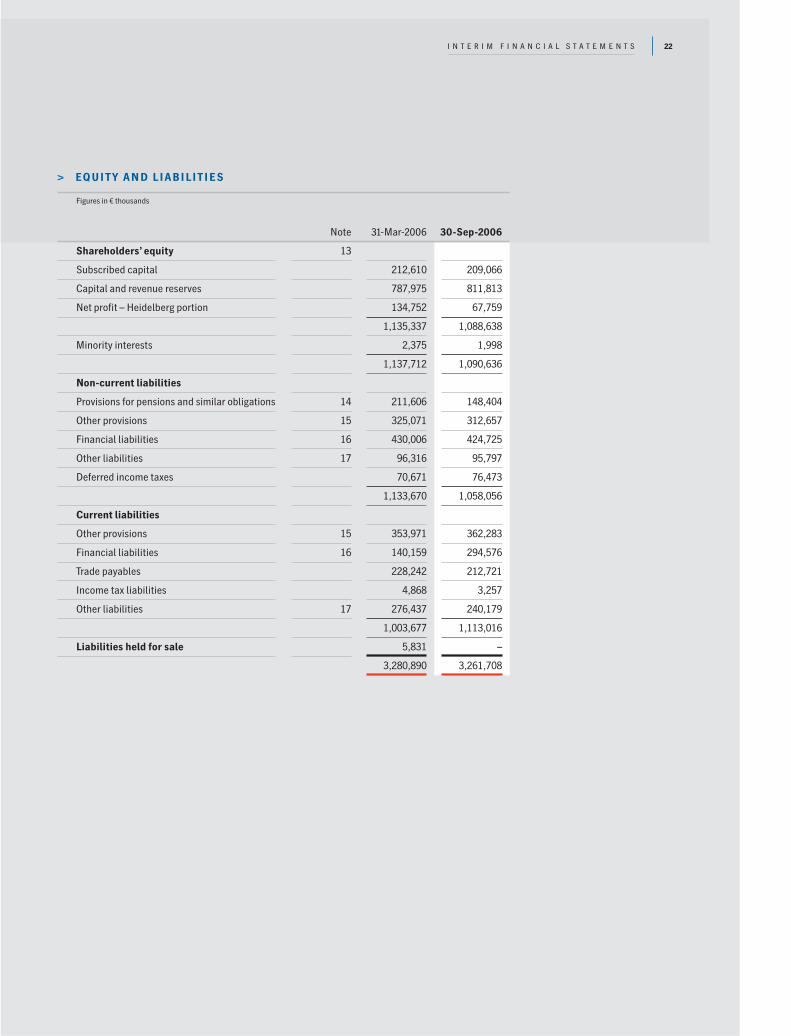
Note 31-Mar-2006 30-Sep-2006
Shareholders’ equity 13
Subscribed capital 212,610 209,066
Capital and revenue reserves 787,975 811,813
Net profit – Heidelberg portion 134,752 67,759
1,135,337 1,088,638
Minority interests 2,375 1,998
1,137,712 1,090,636
Non-current liabilities
Provisions for pensions and similar obligations 14 211,606 148,404
Other provisions 15 325,071 312,657
Financial liabilities 16 430,006 424,725
Other liabilities 17 96,316 95,797
Deferred income taxes 70,671 76,473
1,133,670 1,058,056
Current liabilities
Other provisions 15 353,971 362,283
Financial liabilities 16 140,159 294,576
Trade payables 228,242 212,721
Income tax liabilities 4,868 3,257
Other liabilities 17 276,437 240,179
1,003,677 1,113,016
Liabilities held for sale 5,831 –
3,280,890 3,261,708
> EQUITY AND LIABILITIES
Figures in € thousands

I N T E R I M F I N A N C I A L S T A T E M E N T S 23
1-Apr-2005 1-Apr-2006to to
30-Sep-2005 30-Sep-2006
Net profit 31,161 67,588
Depreciation and amortization 2) 62,836 64,804
Change in pension provisions 11,543 – 5,526
Change in deferred taxes/tax provisions 12,070 14,882
Result from the equity valuation – 20
Result from disposals – 558 – 47,574
Cash flow 117,052 94,194
Change in inventories – 152,401 – 124,011
Change in customer financing 40,158 26,837
Change in trade receivables/trade payables – 18,875 70,237
Change in other provisions – 51,352 – 21,113
Change in other balance sheet items 58,318 – 28,745
Other operating changes – 124,152 – 76,795
Outflow/inflow of funds from operating activities – 7,100 17,399
Intangible assets/tangible assets/ investment property
Investments – 65,690 – 65,857
Proceeds from disposals 15,911 30,021
Financial assets
Investments – 3,266 – 8,627
Proceeds from disposals 93 51,710
Pension funding – – 50,000
Outflow of funds from investment activity – 52,952 – 42,753
Free cash flow – 60,052 – 25,354
Treasury stock – – 52,055
Dividend payment – 25,858 – 53,275
Change in financial liabilities 48,525 142,355
Inflow of funds from financing activity 22,667 37,025
Net change in cash and cash equivalents – 37,385 11,671
Cash and cash equivalents at the beginning of the quarter 131,537 79,679
Changes in the scope of the consolidation – –
Currency adjustments 2,548 – 1,365
Net change in cash and cash equivalents – 37,385 11,671
Cash and cash equivalents at the end of the quarter 96,700 89,985
> CONSOLIDATED CASH FLOW STATEMENT 1)
Figures in € thousands
1) Previous year’s figures were adjusted (see Note1)
2) Relates to intangible assets, tangible assets, investment property, and financial assets
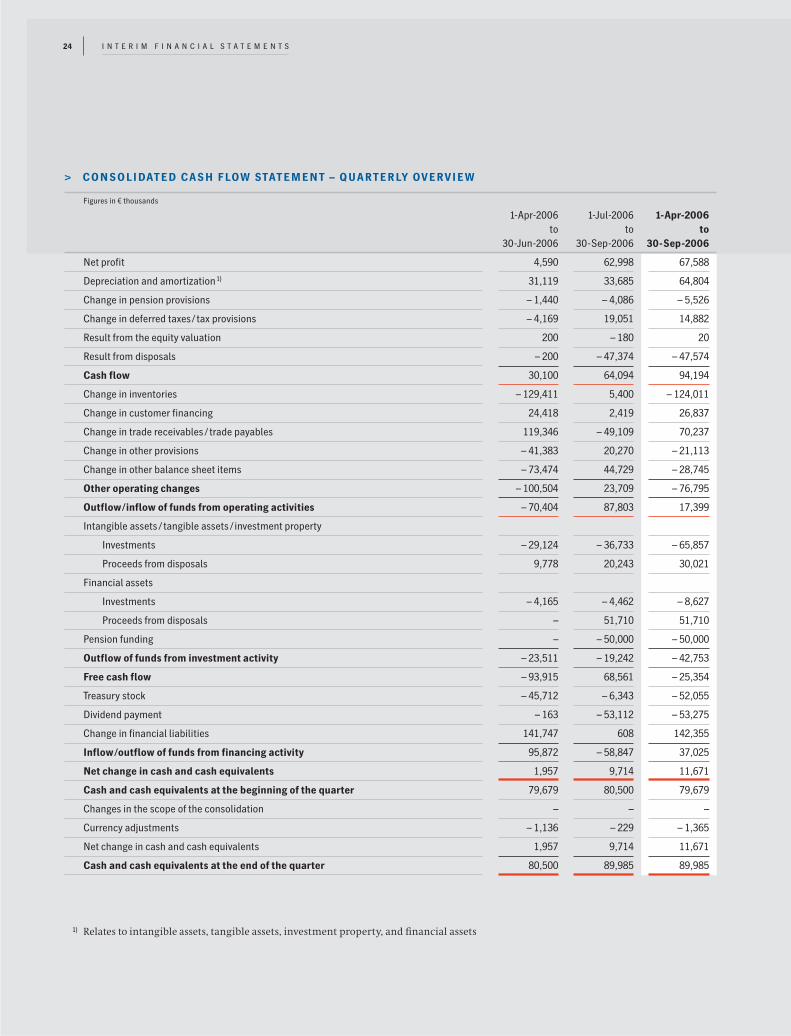
I N T E R I M F I N A N C I A L S T A T E M E N T S24
1-Apr-2006 1-Jul-2006 1-Apr-2006to to to
30-Jun-2006 30-Sep-2006 30-Sep-2006
Net profit 4,590 62,998 67,588
Depreciation and amortization 1) 31,119 33,685 64,804
Change in pension provisions – 1,440 – 4,086 – 5,526
Change in deferred taxes/tax provisions – 4,169 19,051 14,882
Result from the equity valuation 200 – 180 20
Result from disposals – 200 – 47,374 – 47,574
Cash flow 30,100 64,094 94,194
Change in inventories – 129,411 5,400 – 124,011
Change in customer financing 24,418 2,419 26,837
Change in trade receivables/trade payables 119,346 – 49,109 70,237
Change in other provisions – 41,383 20,270 – 21,113
Change in other balance sheet items – 73,474 44,729 – 28,745
Other operating changes – 100,504 23,709 – 76,795
Outflow/inflow of funds from operating activities – 70,404 87,803 17,399
Intangible assets/tangible assets/ investment property
Investments – 29,124 – 36,733 – 65,857
Proceeds from disposals 9,778 20,243 30,021
Financial assets
Investments – 4,165 – 4,462 – 8,627
Proceeds from disposals – 51,710 51,710
Pension funding – – 50,000 – 50,000
Outflow of funds from investment activity – 23,511 – 19,242 – 42,753
Free cash flow – 93,915 68,561 – 25,354
Treasury stock – 45,712 – 6,343 – 52,055
Dividend payment – 163 – 53,112 – 53,275
Change in financial liabilities 141,747 608 142,355
Inflow/outflow of funds from financing activity 95,872 – 58,847 37,025
Net change in cash and cash equivalents 1,957 9,714 11,671
Cash and cash equivalents at the beginning of the quarter 79,679 80,500 79,679
Changes in the scope of the consolidation – – –
Currency adjustments – 1,136 – 229 – 1,365
Net change in cash and cash equivalents 1,957 9,714 11,671
Cash and cash equivalents at the end of the quarter 80,500 89,985 89,985
> CONSOLIDATED CASH FLOW STATEMENT – QUARTERLY OVERVIEW
Figures in € thousands
1) Relates to intangible assets, tangible assets, investment property, and financial assets
I N T E R I M F I N A N C I A L S T A T E M E N T S 25
1-Apr-2005 1-Apr-2006to to
30-Sep-2005 30-Sep-2006
Net profit 31,161 67,588
Actuarial losses from pension obligations – 57,204 13,214
Foreign currency translation 4,477 – 27,023
Financial assets 11,636 – 203
Cash flow hedges – 13,441 502
Total recognized income and expense without effect on the income statement – 54,532 – 13,510
Total income and expense – 23,371 54,078
– of which: Heidelberg portion (– 23,366) (54,292)
– of which: minority interests (– 5) (– 214)
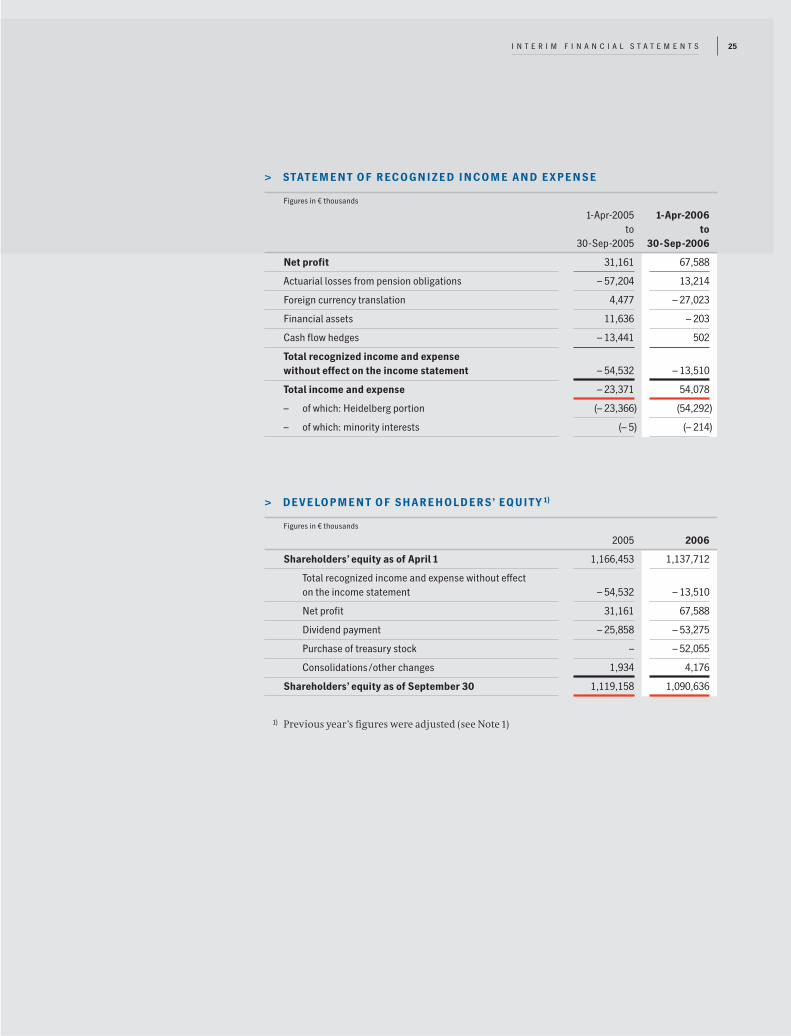
> STATEMENT OF RECOGNIZED INCOME AND EXPENSE
Figures in € thousands
2005 2006
Shareholders’ equity as of April 1 1,166,453 1,137,712
Total recognized income and expense without effect on the income statement – 54,532 – 13,510
Net profit 31,161 67,588
Dividend payment – 25,858 – 53,275
Purchase of treasury stock – – 52,055
Consolidations/other changes 1,934 4,176
Shareholders’ equity as of September 30 1,119,158 1,090,636
> DEVELOPMENT OF SHAREHOLDERS’ EQUITY 1)
Figures in € thousands
1) Previous year’s figures were adjusted (see Note1)

For additional explanations see Note19
1) Previous year’s figures were adjusted (see Note1)
2) Including non-scheduled depreciation totaling € 1,966 thousand (previous year: € 0 thousand)
3) Previous year’s figures were adjusted due to the reassignment of affiliated companies within the regions
4) Previous year’s figures refer to March 31, 2006
Segment information of the Heidelberg Group April 1, 2006 to September 30, 2006
> SEGMENT INFORMATION BY REGION
Figures in € thousands
Europe, Middle East and Africa3) Eastern Europe3)
1-Apr-2005 1-Apr-2006 1-Apr-2005 1-Apr-2006to to to to
30-Sep-2005 30-Sep-2006 30-Sep-2005 30-Sep-2006
External sales by customer location 669,657 742,115 163,600 165,653
Investments 54,764 61,157 998 2,312
Segment assets4) 1,836,968 1,942,666 186,522 175,335
> SEGMENT INFORMATION BY DIVISION 1)
Figures in € thousands
Press Postpress
1-Apr-2005 1-Apr-2006 1-Apr-2005 1-Apr-2006to to to to
30-Sep-2005 30-Sep-2006 30-Sep-2005 30-Sep-2006
External sales 1,329,539 1,422,471 174,238 185,944
Depreciation2) 60,142 61,908 2,381 2,859
Non-cash expenses 132,984 173,455 11,837 12,409
Research and development costs 91,518 104,461 9,776 11,655
Result of operating activities (segment result) 63,525 95,619 – 2,089 539
Result from the equity valuation – – 20 – –
Investments 62,167 63,771 3,426 1,975
Segment assets4) 2,255,041 2,284,869 251,275 263,611
Segment debt 4) 1,108,044 1,015,616 86,522 84,329
Number of employees4) 16,684 17,031 1,946 1,977
I N T E R I M F I N A N C I A L S T A T E M E N T S26
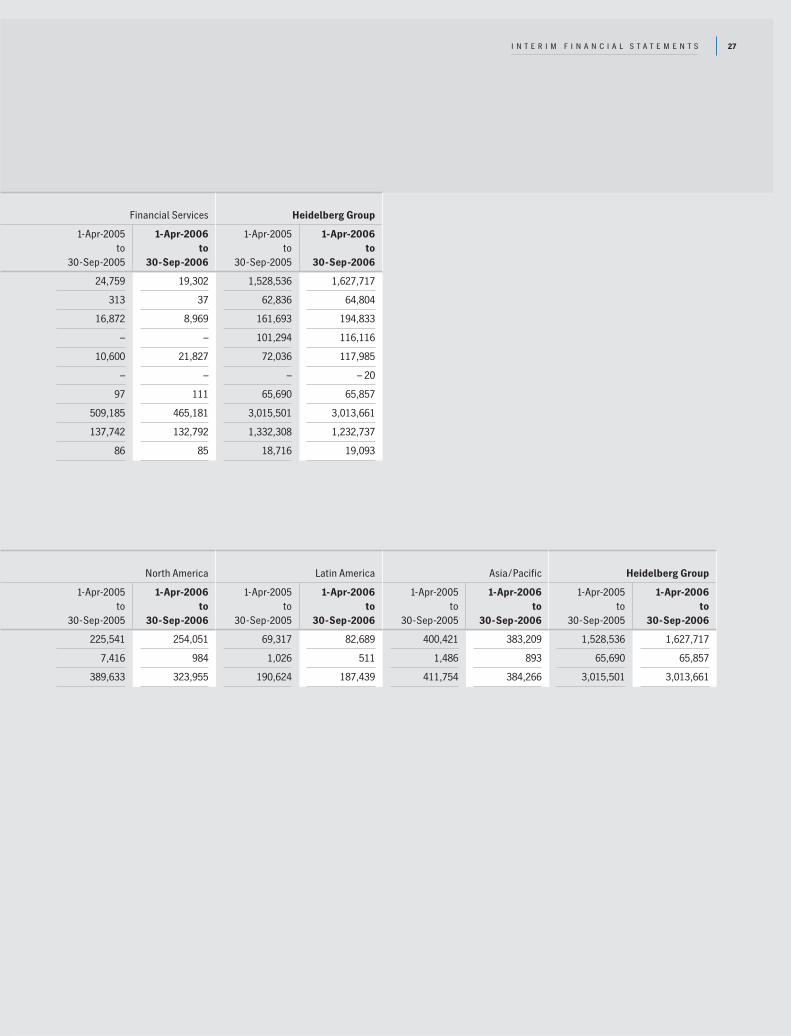
North America Latin America Asia/Pacific Heidelberg Group
1-Apr-2005 1-Apr-2006 1-Apr-2005 1-Apr-2006 1-Apr-2005 1-Apr-2006 1-Apr-2005 1-Apr-2006to to to to to to to to
30-Sep-2005 30-Sep-2006 30-Sep-2005 30-Sep-2006 30-Sep-2005 30-Sep-2006 30-Sep-2005 30-Sep-2006
225,541 254,051 69,317 82,689 400,421 383,209 1,528,536 1,627,717
7,416 984 1,026 511 1,486 893 65,690 65,857
389,633 323,955 190,624 187,439 411,754 384,266 3,015,501 3,013,661
Financial Services Heidelberg Group
1-Apr-2005 1-Apr-2006 1-Apr-2005 1-Apr-2006to to to to
30-Sep-2005 30-Sep-2006 30-Sep-2005 30-Sep-2006
24,759 19,302 1,528,536 1,627,717
313 37 62,836 64,804
16,872 8,969 161,693 194,833
– – 101,294 116,116
10,600 21,827 72,036 117,985
– – – – 20
97 111 65,690 65,857
509,185 465,181 3,015,501 3,013,661
137,742 132,792 1,332,308 1,232,737
86 85 18,716 19,093
27I N T E R I M F I N A N C I A L S T A T E M E N T S

Notes
1 Accounting and
valuation policies
The consolidated interim financial report as of September 30, 2006 was pre-
pared in accordance with the International Financial Reporting Standards
(IFRS) which became effective and binding at that time. The IFRS comprise
the IFRS newly released by the International Accounting Standards Board
(IASB), as well as the International Accounting Standards (IAS), and the inter-
pretations of the International Financial Reporting Interpretations Com-
mittee (IFRIC) and of the Standing Interpretations Committee (SIC).
Due to the initial application of the new IFRS provision on share-based
payment (IFRS 2) as well as to the changed regulations regarding employee
benefits (IAS 19 [2004]) and regarding the disclosure and presentation of
financial instruments (IAS 32) in financial year 2005/2006, each of which
came into effect retroactively, the previous year’s figures were adjusted.
The standards and interpretations becoming initially effective and binding
beginning in financial year 2006/2007 had no significant influence on the
quarterly statement. The impact of standards already released but not yet
applicable, particularly those of IFRS 7 ‘Financial instruments: Disclosures’,
are currently being analyzed. The initial application of IFRS 7 will result in
an extension of the Notes to the Financial Statements.
Revenues that are received seasonally, cyclically, or occasionally are not
anticipated or deferred in the consolidated interim financial report. Costs
incurred unevenly during the financial year were deferred if deferral would
be appropriate at the end of the financial year.
Income tax was calculated for the financial year as a whole based on the
weighted average income tax rate of the respective country.
Apart from Heidelberger Druckmaschinen Aktiengesellschaft, the consoli-
dated interim financial statements include all domestic and foreign entities
in which Heidelberger Druckmaschinen Aktiengesellschaft is in a position
to exercise a controlling influence as described in IAS 27. Shares in subsid-
iaries that are of minor significance are not included.
2 Scope of the
consolidation
I N T E R I M F I N A N C I A L S T A T E M E N T S28

31-Mar-2006 30-Sep-2006
Wholly consolidated companies 72 70
Non-consolidated companies due to their minor importance 33 34
Associated companies measured according to the equity method 1 1
Associated companies not measured accordingto the equity method due to their minor importance 4 4
Other participations 4 4
114 113
The scope of the consolidation is as follows:
1-Apr-2005 1-Apr-2006to to
30-Sep-2005 30-Sep-2006
Income from initial consolidation – 37,594
Reversal of other provisions 40,251 21,980
Income from written-off receivables 14,620 10,097
Income from operating facilities 12,502 9,834
Hedging transactions/foreign-exchange profit 21,214 7,944
Income from disposals of intangible assets, tangible assets, and investment property 1,452 7,487
Other income 17,724 24,518
107,763 119,454
3 Other operating
income
Income from hedging transactions/foreign-exchange profits is offset by
expenses from hedging transactions/foreign-exchange losses that are shown
in other operating expenses (Note 5).
29I N T E R I M F I N A N C I A L S T A T E M E N T S
Compared with the previous year, the scope of the consolidation changed
as follows:
> Deconsolidation:
During the second quarter of the current financial year, Linotype GmbH,
Bad Homburg, was deconsolidated as a result of the sale of the share-
holding.
> Merger:
During the second quarter of the current financial year, Heidelberg
Boxmeer Participation B.V., Boxmeer, Netherlands, was merged with
Heidelberg Boxmeer B.V., Boxmeer, Netherlands.
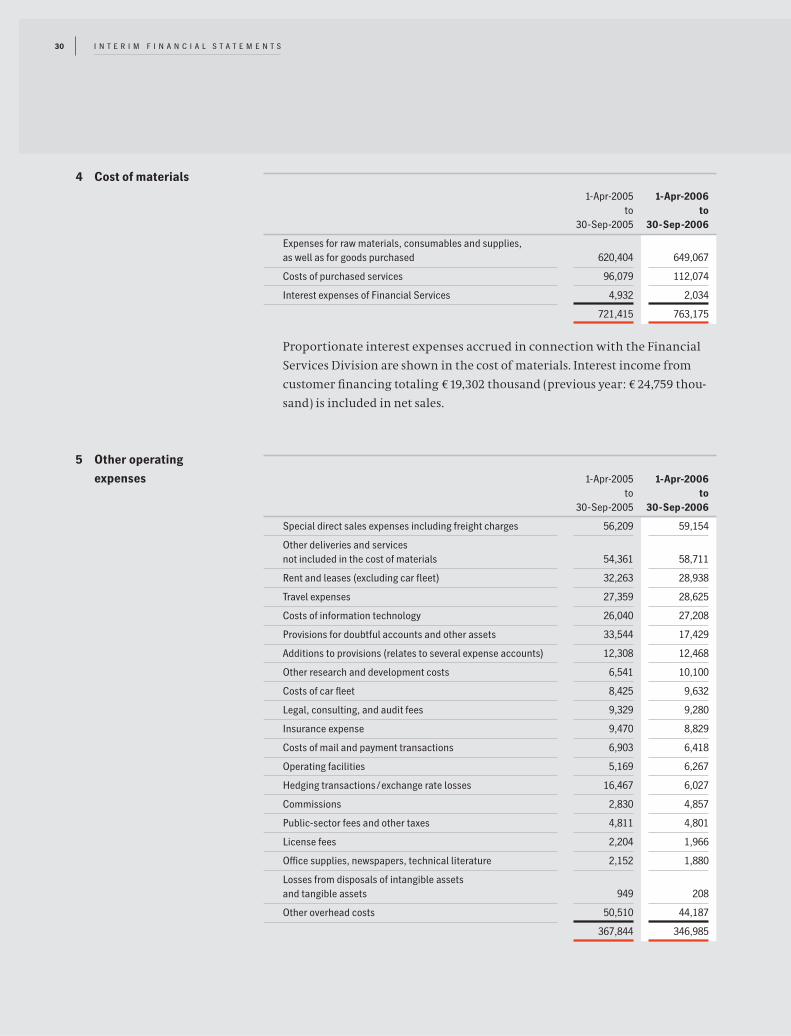
4 Cost of materials
1-Apr-2005 1-Apr-2006to to
30-Sep-2005 30-Sep-2006
Expenses for raw materials, consumables and supplies, as well as for goods purchased 620,404 649,067
Costs of purchased services 96,079 112,074
Interest expenses of Financial Services 4,932 2,034
721,415 763,175
Proportionate interest expenses accrued in connection with the Financial
Services Division are shown in the cost of materials. Interest income from
customer financing totaling €19,302 thousand (previous year: € 24,759 thou-
sand) is included in net sales.
5 Other operating
expenses 1-Apr-2005 1-Apr-2006to to
30-Sep-2005 30-Sep-2006
Special direct sales expenses including freight charges 56,209 59,154
Other deliveries and servicesnot included in the cost of materials 54,361 58,711
Rent and leases (excluding car fleet) 32,263 28,938
Travel expenses 27,359 28,625
Costs of information technology 26,040 27,208
Provisions for doubtful accounts and other assets 33,544 17,429
Additions to provisions (relates to several expense accounts) 12,308 12,468
Other research and development costs 6,541 10,100
Costs of car fleet 8,425 9,632
Legal, consulting, and audit fees 9,329 9,280
Insurance expense 9,470 8,829
Costs of mail and payment transactions 6,903 6,418
Operating facilities 5,169 6,267
Hedging transactions/exchange rate losses 16,467 6,027
Commissions 2,830 4,857
Public-sector fees and other taxes 4,811 4,801
License fees 2,204 1,966
Office supplies, newspapers, technical literature 2,152 1,880
Losses from disposals of intangible assets and tangible assets 949 208
Other overhead costs 50,510 44,187
367,844 346,985
I N T E R I M F I N A N C I A L S T A T E M E N T S30

Expenses from hedging transactions/foreign-exchange losses are offset by
income from hedging transactions/foreign-exchange profits that are shown
in other operating income (Note 3).
6 Financial income
The decline in financial income is economically associated with the transfer
of securities held in the specialized investment funds to the Heidelberg
Pension-Trust e.V., Heidelberg, within the scope of a Contractual Trust Arrange-
ment (CTA) at the end of financial year 2005/2006.
1-Apr-2005 1-Apr-2006to to
30-Sep-2005 30-Sep-2006
Interest and similar income 8,331 10,215
Income from financial assets/loans/marketable securities 9,656 4,463
17,987 14,678
7 Financial expenses
1-Apr-2005 1-Apr-2006to to
30-Sep-2005 30-Sep-2006
Interest and similar expenses 29,078 34,319
Expenses from financial assets/loans/marketable securities 7,288 4,615
36,366 38,934
Earnings per share are calculated by dividing the net profit to which the share-
holders of Heidelberg are entitled by the weighted number of outstanding
shares during the period (first half-year 2006/2007: 81,985,527 shares). The
weighted number of outstanding shares was influenced by the purchase of
treasury stock in the first six months of the financial year. As at September 30,
2006 the treasury stock comprised 1,384,424 shares. There is no difference
between the diluted and undiluted earnings per share.
8 Earnings per share
31I N T E R I M F I N A N C I A L S T A T E M E N T S
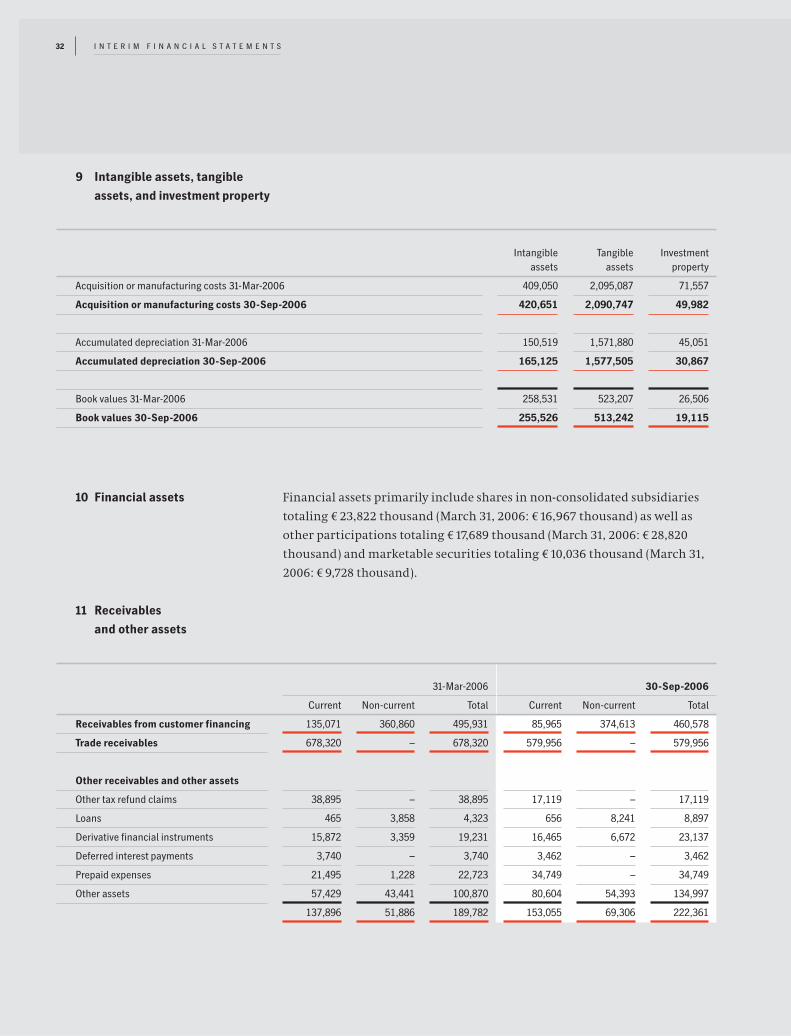
9 Intangible assets, tangible
assets, and investment property
11 Receivables
and other assets
31-Mar-2006 30-Sep-2006
Current Non-current Total Current Non-current Total
Receivables from customer financing 135,071 360,860 495,931 85,965 374,613 460,578
Trade receivables 678,320 – 678,320 579,956 – 579,956
Other receivables and other assets
Other tax refund claims 38,895 – 38,895 17,119 – 17,119
Loans 465 3,858 4,323 656 8,241 8,897
Derivative financial instruments 15,872 3,359 19,231 16,465 6,672 23,137
Deferred interest payments 3,740 – 3,740 3,462 – 3,462
Prepaid expenses 21,495 1,228 22,723 34,749 – 34,749
Other assets 57,429 43,441 100,870 80,604 54,393 134,997
137,896 51,886 189,782 153,055 69,306 222,361
Financial assets primarily include shares in non-consolidated subsidiaries
totaling € 23,822 thousand (March 31, 2006: €16,967 thousand) as well as
other participations totaling €17,689 thousand (March 31, 2006: € 28,820
thousand) and marketable securities totaling €10,036 thousand (March 31,
2006: € 9,728 thousand).
10 Financial assets
I N T E R I M F I N A N C I A L S T A T E M E N T S32
Intangible Tangible Investmentassets assets property
Acquisition or manufacturing costs 31-Mar-2006 409,050 2,095,087 71,557
Acquisition or manufacturing costs 30-Sep-2006 420,651 2,090,747 49,982
Accumulated depreciation 31-Mar-2006 150,519 1,571,880 45,051
Accumulated depreciation 30-Sep-2006 165,125 1,577,505 30,867
Book values 31-Mar-2006 258,531 523,207 26,506
Book values 30-Sep-2006 255,526 513,242 19,115
On November 8, 2005 the Management Board of Heidelberger Druckmaschi-
nen Aktiengesellschaft approved the launch of a share buyback program.
Between November 9, 2005 and January 19, 2007 at the latest, the Company
intends to acquire shares amounting to up to five percent of its capital stock
(up to 4,295,424 shares). The Management Board is putting into effect the
Annual General Meeting’s decision of July 20, 2005 to authorize the buyback
of shares amounting to up to ten percent of its capital stock (up to 8,590,848
shares) by January 19, 2007. With the Annual General Meeting’s resolution of
July 20, 2006, this authorization was replaced by a reauthorization valid
until January 19, 2008 comprising essentially identical conditions. The repur-
chased shares are earmarked solely for capital retirement and employee share
participation programs, as well as other forms of an allotment of shares to
staff members of the Company or an affiliate following the Annual General
Meeting’s authorization.
Overall, 2,911,000 shares were repurchased by March 31, 2006 of which
53,223 shares were used in the employee share participation program. The
remaining 2,857,777 shares were utilized within the framework of the capital
reduction, which was approved by the Management Board on March 31, 2006.
Share capital was thereby reduced from € 219,925,708.80 (= 85,908,480 shares)
by € 7,315,909.12 (= 2,857,777 shares) to € 212,609,799.68 (= 83,050,703 shares).
During the period April 1, 2006 to July 26, 2006 an additional 1,384,424 shares
were bought back which were still held on stock at September 30, 2006.
13 Shareholders’ equity
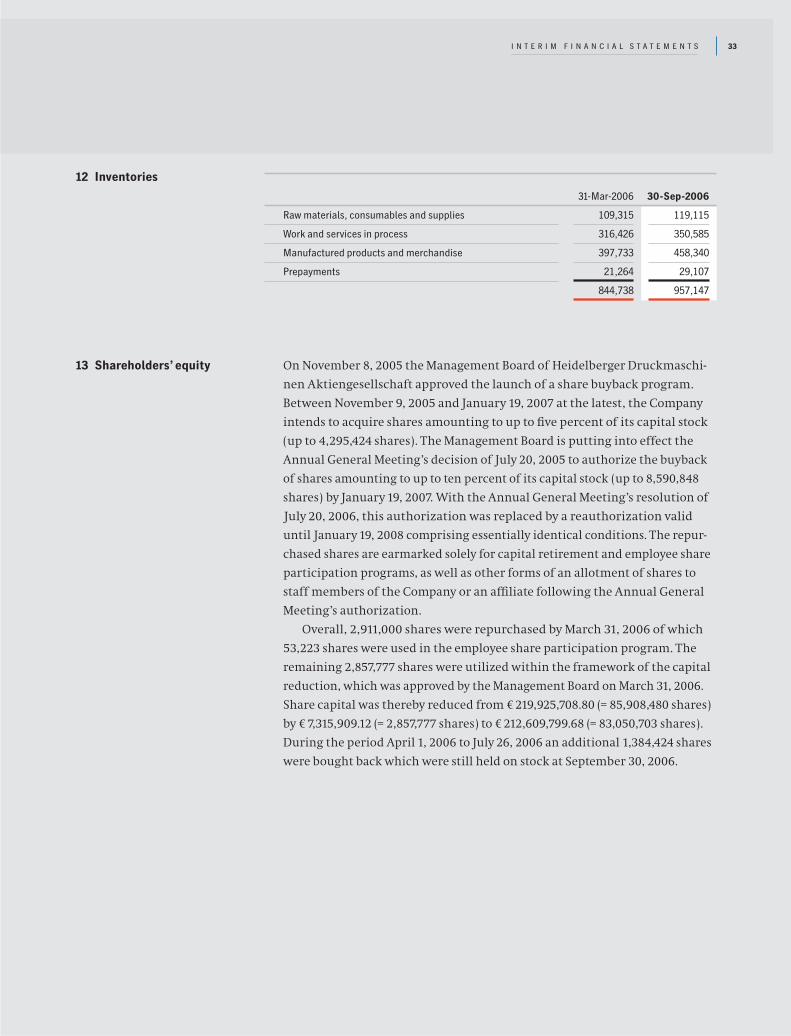
12 Inventories
31-Mar-2006 30-Sep-2006
Raw materials, consumables and supplies 109,315 119,115
Work and services in process 316,426 350,585
Manufactured products and merchandise 397,733 458,340
Prepayments 21,264 29,107
844,738 957,147
33I N T E R I M F I N A N C I A L S T A T E M E N T S

For the majority of employees we maintain benefit programs for the period
following their retirement – either through the direct program or one financed
by payments of premiums to private institutions. The level of benefit payments
depends on the conditions in particular countries. The amounts are generally
based on the term of employment and the salary of the employee. The liabilities
include both those arising from current pensions as well as vested pension
rights for pensions payable in the future. The pension payments expected fol-
lowing the beginning of benefit payments are apportioned over the employee’s
overall period of employment. After deduction of deferred taxes, actuarial
gains and losses are offset against shareholders’ equity without effect on the
income statement.
14 Provisions for pensions
and similar obligations
15 Other provisions
31-Mar-2006 30-Sep-2006
Current Non-current Total Current Non-current Total
Tax provisions 9,246 195,745 204,991 23,445 200,447 223,892
Other provisions
Liabilities arising from human resources 121,871 72,135 194,006 130,280 51,946 182,226
Liabilities arising from sales and service activities 129,874 26,735 156,609 128,433 22,813 151,246
Other 92,980 30,456 123,436 80,125 37,451 117,576
344,725 129,326 474,051 338,838 112,210 451,048
353,971 325,071 679,042 362,283 312,657 674,940
16 Financial liabilities
31-Mar-2006 30-Sep-2006
Current Non-current Total Current Non-current Total
Convertible bond – 278,296 278,296 – 282,414 282,414
Private placement 7,256 137,500 144,756 7,206 134,000 141,206
To banks 109,004 8,034 117,038 256,813 2,889 259,702
From financial lease relationships 7,609 6,176 13,785 7,510 5,422 12,932
Other 16,290 – 16,290 23,047 – 23,047
140,159 430,006 570,165 294,576 424,725 719,301
I N T E R I M F I N A N C I A L S T A T E M E N T S34
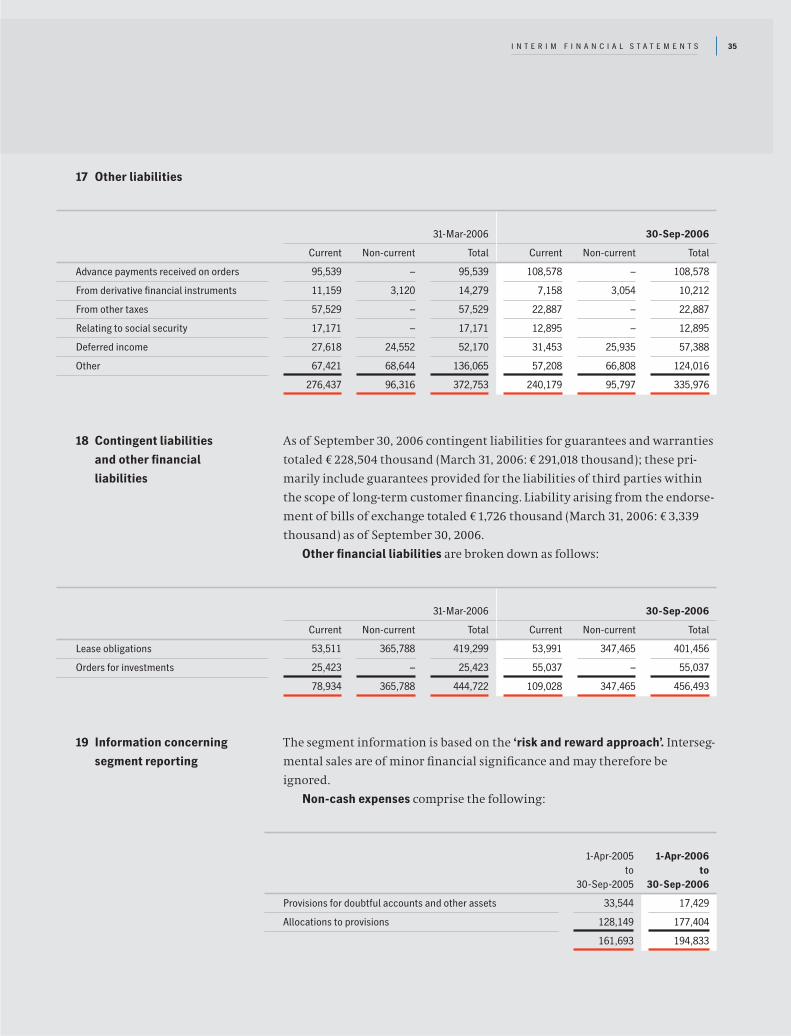
17 Other liabilities
31-Mar-2006 30-Sep-2006
Current Non-current Total Current Non-current Total
Advance payments received on orders 95,539 – 95,539 108,578 – 108,578
From derivative financial instruments 11,159 3,120 14,279 7,158 3,054 10,212
From other taxes 57,529 – 57,529 22,887 – 22,887
Relating to social security 17,171 – 17,171 12,895 – 12,895
Deferred income 27,618 24,552 52,170 31,453 25,935 57,388
Other 67,421 68,644 136,065 57,208 66,808 124,016
276,437 96,316 372,753 240,179 95,797 335,976
18 Contingent liabilities
and other financial
liabilities
As of September 30, 2006 contingent liabilities for guarantees and warranties
totaled € 228,504 thousand (March 31, 2006: € 291,018 thousand); these pri-
marily include guarantees provided for the liabilities of third parties within
the scope of long-term customer financing. Liability arising from the endorse-
ment of bills of exchange totaled €1,726 thousand (March 31, 2006: € 3,339
thousand) as of September 30, 2006.
Other financial liabilities are broken down as follows:
31-Mar-2006 30-Sep-2006
Current Non-current Total Current Non-current Total
Lease obligations 53,511 365,788 419,299 53,991 347,465 401,456
Orders for investments 25,423 – 25,423 55,037 – 55,037
78,934 365,788 444,722 109,028 347,465 456,493
The segment information is based on the ‘risk and reward approach’. Interseg-
mental sales are of minor financial significance and may therefore be
ignored.
Non-cash expenses comprise the following:
1-Apr-2005 1-Apr-2006to to
30-Sep-2005 30-Sep-2006
Provisions for doubtful accounts and other assets 33,544 17,429
Allocations to provisions 128,149 177,404
161,693 194,833
19 Information concerning
segment reporting
35I N T E R I M F I N A N C I A L S T A T E M E N T S

Research and development costs result from capitalized research and develop-
ment costs, however excluding depreciation on the development costs for the
reporting period.
Investments comprise investments in intangible assets and tangible assets.
Segment assets and segment debt result from gross assets or gross debt
as follows:
31-Mar-2006 30-Sep-2006
Gross assets per balance sheet 3,280,890 3,261,708
– financial assets – 55,515 – 51,547
– marketable securities – 187 – 688
– finance receivables – 45,676 – 67,557
– deferred tax assets 1) – 112,854 – 109,704
– tax claims – 51,157 – 18,551
Segment assets 3,015,501 3,013,661
31-Mar-2006 30-Sep-2006
Borrowed funds per balance sheet 1) 2,143,178 2,171,072
– tax provisions – 204,991 – 223,892
– tax obligations 2) – 62,453 – 26,144
– financial obligations – 472,755 – 611,826
– deferred tax liabilities – 70,671 – 76,473
Segment debt 1,332,308 1,232,737
1) Non-current and current borrowed funds including liabilities held for sale
2) Deviations from the balance sheet result from liabilities held for sale
1) Deviations from the balance sheet result from assets held for sale
I N T E R I M F I N A N C I A L S T A T E M E N T S36

On October 31, 2006 the Management Board of Heidelberger Druckmaschinen
Aktiengesellschaft decided to acquire own shares in an amount equal to up
to 5 percent of its capital stock (up to 4,152,535 shares) within the period from
November 7, 2006 to January 19, 2008 at the latest.
Heidelberg, November 2006
The Management Board
21 Information on events
after the reporting date
The members of the Supervisory Board and the Management Board are listed
on page 38.
20 Supervisory Board/
Management Board
Finance receivables comprise finance receivables against affiliated companies
and other financial assets.
Financial liabilities comprise the items specified in Note16, with the excep-
tion of financial liabilities associated with customer financing.
The number of employees was recorded as of September 30, 2006 compared
with March 31, 2006.
37I N T E R I M F I N A N C I A L S T A T E M E N T S

S U P E R V I S O R Y B O A R D A N D M A N A G E M E N T B O A R D38
Dr. Mark Wössner
Chairman of the
Supervisory Board
Rainer Wagner*
Deputy Chairman
of the Supervisory Board
Martin Blessing
Prof. Dr. Clemens Börsig
Wolfgang Flörchinger*
Martin Gauß*
Mirko Geiger*
Gunther Heller*
Dr. Jürgen Heraeus
Jörg Hofmann*
Robert J.Koehler
Uwe Lüders
Dr. Gerhard Rupprecht
Beate Schmitt*
Dr. Klaus Sturany
Peter Sudadse*
Management Committee
Dr. Mark Wössner
Rainer Wagner
Martin Blessing
Martin Gauß
Mirko Geiger
Dr. Gerhard Rupprecht
Mediation Committee
under Article 27 Subsection 3
of the Codetermination Act
Dr. Mark Wössner
Rainer Wagner
Martin Blessing
Wolfgang Flörchinger
Committee on Arranging
Personnel Matters of the
Management Board
Dr. Mark Wössner
Rainer Wagner
Dr. Gerhard Rupprecht
Audit Committee
Dr. Klaus Sturany
Prof. Dr. Clemens Börsig
Mirko Geiger
Rainer Wagner
Bernhard Schreier
Chairman of the
Management Board
Dirk Kaliebe
– since October 1, 2006 –
Dr. Herbert Meyer
– through September 30, 2006 –
Dr. Jürgen Rautert
Employee Representative*
The Supervisory Board
Committees of theSupervisory Board
The Management Board

Financial Calendar 2006/2007
January 31, 2007 Publication of 3rd Quarter Figures 2006/2007
May 9, 2007 Publication of Preliminary Figures 2006/2007
June 13, 2007 Press Conference, Annual Analysts’ and Investors’ Conference
July 26, 2007 Annual General Meeting
August 2, 2007 Publication of 1st Quarter Figures 2007/2008
November 6, 2007 Publication of Half-Year Figures 2007/2008
Subject to change
Copyright © 2006
Heidelberger Druckmaschinen
Aktiengesellschaft
Kurfuersten-Anlage 52 – 60
69115 Heidelberg
Germany
www.heidelberg.com
Photo credits: Archive Heidelberger Druckmaschinen AG.
Produced on Heidelberg machines using Heidelberg technology.
All rights and technical changes reserved.
Printed in Germany.
This Interim Financial Report is a trans-
lation of the official German Interim
Financial Report of Heidelberger Druck-
maschinen Aktiengesellschaft.The
Company disclaims responsibility for
any misunderstanding or misinterpre-
tation due to this translation.
This report was published on November 7, 2006.

Heidelberger Druckmaschinen AG
Kurfuersten-Anlage 52 – 60
69115 Heidelberg
Germany
www.heidelberg.com


