16
Interim report at September 30, 2008

Interim reportat September 30, 2008

A Joint Stock Company with Registered Office In San Donato Milanese, Italy Via Martiri di Cefalonia 67 Fully paid-up Share Capital Euro 441,410,900 Fiscal Code and Milan Companies’ Register No. 00825790157 Tel. Switchboard: +39-025201 Fax +39-0252054295 www.saipem.eni.it
Saipem: Board of Directors approves interim report at September 30, 2008
• Overall net profit for the first nine months of 2008: €690 million. • Adjusted net profit for the first nine months of 2008: €510 million, up 32%
compared to the same period of 2007. • Adjusted net profit for the third quarter of 2008 totals €189 million, up 29%
compared to the same period of 2007. • New contracts awarded to the Saipem Group during the first nine months of 2008
amount to €10,963 million and the backlog at September 30, 2008 stands at a record €19,041 million.
• Investments during the first nine months of 2008 total €1,459 million, versus €813 million the same period of 2007.
San Donato Milanese, October 29, 2008 The Board of Directors of Saipem S.p.A. today reviewed the Saipem Group's unaudited interim report at September 30, 2008.
(€ million) Q3 2007 (1) Q2 2008 Q3 2008 Q3 08
vs Q3 07
First nine months 2007 (1)
First nine months
2008
Sept.08 vs
Sept.07
2,440 2,383 2,642 8.3 Revenues 6,963 7,261 4.3.
231 259 286 23.8 Operating profit 625 775 24.0
146 174 189 29.5 Adjusted net profit 386 510 32.1
430 174 189 (56.0) Net profit 670 690 3.0
212 256 285 34.4 Adjusted cash flow 586 769 31.2
314 557 480 52.9 Capital expenditure 827 1,459 76.4
2,662 3,216 5,492 106.3 New contracts 7,443 10,963 47.3
(1) figures restated to reflect the effects of disposals of Camom, Haldor Topsøe and GTT and the classification of Fertinitro under "Net assets available for sale".
As previously stated, revenues and associated profit levels, particularly in the Offshore and Onshore sectors, and, to a lesser extent, in the Drilling sector, are not consistent over time, as they are influenced not only by market performance but also by climatic conditions and individual project schedules. Consequently, the results from any one particular fiscal period can vary significantly, thereby precluding a direct comparison with the same period in other fiscal years or extrapolation of figures from a single quarter to the entire year. Investments in the third quarter of 2008 amounted to €480 million (€314 million in the third quarter of 2007) mainly related to:
page 1 of 14

page 2 of 14
– €168 million in the Offshore sector relating to the construction of a new pipe lay vessel and a deep water field development ship, the conversion of a tanker into an FPSO unit due to operate for Sonangol in Angola, the development of a new fabrication yard in Indonesia, capex to strengthen the operating bases/yards in West Africa, Kazakhstan and Saudi Arabia, and maintenance and upgrading of the existing asset base;
– €101 million in the Offshore Drilling sector, relating to the construction of two semi-submersible rigs, an ultra deepwater drillship and two jack-ups, in addition to maintenance and upgrading of the existing asset base;
– €196 million in the Onshore Drilling sector for the upgrading of existing assets and the purchase/construction of thirteen rigs, for which long-term contracts have already been secured;
– €15 million in the Onshore sector for maintenance and upgrading of the existing asset base.
Investments in the first nine months of 2008 amounted to €1,459 million, versus €827 million in the first nine months of 2007. During the period, the contract for the construction of a Diving Support Vessel (as previously announced) was awarded to the Sekwang yard in Korea. Delivery of the vessel is expected for the fourth quarter of 2011. The total investment is estimated at €130 million. Disposal of non-core assets With regard to the negotiations underway for the sale of the 20% stake in the Venezuelan company Fertinitro, said company has distributed dividends, Saipem’s share of which totalled €20.6 million. Saipem received €9.1 million in the second quarter and €11.5 million in October, which were recognized as a reduction in the carrying value of the investment, under "Net assets available for sale". Net borrowings at September 30, 2008 amounted to €2,095 million, representing an increase of €401 million versus December 31, 2007, due to investments made during the first nine months of the year and the distribution of dividends, which were partly offset by cash flow from operations for the period, proceeds from the disposal of GTT and the improvement in working capital. New contracts and backlog During the third quarter of 2008, Saipem was awarded contracts amounting to €5,492 million (compared to €2,662 million in the third quarter of 2007). The most significant orders awarded in the third quarter include: Offshore:
– the Viking project for Conoco/Phillips, which involves the laying of a pipeline in the British sector of the North Sea.
Onshore: – the Arzew project for Sonatrach, which encompasses the EPC (engineering,
procurement and construction) of a single-train gas liquefaction (LNG) plant, with a capacity of 4.7 million tonnes of LNG per annum.
– the Manifa project for Saudi Aramco, which encompasses the engineering, procurement and construction of three gas/oil separation trains (GOSP), gas dehydration, crude inlet manifolds and the flare gas system.
Offshore Drilling: – the three-year charter of the semi-submersible drilling rig Scarabeo 7 by Eni; – the two-year charter of the semi-submersible drilling rig Scarabeo 3 by Addax
Petroleum;

page 3 of 14
– the one-year charter of the semi-submersible drilling rig Scarabeo 6 by Burullus Gas Company.
New contracts awarded to the Saipem Group during the first nine months of 2008 amounted to €10,963 million (€7,443 million in the same period of 2007). The backlog of the Saipem Group at September 30, 2008 stands at a record level of €19,041 million (€5,085 million in Offshore, €8,901 in Onshore, €5.055 in Drilling), of which €2,663 million are to be realised in the fourth quarter of 2008 and €7,363 million in 2009. Management expectations for 2008 and medium-term scenario The results achieved in the first nine months of the year and the positive development of the contracts currently under execution have prompted management to revise up its expectations for 2008. Adjusted net profit is now expected to increase by approximately 30% over the 2007 restated figure, while revenues are confirmed at approximately €10 billion and investments at approximately €1.9 billion. At the end of September 2008, the backlog stood at €19.0 billion, versus €15.4 billion at the beginning of the year, while October saw the Saipem group awarded additional orders amounting to approximately €2.2 billion. As a result, the target announced at the start of the year of increasing the order backlog has already been comfortably met, leading to improved visibility. With regard to medium-term expectations, it is still too early to be able to fully assess the impact on the Oil and Gas industry of the expected slowdown in the world economy. However, given that Saipem's clients are virtually all large national and international oil companies who indicated having approved their investments using conservative oil price scenarios, the risk of projects being suspended or cancelled would appear to be remote. In terms of future scenarios, our key Clients are of the opinion that oil prices will eventually stabilize at a level that will continue to make the development of large oil fields economically viable (i.e. fields in the Middle East, plus West Africa, the Caspian Sea area, Brazil and large frontier area fields in general.) The reasoning behind this conviction is that the Oil Industry has only just emerged from a period of underinvestment, and if oil prices were to create the conditions for a new period of underinvestment, the world economy would not have sufficient oil and gas availability, even considering the scenario of a significant economic slowdown. Saipem possesses an industrial model that includes engineering and construction expertise and has a track record that makes it particularly qualified for tackling complex projects in frontier areas that, while representing a challenge, possess sufficiently robust economics as to be compatible with a scenario of relatively low oil prices.

page 4 of 14
Article 36 of Consob Regulation on Markets: conditions for the listing of shares of companies with control over companies established and regulated under the law of non-EU countries. With regard to the recently published regulations setting out conditions for the listing of shares of companies with control over companies established and regulated under the law of non-EU countries that are deemed to be of material significance in relation to the consolidated financial statements: - at September 30, 2008 the following seven Saipem subsidiaries fall within the scope of
application of the regulation in question, namely: • Saudi Arabian Saipem Ltd • Snamprogetti Saudi Arabia Sdn • Saipem America Inc. • Saipem Asia Sdn Bhd • Saipem Contracting (Nigeria) Ltd • Saipem Contracting Algerie • Saipem Misr for Petroleum Services SAE
- procedures designed to ensure full compliance with article 36 have already been adopted;
Article 37 of Consob Regulation on Markets: conditions preventing the admission to trading on an Italian regulated market of the shares of subsidiaries subject to management and coordination by another company The Board of Directors has ascertained that the conditions preventing the admission to trading on an Italian regulated market of the shares of subsidiaries subject to management and coordination by another company, set out in article 37 of the Consob Regulation on Markets, do not apply to the Company. This press release containing the unaudited consolidated results of the third quarter of 2008 constitutes the Interim Report pursuant to article 154-ter of Law 58/98. Economic and financial data have been prepared in compliance with the valuation and measurement criteria set by the International Financial Reporting Standards (IFRS) issued by the International Accounting Standards Board (IASB) and adopted by the European Commission, in accordance with article 6 of EC Regulation No. 1606/2002 of the European Parliament and of the Council of 19 July 2002. Data pertaining to the income statement refers to the third quarter of 2007, the second and third quarters of 2008 and to the first nine months of 2007 and 2008. Balance sheet data refers to September 30, 2008 and December 31, 2007. The financial tables are presented in the same format as those contained in the six-month report and the annual Financial Report. Saipem’s Chief Financial Officer, Giulio Bozzini is the senior manager in charge of preparing the company's financial reports. He attests, pursuant to article 154 bis, paragraph 2, of Law 58/98, that the information contained in this press release fully matches the accounting records, books and entries. Forward-looking statements are based on a number of assumptions and expectations that could ultimately prove inaccurate, as they are subject to risks and variables outside the company’s control. These include: currency fluctuations, interest rate fluctuations, the level of capital expenditure in the oil and gas industry, as well as other industries, political instability in areas where the Group operates, and actions by competitors. Moreover, contract execution is also subject to variables outside the company's control, such as weather conditions. Actual results could therefore differ materially from the forward-looking statements.

page 5 of 14
Contact details Website: www.saipem.eni.it Switchboard: +39-025201 Shareholder Information: Saipem S.p.A., Via Martiri di Cefalonia, 67 - 20097 San Donato Milanese (MI), Italy Relations with institutional investors and financial analysts: Tel.: +39-02520.34653 Fax: +39-02520.54295 E-mail: [email protected]

page 6 of 14
Analysis by business sector Offshore:
(€ million)
Q3 2007 Q2 2008 Q3 2008 Q3 08
vs Q3 07
First nine months
2007
First nine months
2008
Sept.08 vs
Sept.07
908 885 1,027 13.1 Revenues 2,631 2,768 5.2
(754) (723) (839) 11.3 Expenses (2,207) (2,265) 2.6
(36) (42) (47) 30.6 Depreciation and amortisation
(109) (128) 17.4
118 120 (1) 141 19.5 Operating profit 315 375 (1) 19.0
17.0 18.3 18.3 EBITDA % 16.1 18.2 13.0 13.6 13.7 EBIT % 12.0 13.5
872 1,838 270 New contracts 2,753 3,689
(1) includes capital gain of €2 million from the sale of the FPSO vessel Mystras The backlog at September 30, 2008 amounted to €5,085 million, of which €1,050 million to be realised in the fourth quarter of 2008. Revenues for the first nine months of 2008 amount to €2,768 million, representing an
increase of over 5% compared with the same period of 2007, due to activities in North Africa and Kazakhstan.
Operating profit for the first nine months of 2008 amounted to €375 million, or 13.5% of
revenues, versus operating profit of €315 million for the same period of 2007, or 12% of revenues. The EBITDA margin was 18.2% versus 16.1% for the same period of 2007. This increase in margin is attributable to improved contract conditions and strong operational performance.
page 7 of 14
Onshore: (€ million)
Q3 2007 Q2 2008 Q3 2008 Q3 08
vs Q3 07
First nine months 2007 (1)
First nine months
2008
Sept.08 vs
Sept.07
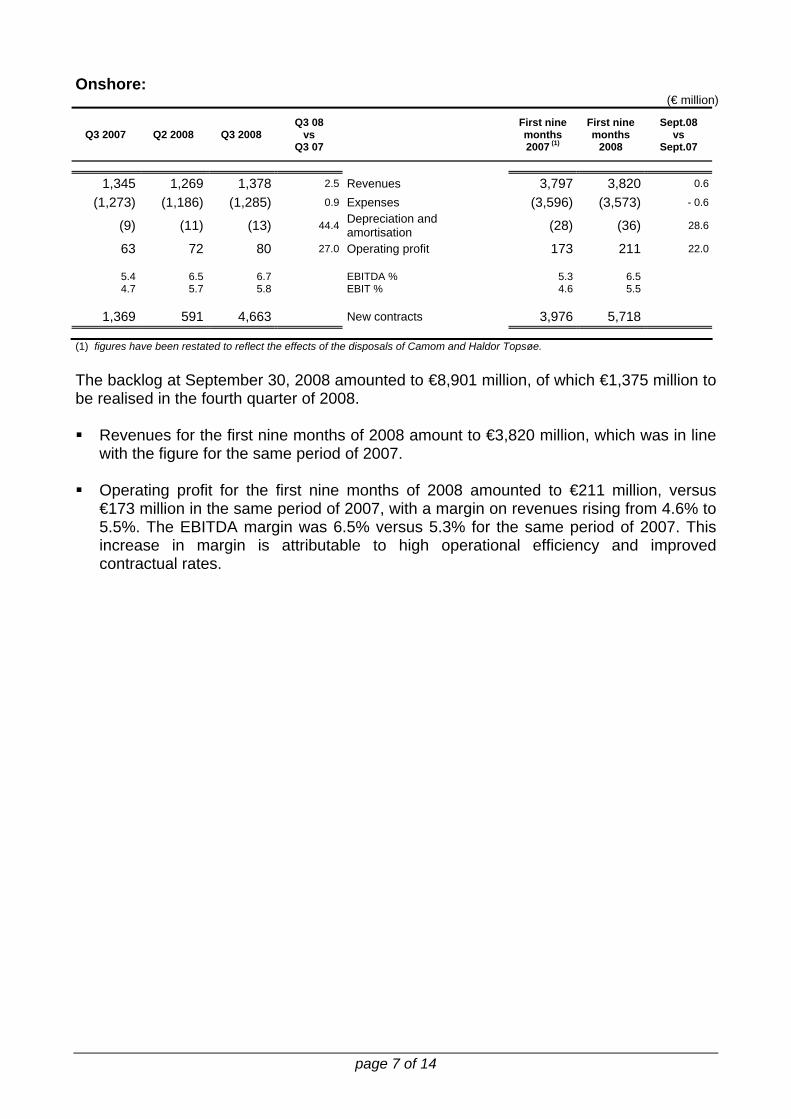
1,345 1,269 1,378 2.5 Revenues 3,797 3,820 0.6
(1,273) (1,186) (1,285) 0.9 Expenses (3,596) (3,573) - 0.6
(9) (11) (13) 44.4 Depreciation and amortisation (28) (36) 28.6
63 72 80 27.0 Operating profit 173 211 22.0
5.4 6.5 6.7 EBITDA % 5.3 6.5 4.7 5.7 5.8 EBIT % 4.6 5.5
1,369 591 4,663 New contracts 3,976 5,718
(1) figures have been restated to reflect the effects of the disposals of Camom and Haldor Topsøe. The backlog at September 30, 2008 amounted to €8,901 million, of which €1,375 million to be realised in the fourth quarter of 2008. Revenues for the first nine months of 2008 amount to €3,820 million, which was in line
with the figure for the same period of 2007. Operating profit for the first nine months of 2008 amounted to €211 million, versus
€173 million in the same period of 2007, with a margin on revenues rising from 4.6% to 5.5%. The EBITDA margin was 6.5% versus 5.3% for the same period of 2007. This increase in margin is attributable to high operational efficiency and improved contractual rates.
page 8 of 14
Offshore Drilling (€ million)
Q3 2007 Q2 2008 Q3 2008 Q3 08
vs Q3 07
First nine months
2007
First nine months
2008
Sept.08 vs
Sept.07
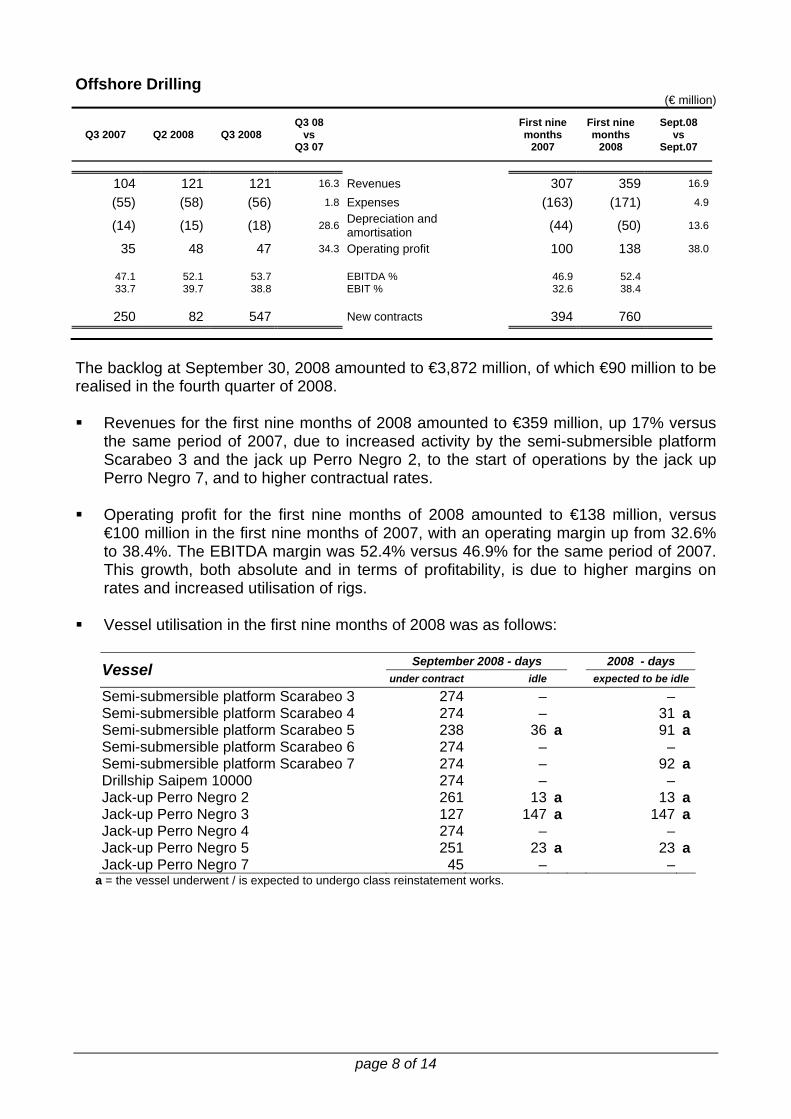
104 121 121 16.3 Revenues 307 359 16.9
(55) (58) (56) 1.8 Expenses (163) (171) 4.9
(14) (15) (18) 28.6 Depreciation and amortisation (44) (50) 13.6
35 48 47 34.3 Operating profit 100 138 38.0
47.1 52.1 53.7 EBITDA % 46.9 52.4 33.7 39.7 38.8 EBIT % 32.6 38.4
250 82 547 New contracts 394 760
The backlog at September 30, 2008 amounted to €3,872 million, of which €90 million to be realised in the fourth quarter of 2008. Revenues for the first nine months of 2008 amounted to €359 million, up 17% versus
the same period of 2007, due to increased activity by the semi-submersible platform Scarabeo 3 and the jack up Perro Negro 2, to the start of operations by the jack up Perro Negro 7, and to higher contractual rates.
Operating profit for the first nine months of 2008 amounted to €138 million, versus
€100 million in the first nine months of 2007, with an operating margin up from 32.6% to 38.4%. The EBITDA margin was 52.4% versus 46.9% for the same period of 2007. This growth, both absolute and in terms of profitability, is due to higher margins on rates and increased utilisation of rigs.
Vessel utilisation in the first nine months of 2008 was as follows:
September 2008 - days 2008 - days Vessel under contract idle expected to be idle
Semi-submersible platform Scarabeo 3 274 – – Semi-submersible platform Scarabeo 4 274 – 31 aSemi-submersible platform Scarabeo 5 238 36 a 91 aSemi-submersible platform Scarabeo 6 274 – – Semi-submersible platform Scarabeo 7 274 – 92 aDrillship Saipem 10000 274 – – Jack-up Perro Negro 2 261 13 a 13 aJack-up Perro Negro 3 127 147 a 147 aJack-up Perro Negro 4 274 – – Jack-up Perro Negro 5 251 23 a 23 aJack-up Perro Negro 7 45 – –
a = the vessel underwent / is expected to undergo class reinstatement works.

page 9 of 14
Onshore Drilling: (€ million)
Q3 2007 Q2 2008 Q3 2008 Q3 08
vs Q3 07
First nine months
2007
First nine months
2008
Sept.08 vs
Sept.07
83 108 116 39.8 Revenues 228 314 37.7
(61) (75) (80) 31.1 Expenses (172) (218) 26.7
(7) (14) (18) 157.1 Depreciation and amortisation (19) (45) 136.8
15 19 18 20.0 Operating profit 37 51 37.8
26.5 30.6 31.0 EBITDA % 24.6 30.6 18.1 17.6 15.5 EBIT % 16.2 16.2
171 705 12 New contracts 320 796
The backlog at September 30, 2008 amounted to €1,183 million, of which €148 million to be realised in the fourth quarter of 2008. Revenues for the first nine months of 2008 amounted to €314 million, representing a
37.7% increase compared to the same period of 2007, due mainly to the start of operations of new rigs in South America.
Operating profit for the first nine months of 2008 amounted to €51 million, versus €37
million in the first nine months of 2007, with an operating margin of 16.2%. The EBITDA margin was 30.6% versus 24.6% for the same period of 2007. This growth, both in absolute terms and in terms of profitability, is due to higher margins on rates.
Average utilisation of rigs in the period was 99% (97% in the same period of 2007).
Rigs were located as follows: 22 in Venezuela, 13 in Peru, 10 in Saudi Arabia, 7 in Algeria, 3 in Brazil, 3 in Kazakhstan, 2 in Italy, 1 in Trinidad & Tobago, 1 in Ecuador and 1 in Egypt. In addition, 5 third-party rigs were deployed in Peru, 3 by the joint-venture company SaiPar and 2 in Kazakhstan.
Attachments: - Reclassified consolidated balance sheet, consolidated income statements
reclassified by nature and function of expenses, reclassified statement of cash flow and net borrowings.
- The data used for restatement purposes following the disposals of Camom, Haldor Topsøe and GTT, and the reclassification of Fertinitro to “Net assets available for disposal”.

page 10 of 14
RECLASSIFIED CONSOLIDATED BALANCE SHEET
(€ million)
December 31, 2007 September 30, 2008 Net tangible assets 3,562 4,685Net intangible assets 750 749 4,312 5,434- Offshore 2,114 2,483 - Onshore 484 485 - Offshore Drilling 1,395 1,886 - Onshore Drilling 319 580 Investments 47 39Fixed assets 4,359 5,473 Net working capital (*) (402) (520) Net assets held for sale including related net borrowings 203 80 Provision for employee benefits (167) (174) CAPITAL EMPLOYED, NET 3,993 4,859 Shareholders’ equity 2,295 2,754 Minority interest 4 10 Net borrowings 1,694 2,095 Total liabilities and shareholders’ equity 3,993 4,859 Leverage (net borrowings/shareholders’ equity)
0.74 0.76
SHARES ISSUED AND OUTSTANDING 441,410,900 441,410,900 (*) of which advances from Clients 351 705

page 11 of 14
CONSOLIDATED INCOME STATEMENT RECLASSIFIED BY
NATURE OF EXPENSES
(€ million)
First Nine Months third quarter 2007 (*)
second quarter
2008
third quarter
2008 2007 (*) 2008
2,440 2,383 2,642 Operating revenues 7,175 7,261
3 (**) 4 2 Other income and revenues 8 (**) 9
(1,842) (1,711) (1,946) Purchases, services and other costs (5,362) (5,247)
(304) (335) (316) Payroll and related costs (976) (989)
297 341 382 GROSS OPERATING PROFIT 845 1,034
(66) (82) (96) Depreciation, amortisation, and write-downs (205) (259)
231 259 286 OPERATING PROFIT 640 775
(25) (24) (23) Finance expenses (82) (72)
11 (***) 8 4 Income from investments 39 (***) 14
217 243 267 INCOME BEFORE INCOME TAXES 597 717
(63) (66) (75) Income taxes (174) (201)
154 177 192 INCOME BEFORE MINORITY INTEREST 423 516
– (3) (3) Minority interest (1) (6)
154 174 189 ADJUSTED NET PROFIT 422 510
290 – – Capital gain from the disposal of non-core assets 290 185
(6) – – Taxation (6) (5)
438 174 189 NET PROFIT 706 690
504 256 285 CASH FLOW (Net profit + Depreciation and amortisation) 911 949
(*) data not restated (**) includes capital gain of Euro 2 million from the sale of the FPSO vessel Mystras (***) includes Euro 5 million relating to the capital gain from the sale of a minority interest and the conclusion of a project implemented by a special purpose entity consolidated using the equity method.

page 12 of 14
CONSOLIDATED INCOME STATEMENT RECLASSIFIED
BY FUNCTION OF EXPENSES
(€ million)
First Nine Months third quarter 2007 (*)
second quarter
2008
third quarter
2008 2007 (*) 2008
2,440 2,383 2,642 Operating revenues 7,175 7,261
(2,126) (2,035) (2,270) Production costs (6,261) (6,221)
(11) (9) (7) Idle costs (33) (31)
(21) (28) (27) Selling expenses (80) (83)
(4) (3) (3) Research and development costs (17) (9)
(3) (**) (3) (4) Other operating expenses, net (5) (**) (5)
275 305 331 CONTRIBUTION FROM OPERATIONS 779 912
(44) (46) (45) General and administrative expenses (139) (137)
231 259 286 OPERATING PROFIT 640 775
(25) (24) (23) Finance expenses (82) (72)
11 (***) 8 4 Income from investments 39 (***) 14
217 243 267 INCOME BEFORE INCOME TAXES 597 717
(63) (66) (75) Income taxes (174) (201)
154 177 192 INCOME BEFORE MINORITY INTEREST 423 516
– (3) (3) Minority interest (1) (6)
154 174 189 ADJUSTED NET PROFIT 422 510
290 – – Capital gain from the disposal of non-core assets 290 185
(6) – – Taxation (6) (5)
438 174 189 NET PROFIT 706 690
504 256 285 CASH FLOW (Net profit + Depreciation and amortisation) 911 949
(*) data not restated (**) includes capital gain of Euro 2 million from the sale of the FPSO vessel Mystras (***) includes Euro 5 million relating to the capital gain from the sale of a minority interest and the conclusion of a project implemented by a special purpose entity consolidated using the equity method.
page 13 of 14
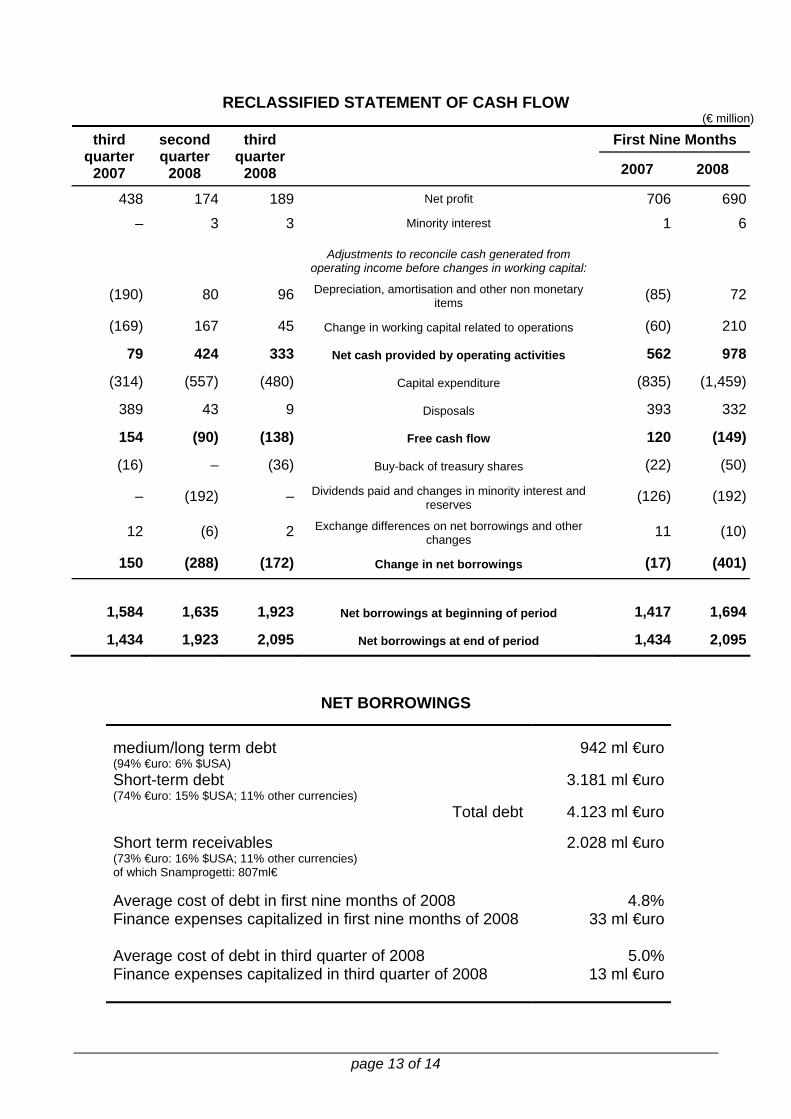
RECLASSIFIED STATEMENT OF CASH FLOW (€ million)
First Nine Months third quarter
2007
second quarter
2008
third quarter
2008 2007 2008
438 174 189 Net profit 706 690
– 3 3 Minority interest 1 6
Adjustments to reconcile cash generated from operating income before changes in working capital:
(190) 80 96 Depreciation, amortisation and other non monetary items (85) 72
(169) 167 45 Change in working capital related to operations (60) 210
79 424 333 Net cash provided by operating activities 562 978
(314) (557) (480) Capital expenditure (835) (1,459)
389 43 9 Disposals 393 332
154 (90) (138) Free cash flow 120 (149)
(16) – (36) Buy-back of treasury shares (22) (50)
– (192) – Dividends paid and changes in minority interest and reserves (126) (192)
12 (6) 2 Exchange differences on net borrowings and other changes 11 (10)
150 (288) (172) Change in net borrowings (17) (401)
1,584 1,635 1,923 Net borrowings at beginning of period 1,417 1,694
1,434 1,923 2,095 Net borrowings at end of period 1,434 2,095
NET BORROWINGS
medium/long term debt (94% €uro: 6% $USA)
942 ml €uro
Short-term debt (74% €uro: 15% $USA; 11% other currencies)
3.181 ml €uro
Total debt 4.123 ml €uro Short term receivables (73% €uro: 16% $USA; 11% other currencies) of which Snamprogetti: 807ml€
2.028 ml €uro
Average cost of debt in first nine months of 2008 4.8%Finance expenses capitalized in first nine months of 2008 33 ml €uro Average cost of debt in third quarter of 2008 5.0%Finance expenses capitalized in third quarter of 2008 13 ml €uro

page 14 of 14
DATA PERTAINING TO CAMOM, HALDOR TOPSØE, GTT AND FERTINITRO ELIMINATED FROM COMPARATIVE DATA FOR RESTATEMENT PURPOSES
(€ million)
first half 2007
third quarter
2007
first nine months
2007 2007
212 – Revenues 212 212
15 – Operating profit 15 15
28 8 Net profit 36 45
33 8 Cash flow 41 50
8 – Capital expenditure 8 8
166 – New contracts 166 166

Approved by the Board of Directorsat their meeting of October 29, 2008
Saipem is a subsidiary of Eni SpA


