15
INTERIM REPORT (THREE MONTHS) 31 MARCH 2019

INTERIM REPORT
(THREE MONTHS)
31 MARCH 2019

G r a c e K e n n e d y L i m i t e d | I n t e r i m R e p o r t M a r c h 2 0 1 9 2
GraceKennedy Limited
INTERIM REPORT TO OUR STOCKHOLDERS For the three months ended March 31, 2019, the GraceKennedy Group achieved revenues of J$25.9 billion, representing
an increase of 4.1% or J$1.0 billion over the corresponding period of 2018. Net profit after tax for the period was J$1.0
billion, representing a decline of 22.6% or J$296.3 million compared with 2018. Net profit attributable to stockholders
was J$897.0 million, 24.9% or J$297.3 million lower than that of the corresponding period of 2018. Profit before other
income for the period was J$885.1 million, 24.3% or J$173.1 million higher than that of the corresponding period in 2018,
indicating an improved operating margin. Performance was therefore ahead of plan, notwithstanding that profit for the
quarter was below the corresponding period in the prior year. The Group expects to meet its target and achieve improved
operating performance. Earnings per stock unit for the period was J$0.90 (Q1 2018: J$1.20). GraceKennedy has declared
an interim dividend of J$0.40 per stock unit, which is payable to shareholders on June 14.
Stockholders will recall that the GraceKennedy Group is a net earner of foreign exchange and has net foreign assets, whose
values are subject to movements in foreign currency exchange rates. During the first three months of 2019, the volatility
in the Jamaican foreign exchange market, particularly in the US Dollar exchange rate had a significant, negative effect on
the Group’s results.
Over the three month period, shareholders’ equity increased by J$1.1 billion to J$45.7 billion, which resulted in a book
value per share of J$46.06. On the adoption of IFRS 16: Leases, on January 1, 2019, the Group recognized a right-of-use
asset of approximately J$6.4B shown in fixed assets, with a corresponding amount being recognized as a lease liability
shown in bank and other loans.
The Food Trading segment recorded improved revenue but profitability declined when compared to the corresponding
period of 2018. This was due, primarily to the performance of Grace Foods UK Limited (GFUK) and the delay in the start
of production at our manufacturing plant at Denbigh, Clarendon in Jamaica that impacted supplies. GFUK was negatively
affected by a decline in sales, compared to the same period in the prior year. GFUK will be relaunching Nurishment with
new labels on our canned format and the addition of new packaging, from which we expect to see improved performance.
The successful performance of the range of Grace Chips will be used as a springboard for new products designed to move
the Grace brand from the “World Food” to the “Mainstream” aisle in UK supermarkets.
Increased revenue for GraceKennedy Foods (USA) LLC stemmed from growth in both the Grace Brand and the Third Party
brand portfolio of 6%. The expanded distribution of the range of Grace chicken wings, has contributed positively to this
performance. Grace Patties continue to show exceptional growth and exceeded Q1 2018 performance by over 200%.
Our Jamaican foods business experienced growth in most of our key products. The main consumer promotion for the year,
“Grace Winna House” was launched in January 2019 and will run until May 2019. Brand building remains a major objective
of the business as we focus on further engaging with millennials, while continuing to satisfy the needs of our current
consumer base. Our Jamaican chain of supermarkets, Hi-Lo Foods Stores continued to experienced recovery in sales and
customer count. Renovation of our stores will continue with focus on our Cross Roads location. World Brands Services
Limited reported improved performance partly attributable to the expansion of the van sales fleet in 2018. It is expected
that four additional routes will be added during 2019. Our recent investment in Catherine’s Peak Bottling Company Limited
also contributed positively to the profitability of the division. Consumer Brands Limited continues to perform well.

G r a c e K e n n e d y L i m i t e d | I n t e r i m R e p o r t M a r c h 2 0 1 9 3
The GraceKennedy Financial Group (GKFG) reported marginal growth in revenues over the corresponding period in 2018.
The Banking and Investments segment reported an increase in pre-tax profit compared to the corresponding period in
2018. First Global Bank Limited (FGB) reported increased profitability and growth in its loan portfolio, driven in part by
the automation of elements of the loan process, facilitating improved turnaround times and efficiencies. GK Capital Limited
(GKCM) continued to grow, building on its strong 2018 performance. This positive growth has been buoyed by a strong
Q1 market presence with GKCM climbing to second in Jamaica Stock Exchange trading volumes. GKCM’s investment
banking unit continued to perform positively after raising over J$1 billion in fixed income financing for clients during the
quarter.
The Insurance segment reported strong growth in revenue. Allied Insurance Brokers Limited (AIB) remains the leading
insurance broker and celebrated its 50th anniversary in April 2019. AIB’s core revenue continues to grow year over year.
GK General Insurance Company Limited ended the first quarter with strong performance in revenues against prior year
period. In particular, the core business performed well with steady growth in the motor portfolio, supported by an increase
in quotations and revenue on our online platform, “GKGOnline”. The commercial portfolio showed growth driven primarily
by strong account retention and growth in new business.
Performance in the Money Services segment was impacted by a decline in remittance transaction volumes and volatility
in the foreign exchange market. GraceKennedy Money Services (GKMS) has worked closely with our strategic partner,
Western Union, to develop an enhanced compliance programme. The temporary reduction in transaction volumes is due
to the ongoing implementation of the enhanced compliance measures, however it is anticipated that the increased
oversight, for the protection of our customers, will be a competitive advantage through a stronger network of agencies.
Performance was positively impacted by growth in the Bahamas markets, the most recent addition to our money services
operation within the Caribbean region.
The Money Services segment continued to focus on providing a wide range of innovative solutions to meet our customers’
needs across the Caribbean. In January 2019 GKMS launched the Western Union app in Jamaica. This will increase the
ease with which customers can move money within Jamaica and from Jamaica to more than 200 countries and territories.
The use of WU.com continues to show growth with volumes in March 2019 surpassing prior month and being the highest
recorded since its launch. In keeping with our strategic focus on increased customer centricity and efficiency through
innovation, GKMS, in collaboration with Western Union, successfully completed the pilot of a new money transfer service
allowing for direct to bank settlement of incoming funds. We expect that the commercial launch of this service will enhance
our value proposition by providing increased convenience to customers receiving monies from overseas. We are
determined to establish and maintain strong measures, the right processes, technology and infrastructure to strengthen
this business.
GraceKennedy Limited was pleased to announce the appointment of Andrew Messado, Group Chief Financial Officer, to
its Board of Directors effective April 1, 2019. A Fellow and Lifetime Member of the Institute of Chartered Accountants of
Jamaica, (ICAJ), Andrew has served the GraceKennedy Group for over 20 years in various positions, the most recent being
his distinguished service as Group Comptroller.
The construction of GraceKennedy Limited’s new headquarters is complete. The building’s retail center will include a Hi-
Lo Foods Express Store and a GKOne location which will provide access to affordable financial products and services
including remittance, bill payment, and micro lending insurance and commercial banking. The Group remains committed
to the development of Downtown Kingston and has invested over J$3 billion in this project that brings together the Group’s
executive office, financial services division and money services group.

G r a c e K e n n e d y L i m i t e d | I n t e r i m R e p o r t M a r c h 2 0 1 9 4
We would like to thank our shareholders, employees and customers for their support and commitment. Even in this
constantly changing operating environment, we remain focused on our goal to create an agile, efficient and successful
company as we seek to realize our vision of becoming a Global Consumer Group, guided always by our core principles of
Honesty, Integrity and Trust.
Gordon V. Shirley, O.J. Donald G. Wehby, C.D.
Chairman Group Chief Executive Officer
May 9, 2019

G r a c e K e n n e d y L i m i t e d | I n t e r i m R e p o r t M a r c h 2 0 1 9 5
GraceKennedy Limited
CONSOLIDATED INCOME STATEMENT
THREE MONTHS ENDED 31 MARCH 2019
(Unaudited)
3 months to 3 months to
3/31/2019 3/31/2018
$'000) $'000)
Revenue from products and services 24,927,991 23,886,054
Interest revenue 1,000,846 1,024,010
Revenues (Note 2) 25,928,837 24,910,064
Direct and operating expenses (24,984,573) (24,121,439)
Net impairment losses on financial assets (59,174) (76,612)
Expenses (25,043,747) (24,198,051)
Profit before other income 885,090 712,013
Other income 314,251 733,805
Profit from Operations 1,199,341 1,445,818
Interest income – non-financial services 97,611 100,635
Interest expense – non-financial services (230,575) (143,829)
Share of results of associates and joint ventures 254,567 259,924
Profit before Taxation 1,320,944 1,662,548
Taxation (303,817) (349,135)
Net Profit for the period 1,017,127 1,313,413
Profit attributable to:
Owners of GraceKennedy Limited 897,048 1,194,389
Non-controlling interests 120,079 119,024
1,017,127 1,313,413
Earnings per Stock Unit for profit attributable to the
owners of the company during the period:
(expressed in $ per stock unit):
Basic $0.90 $1.20
Diluted $0.90 $1.20

G r a c e K e n n e d y L i m i t e d | I n t e r i m R e p o r t M a r c h 2 0 1 9 6
GraceKennedy Limited
CONSOLIDATED STATEMENT OF COMPREHENSIVE INCOME
THREE MONTHS ENDED 31 MARCH 2019
(Unaudited)
3 months to 3 months to
3/31/2019 3/31/2018
$'000) $'000)
Profit for the period 1,017,127 1,313,413
Other comprehensive income:
Items that will not be reclassified to profit or loss:
Losses on revaluation of land and buildings (191) -
Changes in fair value of equity instruments at fair value through other comprehensive income 228,888 (16,638)
Remeasurements of post-employment benefit obligations (186,208) (172,451)
Share of other comprehensive income of associates and joint ventures (5,587) -
36,902 (189,089)
Items that may be subsequently reclassified to profit or loss:
Foreign currency translation adjustments 34,521 154,254
Changes in fair value of debt instruments at fair value through other comprehensive income 153,997 (113,924)
Share of other comprehensive income of associates and joint ventures (12,507) 7,255
176,011 47,585
Other comprehensive income for the period, net of tax 212,913 (141,504)
TOTAL COMPREHENSIVE INCOME FOR THE PERIOD 1,230,040 1,171,909
Total comprehensive income attributable to:
Owners of GraceKennedy Limited 1,116,595 1,049,634
Non-controlling interests 113,445 122,275
1,230,040 1,171,909

G r a c e K e n n e d y L i m i t e d | I n t e r i m R e p o r t M a r c h 2 0 1 9 7
GraceKennedy Limited
CONSOLIDATED STATEMENT OF FINANCIAL POSITION
31 MARCH 2019
(Unaudited)
March 31 December 31 March 31 2019 2018 2018 $'000 $'000 $'000
ASSETS
Cash and deposits 10,585,005 14,824,799 12,860,573
Investment securities 31,125,465 28,261,306 30,313,379
Pledged assets 8,548,389 9,931,362 6,017,582
Receivables 17,824,063 15,226,423 17,003,080
Inventories 12,009,726 12,784,061 10,537,575
Loans receivable 26,604,905 26,469,557 25,587,100
Taxation recoverable 769,974 764,826 613,684
Investments in associates and joint ventures 3,202,050 2,964,841 2,108,291
Investment properties 628,000 628,000 618,000
Intangible assets 4,013,254 4,128,043 4,293,373
Fixed assets 20,916,017 14,300,969 12,008,168
Deferred tax assets 1,576,931 1,410,080 1,099,510
Pension plan asset 2,844,238 3,269,925 6,076,297
Assets classified as held for sale 296,501 271,208 -
Total Assets 140,944,518 135,235,400 129,136,612
LIABILITIES
Deposits 33,593,089 34,371,026 34,173,105
Securities sold under agreements to repurchase 6,833,068 7,208,337 5,022,614
Bank and other loans 23,889,025 16,529,313 14,073,985
Payables 21,153,786 23,201,686 21,688,618
Taxation 534,327 464,890 331,554
Deferred tax liabilities 789,029 687,069 1,207,949
Other post-employment obligations 6,214,733 6,083,687 5,339,148
Total Liabilities 93,007,057 88,546,008 81,836,973
EQUITY
Capital & reserves attributable to the company's owners
Share capital 548,995 490,354 546,068
Capital and fair value reserves 6,697,283 6,346,838 5,390,938
Retained earnings 33,062,776 32,306,560 32,803,589
Banking reserves 3,120,711 3,118,867 3,044,111
Other reserves 2,319,286 2,351,808 3,606,845
45,749,051 44,614,427 45,391,551
Non-Controlling Interests 2,188,410 2,074,965 1,908,088
Total Equity 47,937,461 46,689,392 47,299,639
Total Equity and Liabilities 140,944,518 135,235,400 129,136,612
Approved for issue by the Board of Directors on 9 May 2019 and signed on its behalf by:

G r a c e K e n n e d y L i m i t e d | I n t e r i m R e p o r t M a r c h 2 0 1 9 8
GraceKennedy Limited
CONSOLIDATED STATEMENT OF CHANGES IN EQUITY
THREE MONTHS ENDED 31 MARCH 2019
(Unaudited) Non-) Attributable to owners of the company controlling) Total) interests) Equity)
Capital and)
No. of) Share) Fair Value) Retained) Banking) Other)
Shares) Capital) Reserve) Earnings) Reserves) Reserves) Total)
'000) $'000) $'000) $'000) $'000) $'000) $'000) $'000) $'000)
Balance at 1 January 2018 992,654 540,951 5,483,796 31,818,489 3,044,111 3,428,449 44,315,796 1,785,813 46,101,609
Profit for the period - - - 1,194,389 - - 1,194,389 119,024 1,313,413
Other comprehensive income for the period
- - (130,562) (172,451) - 158,258 (144,755) 3,251 (141,504)
Total comprehensive income for the period
- - (130,562) 1,021,938 - 158,258 1,049,634 122,275 1,171,909
Transactions with owners:
Share-based payments - - - - - 26,121 26,121 - 26,121
Transfer of treasury shares to employees
139 5,117 866 - - (5,983) - - -
Total transactions with owners 139 5,117 866 - - 20,138 26,121 - 26,121
Transfers between reserves:
To capital reserves - - 36,838 (36,838) - - - - -
Balance at 31 March 2018 992,793 546,068 5,390,938 32,803,589 3,044,111 3,606,845 45,391,551 1,908,088 47,299,639
Balance at 1 January 2019 991,865 490,354 6,346,838 32,306,560 3,118,867 2,351,808 44,614,427 2,074,965 46,689,392
Profit for the period - - - 897,048 - - 897,048 120,079 1,017,127
Other comprehensive income for the period
- - 377,107 (186,208) - 28,648 219,547 (6,634) 212,913
Total comprehensive income for the period
- - 377,107 710,840 - 28,648 1,116,595 113,445 1,230,040
Transactions with owners:
Sale of treasury shares 48 2,876 - - - - 2,876 - 2,876
Share-based payments charged - - - - - 33,384 33,384 - 33,384
Share-based payments exercised - - - - - (18,231) (18,231) - (18,231)
Transfer of treasury shares to employees
1,282 55,765 20,558 - - (76,323) - - -
Total transactions with owners 1,330 58,641 20,558 - - (61,170) 18,029 - 18,029
Transfers between reserves:
From capital reserves - - (47,220) 47,220 - - - - -
To banking reserves - - - (1,844) 1,844 - - - -
Balance at 31 March 2019 993,195 548,995 6,697,283 33,062,776 3,120,711 2,319,286 45,749,051 2,188,410 47,937,461

G r a c e K e n n e d y L i m i t e d | I n t e r i m R e p o r t M a r c h 2 0 1 9 9
GraceKennedy Limited
CONSOLIDATED STATEMENT OF CASH FLOWS
THREE MONTHS ENDED 31 MARCH 2019
(Unaudited) 3/31/2019 3/31/2018
$'000) $'000)
SOURCES/(USES) OF CASH:
Operating Activities (Note 3) (2,983,806) 4,024,353
Financing Activities
Loans received 1,979,488 910,761
Loans repaid (1,695,689) (1,447,574)
Sale of treasury shares 2,876 -
Exercise of share based payments (18,231) -
Interest paid – non financial services (261,933) (141,694)
6,511 (678,507)
Investing Activities
Additions to fixed assets (748,124) (526,621)
Proceeds from disposal of fixed assets 5,293 10,458
Additions to investments (1,416,659) (1,707,135)
Cash outflow on purchase of interest in associates and joint ventures - (43,000)
Proceeds from sale of investments 45,617 1,498,334
Additions to intangibles (24,970) (12,067)
Interest received – non financial services 193,987 122,327
(1,944,856) (657,704)
(Decrease)/increase in cash and cash equivalents (4,922,151) 2,688,142
Cash and cash equivalents at beginning of year 12,278,198 9,402,295
Exchange and translation (losses)/gains on net foreign cash balances (25,521) 64,225
CASH AND CASH EQUIVALENTS AT END OF PERIOD 7,330,526 12,154,662
G r a c e K e n n e d y L i m i t e d | I n t e r i m R e p o r t M a r c h 2 0 1 9 10
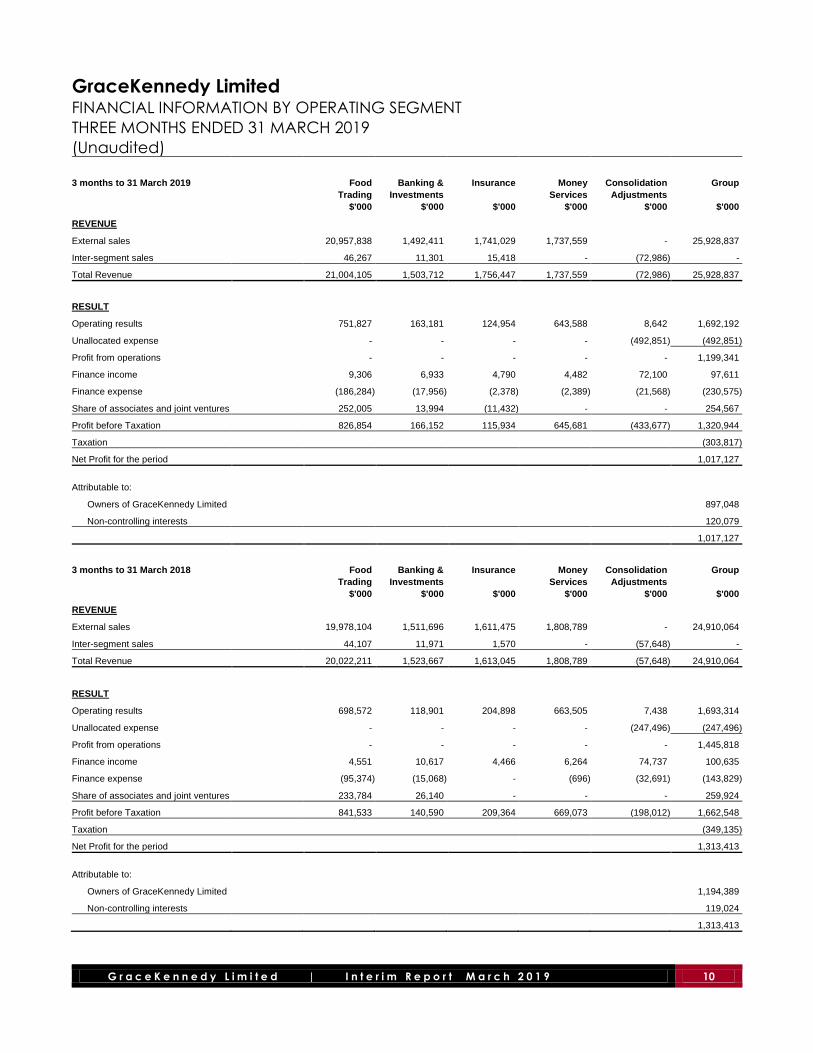
GraceKennedy Limited
FINANCIAL INFORMATION BY OPERATING SEGMENT
THREE MONTHS ENDED 31 MARCH 2019
(Unaudited)
3 months to 31 March 2019 Food) Banking &) Insurance) Money) Consolidation) Group)
Trading) Investments) Services) Adjustments)
$'000) $'000) $'000) $'000) $'000) $'000)
REVENUE
External sales 20,957,838 1,492,411 1,741,029 1,737,559 - 25,928,837
Inter-segment sales 46,267 11,301 15,418 - (72,986) -
Total Revenue 21,004,105 1,503,712 1,756,447 1,737,559 (72,986) 25,928,837
RESULT
Operating results 751,827 163,181 124,954 643,588 8,642 1,692,192
Unallocated expense - - - - (492,851) (492,851)
Profit from operations - - - - - 1,199,341
Finance income 9,306 6,933 4,790 4,482 72,100 97,611
Finance expense (186,284) (17,956) (2,378) (2,389) (21,568) (230,575)
Share of associates and joint ventures 252,005 13,994 (11,432) - - 254,567
Profit before Taxation 826,854 166,152 115,934 645,681 (433,677) 1,320,944
Taxation (303,817)
Net Profit for the period 1,017,127
Attributable to:
Owners of GraceKennedy Limited 897,048
Non-controlling interests 120,079
1,017,127
3 months to 31 March 2018 Food) Banking &) Insurance) Money) Consolidation) Group)
Trading) Investments) Services) Adjustments)
$'000) $'000) $'000) $'000) $'000) $'000)
REVENUE
External sales 19,978,104 1,511,696 1,611,475 1,808,789 - 24,910,064
Inter-segment sales 44,107 11,971 1,570 - (57,648) -
Total Revenue 20,022,211 1,523,667 1,613,045 1,808,789 (57,648) 24,910,064
RESULT
Operating results 698,572 118,901 204,898 663,505 7,438 1,693,314
Unallocated expense - - - - (247,496) (247,496)
Profit from operations - - - - - 1,445,818
Finance income 4,551 10,617 4,466 6,264 74,737 100,635
Finance expense (95,374) (15,068) - (696) (32,691) (143,829)
Share of associates and joint ventures 233,784 26,140 - - - 259,924
Profit before Taxation 841,533 140,590 209,364 669,073 (198,012) 1,662,548
Taxation (349,135)
Net Profit for the period 1,313,413
Attributable to:
Owners of GraceKennedy Limited 1,194,389
Non-controlling interests 119,024
1,313,413

G r a c e K e n n e d y L i m i t e d | I n t e r i m R e p o r t M a r c h 2 0 1 9 11
GraceKennedy Limited INTERIM CONSOLIDATED FINANCIAL STATEMENTS
31 MARCH 2019
Notes
1. Accounting Policies
(a) Basis of preparation
This condensed consolidated interim financial report for the reporting period ended 31 March 2019
has been prepared in accordance with Accounting Standard IAS 34 ‘Interim Financial Reporting’.
These financial statements are presented in Jamaican dollars unless otherwise indicated.
The accounting policies followed in these interim financial statements are consistent with those of
the previous financial year and corresponding interim reporting period, except for the adoption of
IFRS 16 ‘Leases’, which became effective 1 January 2019. The impact of adopting the new
standards are shown in Note 4.
New standards effective in the current year
IFRS 16, ‘Leases’
The Group has adopted IFRS 16 from 1 January 2019, and has not restated comparatives for the 2018
reporting period, as permitted under the specific transitional provisions in the standard in applying
the simplified transition approach. The reclassifications and the adjustments arising from the new
leasing rules are therefore recognised in the opening balance sheet on 1 January 2019.
This standard sets out the principles for the recognition, measurement, presentation and disclosure
of leases. It replaces the guidance in IAS 17, which made a distinction in classification between
leases that transfer substantially all the risks and rewards incidental to ownership of an underlying
asset (finance leases) and those that do not (operating leases). For a lessee, finance leases were
recognised as an asset that was depreciated over the lease term and the amount due to the lessor
recognised as borrowings. While operating leases were recognised as a periodic rental payment
that was treated as a current expense in the income statement.
IFRS 16 introduces a single lease accounting model for lessees. It requires lessees to recognise a lease
liability reflecting future lease payments and a “right-of-use asset” for virtually all lease contracts. The
standard includes an optional exemption for certain short-term leases and leases of low-value assets.
For lessors, the accounting stays almost the same.
Accounting policy effective 1 January 2019
From 1 January 2019, leases are recognised as a right-of-use asset and a corresponding liability at
the date at which the leased asset is available for use by the Group. Each lease payment is allocated
between the liability and finance cost. The finance cost is charged to profit or loss over the lease
period so as to produce a constant periodic rate of interest on the remaining balance of the liability
for each period. The right-of-use asset is depreciated over the shorter of the asset's useful life and the
lease term on a straight-line basis.

G r a c e K e n n e d y L i m i t e d | I n t e r i m R e p o r t M a r c h 2 0 1 9 12
1. Accounting Policies (continued)
(a) Basis of preparation
IFRS 16, ‘Leases’ (continued)
Assets and liabilities arising from a lease are initially measured on a present value basis. Lease
liabilities include the net present value of the following lease payments:
Fixed payments (including in-substance fixed payments), less any lease incentives receivable
Variable lease payments that are based on an index or a rate
Amounts expected to be payable by the lessee under residual value guarantees
The exercise price of a purchase option if the lessee is reasonably certain to exercise that option,
and
Payments of penalties for terminating the lease, if the lease term reflects the lessee exercising
that option.
The lease payments are discounted using the interest rate implicit in the lease. If that rate cannot be
determined, the lessee’s incremental borrowing rate is used, being the rate that the lessee would
have to pay to borrow the funds necessary to obtain an asset of similar value in a similar economic
environment with similar terms and conditions.
Right-of-use assets are measured at cost comprising the following:
The amount of the initial measurement of lease liability
Any lease payments made at or before the commencement date less any lease incentives
received
Any initial direct costs, and
Restoration costs.
(b) Segment reporting
The principal activities of the company, its subsidiaries, associates and joint ventures (the Group) are
as follows:
Food Trading – Merchandising of general goods and food products, both locally and
internationally; processing and distribution of food products; and the operation of a chain of
supermarkets.
Banking and Investment – Commercial banking; stock brokerage; corporate finance; advisory
services; and lease financing.
Insurance – General insurance and insurance brokerage.
Money Services – Operation of money transfer services; cambio operations and bill payment
services.
2. Revenues
Revenues for the Group can be disaggregated as follows:
2019 2018
$'000 $'000
Timing of revenue recognition from contracts with customers
Goods and services transferred at a point in time 23,483,194 22,529,748
Services transferred over time 30,307 37,837
Revenue from insurance contracts 1,414,490 1,318,469
Interest revenue 1,000,846 1,024,010
25,928,837 24,910,064

G r a c e K e n n e d y L i m i t e d | I n t e r i m R e p o r t M a r c h 2 0 1 9 13
3. Cash Flows from Operating Activities
Reconciliation of net profit to cash generated from operating activities:
3/31/2019 3/31/2018
$'000) $'000)
Net profit 1,017,127 1,313,413
Items not affecting cash:
Depreciation 524,618 270,457
Amortisation 136,429 185,907
Change in value of investments (22,780) (16,117)
Gain on disposal of fixed assets (2,874) (6,682)
Share-based payments 33,384 26,121
Exchange loss/(gain) on foreign balances 115,396 (83,939)
Interest income – non financial services (97,611) (100,635)
Interest income – financial services (1,067,476) (1,107,122)
Interest expense – non financial services 230,575 143,829
Interest expense – financial services 187,382 215,635
Taxation expense 303,817 349,135
Unremitted equity income in associates and joint ventures (254,567) (259,924)
Pension plan surplus 177,410 82,072
Other post-employment obligations 131,046 129,696
1,411,876 1,141,846
Changes in working capital components:
Inventories 774,335 715,565
Receivables (2,597,641) (1,229,772)
Loans receivable, net (165,672) 1,549,428
Payables (2,047,900) (665,603)
Deposits (553,887) 510,112
Securities sold under repurchase agreements (350,973) 1,188,705
(3,529,862) 3,210,281
Interest received – financial services 1,096,186 1,241,566
Interest paid – financial services (152,751) (236,447)
Translation gains 55,474 79,821
Taxation paid (452,853) (270,868)
Net cash (used in)/provided by operating activities (2,983,806) 4,024,353
Reconciliation of movements of liabilities to cash flows arising from financing activities:
Amounts represent bank and other loans, excluding bank overdrafts
3/31/2019 3/31/2018
$'000) $'000)
At beginning of year 13,982,712 13,833,665
Effect of adopting IFRS 16 6,384,074 -
Loans received 1,979,488 910,761
Loans repaid (1,695,689) (1,447,574)
Foreign exchange adjustments 15,737 83,265
Net interest movements (31,776) (12,043)
At end of period 20,634,546 13,368,074

G r a c e K e n n e d y L i m i t e d | I n t e r i m R e p o r t M a r c h 2 0 1 9 14
4. Effect of new standards
(a) Adjustments recognised on adoption of IFRS 16
On adoption of IFRS 16, the Group recognised lease liabilities in relation to leases which had
previously been classified as ‘operating leases’ under the principles of IAS 17 ‘Leases’. These liabilities
were measured at the present value of the remaining lease payments, discounted using the lessee’s
incremental borrowing rate as of 1 January 2019. The weighted average lessee’s incremental
borrowing rate applied to the lease liabilities on 1 January 2019 was 5.15%.
For leases previously classified as finance leases the Group recognised the carrying amount of the
lease asset and lease liability immediately before transition as the carrying amount of the right of use
asset and the lease liability at the date of initial application. The measurement principles of IFRS 16
are only applied after that date.
The table below shows the reconciliation of the operating lease commitments disclosed as at 31
December 2018 to the lease liabilities recognised as at 1 January 2019:
January 1) 2019) $'000)
Operating lease commitments disclosed as at 31 December 2018 6,197,274
Discounted using the incremental borrowing rate at the date of initial application 5,186,392
Adjustments arising from different treatment of extension and termination options and changes in the index or rate affecting variable payments 1,197,682
Lease liabilities recognised on adoption of IFRS 16 6,384,074
Finance lease liabilities recognised as at 31 December 2018 77,687
Lease liabilities recognised as at 1 January 2019 6,461,761
As noted in the accounting policies for the new standards, the transition provisions applied by the
Group do not require comparative figures to be restated. The total impact of adoption is therefore
recognised in the opening statement of financial position on 1 January 2019.
The right-of use assets were measured at the amount equal to the lease liability, adjusted by the
amount of any prepaid or accrued lease payments relating to that lease recognised in the balance
sheet as at 31 December 2018. There were no onerous lease contracts that would have required an
adjustment to the right-of-use assets at the date of initial application.
The adoption of IFRS 16 resulted in an increase in the lease liabilities of $6,384,074,000 and a
corresponding increase in the right-of-use assets of $6,384,074,000 on 1 January 2019.
In applying IFRS 16 for the first time, the Group has used the following practical expedients permitted
by the standard:
Reliance on previous assessments on whether leases are onerous
Reliance on previous assessments on whether a contract is, or contains, a lease applying IAS 17
and IFRIC 4
The application of a single discount rate to a portfolio of leases with reasonably similar
characteristics
The accounting for operating leases with a remaining lease term of less than 12 months as at 1
January 2019 as short-term leases
The exclusion of initial direct costs for the measurement of the right-of-use asset at the date of
initial application, and
The use of hindsight in determining the lease term where the contract contains options to extend
or terminate the lease.

G r a c e K e n n e d y L i m i t e d | I n t e r i m R e p o r t M a r c h 2 0 1 9 15
4. Effect of new standard
(continued)
(b) Current year disclosures
The recognised right-of-use assets relate to the following types of assets:
31 March) 1 January) 2019) 2019) $'000) $'000)
Properties 5,505,470 5,643,466
Equipment 35,103 39,663
Motor Vehicles 649,100 700,945
Total right-of-use assets 6,189,673 6,384,074
The Group incurred depreciation charges of $232,159,000 on the right-of-use assets and interest
expense of $83,151,000 on the lease liabilities during the period.
5. Contingent Liability
(a) By letter dated 17 May 2018, the Guyana Revenue Authority (GRA) indicated that GraceKennedy
Remittance Services Guyana (‘GKRS Guyana’) was “incorrectly” classified as a non-commercial
company rather than a commercial company. Based on this, the GRA asserted that GKRS Guyana
had wrongly paid corporation taxes at the lower non-commercial company rate. GKRS Guyana’s
tax liability was assessed by the GRA to be the equivalent of J$225,116,000, excluding penalties and
interest if applicable. GKRS Guyana lodged objections to the GRA’s assessment on the basis that
the GRA wrongly assessed GKRS Guyana as a commercial company and that GKRS Guyana had
filed (and the GRA had accepted), returns for a period of over 20 years as a non-commercial
company. By letter dated 26 September 2018, received on 4 October 2018, the GRA indicated that
it would maintain its assessments despite the objection.
GKRS Guyana filed an appeal on 26 October 2018 and defence in response filed by the GRA on 21
December 2018. Oral submissions were heard in chambers before the Judge on 27 March 2019. The
matter was adjourned to 5 July 2019 for a ruling.
GKRS Guyana is confident that it has a strong basis of appeal having regard to counsel’s advice,
that the requirement to pay taxes as a commercial company, as set out in the Corporation Tax Act
of Guyana, does not apply because the company does not satisfy the criterion for this classification.
Based on this, no amounts have been provided for in these financial statements in respect of this
matter.
(b) By letter dated 20 March 2019, Tax Administration Jamaica (TAJ) raised assessments on a subsidiary
company, GraceKennedy Remittance Services Limited (GKRS), under the General Consumption Tax
(GCT) Act for a net tax liability of $358,870,000 (inclusive of penalties and interest) in relation to
incorrect GCT input taxes claimed. GKRS lodged objections to TAJ’s assessments on the basis that
TAJ incorrectly disallowed the GCT input taxes. The Group is of the opinion that GKRS has a strong
basis for objection in respect of these assessments and that GKRS will be successful in having these
assessments withdrawn. Accordingly, no amounts have been provided for in these financial
statements in respect of these matters.


