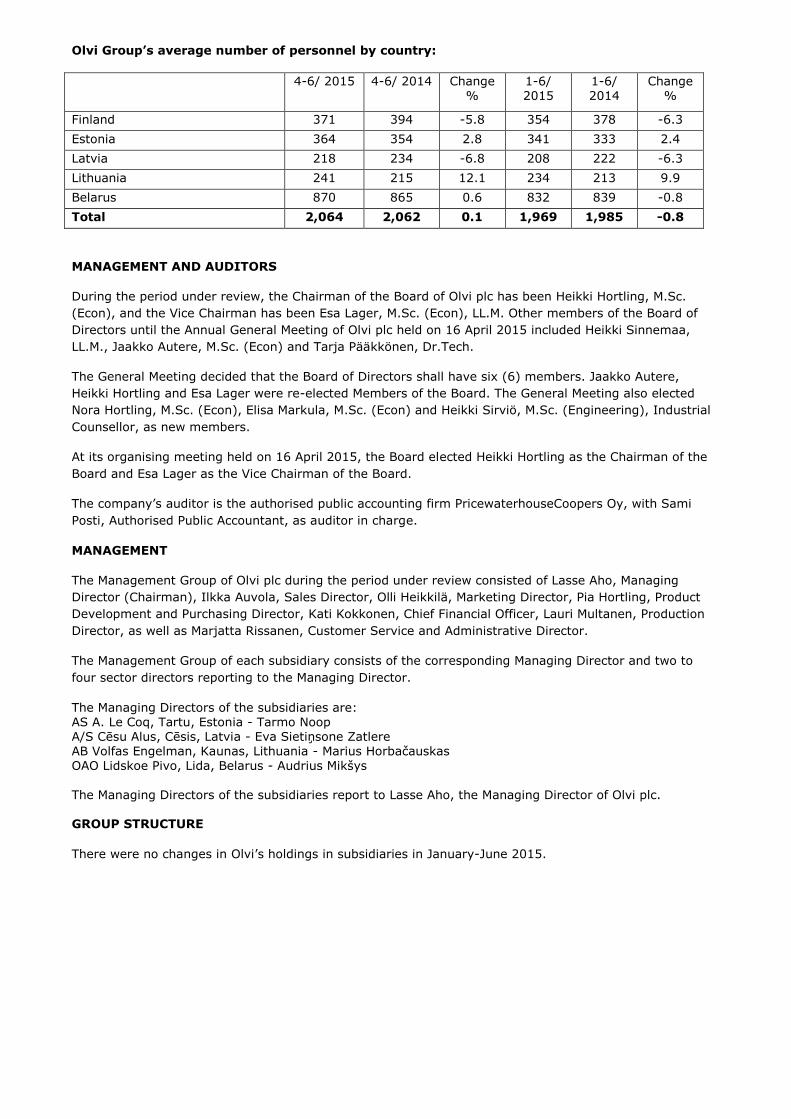
OLVI PLC INTERIM REPORT 13 AUGUST 2015 at 9:00 am OLVI GROUP’S INTERIM REPORT, 1 JANUARY TO 30 JUNE 2015 (6 MONTHS) INTERIM REPORT IN BRIEF Olvi Group’s sales volume increased in January-June, but the operating profit fell short of last year. A substantial part of the operating profit decline was due to the Belarusian exchange rate, which was weaker than last year. Second-quarter earnings were negatively impacted by extraordinarily cool and rainy weather in the summer season. January to June 2015 in brief: - Olvi Group’s sales volume was 284.1 (278.9) million litres - The Group’s net sales amounted to 152.7 (156.6) million euro - The Group’s operating profit amounted to 17.7 (19.3) million euro - Olvi Group’s earnings per share stood at 0.46 (0.66) euro per share - The equity ratio remained good at 50.6 (50.5) percent April to June 2015 in brief: - Olvi Group’s sales volume was 168.8 (171.7) million litres - The Group’s net sales amounted to 91.2 (96.9) million euro - The Group’s operating profit amounted to 13.9 (15.9) million euro - Olvi Group’s earnings per share stood at 0.39 (0.53) euro per share Olvi estimates that the Group’s sales volume for 2015 will increase slightly on the previous year. Net sales and operating profit are estimated to be on a par with 2014 or slightly lower. CONSOLIDATED KEY RATIOS 4-6/ 2015 4-6/ 2014 Change % / pp 1-6/ 2015 1-6/ 2014 Change % / pp 1-12/ 2014 Sales volume, Mltr 168.8 171.7 -1.7 284.1 278.9 1.9 576.5 Net sales, MEUR 91.2 96.9 -5.8 152.7 156.6 -2.5 320.8 EBITDA, MEUR 18.1 19.5 -7.2 25.7 26.4 -2.7 55.9 Operating profit, MEUR 13.9 15.9 -12.4 17.7 19.3 -8.4 41.0 % of net sales 15.2 16.4 11.6 12.4 12.8 Net profit for the period 8.2 11.2 -26.4 9.6 13.9 -31.1 33.1 % of net sales 9.0 11.5 6.3 8.9 10.3 Earnings per share, EUR 0.39 0.53 -26.4 0.46 0.66 -30.3 1.57 Gross capital expenditure, MEUR 9.5 10.8 -11.6 16.1 23.5 -31.6 41.6 Equity per share, EUR 8.63 8.22 5.0 9.17 Equity to total assets, % 50.6 50.5 0.1 57.9 Gearing, % 42.1 38.4 3.7 29.8 BUSINESS DEVELOPMENT LASSE AHO, MANAGING DIRECTOR: In the second quarter, Olvi Group fell short of the previous year’s result. This was strongly affected by cool and rainy summer weather particularly in Finland and Estonia. Another contributing factor was the weakened exchange rate in Belarus. Our accumulated sales volume is greater than in the previous year and net sales are almost on a par with last year, which can be considered quite good performance in comparison to the general market development. The market situation in Finland has remained challenging. Weakened consumer purchasing power, pronounced price competition and a decline in the overall market had a negative impact also on business development in Finland. However, we have been able to balance this with cost savings and improvements in production plant performance. The cost savings are also expected to support earnings development in Finland during the rest of the year.
Transcript
OLVI PLC INTERIM REPORT 13 AUGUST 2015 at 9:00 am
OLVI GROUP’S INTERIM REPORT, 1 JANUARY TO 30 JUNE 2015 (6 MONTHS)
INTERIM REPORT IN BRIEF
Olvi Group’s sales volume increased in January-June, but the operating profit fell short of last year. A substantial part of the operating profit decline was due to the Belarusian exchange rate, which was weaker than last year. Second-quarter earnings were negatively impacted by extraordinarily cool and rainy weather in the summer season.
January to June 2015 in brief:
- Olvi Group’s sales volume was 284.1 (278.9) million litres - The Group’s net sales amounted to 152.7 (156.6) million euro - The Group’s operating profit amounted to 17.7 (19.3) million euro - Olvi Group’s earnings per share stood at 0.46 (0.66) euro per share
- The equity ratio remained good at 50.6 (50.5) percent April to June 2015 in brief: - Olvi Group’s sales volume was 168.8 (171.7) million litres - The Group’s net sales amounted to 91.2 (96.9) million euro - The Group’s operating profit amounted to 13.9 (15.9) million euro - Olvi Group’s earnings per share stood at 0.39 (0.53) euro per share
Olvi estimates that the Group’s sales volume for 2015 will increase slightly on the previous year. Net sales and operating profit are estimated to be on a par with 2014 or slightly lower.
Gross capital expenditure, MEUR 9.5 10.8 -11.6 16.1 23.5 -31.6 41.6
Equity per share, EUR 8.63 8.22 5.0 9.17
Equity to total assets, % 50.6 50.5 0.1 57.9
Gearing, % 42.1 38.4 3.7 29.8
BUSINESS DEVELOPMENT LASSE AHO, MANAGING DIRECTOR: In the second quarter, Olvi Group fell short of the previous year’s result. This was strongly affected by cool and rainy summer weather particularly in Finland and Estonia. Another contributing factor was the
weakened exchange rate in Belarus. Our accumulated sales volume is greater than in the previous year and net sales are almost on a par with last year, which can be considered quite good performance in comparison to the general market development.
The market situation in Finland has remained challenging. Weakened consumer purchasing power,
pronounced price competition and a decline in the overall market had a negative impact also on business
development in Finland. However, we have been able to balance this with cost savings and improvements in production plant performance. The cost savings are also expected to support earnings development in Finland during the rest of the year.
Profitability in Estonia remained on a strong level even though sales fell short of the previous year due to cold weather in the spring and early summer. Lithuania has succeeded in improving its market share and
earnings in the first half of the year when compared to the previous year. The situation in Latvia has been more challenging compared to the other units in the Baltic states due to diminished intra-Group
manufacturing and the overall market situation. However, positive development was seen in Latvia starting in late spring.
Business in Belarus developed favourably during the review period. Sales volume increased clearly, and also net sales and operating profit measured in the local currency increased on the previous year. However, the exchange rate is weaker than in the previous year, and this causes a decline of 0.9 million euro in the January-June earnings denominated in euro. In spite of the uncertainties related to Belarus, the business is expected to develop well also in the rest of the year. The Belarusian subsidiary has started co-operation with PepsiCo, Inc, the second-largest soft drinks company in the world. The co-operation agreement covers the sales, marketing and distribution of PepsiCo-manufactured soft drinks in Belarus.
The manufacture of products started during the summer as planned.
A logistics investment in Finland was completed during the spring, making operations even more efficient. Investments that will enable a substantial increase in production capacity in Belarus will be completed towards the end of the current summer season. The total amount of investments in 2015 will be less than
in the previous year, which will have a positive effect on the company’s cash flow.
SEASONAL NATURE OF THE OPERATIONS
The Group’s business operations are characterised by seasonal variation. The net sales and operating
profit from the reported geographical segments do not accumulate evenly but vary according to the time
of the year and the characteristics of each season.
SALES DEVELOPMENT Olvi Group’s sales volume increased in January-June by 1.9 percent to 284.1 (278.9) million litres. The sales volume from April to June was 168.8 (171.7) million litres.
The sales volume increased in January-June in Belarus and Lithuania. However, the volume fell short of the previous year in Finland and Estonia due to reasons including cooler spring and summer weather. The
volume development in Latvia reflects the decline in sales to other Group entities. Sales volume development by unit:
Sales volume, million litres 4-6/ 2015
4-6/ 2014
Change %
1-6/ 2015 1-6/ 2014
Change %
Finland (Olvi plc) 39.9 44.6 -10.5 69.8 72.4 -3.6
Estonia (AS A. Le Coq) 37.8 41.5 -8.9 63.1 66.7 -5.4
Latvia (A/S Cēsu Alus) 21.4 24.9 -14.3 35.3 43.2 -18.2
Lithuania (AB Volfas Engelman) 23.8 23.0 3.6 41.3 39.0 6.0
The Group’s net sales in January-June amounted to 152.7 (156.6) million euro and in April-June to 91.2 (96.9) million euro. The negative net sales development is affected by declined sales volumes in Finland and Estonia, a decrease in the average price of net sales due to price competition, as well as the weakened exchange rate in Belarus.
The comparison figures for net sales have been changed to correspond to the accounting policy adopted as of the beginning of the year, with marketing subsidies to customers now being deducted from net sales as a sales adjustment item similar to discounts.
Net sales development by unit:
Net sales, million euro 4-6/ 2015
4-6/ 2014
Change %
1-6/ 2015 1-6/ 2014
Change %
Finland (Olvi plc) 27.3 30.8 -11.3 48.5 51.3 -5.4
Estonia (AS A. Le Coq) 23.5 25.6 -8.1 38.8 41.1 -5.6
Latvia (A/S Cēsu Alus) 9.7 11.3 -14.0 15.7 19.6 -19.6
Lithuania (AB Volfas Engelman) 10.0 10.5 -5.0 17.3 17.7 -2.3
The Group’s operating profit for January-June stood at 17.7 (19.3) million euro, or 11.6 (12.4) percent of
net sales. Operating profit in April-June stood at 13.9 (15.9) million euro, which was 15.2 (16.4) percent of net sales. The decline in profit reflects the negative development in net sales and the Belarusian exchange rate.
Operating profit development by unit:
Operating profit (comparable) million euro
4-6/ 2015
4-6/ 2014
Change %
1-6/ 2015 1-6/ 2014
Change %
Finland (Olvi plc) 2.2 2.9 -26.0 2.8 3.5 *) -18.3
Estonia (AS A. Le Coq) 5.4 6.1 -10.7 7.6 8.3 -7.8
Latvia (A/S Cēsu Alus) 1.2 1.0 17.3 1.2 1.3 -7.3
Lithuania (AB Volfas Engelman) 0.7 0.7 -5.5 0.8 0.6 26.3
*) Reported operating profit in Finland 1-6/2014 stood at 4.2 million euro. The reported operating profit included non-recurring income of 0.7 million euro attributable to an intra-Group sales gain. The country-specific data for 2014 has been adjusted for comparability with the 1-6/2015 figures.
The Group’s January-June profit after taxes fell short of the previous year and amounted to 9.6 (13.9) million euro. In addition to business development, the decline in profit for the period was affected by unrealised exchange rate differences related to the Belarusian subsidiary, which were recognised in financial items.
Earnings per share calculated from the profit belonging to parent company shareholders in January-June
stood at 0.46 (0.66) euro, and the April-June figure was 0.39 (0.53) euro.
BALANCE SHEET, FINANCING AND INVESTMENTS
Olvi Group’s balance sheet total at the end of June 2015 was 357.5 (341.9) million euro. Equity per share
at the end of June 2015 stood at 8.63 (8.22) euro. The equity ratio was 50.6 (50.5) percent and the
gearing ratio was 42.1 (38.4) percent. The current ratio, which represents the Group’s liquidity, was 1.0
(1.1).
The amount of interest-bearing liabilities at the end of June was 80.8 (72.6) million euro, including current
liabilities of 48.7 (36.7) million euro.
Olvi Group’s gross capital expenditure in January-June amounted to 16.1 (23.5) million euro. The parent
company Olvi accounted for 2.4 million euro, the Baltic subsidiaries for 3.4 million euro and Lidskoe Pivo in
Belarus for 10.3 million euro of the total.
PRODUCT DEVELOPMENT AND NEW PRODUCTS
Research and development includes projects to design and develop new products, packages, processes
and production methods, as well as further development of existing products and packages. The R&D costs
have been recognised as expenses. The main objective of Olvi Group’s product development is to create
new products for profitable and growing beverage segments.
NEW PRODUCTS
Finland
In June, the A. Le Coq Long Drink brand already familiar from tourism to Estonia was introduced into
Finnish retail stores. The grapefruit-flavoured A. Le Coq Long Drink is sold in 12-packs. Earlier in the
spring, the OLVI IPA special beer and Crook’s Head Dram were introduced in Finland.
Subsidiaries
In Estonia, the A. Le Coq company launched the A. Le Coq Extra Lime beer and the A. Le Coq Radler
Strawberry and Radler Lemon products. Both radlers have an alcohol content of 2.5%. New flavour
variants were launched in ciders, long drinks, soft drinks and mineral waters. A completely new brand of
juices was introduced: Aura Fresh Plus, which is a juice drink family complemented with vitamins and has
three flavour variants. A new concept in sports beverages is Arctic Sport Fresh, a beverage for aerobic
sports that contains slowly absorbed carbohydrates.
In Latvia, Cēsu Alus launched the Vinitto Blanco and Vinitto Rose (5.5%) sparkling wine drinks in glass
bottles in April. At the same time, the Lielbāta spring water range was extended with three new products,
one of which was the Kids variant for children. In May, a completely new cider brand Ciderman was
launched in cans as well as plastic bottles. In June, the company’s first juice concentrate was launched. It
was introduced under the Limpa brand. At the same time, the Lielbāta spring water range was extended
by carbonated versions in three different bottle sizes.
In Lithuania, Volfas Engelman launched three new Volfas Engelman beers. These were the dark beer Volfas
Engelman Bohemijos Dark, the special beer Volfas Engelman BA Oak Aged Bourbon, as well as Volfas
Engelman Kolekcinis Galaxy Special Limited Edition, which is a beer containing Galaxy special hops and
sold in aluminium bottles. In addition to beers, the A. Le Coq Coctails range saw the introduction of
Watermelon Margarita, and two new radlers Meister Radler Cranberry and Meister Radler Orange were
launched. The VitamineralWater products familiar from Estonia were launched in Lithuania in two flavours.
A new premium kvass brand Volfas Engelman Imperial Kvass was introduced.
In the first quarter of the year, Lidskoe Pivo of Belarus launched a stout version of its Koronet beer brand.
Lidskoe Pivo did not launch any new products in the second quarter.
Detailed information on new products can be found on each company’s Web site.
PERSONNEL
Olvi Group’s average number of personnel in January-March was 1,969 (1,985).
The greatest decline in the Group’s average number of personnel was seen in Finland, where the figure
dropped by 24 people. The decline in Finland reflects the reduction in the number of sales promoters as
well as the effects of the efficiency measures and reorganisation carried out after the statutory co-
operation negotiations completed in January 2015. The reorganisation resulted in reductions of 32 people,
which will partially be reflected in the development of personnel figures towards the end of the year.
The number of personnel in the Baltic states increased by 15 people, while the number in Belarus
decreased by 7.
Olvi Group’s average number of personnel by country:
4-6/ 2015 4-6/ 2014 Change %
1-6/ 2015
1-6/ 2014
Change %
Finland 371 394 -5.8 354 378 -6.3
Estonia 364 354 2.8 341 333 2.4
Latvia 218 234 -6.8 208 222 -6.3
Lithuania 241 215 12.1 234 213 9.9
Belarus 870 865 0.6 832 839 -0.8
Total 2,064 2,062 0.1 1,969 1,985 -0.8
MANAGEMENT AND AUDITORS
During the period under review, the Chairman of the Board of Olvi plc has been Heikki Hortling, M.Sc.
(Econ), and the Vice Chairman has been Esa Lager, M.Sc. (Econ), LL.M. Other members of the Board of
Directors until the Annual General Meeting of Olvi plc held on 16 April 2015 included Heikki Sinnemaa,
LL.M., Jaakko Autere, M.Sc. (Econ) and Tarja Pääkkönen, Dr.Tech.
The General Meeting decided that the Board of Directors shall have six (6) members. Jaakko Autere,
Heikki Hortling and Esa Lager were re-elected Members of the Board. The General Meeting also elected
Nora Hortling, M.Sc. (Econ), Elisa Markula, M.Sc. (Econ) and Heikki Sirviö, M.Sc. (Engineering), Industrial
Counsellor, as new members.
At its organising meeting held on 16 April 2015, the Board elected Heikki Hortling as the Chairman of the
Board and Esa Lager as the Vice Chairman of the Board.
The company’s auditor is the authorised public accounting firm PricewaterhouseCoopers Oy, with Sami
Posti, Authorised Public Accountant, as auditor in charge.
MANAGEMENT
The Management Group of Olvi plc during the period under review consisted of Lasse Aho, Managing
Director (Chairman), Ilkka Auvola, Sales Director, Olli Heikkilä, Marketing Director, Pia Hortling, Product
Development and Purchasing Director, Kati Kokkonen, Chief Financial Officer, Lauri Multanen, Production
Director, as well as Marjatta Rissanen, Customer Service and Administrative Director.
The Management Group of each subsidiary consists of the corresponding Managing Director and two to
four sector directors reporting to the Managing Director.
The Managing Directors of the subsidiaries are: AS A. Le Coq, Tartu, Estonia - Tarmo Noop A/S Cēsu Alus, Cēsis, Latvia - Eva Sietiņsone Zatlere AB Volfas Engelman, Kaunas, Lithuania - Marius Horbačauskas
OAO Lidskoe Pivo, Lida, Belarus - Audrius Mikšys
The Managing Directors of the subsidiaries report to Lasse Aho, the Managing Director of Olvi plc. GROUP STRUCTURE
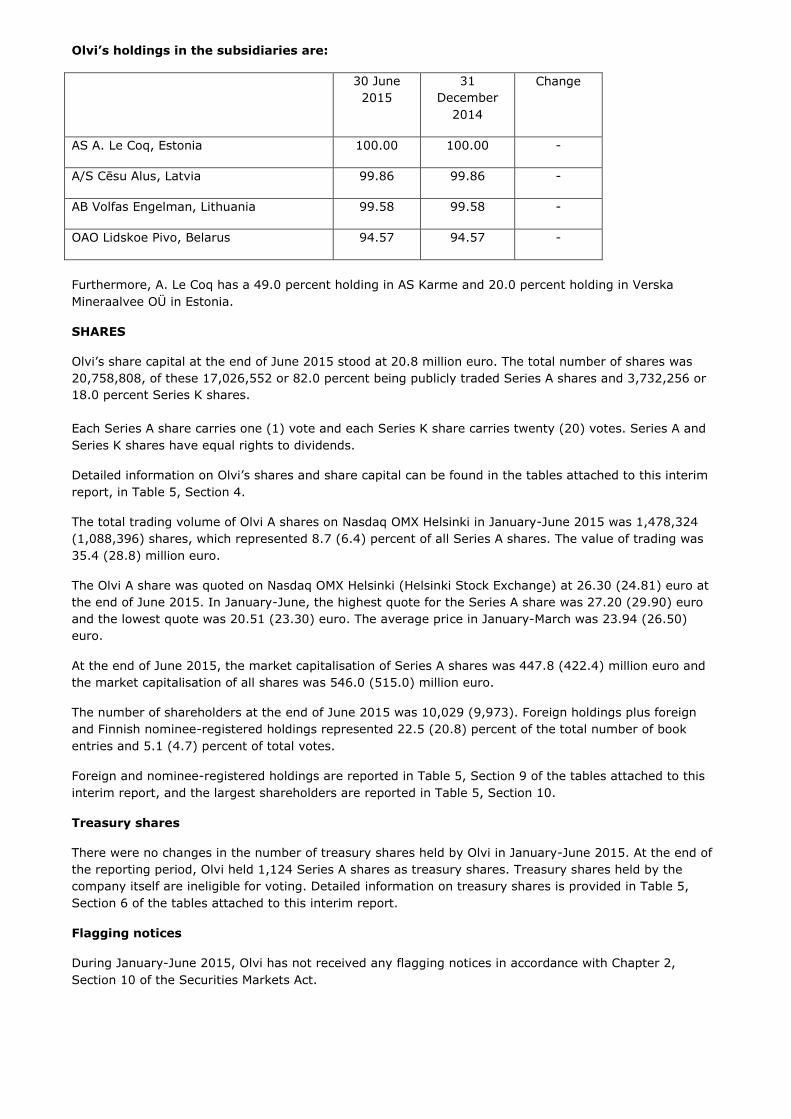
There were no changes in Olvi’s holdings in subsidiaries in January-June 2015.
Olvi’s holdings in the subsidiaries are:
30 June
2015
31
December
2014
Change
AS A. Le Coq, Estonia 100.00 100.00 -
A/S Cēsu Alus, Latvia 99.86 99.86 -
AB Volfas Engelman, Lithuania 99.58 99.58 -
OAO Lidskoe Pivo, Belarus 94.57 94.57 -
Furthermore, A. Le Coq has a 49.0 percent holding in AS Karme and 20.0 percent holding in Verska
Mineraalvee OÜ in Estonia.
SHARES
Olvi’s share capital at the end of June 2015 stood at 20.8 million euro. The total number of shares was
20,758,808, of these 17,026,552 or 82.0 percent being publicly traded Series A shares and 3,732,256 or
18.0 percent Series K shares.
Each Series A share carries one (1) vote and each Series K share carries twenty (20) votes. Series A and
Series K shares have equal rights to dividends.
Detailed information on Olvi’s shares and share capital can be found in the tables attached to this interim
report, in Table 5, Section 4.
The total trading volume of Olvi A shares on Nasdaq OMX Helsinki in January-June 2015 was 1,478,324
(1,088,396) shares, which represented 8.7 (6.4) percent of all Series A shares. The value of trading was
35.4 (28.8) million euro.
The Olvi A share was quoted on Nasdaq OMX Helsinki (Helsinki Stock Exchange) at 26.30 (24.81) euro at
the end of June 2015. In January-June, the highest quote for the Series A share was 27.20 (29.90) euro
and the lowest quote was 20.51 (23.30) euro. The average price in January-March was 23.94 (26.50)
euro.
At the end of June 2015, the market capitalisation of Series A shares was 447.8 (422.4) million euro and
the market capitalisation of all shares was 546.0 (515.0) million euro.
The number of shareholders at the end of June 2015 was 10,029 (9,973). Foreign holdings plus foreign
and Finnish nominee-registered holdings represented 22.5 (20.8) percent of the total number of book
entries and 5.1 (4.7) percent of total votes.
Foreign and nominee-registered holdings are reported in Table 5, Section 9 of the tables attached to this
interim report, and the largest shareholders are reported in Table 5, Section 10.
Treasury shares
There were no changes in the number of treasury shares held by Olvi in January-June 2015. At the end of
the reporting period, Olvi held 1,124 Series A shares as treasury shares. Treasury shares held by the
company itself are ineligible for voting. Detailed information on treasury shares is provided in Table 5,
Section 6 of the tables attached to this interim report.
Flagging notices
During January-June 2015, Olvi has not received any flagging notices in accordance with Chapter 2,
Section 10 of the Securities Markets Act.
BUSINESS RISKS AND THEIR MANAGEMENT
Risk management
Risk management is a part of Olvi Group’s everyday management and operations. The objective of risk
management is to ensure the realisation of the company’s strategy and secure its financial development
and the continuity of business. The task of risk management is to operate proactively and create operating
conditions in which business risks are managed comprehensively and systematically in all of the Group
companies and all levels of the organisation.
Business risks and uncertainties in the near term
The most substantial factor hampering the predictability of Olvi Group’s business relates to Belarus and its
economic and political outlook for the next few years. Furthermore, negative development of the Russian
economy may impose challenges on the Belarusian operating environment.
In addition to these challenges, operations in Belarus involve foreign exchange risks arising from the cash
flows of purchases and sales in foreign currency, as well as the investment in the Belarusian subsidiary
and the conversion of its income statement and balance sheet items into euro. The Group’s other foreign
exchange risks can be considered minor.
Other short-term risks and uncertainties are related to continuing negative development of the general
economic circumstances and the impact it may have on the company’s operations.
There have not been any significant changes in Olvi Group’s business risks. A more detailed description of
the risks is provided in the Board of Directors’ report and the notes to the financial statements, as well as
in the Investors/Corporate Governance section of the company’s Web site.
OTHER EVENTS DURING THE REVIEW PERIOD
Annual General Meeting
Olvi plc’s Annual General Meeting of 16 April 2015 adopted the financial statements and granted discharge
from liability to the members of the Board of Directors and Managing Director for the accounting period
that ended on 31 December 2014. In accordance with the Board’s proposal, the General Meeting decided
that a dividend of 0.65 (0.65) euro be paid on each A and K share for the accounting period 2014. The
dividends were paid on 30 April 2015.
All decisions made at the General Meeting can be found in the bulletin released on 16 April 2015.
NEAR-TERM OUTLOOK
Olvi estimates that the Group’s sales volume for 2015 will increase slightly on the previous year. Net sales
and operating profit are estimated to be on a par with 2014 or slightly lower.
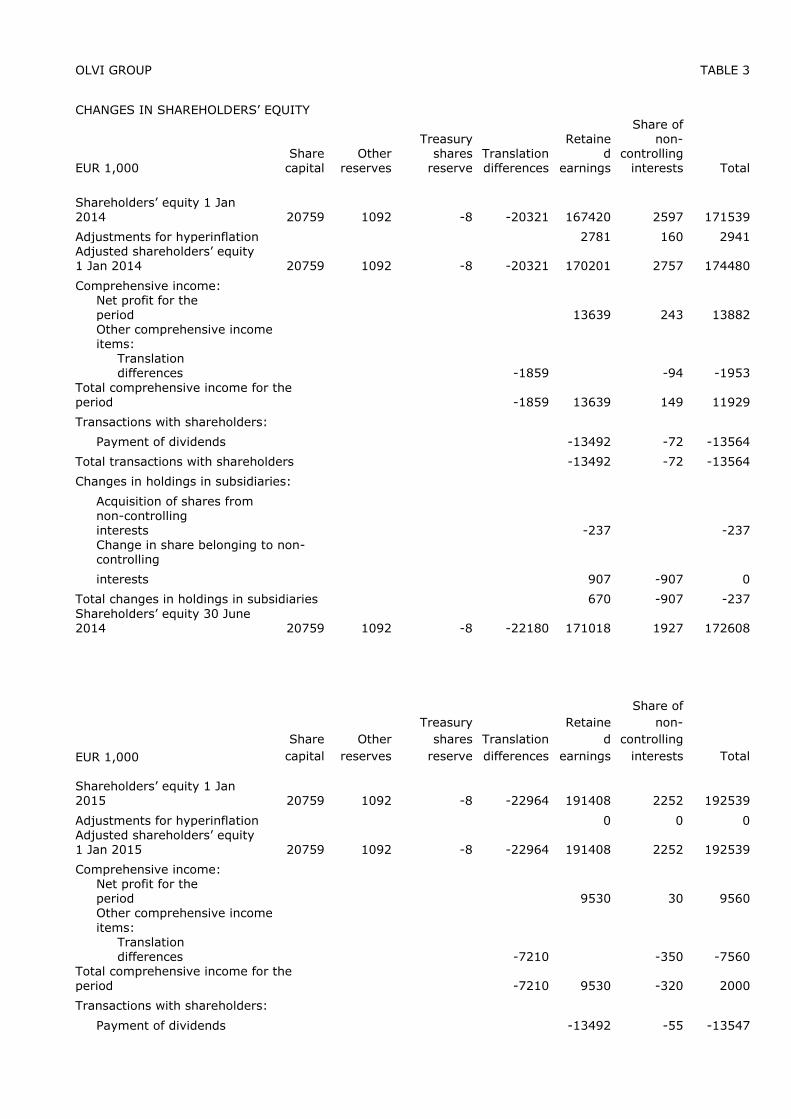
Transactions with shareholders: Payment of dividends
-13492 -55 -13547
Share-based incentives 27 27
Total transactions with shareholders
-13465 -55 -13520
Shareholders’ equity 30 June
2015 20759 1092 -8 -30174 187473 1877 181019
Other reserves include the share premium account, legal reserve and other reserves.
OLVI GROUP
TABLE 4
CASH FLOW STATEMENT
EUR 1,000
1-6/2015 1-6/2014 1-12/2014
Net profit for the period 9560 13882 33079
Adjustments to profit for the period 13135 12169 25699
Change in net working capital -10969 -7742 -2358
Interest paid -560 -1872 -3393
Interest received 82 130 385
Taxes paid 297 -1344 -7063
Cash flow from operations (A) 11545 15223 46349
Investments in tangible and intangible
assets -16201 -22412 -43855
Sales gains from tangible and intangible
assets -92 42 200
Expenditure on other investments 0 -250 -298
Cash flow from investments (B) -16293 -22620 -43953
Withdrawals of loans 24947 27751 32657
Repayments of loans -6384 -8024 -24542
Dividends paid -13516 -13532 -13531
Increase (-) / decrease (+) in current interest-
bearing business receivables 0 -15 -23
Increase (-) / decrease (+) in long-term
loan receivables 3 0 16
Cash flow from financing (C) 5050 6180 -5423
Increase (+)/decrease (-) in liquid assets (A+B+C) 302 -1217 -3027
Liquid assets 1 January 4382 7507 7507
Effect of exchange rate changes -45 -98 -98
Liquid assets 30 June/31 December 4639 6192 4382
OLVI GROUP TABLE 5
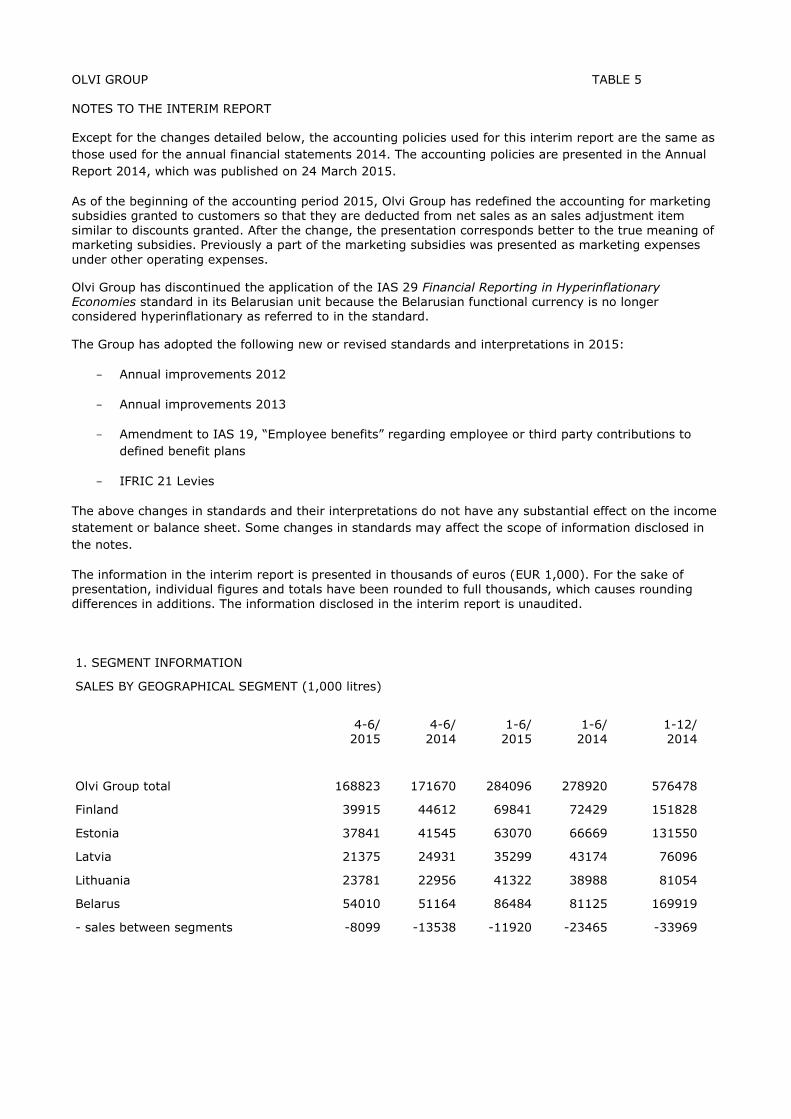
NOTES TO THE INTERIM REPORT Except for the changes detailed below, the accounting policies used for this interim report are the same as
those used for the annual financial statements 2014. The accounting policies are presented in the Annual
Report 2014, which was published on 24 March 2015.
As of the beginning of the accounting period 2015, Olvi Group has redefined the accounting for marketing subsidies granted to customers so that they are deducted from net sales as an sales adjustment item similar to discounts granted. After the change, the presentation corresponds better to the true meaning of marketing subsidies. Previously a part of the marketing subsidies was presented as marketing expenses
under other operating expenses.
Olvi Group has discontinued the application of the IAS 29 Financial Reporting in Hyperinflationary Economies standard in its Belarusian unit because the Belarusian functional currency is no longer considered hyperinflationary as referred to in the standard.
The Group has adopted the following new or revised standards and interpretations in 2015:
- Annual improvements 2012
- Annual improvements 2013
- Amendment to IAS 19, “Employee benefits” regarding employee or third party contributions to
defined benefit plans
- IFRIC 21 Levies
The above changes in standards and their interpretations do not have any substantial effect on the income
statement or balance sheet. Some changes in standards may affect the scope of information disclosed in
the notes.
The information in the interim report is presented in thousands of euros (EUR 1,000). For the sake of presentation, individual figures and totals have been rounded to full thousands, which causes rounding
differences in additions. The information disclosed in the interim report is unaudited.
1. SEGMENT INFORMATION
SALES BY GEOGRAPHICAL SEGMENT (1,000 litres)
4-6/ 2015
4-6/ 2014
1-6/ 2015
1-6/ 2014
1-12/ 2014
Olvi Group total 168823 171670 284096 278920 576478
Finland 39915 44612 69841 72429 151828
Estonia 37841 41545 63070 66669 131550
Latvia 21375 24931 35299 43174 76096
Lithuania 23781 22956 41322 38988 81054
Belarus 54010 51164 86484 81125 169919
- sales between segments -8099 -13538 -11920 -23465 -33969
NET SALES BY GEOGRAPHICAL SEGMENT (EUR 1,000)
4-6/
2015
4-6/
2014
1-6/
2015
1-6/
2014
1-12/
2014
Olvi Group total 91228 96893*) 152742 156613*) 320785*)
Finland 27284 30773 48474 51266 105329
Estonia 23534 25617 38779 41058 80666
Latvia 9722 11305 15714 19550 34112
Lithuania 9974 10495 17328 17739 36130
Belarus 24046 23943 37445 36628 78554
- sales between segments -3332 -5240 -4998 -9628 -14006
*) The previous year’s figures have been adjusted for comparability with the year 2015.
OPERATING PROFIT BY GEOGRAPHICAL SEGMENT (EUR 1,000)
4-6/ 2015
4-6/ 2014
1-6/ 2015
1-6/ 2014
1-12/ 2014
Olvi Group total 13911 15878 17716 19344 41000
Finland 2155 2912 2849 4168*) 7436*)
Estonia 5444 6096 7611 8258 16504
Latvia 1180 1006 1226 1322 2058
Lithuania 692 733 787 623 2356
Belarus 4458 5113 5186 5689 13117
- eliminations -18 18 57 -716 -471
*) The operating profit for Finland includes non-recurring income of 0.7 million euro attributable to an intra-Group sales gain.
2. PERSONNEL ON AVERAGE
4-6/ 2015
4-6/ 2014
1-6/ 2015
1-6/ 2014
1-12/ 2014
Finland 371 394 354 378 369
Estonia 364 354 341 333 331
Latvia 218 234 208 222 214
Lithuania 241 215 234 213 214
Belarus 870 865 832 839 830
Total 2064 2062 1969 1985 1958
3. RELATED PARTY TRANSACTIONS
Employee benefits to management
Salaries and other short-term employee benefits to the Board of Directors and Managing Director
EUR 1,000
1-6/ 2015
1-6/ 2014
1-12/ 2014
Managing Director 173 185 361
Chairman of the Board 45 41 84
Other members of the Board 71 64 125
Total 289 290 570
4. SHARES AND SHARE CAPITAL
30 June 2015 %
Number of A shares 17026552 82.0
Number of K shares 3732256 18.0
Total 20758808 100.0
Total votes carried by A shares 17026552 18.6
Total votes carried by K shares 74645120 81.4
Total number of votes 91671672 100.0
Votes per Series A share 1
Votes per Series K share 20
The registered share capital on 30 June 2015 totalled 20,759 thousand euro. Olvi plc’s Series A and Series K shares received a dividend of 0.65 euro per share for 2014 (0.65 euro per share for 2013), totalling 13.5 (13.5) million euro. The dividends were paid on 30 April 2015. The Series K and Series A shares entitle to equal dividend. The Articles of Association include a redemption clause concerning Series K shares.
5. SHARE-BASED PAYMENTS
Olvi Group has an active share-based incentive plan for key personnel. The aim of the share-based incentive plan is to combine the objectives of the shareholders and the key employees in order to increase the value of the company, to make the key employees committed to the company, and to offer them a competitive reward plan based on earning the company’s shares.
The bonuses for the performance periods (2014-2016/2017) will be paid in 2017 partially in Olvi plc Series A shares and partially in cash. The plan is directed to approximately 50 people. The rewards to be paid on the basis of the plan are in total an approximate maximum of 40,000 series A shares in Olvi plc and a cash payment needed for taxes
and tax-related costs arising from the shares. From January to June 2015, accounting entries associated with the performance period from 1 July 2014 to 30 June 2017 were recognised for a total of 45.0 thousand euro.
Olvi Group has no warrants or options.
6. TREASURY SHARES
Olvi plc held a total of 1,124 of its own Series A shares on 1 January 2015.
Olvi plc has not acquired more treasury shares or transferred them to others in January-June 2015, which means that the number of Series A shares held by the company was unchanged on 30 June 2015. The purchase price of the Series A shares held as treasury shares totalled 8.5 thousand euro.
Series A shares held by Olvi plc as treasury shares represented 0.005 percent of the share capital and 0.001 percent of the aggregate number of votes. The treasury shares represented 0.007 percent of all Series A shares and associated votes. On 16 April 2015, the General Meeting of Shareholders of Olvi plc decided to revoke any unused authorisations to acquire treasury shares and authorise the Board of Directors of Olvi plc to decide on the
acquisition of the company’s own shares using unrestricted equity. The authorisation is valid for one year starting from the General Meeting and covers a maximum of 500,000 Series A shares. The shares shall be acquired for the purpose of financing or executing any upcoming corporate acquisitions or other arrangements, implementing the company’s incentive schemes or for other purposes decided upon by the
Board of Directors. The Annual General Meeting also decided to revoke all existing unused authorisations for the transfer of
own shares and authorise the Board of Directors to decide on the issue of a maximum of 1,000,000 new Series A shares and the transfer of a maximum of 500,000 Series A shares held as treasury shares. In January-June 2015, the Board of Directors of Olvi plc has not exercised the authorisations granted by the General Meeting.
7. NUMBER OF SHARES *) 1-6/2015 1-6/2014 1-12/2014
- average 20757684 20757684 20757684
- at end of period 20757684 20757684 20757684
*) Treasury shares deducted.
8. TRADING OF SERIES A SHARES ON THE HELSINKI STOCK EXCHANGE
1-6/2015 1-6/2014 1-12/2014
Trading volume of Olvi A shares 1478324 1088396 2174302
Total trading volume, EUR 1,000 35420 28834 54313
Traded shares in proportion to
all Series A shares, % 8.7 6.4 12.8
Average share price, EUR 23.94 26.50 25.03
Price on the closing date, EUR 26.30 24.81 21.07
Highest quote, EUR 27.20 29.90 29.90
Lowest quote, EUR 20.51 23.30 20.70
9. FOREIGN AND NOMINEE-REGISTERED HOLDINGS ON 30 JUNE 2015
Book entries Votes Shareholders
qty % qty % qty %
Finnish total 16092981 77.52 87005845 94.91 9964 99.35
Foreign total 399843 1.93 399843 0.44 56 0.56
Nominee-registered (foreign) total 93636 0.45 93636 0.10 4 0.04
Nominee-registered (Finnish) total 4172348 20.10 4172348 4.55 5 0.05
Total 20758808 100.00 91671672 100.00 10029 100.00
10. LARGEST SHAREHOLDERS ON 30 JUNE 2015
Series K Series A Total % Votes %
1. Olvi Foundation 2363904 890613 3254517 15.68 48168693 52.54
2. Hortling Heikki Wilhelm *) 903488 103280 1006768 4.85 18173040 19.82
3. The Heirs of Hortling Kalle Einari 187104 25248 212352 1.02 3767328 4.11
4. Hortling Timo Einari 165824 35308 201132 0.97 3351788 3.66