16
Interim report January – June 2017 Telephone conference July 21, 2017 Thomas Berglund, CEO Olof Bengtsson, CFO
Interim report January – June 2017
Telephone conference
July 21, 2017
Thomas Berglund, CEO
Olof Bengtsson, CFO

Capio AB (publ) 2
Nordic develops well while market drop challenges France
Highlights January – June 2017
8.6% total sales growth and 1.9% organic sales growth
4.5% EBITDA growth
-5.5% Net profit growth
3.3x financial leverage. Net debt at MSEK 3,563
• Acquisitions (MSEK 900 in annual sales) successfully
integrated and the acquisition activity is set to continue
• Continued good organic sales growth and acquisitions drive
sales and results in Nordic
• Weaker private market in France impacts the result, ongoing
work to adjust resources – French Q4 2017 margin to exceed
Q4 2016
• Full year 2017 Group EBITDA growth is expected to
exceed 10%
2017-07-21

Capio Group APR - JUN
JAN - JUN
FULL YEAR
2017 2016 ∆, % 2017 2016 ∆, % RTM 2016
Net sales 3,881 3,573 8.6 7,795 7,176 8.6 14,688 14,069
Organic sales growth, % 0.5 4.0 1.9 3.8 2.3 3.3
EBITDA 256 276 -7.2 598 572 4.5 1,087 1,061
Margin, % 6.6 7.7 7.7 8.0 7.4 7.5
EBITA 142 172 -17.4 374 367 1.9 651 644
Margin, % 3.7 4.8 4.8 5.1 4.4 4.6
Profit for the period 70 113 -38.1 222 235 -5.5 391 404
EPS after dilution, SEK 0.50 0.80 1.57 1.67 2.77 2.86
Net capital expenditures -85 -113 -152 -209 -401 -458
In % of net sales 2.2 3.2 1.9 2.9 2.7 3.3
Net debt 3,563 2,941 3,563 2,941 3,563 2,872
Financial leverage 3.3 2.8 3.3 2.8 3.3 2.7
• Q2 negatively impacted by fewer working days, one working day less during H1
• Organic sales growth from volume growth and a higher case mix while overall price
increases were limited. Recent acquisitions impact total sales growth positively
• The result development was positively impacted by productivity improvements and
acquisitions, and negatively by the general price reduction in France (MSEK -33) and the
lower than expected French private market growth
• Profit for the period impacted by higher amortizations and acquisition related items
• Net capex RTM June 2017 well in line with the target level of 3.0%
• Net debt and leverage impacted by the recent acquisitions and dividend paidCapio AB (publ) 3
Group financial development
2017-07-21

• AVLOS (Average Length Of Stay) reduction in the Group
was +0.2% and -1.0% excluding geriatrics. The geriatric
business is growing in all segments
• AVLOS development excluding geriatrics was impacted by a
higher case mix in all segments (e.g. higher emergency
case mix at Capio S:t Göran and a continued increase in the
number of hip- and knee replacements in France)
• Considering case mix changes, the AVLOS reduction was
well in line with the historical trend
Capio AB (publ) 4
Implementation of the Modern Medicine strategy – resulting
in improved AVLOS
2017-07-21
Continued AVLOS reduction in 2017
APR - JUN JAN - JUN FULL YEAR
AVLOS by segment, Days 2017 % 2016 2017 % 2016 RTM 2016 % 2015 % 2014 %
Capio Nordic 3.98 2.1 3.90 3.96 -1.2 4.01 3.98 4.01 -2.7 4.12 -1.0 4.16 -1.2
Capio Nordic excl. geriatrics 2.86 2.9 2.78 2.85 -0.3 2.86 2.83 2.83 -3.4 2.93 -2.7 3.01 -3.2
Capio France 4.45 2.3 4.35 4.43 0.7 4.40 4.48 4.47 -3.0 4.61 -2.9 4.75 -3.7
Capio France excl. geriatrics 4.34 0.2 4.33 4.33 -1.1 4.38 4.41 4.43 -3.7 4.60 -3.2 4.75 -3.7
Capio Germany 4.67 0.9 4.63 4.52 1.3 4.46 4.58 4.54 -1.5 4.61 -4.4 4.82 0.0
Capio Germany excl. geriatrics 4.07 -1.5 4.13 3.97 0.0 3.97 4.05 4.04 -3.1 4.17 -6.1 4.44 -0.7
Capio Group 4.36 1.6 4.29 4.33 0.2 4.32 4.37 4.37 -2.7 4.49 -3.0 4.63 -2.5
Capio Group excl. geriatrics 3.95 -0.3 3.96 3.94 -1.0 3.98 3.99 4.01 -3.4 4.15 -4.2 4.33 -3.1

Capio AB (publ) 5
France – Modern Medicine and Rapid Recovery
reducing AVLOS
• Capio France’s growth of hip and
knee replacements well above
market growth also in 2017
• Continued significant AVLOS
reduction for hip and knee
replacements also in 2017. 7% more
patients discharged within four days
in RTM June 2017 compared with
RTM June 2016
• Total AVLOS reduction from 2011 to
June 2017 was -49% for Capio
France
• Steady growth in the number of
procedures performed in day care
Source: French market data; Scansanté (ATIH), Swedish market data; Socialstyrelsen
AVLOS development hip and knee replacements 2011-2016
Rapid Recovery strategy
continues to deliver
Capio France – hip and knee prosthesis surgery
2017-07-21
Capio France Jan-Jun 2017 AVLOS at 4.2
days
54
44
33
19
117
2
56
0
10
20
30
40
50
60
708,000
7,000
6,000
5,000
4,000
3,000
2,000
1,000
0
5,529
2012
5,296
2011
4,911
2010
7,196
2016
6,939
2015
6,305
2014
5,949
2013
4,066
2017
RTM
Number of proceduresDischarged, % <= 4 days
Number of in- and outpatients %
Provided in daycare:Number
0 1 8 26 160 450 534 569
Days 2011 2014 2015 2016 11-14, % 11-15, % 11-16, %
Capio France 8.2 5.6 5.0 4.5 -32 -39 -45
The French market 10.2 9.0 8.4 - -12 -18 -
Capio Sweden 3.9 3.3 2.7 2.6 -15 -31 -33
The Swedish market - 4.7 4.4 - - - -

Capio AB (publ) 6
Digitalization improving provision of healthcare
2017-07-21
• As planned, the digital concepts have been under test since May 2017. The full roll-
out to Capio’s 750,000 primary care patients in Sweden starts in September 2017
and continues into 2018
• The roll-out includes both digital consultations “Capio Online” and algorithm support
“Better Visits” for traditional physical consultations. This is intended to improve
availability and lead to more precise diagnoses and better treatments
Improved availability and quality of consultations

Capio Nordic APR - JUN JAN - JUN FULL YEAR
2017 2016 ∆, % 2017 2016 ∆, % RTM 2016
Net sales 2,211 1,950 13.4 4,364 3.854 13.2 8,094 7,584
Organic sales growth, % 2.4 4.7 3.6 3.8 3.7 3.8
EBITDA 142 137 3.6 294 249 18.1 567 522
Margin, % 6.4 7.0 6.7 6.5 7.0 6.9
EBITA 97 98 -1.0 206 175 17.7 402 371
Margin, % 4.4 5.0 4.7 4.5 5.0 4.9
Net capital expenditures -31 -51 -68 -95 -141 -168
In % of net sales 1.4 2.6 1.6 2.5 1.7 2.2
• Strong organic sales growth in S:t Göran, the geriatric business
in Stockholm and in Norway. Recent acquisitions impact total
sales growth positively
• Result growth impacted by organic sales growth, productivity
improvements, and acquisitions. Easter and other negative
calendar effects impact organic sales growth and results in Q2
• Acquisitions contributed in line with expectations
• Digital consultations in primary care started during the spring
and summer with a full roll-out from H2 2017 into 2018
Capio AB (publ) 7
Segment – Capio Nordic
Q2 impacted by 4 working days less
– H1 1 working day less
2017-07-21

Capio France APR - JUN JAN - JUN FULL YEAR
2017 2016 ∆, % 2017 2016 ∆, % RTM 2016
Net sales 1,379 1,336 3.2 2,813 2,723 3.3 5,403 5,313
Organic sales growth, % -1.1 2.0 -0.2 3.5 0.5 2.4
EBITDA 124 143 -13.3 294 313 -6.1 499 518
Margin, % 9.0 10.7 10.5 11.5 9.2 9.7
EBITA 64 85 -24.7 175 196 -10.7 262 283
Margin, % 4.6 6.4 6.2 7.2 4.8 5.3
Net capital expenditures -39 -57 -63 -98 -209 -244
In % of net sales 2.8 4.3 2.2 3.6 3.9 4.6
• Continued outpatient growth despite a negative calendar effect
and weaker private market growth (-3% reduction to last year)
• Organic sales growth and result was impacted by a price effect
of MSEK -33 in H1 and the lower private market growth
• Focus on adjusting resources to the current market growth.
Initiated cost savings estimated to MEUR 6. Improvement
expected in Q4 2017 with full year pace from Q1 2018
• Due to the private market drop, we no longer expect to reach
an unchanged EBITA margin for the full year 2017. EBITA
margin in Q4 2017 expected to exceed Q4 2016
Capio AB (publ) 8
Segment – Capio France
Capio’s organic sales
growth expected to recover 2017-07-21
Capio AB (publ) 9
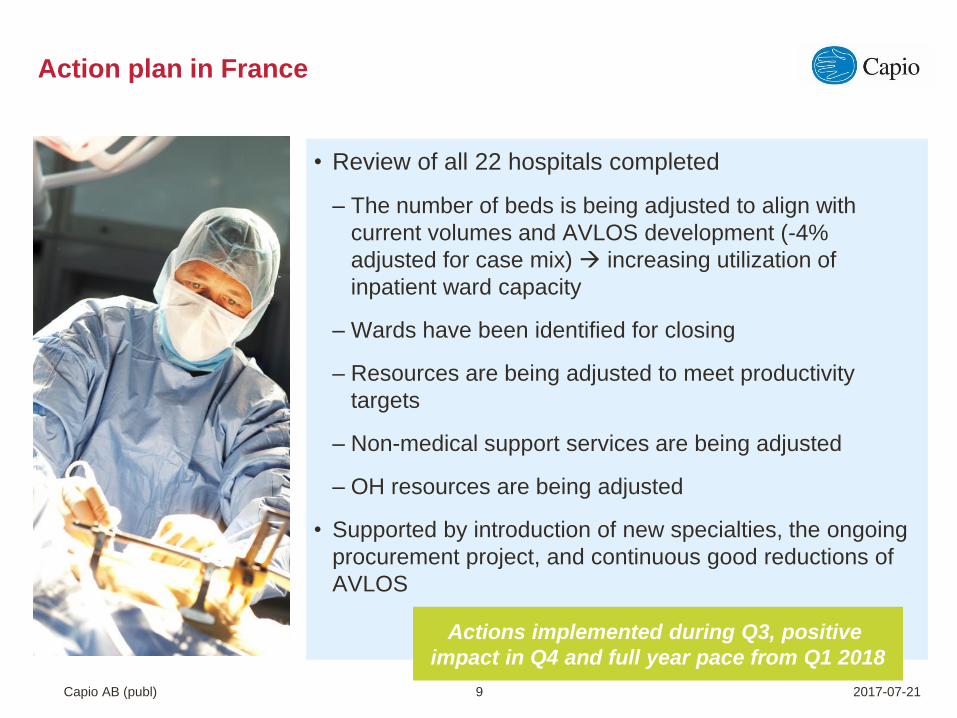
Action plan in France
• Review of all 22 hospitals completed
– The number of beds is being adjusted to align with
current volumes and AVLOS development (-4%
adjusted for case mix) increasing utilization of
inpatient ward capacity
– Wards have been identified for closing
– Resources are being adjusted to meet productivity
targets
– Non-medical support services are being adjusted
– OH resources are being adjusted
• Supported by introduction of new specialties, the ongoing
procurement project, and continuous good reductions of
AVLOS
2017-07-21
Actions implemented during Q3, positive
impact in Q4 and full year pace from Q1 2018

Capio Germany APR - JUN JAN - JUN FULL YEAR
2017 2016 ∆, % 2017 2016 ∆, % RTM 2016
Net sales 291 287 1.4 618 599 3.2 1,191 1,172
Organic sales growth, % -4.6 8.6 0.2 4.9 1.5 4.0
EBITDA 12 19 -36.8 57 57 0.0 108 108
Margin, % 4.1 6.6 9.2 9.5 9.1 9.2
EBITA 4 13 -69.2 43 45 -4.4 81 83
Margin, % 1.4 4.5 7.0 7.5 6.8 7.1
Net capital expenditures -14 -5 -18 -15 -38 -35
In % of net sales 4.8 1.7 2.9 2.5 3.2 3.0
• Outpatient growth, driven by the introduction of new medical
specialties and authorizations in 2017
• Fewer working days compared to 2016 combined with
cancellations of planned surgeries at the end of the quarter
burden growth and margins in Q2 and H1 2017
• Volume growth expected to recover in H2 2017
• The acquisition of the eye specialist clinic in Bremen included
from Q2
Capio AB (publ) 10
Segment – Capio Germany
Increased focus on Modern
Medicine drives AVLOS reduction 2017-07-21

Capio AB (publ) 11
Cash flow
• Net capex RTM June 2017 well in line with the target level of 3.0%. Some
divestments planned for 2016 realized in 2017
• Working capital impacted by higher activity and timing of payments. In 2016 cash
flow was negatively impacted by a change in timing of payments of social security
charges in France
• Income tax payments and financial items increase to last year mainly related to the
acquisitions made
RTM net capex back at
target level2017-07-21
APR - JUN JAN - JUN FULL YEAR
Capio Group 2017 2016 2017 2016 RTM 2016
Net debt opening -3,255 -3,009 -2,872 -2,936 -2,941 -2,936 EBITA 142 172 374 367 651 644 Capital expenditure -85 -114 -163 -211 -416 -464 Divestments of fixed assets 0 1 11 2 15 6
Net capital expenditure -85 -113 -152 -209 -401 -458
In % of net sales 2.2 3.2 1.9 2.9 2.7 3.3 Add-back depreciation 114 104 224 205 436 417
Net investments 29 -9 72 -4 35 -41 Change in working capital -44 93 -174 -88 -212 -126
Operating cash flow 127 256 272 275 474 477
Cash conversion, % 89.4 148.8 72.7 74.9 72.8 74.1
Free cash flow after financial items and tax 75 214 189 203 327 341
Cash conversion, % 52.8 124.4 50.5 55.3 50.2 53.0

2017
2016
Capio Group 30 Jun 31 Dec 30 Jun
Operating capital employed 1,669 1,554 1,472
In % of net sales 11.4 11.0 10.7
Other capital employed 7,481 6,790 6,734
Capital employed 9,150 8,344 8,206
Return on capital employed, % 7.1 7.7 7.7
Net debt 3,563 2,872 2,941
Financial leverage 3.3 2.7 2.8
Equity 5,587 5,472 5,265
Financing 9,150 8,344 8,206
Capio AB (publ) 12
Capital employed & financing
• Operating capital employed above year-end 2016, mainly due
to the consolidation of the recent acquisitions, higher activity
and changes in F/X
• Consolidation of recent acquisitions impact other capital
employed
• ROCE positively impacted by the improvement in EBITA and
negatively by effects from acquisitions
• Financial leverage at 3.3x impacted by the net cash flow
(including acquisition/divestment outflows of MSEK -680 and
dividend paid of MSEK -127) Solid financial position –
ready for more acquisitions2017-07-21
Net debt and financial leverage
2.0
2.5
3.0
3.5
4.0
2,000
2,500
3,000
3,500
4,000
Q2 Q3 Q4 Q1 Q2
2016 2017
Net debt
Financial leverage
MSEK x

Capio AB (publ) 13
Financial targets
2017-07-21
• Organic sales growth in line with estimated market
growth in Nordic and France. Organic sales growth in
Germany in 2017 was below market growth following
timing of seasonal effects in the specialist clinics
• Completed acquisitions are increasing the pace of total
sales growth
• Productivity improvements, volume growth, and
acquisitions impacted the result development positively.
The lower organic sales growth in France and Germany
in the first six months impacted the leverage negatively
• Contribution from the acquired businesses was in line
with expectations
• Net capital expenditures in % of net sales was 2.7%
(RTM), which was well in line with the target
Quarterly development 20151-2017 (RTM) Target and development
The target is to grow organically at least in line with the market and add acquisition growth at least at a similar rate over time
Total sales growth 8.6% and organic sales growth 1.9% (Jan-Jun 2017)
Organic sales growth well in line with estimated market growth in the Nordic and French segments. Organic sales growth in Germany in the first six months was below market growth following timing of seasonal effects in the specialist clinics
Completed acquisitions are increasing the pace of total sales growth
Quarterly development 20151-2017 (RTM) Target and development
The target is to grow operating result at a higher rate than sales growth through increased productivity and operational leverage
EBITDA increased by 4.5% (Jan-Jun 2017)
Productivity improvements, volume growth, and acquisitions impacted the result development positively. The lower organic sales growth in France and Germany in the first six months impacted leverage negatively
Contribution from the acquired businesses was in line with expectations
Quarterly development 2015-2017 (RTM) Target and development
The target with present business mix is to keep net capex around 3% of net sales per year including Modern Medicine and expansion related capex
Net capital expenditures in % of net sales was 2.7% (RTM), which was well in line with the target
0
2
4
6
8
10
10,000
11,000
12,000
13,000
14,000
15,000
Q1 Q2 Q3 Q4 Q1 Q2 Q3 Q4 Q1 Q2
2015 2016 2017
Net sales Organic sales growth, %
Total sales growth, %
MSEK %
4
5
6
7
8
9
700
800
900
1,000
1,100
1,200
Q1 Q2 Q3 Q4 Q1 Q2 Q3 Q4 Q1 Q2
2015 2016 2017
EBITDA Margin, %
MSEK %
0
1
2
3
4
5
0
100
200
300
400
500
Q1 Q2 Q3 Q4 Q1 Q2 Q3 Q4 Q1 Q2
2015 2016 2017
Net capital expenditure In % of sales
MSEK %

Capio AB (publ) 14
Financial calendar
• EGM on August 22 to elect
new board member in Capio AB
(publ)
• Next financial report:
Interim report January –
September 2017 is due October
27, 2017
2017-07-21

Capio AB (publ) 15
Questions and Answers
2017-07-21

www.capio.com


