INTERIM REPORT JANUARY–MARCH 2021 Page 1 of 23 Q1 Interim report, January – March 2021 January – March 2021 • Net sales increased by 106 percent to SEK 3,349.9 million (1,624.2). Organic growth in local currency was 38 percent. • Gross profit increased by 84 percent to SEK 820.0 million (446.7). Organic growth in local currency was 24 percent. • Adjusted EBITDA 1 increased by 30 percent to SEK 240.3 million (184.3). Excluding currency effects and costs for share-based incentive programs, the increase would have been 52 percent. • Adjusted EBIT 2 amounted to SEK 215.0 million (168.8). • Profit after tax for the quarter amounted to SEK 140.8 million (96.4). • Diluted earnings per share were SEK 2.12 (1.74). ”We deliver at scale and handled 40 billion mobile messages in Q1 alone. We reap the benefits of a global platform but recognise the importance of local presence.” – Oscar Werner, VD Significant events during the quarter • Sinch closed the acquisition of Wavy on 1 February for total cash consideration of BRL 355 million and 1,534,582 new shares in Sinch. The acquisition was financed with a combination of existing cash reserves and debt facilities. Wavy is a leading supplier of messaging services in Latin America with a leading position in next-generation conversational messaging. Wavy operates in Brazil, Mexico, Colombia, Peru, Chile, Argentina and Paraguay. • Sinch’s products within Business Support Systems (BSS) for mobile operators were sold on 1 February 2021 to eRate, a Norway- based telecommunications specialist focused on solutions in billing and rating. • On 17 February 2021, Sinch announced that it had closed an agreement to acquire Inteliquent, the largest independent voice communications provider in the US, for total cash consideration of USD 1,140 million on a cash and debt-free basis. The acquisition establishes Sinch as the leader in voice connectivity for both enterprises and telecom carriers in the US. Inteliquent powers voice communications for the leading communication service providers and enterprises in North America. The company operates a fully redundant, geodiverse, carrier-grade Tier 1 network that is directly connected to telecom carriers that cover 94 percent of the US population. • Covid-19 is still having negative impact on the small Voice and Video segment. The overall financial impact on the Sinch Group remains modest, however, because volumes in Messaging have increased in parallel. 1 EBITDA before depreciation, amortization and impairments excluding items affecting comparability. See page 3 for a specification of items affecting comparability. 2 EBIT excluding items affecting comparability and depreciation and amortization of acquisition-related assets. See Note 4 for a specification of depreciation and amortization. Invitation to conference call Sinch will present the interim report in a webcasted conference call on 28 April at 14:00 CEST. Watch the presentation at investors.sinch.com/webcast or call and register a couple of minutes in advance. Sweden: +46 (0) 8 566 42 651 United Kingdom: +44 333 30 00 804 United States: +1 631 913 1422 Access code: 892 718 64#
Transcript
INTERIM REPORT JANUARY–MARCH 2021 Page 1 of 23
Q1
Interim report, January – March 2021
January – March 2021
• Net sales increased by 106 percent to SEK 3,349.9 million (1,624.2). Organic growth in local currency was 38 percent.
• Gross profit increased by 84 percent to SEK 820.0 million (446.7). Organic growth in local currency was 24 percent.
• Adjusted EBITDA1 increased by 30 percent to SEK 240.3 million (184.3). Excluding currency effects and costs for share-based incentive programs, the increase would have been 52 percent.
• Adjusted EBIT2 amounted to SEK 215.0 million (168.8).
• Profit after tax for the quarter amounted to SEK 140.8 million (96.4).
• Diluted earnings per share were SEK 2.12 (1.74).
”We deliver at scale and handled 40 billion mobile messages in Q1 alone. We reap the benefits of a global platform but recognise the importance of local presence.” – Oscar Werner, VD
Significant events during the quarter
• Sinch closed the acquisition of Wavy on 1 February for total cash consideration of BRL 355 million and 1,534,582 new shares in Sinch. The acquisition was financed with a combination of existing cash reserves and debt facilities. Wavy is a leading supplier of messaging services in Latin America with a leading position in next-generation conversational messaging. Wavy operates in Brazil, Mexico, Colombia, Peru, Chile, Argentina and Paraguay.
• Sinch’s products within Business Support Systems (BSS) for mobile operators were sold on 1 February 2021 to eRate, a Norway-based telecommunications specialist focused on solutions in billing and rating.
• On 17 February 2021, Sinch announced that it had closed an agreement to acquire Inteliquent, the largest independent voice communications provider in the US, for total cash consideration of USD 1,140 million on a cash and debt-free basis. The acquisition establishes Sinch as the leader in voice connectivity for both enterprises and telecom carriers in the US. Inteliquent powers voice communications for the leading communication service providers and enterprises in North America. The company operates a fully redundant, geodiverse, carrier-grade Tier 1 network that is directly connected to telecom carriers that cover 94 percent of the US population.
• Covid-19 is still having negative impact on the small Voice and Video segment. The overall financial impact on the Sinch Group remains modest, however, because volumes in Messaging have increased in parallel.
1 EBITDA before depreciation, amortization and impairments excluding items affecting comparability. See page 3 for a specification of
items affecting comparability. 2 EBIT excluding items affecting comparability and depreciation and amortization of acquisition-related assets. See Note 4 for a
specification of depreciation and amortization.
Invitation to conference call Sinch will present the interim report in a webcasted conference call on 28 April at 14:00 CEST. Watch the presentation at investors.sinch.com/webcast or call and register a couple of minutes in advance.
Sweden: +46 (0) 8 566 42 651 United Kingdom: +44 333 30 00 804 United States: +1 631 913 1422
Message from the CEO Growth and integration More so than ever, businesses are finding that a great customer experience is the key to growth and success in marketplace. Our technology lets businesses engage with customers in ways that are welcomed, appreciated, timely and timesaving.
We deliver at scale and handled 40 billion mobile messages in Q1 alone. We reap the benefits of a global platform but recognize the importance of local presence. No other CPaaS vendor matches our footprint with local customers and hundreds of employees across North America, Latin America, Europe, and Asia. This makes us uniquely well placed to serve demanding, global businesses who value quality, dependability, and regulatory compliance.
The first quarter saw continued strong growth in gross profit with Adjusted EBITDA rising less rapidly due to currency effects, costs for incentive programs, and because we invest to prepare our business for further growth. We expect this trend to continue in the short term as we invest in scalability. Before we extract synergies, acquired businesses also operate at lower margins than the rest of Sinch.
Gross profit in the first quarter was 84 percent higher than the same period last year. Organic growth was 24 percent, acquired businesses contributed 65 percent, and currency movements had a negative impact of 6 percent. Since passthrough fees vary significantly between products and geographies, we believe growth in gross profit is a more meaningful metric than revenue growth to track our performance.
Adjusted EBITDA in the quarter was 30 percent higher than the same quarter the year before. Costs for incentive programs totalled SEK 28.6 million in the quarter, an increase from SEK 3.1 million in Q1 2020, due to the recent increase in the Sinch share price. Excluding this cost item and the negative impact of currency movements, Adjusted EBITDA in Q1 would have increased by 52 percent compared to the same period last year.
Our Messaging segment continues to perform well with organic gross profit growth of 32 percent and 85 percent growth overall in the first quarter. It is particularly encouraging that we now see more broad-based growth, across different customer segments and geographies, in addition to the growth from our largest and most strategic customers.
Gross profit in our smaller Voice and video segment contracted compared to last year as renewed lockdowns reduced transaction volumes and triggered renegotiations with customers in the ride hailing segment. Adjusted EBITDA was negative as we prepare for upcoming integration with Inteliquent, the landmark acquisition that will establish Sinch as a leader in voice communications.
The regulatory approval process is progressing well and we remain optimistic that we can close the transaction in H2 2021.
Our Operator business has expanded significantly compared to last year following the acquisition of SAP Digital Interconnect in November. Gross profit and Adjusted EBITDA have nearly doubled with stable underlying performance despite some volatility between quarters.
Integration remains a key focus with multiple tracks and workstreams running in tandem. Commercial teams from Sinch and SDI now work side by side in a joint organization and Wavy was rebranded to Sinch just eight weeks after the transaction closed. Work to migrate acquired customers and suppliers to our shared global platform has been initiated and is developing as planned.
Whereas the financial impact of the Covid-19 pandemic remains manageable, teams in many countries face an unprecedented strain as colleagues, friends and family members contract the disease. This is particularly true for Brazil and India, where we are doing our best to support our employees in this challenging time. I continue to be impressed and grateful for the hard work and cooperative spirit now so evident across our business.
Stockholm, 28 April 2021
Oscar Werner President and Chief Executive Officer
INTERIM REPORT JANUARY–MARCH 2021 Page 3 of 23
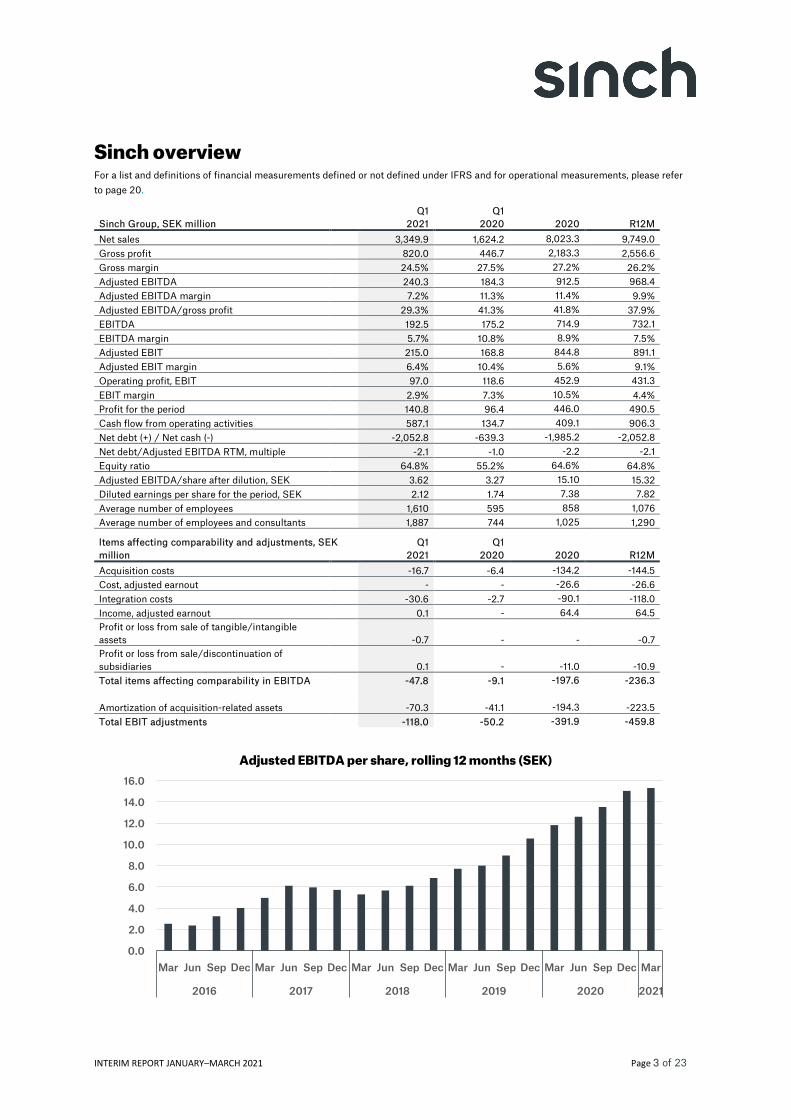
Sinch overview For a list and definitions of financial measurements defined or not defined under IFRS and for operational measurements, please refer to page 20.
Sinch Group, SEK million Q1
2021 Q1
2020
2020 R12M Net sales 3,349.9 1,624.2 8,023.3 9,749.0 Gross profit 820.0 446.7 2,183.3 2,556.6 Gross margin 24.5% 27.5% 27.2% 26.2% Adjusted EBITDA 240.3 184.3 912.5 968.4 Adjusted EBITDA margin 7.2% 11.3% 11.4% 9.9% Adjusted EBITDA/gross profit 29.3% 41.3% 41.8% 37.9% EBITDA 192.5 175.2 714.9 732.1 EBITDA margin 5.7% 10.8% 8.9% 7.5% Adjusted EBIT 215.0 168.8 844.8 891.1 Adjusted EBIT margin 6.4% 10.4% 5.6% 9.1% Operating profit, EBIT 97.0 118.6 452.9 431.3 EBIT margin 2.9% 7.3% 10.5% 4.4% Profit for the period 140.8 96.4 446.0 490.5 Cash flow from operating activities 587.1 134.7 409.1 906.3 Net debt (+) / Net cash (-) -2,052.8 -639.3 -1,985.2 -2,052.8 Net debt/Adjusted EBITDA RTM, multiple -2.1 -1.0 -2.2 -2.1 Equity ratio 64.8% 55.2% 64.6% 64.8% Adjusted EBITDA/share after dilution, SEK 3.62 3.27 15.10 15.32 Diluted earnings per share for the period, SEK 2.12 1.74 7.38 7.82 Average number of employees 1,610 595 858 1,076 Average number of employees and consultants 1,887 744 1,025 1,290
Items affecting comparability and adjustments, SEK million
Q1 2021
Q1 2020
2020 R12M
Acquisition costs -16.7 -6.4 -134.2 -144.5 Cost, adjusted earnout - - -26.6 -26.6 Integration costs -30.6 -2.7 -90.1 -118.0 Income, adjusted earnout 0.1 - 64.4 64.5 Profit or loss from sale of tangible/intangible assets -0.7 - - -0.7 Profit or loss from sale/discontinuation of subsidiaries 0.1 -
-11.0
-10.9
Total items affecting comparability in EBITDA -47.8 -9.1 -197.6 -236.3
Amortization of acquisition-related assets -70.3 -41.1 -194.3 -223.5 Total EBIT adjustments -118.0 -50.2 -391.9 -459.8
Adjusted EBITDA per share, rolling 12 months (SEK)
0.0
2.0
4.0
6.0
8.0
10.0
12.0
14.0
16.0
Mar Jun Sep Dec Mar Jun Sep Dec Mar Jun Sep Dec Mar Jun Sep Dec Mar Jun Sep Dec Mar
Total adjustments in EBIT -33.3 -30.9 -45.0 -42.8 -50.2 -73.5 -55.5 -212.7 -118.0
INTERIM REPORT JANUARY–MARCH 2021 Page 5 of 23
January–March 2021 Net sales Consolidated net sales grew in the period by 106 percent to SEK 3,349.9 million (1,624.2). Amounts in parentheses refer to the corresponding quarter in the preceding year. Organic growth, in local currency and excluding acquisitions, was 38 percent. The acquisitions of Chatlayer, ACL, SDI, and Wavy contributed 78 percent. Chatlayer contributed SEK 6.5 million, ACL SEK 215.3 million, SDI SEK 890.4 million and Wavy 151.8 million.
Growth was negatively affected during the quarter by the appreciation of the Swedish krona (SEK), primarily against EUR, USD and GBP. The Group has significant revenues in foreign currency and if exchange rates had been the same during the quarter as in the same quarter in 2019, revenues would have been about SEK 147 million higher. The negative currency effect on consolidated net sales was thus 9 percent.
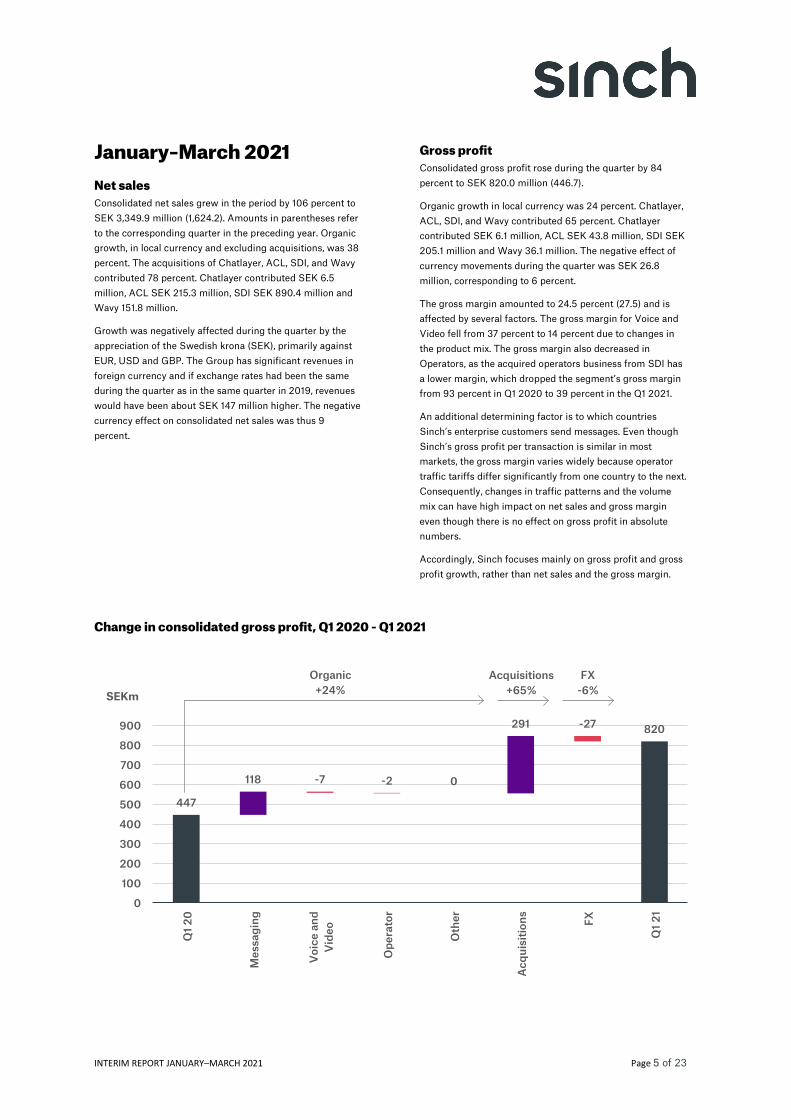
Gross profit Consolidated gross profit rose during the quarter by 84 percent to SEK 820.0 million (446.7).
Organic growth in local currency was 24 percent. Chatlayer, ACL, SDI, and Wavy contributed 65 percent. Chatlayer contributed SEK 6.1 million, ACL SEK 43.8 million, SDI SEK 205.1 million and Wavy 36.1 million. The negative effect of currency movements during the quarter was SEK 26.8 million, corresponding to 6 percent.
The gross margin amounted to 24.5 percent (27.5) and is affected by several factors. The gross margin for Voice and Video fell from 37 percent to 14 percent due to changes in the product mix. The gross margin also decreased in Operators, as the acquired operators business from SDI has a lower margin, which dropped the segment’s gross margin from 93 percent in Q1 2020 to 39 percent in the Q1 2021.
An additional determining factor is to which countries Sinch’s enterprise customers send messages. Even though Sinch’s gross profit per transaction is similar in most markets, the gross margin varies widely because operator traffic tariffs differ significantly from one country to the next. Consequently, changes in traffic patterns and the volume mix can have high impact on net sales and gross margin even though there is no effect on gross profit in absolute numbers.
Accordingly, Sinch focuses mainly on gross profit and gross profit growth, rather than net sales and the gross margin.
Change in consolidated gross profit, Q1 2020 - Q1 2021
447
118 -7 -2 0
291 -27 820
0
100
200
300
400
500
600
700
800
900
Q1 2
0
Mes
sagi
ng
Voi
ce a
ndV
ideo
Ope
rato
r
Oth
er
Acq
uisi
tions FX
Q1 2
1
Organic+24%SEKm
FX-6%
Acquisitions+65%
INTERIM REPORT JANUARY–MARCH 2021 Page 6 of 23
EBITDA Operating profit before interest, tax, depreciation and amortization (EBITDA) amounted to SEK 192.5 million (175.2).
EBITDA excluding items affecting comparability1 (adjusted EBITDA) increased by SEK 56.0 million to SEK 240.3 million (184.3), corresponding to an increase of 30 percent.
Costs related to share incentive programs burdened EBITDA and Adjusted EBITDA by SEK -28.6 million (-3.0).
The aggregate negative impact of currency movements on EBITDA of SEK -8.0 million (18.3). Out of this amount, currency effects arising from remeasurements of balance sheet items were SEK -0.1 million (9.7).
Excluding costs related to incentive programs and currency effects, Adjusted EBITDA in the first quarter would have increased by 52 percent compared to the same quarter last year.
The Group’s financial target is growth of Adjusted EBITDA per share of 20 percent on an annual basis. Adjusted EBITDA per share was SEK 3.62 (3.27) for the quarter and SEK 15.32 SEK (11.76) for the rolling twelve months, an increase of 30 percent. Adjusted EBITDA divided by gross profit was 29.3 percent (41.3) for the quarter.
Operating profit, EBIT EBIT amounted to SEK 97.0 million (118.6).
Acquisition-related amortization, which does not affect cash flow, reduced EBIT by SEK 70.3 million (41.1). The depreciation and amortization arose mainly from planned amortization of acquired customer relationships and acquired software. See Note 4.
Adjusted EBIT (EBIT excluding items affecting comparability and amortization of acquisition-related assets) amounted to SEK 215.0 million (168.8).
Other income and expense items Net financial income was SEK 88.9 million (12.1), with interest costs amounting to SEK -11.0 million (-8.6) and foreign exchange differences to SEK 111.5 million (22.8). The Group's effective tax rate was 24.3 percent (26.3). See Note 5 for a reconciliation of tax on profit or loss for the period. Net profit for the period amounted to SEK 140.8 million (96.4).
Investments Net investments in property, plant and equipment and intangible assets amounted to SEK 488.5 million (20.0). The increase is primarily attributable to acquisitions. The investments include development expenditure of SEK 18.7 million (15.2).
Cash flow, liquidity and financial position Cash flow from operating activities amounted to SEK 587.1 million (134.7). Consolidated cash and cash equivalents at 31 March 2021 amounted to SEK 3,199.6 million (2,040.7).
Sinch’s credit facilities comprise a total commitment of SEK 1,850 million. In addition, Sinch has access to an overdraft facility of SEK 200 million. As of 31 March 2021, the overdraft had not been utilized (-). The credit facilities are conditional upon the company’s fulfillment of a number of agreed covenants.
Net debt amounted to SEK -2,052.8 million (-639.3). Net debt in relation to Adjusted EBITDA RTM amounted to -2.1 (-1.0).
Equity at 31 March 2021 amounted to SEK 9,824.7 million (3,628.9), corresponding to an equity ratio of 64.8 percent (55.2). Equity per share amounted to SEK 151.1 (61.6).
Employees At the end of the quarter, the Group employed 2,160 (766) people, including consultants. The average for the quarter was 1,887 (744). The average number of employees (full-time equivalents, excluding consultants) was 1,610 (595), of whom 26 percent (28) women. Sinch continues to recruit in Sweden and internationally. 1) Details are provided in the table on page 3 and in
Note 4.
INTERIM REPORT JANUARY–MARCH 2021 Page 7 of 23
Messaging With Sinch’s cloud communications platform, businesses can reach their customers and employees directly in their mobile phone within a second or two. The messages are sent as SMS (text messages) or using next-generation technologies like WhatsApp and RCS. The product segment includes software for AI-based interactive communication and technology for personalized video messaging, where unique video messages are customized for each and every recipient.
Sinch Messaging makes it possible for enterprises to reach consumers with automated, business-critical messages. Sinch has purposefully built up a leading market position based on quality, cost-effectiveness and economies of scale. That puts Sinch in prime position to defy fierce competition and win organic market shares and continue consolidating the market through acquisitions.
Sinch closed the acquisition of SAP Digital Interconnect (SDI) on 1 November. The acquisition brought 1,500 enterprise customers to Sinch, including several of the most highly valued tech companies, banks, payment service providers, retailers and mobile operators. A comprehensive project is ongoing to integrate the acquired business, accelerate its growth and mine economies of scale.
On 1 February, the acquisition of Wavy was also closed. Wavy is a leading enterprise messaging provider in Latin America that operates in seven countries and has carried out a successful initiative within next-generation messaging. During the first quarter, the Wavy business was combined with TWW, one of the largest messaging services providers in Brazil, which Sinch acquired in late 2019.
In the second half of 2020, Sinch launched a new product that simplifies management of interactive communication across popular messaging channels like WhatsApp, RCS, Viber and SMS. Sinch Conversation API offers all of these services in a common API, eliminating the complexity that managing multiple parallel communications challenges otherwise presents to enterprises. In addition, it provides a clearly better user experience to the end user when communication with a business can continue between different channels with no interruptions and without unnecessary repetitions. We see great potential in the next-generation, conversational messaging even though the market is still in an early phase.
Transaction volume The number of sent messages rose sharply through the acquisitions of ACL Mobile in September 2020 and SDI in November 2020, and again in February 2021 with the acquisition of Wavy. Seasonal effects in March had positive impact on volume in India. Overall, transaction volume in the first quarter rose by 327 percent compared to the same quarter last year and Sinch handled more than 15 billion messages in March. The increase in comparable units was 47 percent compared to the corresponding quarter last year.
Number of transactions (billions per month)
0.0
2.0
4.0
6.0
8.0
10.0
12.0
14.0
16.0
2017 2018 2019 2020 2021
ACL
SDI
Wavy
INTERIM REPORT JANUARY–MARCH 2021 Page 8 of 23
Net sales During the quarter, net sales increased by SEK 1,548.7 million compared to the corresponding period in 2020 to SEK 3,083.0 million (1,534.2), an increase of 101 percent. Of this increase, 69 percentage points are attributable to acquisitions and -9 percentage points to currency movements. Organic growth in local currency was 40.9 percent. Acquisitions contributed as follows: Chatlayer, SEK 6.5 million; ACL, SEK 215.3 million; SDI, SEK 682.2 million; and Wavy, SEK 152.2 million.
Sinch’s targeted focus on large, strategic customers and initiatives towards increased growth in other customer segments had positive impact on organic growth in net sales. Commercial partnerships between Sinch and large, multinational cloud platform providers that use products from Sinch for automated mobile marketing are a key growth driver.
Gross profit Gross profit increased during the quarter to SEK 691.1 million (374.3), an increase of 85 percent compared to the same quarter in the preceding year. Of this increase, 58 percentage points are attributable to acquisitions and -5 percentage points to currency movements. Organic growth in local currency was 32 percent. Acquisitions contributed as follows: Chatlayer, SEK 6.1 million; ACL, SEK 43.8 million; SDI, SEK 130.6 million; and Wavy, SEK 63.1 million.
Overall, we are seeing a persistently strong trend in North America and rising growth in Europe. It should be noted, however, that the strong development in North America is partly due to that many large, global tech firms are based in the US. Although these companies have local operations all over the world, their revenues are reported in the US because Sinch’s geographical reporting is based on the location of the customer’s headquarters.
Even though Sinch’s gross profit per transaction is similar in most markets, the gross margin varies widely from country to country. This is because operator traffic tariffs differ substantially from one country to the next. Consequently, changes in traffic patterns and the volume mix can have high impact on net sales and gross margin even though there is no effect on gross profit in absolute numbers. For this reason, Sinch focuses on gross profit per transaction, not gross margin, as the guiding performance measurement. The gross margin fell by 2.0 percent in the first quarter compared to the same period in the preceding year. The change is partly attributable to acquisitions, as Chatlayer, ACL and SDI had an aggregate negative effect of 1.0 percentage points on the gross margin.
Adjusted EBITDA Compared to the corresponding quarter in 2020, Adjusted EBITDA increased by SEK 106.6 million in the first quarter to SEK 283.4 million (176.8), an increase of 60 percent. The aggregate effect of currency movements was negative and affected EBITDA by -1 percent.
Sinch’s financial focus is to grow gross profit and EBITDA in absolute numbers. As one aspect of this work, the company measures several key performance indicators linked to cost efficiency and scalability. As these performance indicators are calculated per transaction, however, they are clearly impacted by acquisitions with a different financial profile. Sinch consolidated operations in ACL Mobile from 1 September, which limits comparability before and after that date. ACL benefits from economies of scale due to its competitive cost base combined with high transaction volumes, resulting in substantially lower OPEX per transaction. At the same time, gross profit per transaction for traffic within India is considerably lower than in western markets due to generally lower costs in the country.
Gross profit/transaction and OPEX/transaction (SEK)
EBITDA in relation to gross profit is a key measurement of efficiency and scalability. The measurement shows the underlying margin and is not affected by changes in operator traffic tariffs. The margin is normally somewhat lower in the first quarter because the seasonal pattern in the cost base diverges from the seasonal pattern in gross profit.
Adjusted EBITDA/gross profit is also affected by acquisitions. Profitability is lower in the acquired business from SDI than in Sinch, which reduced Adjusted EBITDA/gross profit by -3.3 percentage points during the quarter. Aimed at accelerating growth in the acquired business, Sinch is also taking several future-oriented initiatives, which may further increase costs in the short term. In parallel, Sinch is working determinedly to realize synergies in acquired businesses by migrating customers to the shared Sinch technology platform, a process that is expected to improve the margin profile when complete.
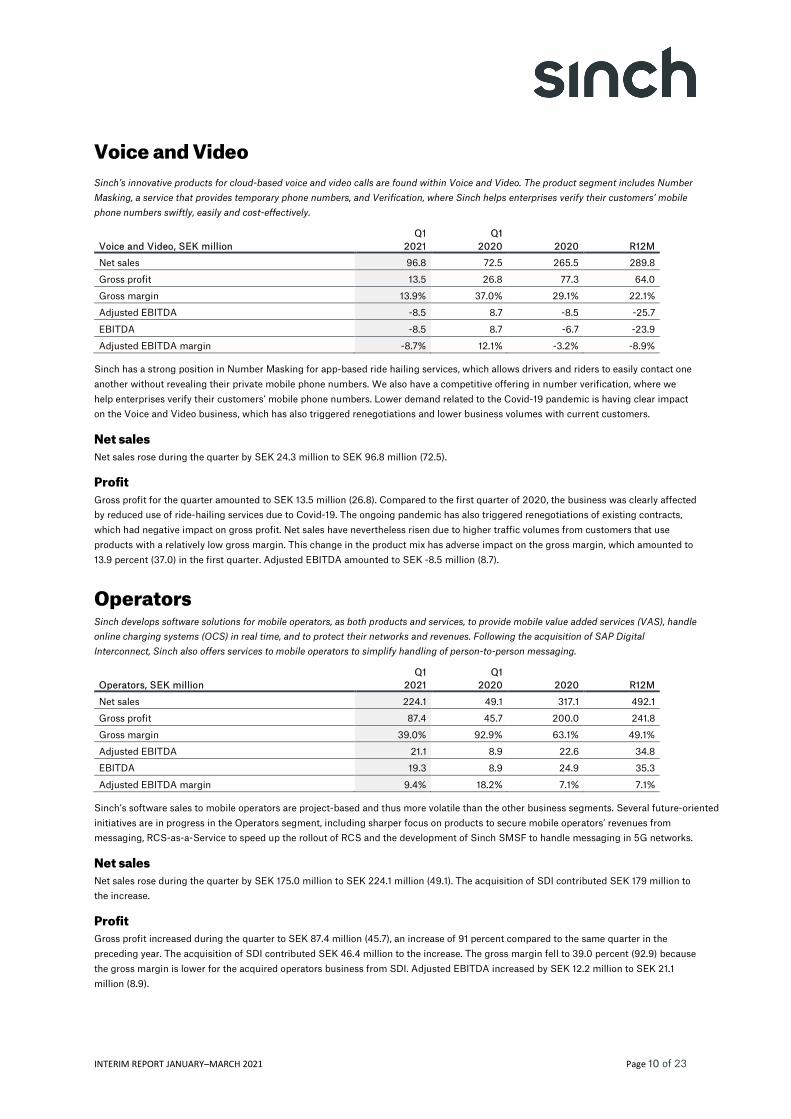
Voice and Video Sinch’s innovative products for cloud-based voice and video calls are found within Voice and Video. The product segment includes Number Masking, a service that provides temporary phone numbers, and Verification, where Sinch helps enterprises verify their customers’ mobile phone numbers swiftly, easily and cost-effectively.
Voice and Video, SEK million Q1
2021 Q1
2020
2020
R12M
Net sales 96.8 72.5 265.5 289.8
Gross profit 13.5 26.8 77.3 64.0
Gross margin 13.9% 37.0% 29.1% 22.1%
Adjusted EBITDA -8.5 8.7 -8.5 -25.7
EBITDA -8.5 8.7 -6.7 -23.9
Adjusted EBITDA margin -8.7% 12.1% -3.2% -8.9%
Sinch has a strong position in Number Masking for app-based ride hailing services, which allows drivers and riders to easily contact one another without revealing their private mobile phone numbers. We also have a competitive offering in number verification, where we help enterprises verify their customers’ mobile phone numbers. Lower demand related to the Covid-19 pandemic is having clear impact on the Voice and Video business, which has also triggered renegotiations and lower business volumes with current customers.
Net sales Net sales rose during the quarter by SEK 24.3 million to SEK 96.8 million (72.5).
Profit Gross profit for the quarter amounted to SEK 13.5 million (26.8). Compared to the first quarter of 2020, the business was clearly affected by reduced use of ride-hailing services due to Covid-19. The ongoing pandemic has also triggered renegotiations of existing contracts, which had negative impact on gross profit. Net sales have nevertheless risen due to higher traffic volumes from customers that use products with a relatively low gross margin. This change in the product mix has adverse impact on the gross margin, which amounted to 13.9 percent (37.0) in the first quarter. Adjusted EBITDA amounted to SEK -8.5 million (8.7).
Operators Sinch develops software solutions for mobile operators, as both products and services, to provide mobile value added services (VAS), handle online charging systems (OCS) in real time, and to protect their networks and revenues. Following the acquisition of SAP Digital Interconnect, Sinch also offers services to mobile operators to simplify handling of person-to-person messaging.
Operators, SEK million Q1
2021 Q1
2020
2020 R12M
Net sales 224.1 49.1 317.1 492.1
Gross profit 87.4 45.7 200.0 241.8
Gross margin 39.0% 92.9% 63.1% 49.1%
Adjusted EBITDA 21.1 8.9 22.6 34.8
EBITDA 19.3 8.9 24.9 35.3
Adjusted EBITDA margin 9.4% 18.2% 7.1% 7.1%
Sinch’s software sales to mobile operators are project-based and thus more volatile than the other business segments. Several future-oriented initiatives are in progress in the Operators segment, including sharper focus on products to secure mobile operators’ revenues from messaging, RCS-as-a-Service to speed up the rollout of RCS and the development of Sinch SMSF to handle messaging in 5G networks.
Net sales Net sales rose during the quarter by SEK 175.0 million to SEK 224.1 million (49.1). The acquisition of SDI contributed SEK 179 million to the increase.
Profit Gross profit increased during the quarter to SEK 87.4 million (45.7), an increase of 91 percent compared to the same quarter in the preceding year. The acquisition of SDI contributed SEK 46.4 million to the increase. The gross margin fell to 39.0 percent (92.9) because the gross margin is lower for the acquired operators business from SDI. Adjusted EBITDA increased by SEK 12.2 million to SEK 21.1 million (8.9).
INTERIM REPORT JANUARY–MARCH 2021 Page 11 of 23
Condensed income statement
Sinch Group, SEK million Note Q1
2021 Q1
2020
2020 R12M Net sales 3,349.9 1,624.2 8,023.3 9,749.0 Cost of goods sold and services -2,529.8 -1,177.5 -5,840.0 -7,192.4 Gross profit 820.0 446.7 2,183.3 2,556.6
Other operating income 32.6 32.9 197.8 197.5 Work performed by the entity and capitalized 18.7 15.2 69.4 72.9 Other external costs -238.1 -110.7 -683.0 -821.7 Employee benefits expenses -400.0 -184.2 -869.4 -1,085.2 Other operating expenses -40.7 -24.7 -183.2 -188.0 EBITDA 192.5 175.2 714.9 732.1
R12M Profit for the period 140.8 96.4 446.0 490.5 Other comprehensive income or loss
Items that may subsequently be reclassified to profit or loss for the period
Translation differences 77.8 18.9 -362.1 58.0 Hedge accounting net investment 100.9 -2.2 -146.2 -43.2 Tax effect of items in other comprehensive income -20.7 0.5 32.9 11.7 Other comprehensive income or loss for the period 157.9 17.2 -475.5 26.5 Comprehensive income or loss for the period 298.7 113.6 -32.9 517.0
Attributable to: Owners of the parent 298.7 113.8 -32.8 516.9 Non-controlling interests 0.0 -0.2 -0.1 0.1
INTERIM REPORT JANUARY–MARCH 2021 Page 12 of 23
Condensed balance sheet Sinch Group, SEK million Note 31 Mar 2021 31 Mar 2020 31 Dec 2020
ASSETS Goodwill 5,501.8 1,788.8 3,298.3 Customer relationships 1,766.6 764.1 1,481.2 Operator relationships 191.7 104.4 144.8 Proprietary software 380.6 169.9 322.3 Other intangible non-current assets 19.4 3.5 8.3 Right-of-use assets 55.2 72.3 54.3 Other tangible non-current assets 119.4 30.8 99.7 Non-current financial assets 15.9 13.5 14.1 Deferred tax assets 453.0 230.2 403.9 Total non-current assets 8,503.7 3,177.5 5,827.0 Tax receivables 96.8 15.7 52.8 Other current receivables 3,354.7 1,340.9 2,631.5 Cash and cash equivalents 3,199.6 2,040.7 3,123.0 Total current assets 6,651.1 3,397.4 5,807.4 TOTAL ASSETS
15,154.8 6,574.9 11,634.4
EQUITY AND LIABILITIES Equity attributable to owners of the parent 3 9,824.1 3,628.3 7,512.0 Non-controlling interests 0.6 0.6 0.6 Total equity 9,824.7 3,628.9 7,512.6 Deferred tax liability 638.1 260.1 508.3 Non-current liabilities, interest-bearing 1,060.4 1,115.9 995.6 Non-current liabilities, non-interest-bearing 84.6 139.0 86.3 Total non-current liabilities 1,783.2 1,514.9 1,590.2 Current liabilities, interest-bearing 86.4 285.6 142.2 Provisions 83.1 25.6 79.2 Tax liability 89.0 33.3 36.8 Other current liabilities, non-interest-bearing 3,288.4 1,086.6 2,273.3 Total current liabilities 3,546.9 1,431.1 2,531.6 TOTAL EQUITY AND LIABILITIES
15,154.8 6,574.9 11,634.4
Financial instruments measured at fair value
Derivative instruments with positive fair value 0.3 0.2 - Derivative instruments with negative fair value 0.0 12.1 0.0
The carrying amount is considered to be a reasonable estimate of the fair value of all financial assets and liabilities. The financial assets and liabilities are attributable to measurement levels 2 and 3. For information on the measurement techniques, see Note 28 in the 2020 Annual Report.
Condensed statement of changes in equity Attributable to owners of the parent
Sinch Group, SEK million Share
capital
Other capital contribution
s Reserves Retained earnings Total
Non-controlling
interests Total
equity Opening balance 1 January 2020 5.4 1,390.8 75.3 526.3 1,998.0 0.7 1,998.6 Comprehensive income for the period 17.2 96.5 113.7 -0.1 113.6 New share issue/Warrants 0.5 1,534.5 1,535.0 1,535.0 Issue expenses, net after tax -18.3 -18.3 -18.3 Closing balance 31 March 2020 5.9 2,907.0 92.5 622.8 3,628.3 0.6 3,628.9
Opening balance 1 January 2021 6.3 6,933.6 -400.1 972.2 7,512.0 0.6 7,512.6 Comprehensive income for the period 173.5 140.8 314.3 314.3 New share issue/Warrants 0.2 1,966.1 1,966.3 1,966.3 Issue expenses, net after tax 1.5 1.5 1.5 Closing balance 31 March 2021 6.5 8,931.2 -226.6 1,113.0 9,824.1 0.6 9,824.7
INTERIM REPORT JANUARY–MARCH 2021 Page 13 of 23
Condensed statement of cash flows
Sinch Group, SEK million Note Q1
2021 Q1
2020
2020 R12M Cash flow before changes in working capital 225.8 175.6 602.1 652.3 Change in working capital 361.3 -40.9 -148.2 254.0 Cash flow from operating activities 587.1 134.7 453.9 906.3
Net investments in tangible and intangible assets -488.5 -20.0 -85.6 -554.1 Change in financial receivables 5.8 -0.9 -2.2 4.5 Acquisition of Group companies 6 -505.4 -44.3 -2,884.6 -3,345.7 Cash flow from investing activities -988.1 -65.1 -2,972.4 -3,895.3
Amortization bank loan -17.1 -1.4 -267.2 -282.9 Amortization lease liability -9.9 -6.9 -30.4 -33.4 New share issue/warrants 3 482.6 1,511.2 5,529.0 4,500.4 Cash flow from financing activities 455.6 1,502.9 5,231.4 4,184.1 Cash flow for the period 54.6 1,572.5 2,712.9 1,195.0
Opening balance cash and cash equivalents for the period 3,123.0 466.3 466.3 2,040.7
Exchange rate differences in cash and cash equivalents
22.0 1.9 -56.2 -36.1
Closing balance cash and cash equivalents for the period
3,199.6 2,040.7 3,123.0 3,199.6
Other disclosures
Sinch Group, SEK million Q1
2021 Q1
2020
2020 R12M
Share information
Basic earnings per share, SEK 2.19 1.79 7.62 8.06
Diluted earnings per share, SEK 2.12 1.74 7.38 7.82
Basic weighted average number of shares 64,309,229 53,789,357 58,494,586 60,813,839 Diluted weighted average number of shares 66,327,527 55,349,805 60,413,500 62,662,349 Total number of shares at the end of the period 65,023,502 58,874,751 63,173,670 65,023,502
Financial position Equity attributable to owners of the parent 9,824.1 3,628.3 7,512.0 9,824.1
Equity ratio 64.8% 55.2% 64.5% 64.8%
Net investments in tangible and intangible assets 488.5 20.0 85.6 544.1
Cash and cash equivalents 3,199.6 2,040.7 3,123.0 3,199.6
Net debt (+) / Net cash (-) -2,052.8 -639.3 -1,985.2 -2,052.8
Net debt/Adjusted EBITDA RTM, multiple -2.1 -1.0 -2.2 -2.1
Employee information Average FTEs 1,887 595 858 1,290
Percentage female 26% 28% 26% 26%
Key figures EBITDA margin 5.7% 10.8% 8.9% 7.5%
EBIT margin 2.9% 7.3% 5.6% 4.4%
INTERIM REPORT JANUARY–MARCH 2021 Page 14 of 23
Segment reporting An operating segment is defined as a business activity that is able to generate revenues and incur costs, whose operating results are regularly reviewed by the entity's chief executive officer and for which separate financial information is available. The Sinch Group’s operating segments are Messaging, Voice and Video, Operators, and Other and eliminations. Items under EBITDA and items affecting comparability are not allocated to the segments.
Q1 2021, SEK million Messaging Voice and
Video Operators Other and
eliminations Group External revenue 3,054.2 53.1 213.5 29.0 3, 349.9 Internal revenue 28.8 43.7 10.6 -83.1 - Gross profit 691.1 13.5 87.4 28.0 820.0 Adjusted EBITDA 283.4 -8.5 21.1 -55.8 240.3 Items affecting comparability -22.6 0.0 -1.8 -23.3 -47.8 EBITDA 260.8 -8.5 19.3 -79.1 192.5 Depreciation and amortization -95.5 EBIT 97.0 Net finance income 88.9 Profit before tax 185.9 Following the acquisition of SAP Digital Interconnect, SDI’s operations within customer service systems are included in Other and eliminations. These operations contributed net sales of SEK 29.0 million and gross profit of SEK 28.0 million. Other and eliminations includes employee benefits expenses of SEK -28.6 million related to incentive programs (see Note 3), which reduce Adjusted EBITDA and are not included in items affecting comparability.
Other and eliminations includes employee benefits expenses of SEK -2.4 million related to incentive programs, which reduce Adjusted EBITDA and are not included in items affecting comparability.
2020, SEK million Messaging Voice and
Video Operators Other and
eliminations Group External revenue 7,466.1 243.1 292.0 22.1 8,023.3 Internal revenue 115.9 22.4 25.1 -163.3 - Gross profit 1,883.9 77.3 200.0 21.9 2,183.3 Adjusted EBITDA 988.0 -8.5 22.6 -89.6 912.5 Items affecting comparability -54.3 1.8 2.3 -147.5 -197.6 EBITDA 933.7 -6.7 24.9 -237.1 714.9 Depreciation and amortization -262.0 EBIT 452.9 Net finance expense -73.5 Profit before tax 379.4 EBITDA for the parent company was SEK -141.2 million, including acquisition and integration costs of SEK -107.5 million. Unallocated items include acquisition and integration costs of SEK -53.7 million, income from adjusted earnout of SEK 59.8 million, and employee benefits expenses related to incentive programs of SEK -51.9 million.
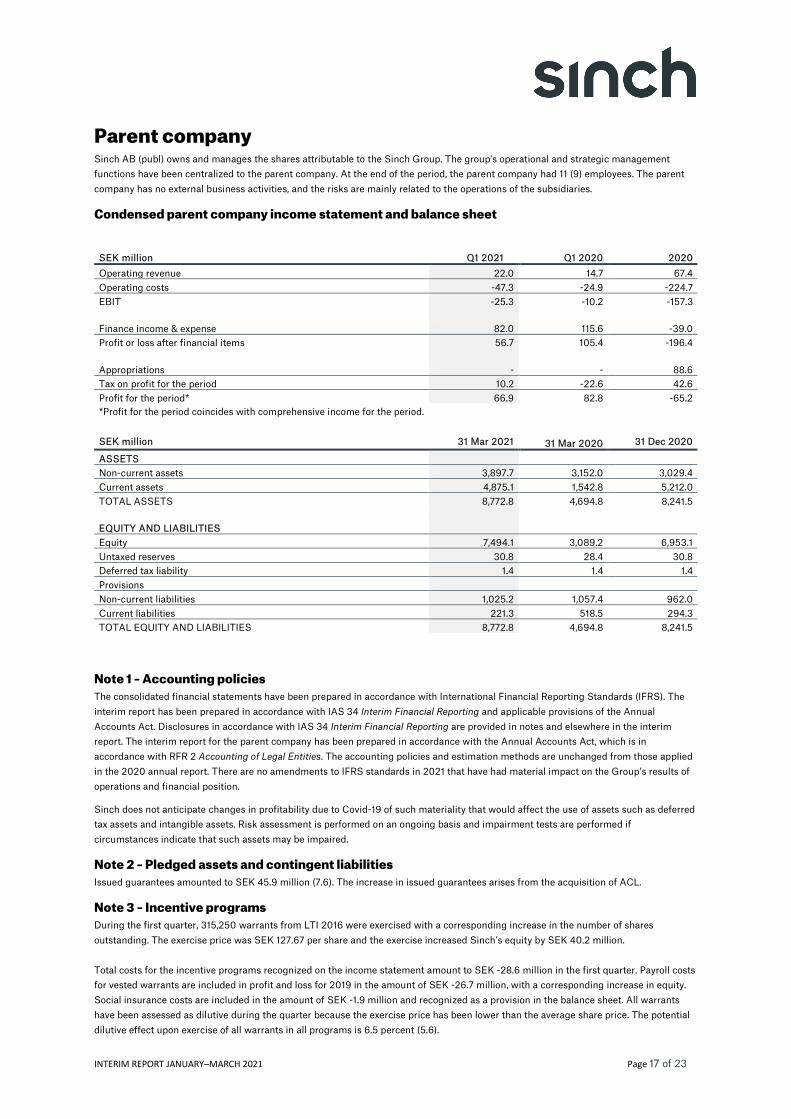
EBIT 431.3 Net finance income 3.3 Profit before tax 434.5
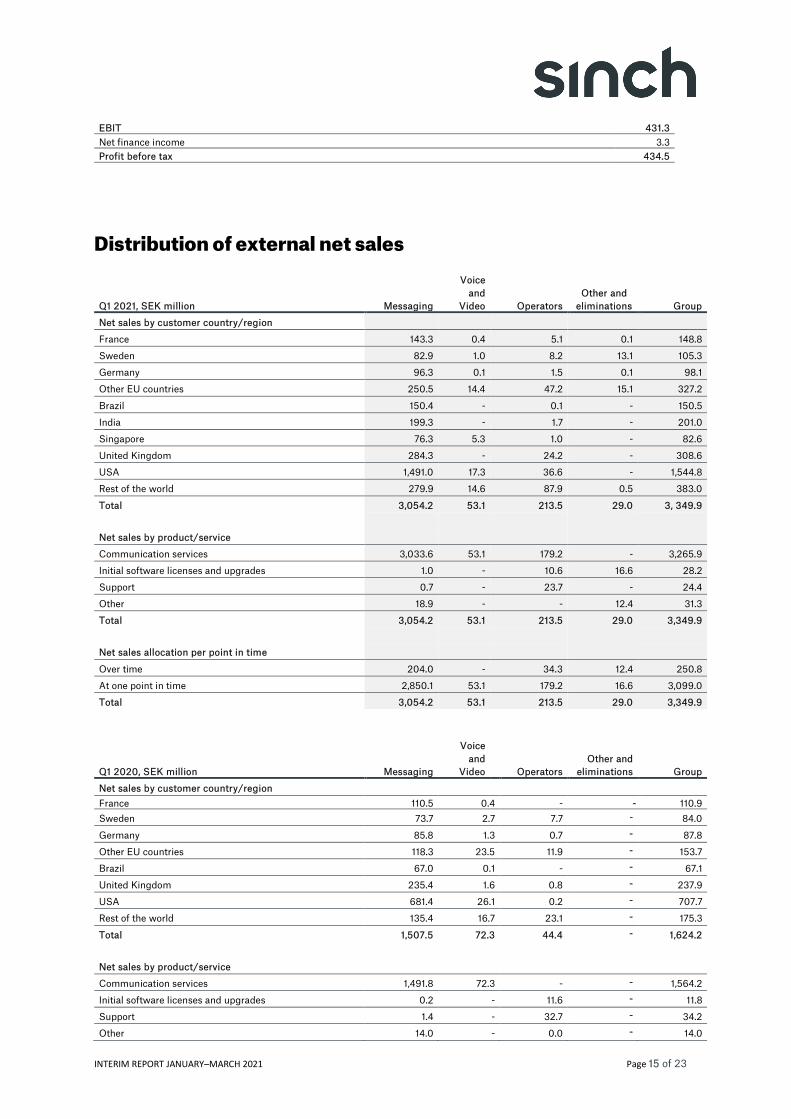
Distribution of external net sales
Q1 2021, SEK million Messaging
Voice and
Video Operators
Other and eliminations Group
Net sales by customer country/region
France 143.3 0.4 5.1 0.1 148.8
Sweden 82.9 1.0 8.2 13.1 105.3
Germany 96.3 0.1 1.5 0.1 98.1
Other EU countries 250.5 14.4 47.2 15.1 327.2
Brazil 150.4 - 0.1 - 150.5
India 199.3 - 1.7 - 201.0
Singapore 76.3 5.3 1.0 - 82.6
United Kingdom 284.3 - 24.2 - 308.6
USA 1,491.0 17.3 36.6 - 1,544.8
Rest of the world 279.9 14.6 87.9 0.5 383.0
Total 3,054.2 53.1 213.5 29.0 3, 349.9
Net sales by product/service
Communication services 3,033.6 53.1 179.2 - 3,265.9 Initial software licenses and upgrades 1.0 - 10.6 16.6 28.2
Support 0.7 - 23.7 - 24.4
Other 18.9 - - 12.4 31.3
Total 3,054.2 53.1 213.5 29.0 3,349.9 Net sales allocation per point in time
Over time 204.0 - 34.3 12.4 250.8 At one point in time 2,850.1 53.1 179.2 16.6 3,099.0
Total 3,054.2 53.1 213.5 29.0 3,349.9
Q1 2020, SEK million Messaging
Voice and
Video Operators
Other and eliminations Group
Net sales by customer country/region France 110.5 0.4 - - 110.9 Sweden 73.7 2.7 7.7 - 84.0
Germany 85.8 1.3 0.7 - 87.8
Other EU countries 118.3 23.5 11.9 - 153.7
Brazil 67.0 0.1 - - 67.1
United Kingdom 235.4 1.6 0.8 - 237.9
USA 681.4 26.1 0.2 - 707.7
Rest of the world 135.4 16.7 23.1 - 175.3
Total 1,507.5 72.3 44.4 - 1,624.2 Net sales by product/service
Communication services 1,491.8 72.3 - - 1,564.2 Initial software licenses and upgrades 0.2 - 11.6 - 11.8
Support 1.4 - 32.7 - 34.2
Other 14.0 - 0.0 - 14.0
INTERIM REPORT JANUARY–MARCH 2021 Page 16 of 23
Total 1,507.5 72.3 44.4 - 1,624.2 Net sales allocation per point in time
Over time 0.3 - 44.3 - 44.7 At one point in time 1,507.2 72.3 0.0 - 1,579.5
Total 1,507.5 72.3 44.4 - 1,624.2
INTERIM REPORT JANUARY–MARCH 2021 Page 17 of 23
Parent company Sinch AB (publ) owns and manages the shares attributable to the Sinch Group. The group's operational and strategic management functions have been centralized to the parent company. At the end of the period, the parent company had 11 (9) employees. The parent company has no external business activities, and the risks are mainly related to the operations of the subsidiaries.
Condensed parent company income statement and balance sheet
SEK million Q1 2021
Q1 2020 2020 Operating revenue 22.0 14.7 67.4 Operating costs -47.3 -24.9 -224.7 EBIT -25.3 -10.2 -157.3 Finance income & expense 82.0 115.6 -39.0 Profit or loss after financial items 56.7 105.4 -196.4 Appropriations - - 88.6 Tax on profit for the period 10.2 -22.6 42.6 Profit for the period* 66.9 82.8 -65.2 *Profit for the period coincides with comprehensive income for the period.
SEK million 31 Mar 2021 31 Mar 2020 31 Dec 2020
ASSETS Non-current assets 3,897.7 3,152.0 3,029.4 Current assets 4,875.1 1,542.8 5,212.0 TOTAL ASSETS 8,772.8 4,694.8 8,241.5 EQUITY AND LIABILITIES
Note 1 – Accounting policies The consolidated financial statements have been prepared in accordance with International Financial Reporting Standards (IFRS). The interim report has been prepared in accordance with IAS 34 Interim Financial Reporting and applicable provisions of the Annual Accounts Act. Disclosures in accordance with IAS 34 Interim Financial Reporting are provided in notes and elsewhere in the interim report. The interim report for the parent company has been prepared in accordance with the Annual Accounts Act, which is in accordance with RFR 2 Accounting of Legal Entities. The accounting policies and estimation methods are unchanged from those applied in the 2020 annual report. There are no amendments to IFRS standards in 2021 that have had material impact on the Group’s results of operations and financial position.
Sinch does not anticipate changes in profitability due to Covid-19 of such materiality that would affect the use of assets such as deferred tax assets and intangible assets. Risk assessment is performed on an ongoing basis and impairment tests are performed if circumstances indicate that such assets may be impaired.
Note 2 – Pledged assets and contingent liabilities Issued guarantees amounted to SEK 45.9 million (7.6). The increase in issued guarantees arises from the acquisition of ACL.
Note 3 – Incentive programs During the first quarter, 315,250 warrants from LTI 2016 were exercised with a corresponding increase in the number of shares outstanding. The exercise price was SEK 127.67 per share and the exercise increased Sinch’s equity by SEK 40.2 million. Total costs for the incentive programs recognized on the income statement amount to SEK -28.6 million in the first quarter. Payroll costs for vested warrants are included in profit and loss for 2019 in the amount of SEK -26.7 million, with a corresponding increase in equity. Social insurance costs are included in the amount of SEK -1.9 million and recognized as a provision in the balance sheet. All warrants have been assessed as dilutive during the quarter because the exercise price has been lower than the average share price. The potential dilutive effect upon exercise of all warrants in all programs is 6.5 percent (5.6).
INTERIM REPORT JANUARY–MARCH 2021 Page 18 of 23
Please refer to Note 7 of the 2020 annual report for other information concerning the group’s incentive programs.
Note 4 – Depreciation, amortization and impairments
Depreciation, amortization and impairments, SEK million Q1
Reconciliation of tax expense for the period Q1 2021 Q1 2020 Profit before tax 185.9 130.8 Tax calculated at Swedish tax rate, 20.6% (21.4) -38.3 -28.0 Tax attributable to previous years 10.0 -2.7 Tax effect of non-deductible expenses -3.3 -2.6 Tax effect of non-taxable revenue 0.1 - Tax on standard interest rate, tax allocation reserves 0.0 - Tax effect of non-capitalized loss carryforwards -0.2 -0.2 Tax effect of utilized and identified previously non-capitalized loss carryforwards - Foreign withholding tax -2.9 - Effect of changed tax rates - - Effect of foreign tax rates -10.5 -0.9 Tax on profit for the period according to income statement -45.1 -34.4
Note 6 – Acquisition of group companies
Wavy Sinch entered into a binding agreement on 26 March 2020 to acquire Wavy through acquisition of 100% of the shares in two companies, Movile Internet Móvel S.A. and Wavy Global Holdings BV, for cash consideration of BRL 383 million (SEK 545 million) and a non-cash issue of 1,534,582 new shares in Sinch. The acquisition closed on 1 February 2021. The acquisition was financed with a combination of existing cash reserves and debt facilities. Wavy has commercial agreements with more than 50 mobile operators in Latin America and handles more than 13 billion messages a year. With its sharp focus on innovation, Wavy has also achieved a leading position within next-generation interactive messaging via WhatsApp.
During the twelve-month period ending on 31 March 2020, Wavy generated sales of BRL 466 million (SEK 932m), gross profit of BRL 130 million (SEK 260m) and Adjusted EBITDA of BRL 47 million (SEK 94m). Wavy has 260 employees and nine offices in six countries. The merger of Sinch and Wavy is expected to generate synergies of BRL 15-20 million (SEK 30-40m) in the next 24 months. Execution of the transaction was subject to customary terms and conditions and the approval of the Brazilian competition authority CADE, Conselho Administrativo de Deferes Econômica.
The acquisition is included in the consolidated accounts from 1 February 2021. The fair value of acquired trade receivables amounted to SEK 198.2 million. The contractual gross amount of trade receivables is SEK 198.2 million. The acquisition analysis may need to be revised because the consideration is preliminary, and the value of intangible assets and deferred tax may change upon in-depth analysis.
Inteliquent On 17 February 2021, Sinch closed a binding agreement to acquire Inteliquent, the largest independent voice communications provider in the US, for total cash consideration of USD 1,140 million on a cash and debt-free basis. Inteliquent was acquired through acquisition of 100% of the shares in the legal entity Onvoy Holdings Inc. The acquisition was financed with a combination of existing cash reserves and debt facilities. During the twelve-month period ending 31 December 2020, Inteliquent had revenues of USD 533 million, gross profit of USD 256 million, EBITDA of USD 135 million and CAPEX of USD 32 million. The business is headquartered in Chicago, Illinois and has more than 500 employees. Inteliquent comprises two business units that leverage the same underlying network. The CPaaS (Communications-Platform-as-a-Service) business comprises Inteliquent’s enterprise-targeted API offering that lets businesses acquire phone numbers and embed voice calling in their own products or business processes. The IaaS (Infrastructure-as-a-Service) business
INTERIM REPORT JANUARY–MARCH 2021 Page 19 of 23
includes a range of business-critical services to fixed and mobile telecom carriers, including services for off-net call termination and handling of calls to toll-free 1-800 numbers.
Execution of the transaction is subject to customary conditions, including clearance from CFIUS and US competition authorities and the approval of the FCC, other regulatory authorities and the granting of other permits. Consequently, the acquisition is not yet included in the consolidated accounts.
Previous acquisitions The final consideration of EUR 14.4 million (SEK 146.3m) for the acquisition of SDI was paid during the first quarter.
Fair value acquired net assets, SEK million Wavy1 Customer relationships 271.9 Operator relationships 44.7 Trademarks 7.8 Proprietary software 60.4 Other intangible assets 1.3 Other property, plant and equipment 10.7 Leased assets 9.3 Financial assets 0.3 Accounts receivable 198.2 Deferred tax assets 41.8 Other current assets 96.0 Cash and cash equivalents 186.1 Deferred tax liability -127.8 Lease liability -9.3 Accounts payable -54.6 Other current liabilities -142.8 Total acquired net assets 594.0 1 The acquisition analysis is preliminary.
Purchase consideration, SEK million Wavy Consideration paid 545.2 Consideration paid, own shares 1,961.2 Total consideration 2,506.4 Fair value acquired net assets -594.0 Goodwill 1,912.4
Investing activities 2021, SEK million
SDI Wavy Total
Consideration paid 146.3 545.2 691.5 Cash and cash equivalents in acquired companies
-186.1 -186.1
Effects on cash and cash equivalents: 146.3 359.1 505.4
Direct costs relating to acquisitions are included in the item “Other external expenses” on the income statement.
Acquired entities’ contribution 2021, SEK million
Wavy
Net sales 151.8 Profit after tax for the year 17.4
The following table shows sales and profit for the year as if the acquisitions had taken place on 1 January 2021
2021, SEK million Wavy Other Sinch
companies Depreciation/amortizatio
n of acquired assets Total Net sales 227.7 3,198.1 - 3,425.8 Profit or loss after tax for the year 26.1 123.4 -9.3 140.2
INTERIM REPORT JANUARY–MARCH 2021 Page 20 of 23
Definitions Financial measurements defined under IFRS:
Earnings per share, basic and diluted Net profit for the period attributable to owners of the parent divided by the volume-weighted average number of shares outstanding in the period before/after dilution.
Financial measurements not defined under IFRS: The company presents certain financial measurements that are not defined under IFRS. The company believes that these measurements provide useful supplemental information to investors and the company’s management for reasons including that they enable evaluation of the company’s performance. Because not all companies calculate financial measurements in the same way, these are not always comparable to measurements used by other companies. These financial measurements should therefore not be considered a substitute for measurements defined under IFRS. Please refer to investors.sinch.com for a reconciliation of these financial measurements and organic growth.
Gross margin Gross profit in relation to net sales. The gross margin reflects the percentage of sales that comprises internal value creation and is not passed on to suppliers (mobile operators).
Gross profit Net sales less the cost of goods and services sold. Illustrates the company’s internal value creation excluding costs paid to suppliers (mobile operators).
Net investments in property, plant and equipment and intangible assets Investments in property, plant and equipment and intangible assets during the period less divested property, plant and equipment and intangible assets.
Interest-bearing liabilities Bond loans, bank loans and lease liabilities. Used to calculate net debt.
Net debt Interest-bearing liabilities less cash and cash equivalents. Used to track the debt trend and visualize the size of refinancing requirements.
Net debt/Adjusted EBITDA RTM Net debt divided by adjusted EBITDA, past 12 months. Shows how many years it would take to pay off the company’s debts presuming that net debt and EBITDA are constant and with no consideration of other cash flows.
OPEX Other external expenses and employee benefits expenses.
Equity ratio Equity as a percentage of total assets. Illustrates the company’s financial position. A good equity/assets ratio equips the company to manage periods of economic downturn and the financial basis for growth.
Operating profit, EBIT Profit for the period before financial income, financial expenses and tax.
EBITDA Profit for the period before financial income, financial expenses, tax and depreciation, amortization and impairment of intangible assets and property, plant and equipment. Enables comparisons of profitability over time, regardless of the effects of the rate of depreciation and amortization of non-current assets, financing structure and the corporation tax rate.
Items affecting comparability Non-recurring items such as capital gains/losses, impairments, acquisition costs, integration costs and restructuring costs. Separate reporting of items affecting comparability clarifies the trend in the underlying business.
Adjusted EBIT EBIT adjusted for items affecting comparability and depreciation and amortization of acquisition-related assets. Enables comparison of profitability over time, regardless of amortization and impairment of acquisition-related intangible assets and independent of financing structure and the corporation tax rate. This key performance measurement is also adjusted for items affecting comparability to increase comparability over time. Depreciation of non-current assets and amortization of other intangible assets are included, as this is a measure of the use of resources necessary to generate profit.
Adjusted EBITDA EBITDA adjusted for items affecting comparability. Enables comparisons of profitability over time, regardless of the effects of the rate of depreciation and amortization of non-current assets, financing structure and the corporation tax rate. This key performance measurement is also adjusted for items affecting comparability to increase comparability over time.
Adjusted EBITDA per share Adjusted EBITDA divided by the volume-weighted average number of shares outstanding for the period after dilution. Measures the earnings per share generated by the business adjusted for the effect of items affecting comparability.
Adjusted EBITDA/gross profit Adjusted EBITDA divided by gross profit. The measurement illustrates the company’s operating margin excluding the cost of goods sold (fees to mobile operators), which can partially be regarded as pass-through billing.
EBIT margin/Adjusted EBIT margin EBIT/Adjusted EBIT in relation to net sales.
EBITDA margin /Adjusted EBITDA margin EBITDA/Adjusted EBITDA in relation to net sales,
INTERIM REPORT JANUARY–MARCH 2021 Page 21 of 23
Operational measurements Percentage women Average number of women in relation to the average total number of employees during the period.
Number of shares at the end of the period Number of shares at the end of the period.
Average number of employees and consultants Average number of employees and consultants during the period, recalculated as full-time equivalents.
Organic growth Growth adjusted for acquisition and currency effects. Sinch’s presentation currency is SEK, while a large portion of revenues and costs are in other currencies. Growth adjusted for acquired units and currency effects shows underlying growth.
INTERIM REPORT JANUARY–MARCH 2021 Page 22 of 23
About Sinch Sinch develops digital tools that enable personal interaction between enterprises and individuals. Powered by the Sinch cloud communications platform, enterprises can reach every mobile phone on the planet - within a second or two - via messaging, voice calls and video. Several of the biggest enterprises in the world are using Sinch’s advanced technology platform to communicate with their customers and Sinch is an established software supplier to mobile operators worldwide. Sinch has delivered profitable growth since it was founded in 2008. The Group is headquartered in Stockholm, Sweden, and has a presence in more than 40 countries. The share is listed on Nasdaq Stockholm, XSTO: SINCH.
Outlook Sinch does not publish forecasts.
Forthcoming reporting dates Interim report Jan – Jun 2021 16 July 2021 Interim report Jan – Sep 2021 2 November 2021
Impact of Covid-19 The ongoing spread of Covid-19 is accelerating digitalization, which is increasing the need for the services Sinch provides. But the global pandemic is also generating uncertainty about economic development in the short term. Covid-19 is having adverse impact on the small Voice and Video segment because the drop in travel has triggered lower demand from app-based ride hailing companies. We have also noted that many operator customers are being more cautious in their investment decisions, which is holding back sales in the Operators segment. The overall impact on the Sinch Group remains modest, however, because volumes in Messaging have increased in parallel. Apart from this, Sinch does not anticipate changes in profitability due to Covid-19 of such materiality that would affect the use of assets such as deferred tax assets and intangible assets. Risk assessment is performed on an ongoing basis and impairment tests are performed if circumstances indicate that such assets may be impaired. There have been no material changes in our customer relationships that have required increases to credit loss allowances.
Risk assessment Sinch is, like all businesses, exposed to various types of risks in its operations. These include risks related to currency
fluctuations, dependence on certain strategic partners, technological change, dependence on key personnel, pandemics, tax risks and political risks related to the multinational nature of the Group's activities. Risk management is an integral part of Sinch's management, and risks are described in more detail in Note 32 of the 2020 annual report. The risks described for the Group may also have an indirect impact on the parent company. Pandemics, such as the one caused by Covid-19, can have serious impact on our local and global operations. Although we are working to institute continuity measures and ensure that we continue to meet the needs of our customers and mitigate the impact on our business, disruptions in the global economy and the businesses and operations of our customers, suppliers and partners could cause disruptions to our business and entail material impact on our operations and financial position.
Forward-looking statements This report contains statements concerning, among other things, Sinch's financial position and earnings as well as statements regarding market conditions that may be forward-looking. Sinch believes that the expectations reflected in these forward-looking statements are based on reasonable assumptions. Forward-looking statements, however, include risks and uncertainties and actual outcomes or consequences may differ materially from those expressed. Other than as required by applicable law, forward-looking statements apply only on the day they are presented and Sinch does not undertake to update any of them in light of new information or future events.
Assurance The board of directors and the CEO certify that the interim report gives a true and fair view of the company's and the Group's operations, position and results and describes significant risks and uncertainties faced by the company and the companies included in the Group.
Headquarters Sinch AB (publ) Lindhagensgatan 74 112 18 Stockholm, Sweden. Corporate ID 556882-8908
For additional information, please contact: Thomas Heath, Chief Strategy Officer and Head of Investor Relations +46 72 245 50 55 [email protected] Roshan Saldanha, Chief Financial Officer +46 73 660 24 19 [email protected]
Stockholm, 28 April 2021
Erik Fröberg Chairman of the Board
Bridget Cosgrave Renée Robinson Strömberg
Johan Stuart
Björn Zethraeus
Oscar Werner President and Chief Executive Officer
Note: Sinch AB (publ) is required to publish the information in this interim report pursuant to the EU market abuse regulation. The information was released for publication on 28 April 2021 at 07:30 CET.
This report is published in Swedish and English. In case of any differences between the English version and the Swedish original text, the Swedish version shall apply. This report has not been subject to review by the company’s independent auditor.