36
Interim Report on Operations at September 30, 2009

Interim Report on Operations
at September 30, 2009

Missione
Parmalat è un gruppo alimentare italiano a strategia multinazionale al servizio del benessere dei suoi consumatori nel mondo, il cui obiettivo finale è la creazione di valore per tutti i propri azionisti nel rispetto dell’etica degli affari e l’assolvimento di una funzione sociale, contribuendo alla crescita professionale dei dipendenti e collaboratori e trasferendo elementi di progresso economico e civile alle Comunità in cui opera. Vogliamo affermare Parmalat come uno dei principali operatori mondiali nel settore degli “alimenti funzionali ad alto valore aggiunto” per la corretta nutrizione ed il benessere dei consumatori, raggiungendo un’importante leadership in alcune selezionate categorie di prodotto ed in alcuni paesi ad elevato potenziale per il Gruppo. Le categorie chiave per il Gruppo saranno il Latte con i suoi derivati e le Bevande Frutta, alimenti di valore insostituibile nell’alimentazione quotidiana.
I Paesi di attività
con presenza diretta
Europa Italia, Portogallo, Romania, Russia
Resto del Mondo
Australia, Botswana, Canada, Colombia, Cuba, Ecuador, Mozambico, Nicaragua, Paraguay,
Sud Africa, Swaziland, Venezuela, Zambia
con presenza tramite licenza
Brasile, Cile, Cina, Messico, Repubblica Dominicana, Spagna, Stati Uniti d’America, Ungheria, Uruguay

Interim Report on Operations at September 30, 2009 3
Contents
Board of Directors, Board of Statutory Auditors and Independent Auditors...................................... 5
Financial Highlights........................................................................................................................... 7
Operating Performance..................................................................................................................... 8
Financial Performance .................................................................................................................... 22
Human Resources .......................................................................................................................... 23
Review of Operating and Financial Results .................................................................................... 24
Key Events in the Third Quarter of 2009......................................................................................... 30
Events Occurring After September 30, 2009 .................................................................................. 30
Principles for the Preparation of the Interim Report on Operations at September 30, 2009........... 31
Business Outlook for the Balance of 2009...................................................................................... 34
Certification Pursuant to Article 154 Bis, Section 2, of Legislative Decree No. 58/98, as Amended........................................................................................................................................................ 34

4 Interim Report on Operations at September 30, 2009

Interim Report on Operations at September 30, 2009 5
Board of Directors, Board of Statutory Auditors and Independent Auditors Board of Directors
Chairman Raffaele Picella Chief Executive Officer Enrico Bondi Directors Piergiorgio Alberti (i)
Massimo Confortini (i) (3) Marco De Benedetti (i) (2) Andrea Guerra (i) (2) Vittorio Mincato (i) (3)
Erder Mingoli (i) Marzio Saà (i) (1) Carlo Secchi (i) (1) (2)
Ferdinando Superti Furga (i) (1) (3)
(i) Independent Director (1) Member of the Internal Control and Corporate Governance Committee (2) Member of the Nominating and Compensation Committee (3) Member of the Litigation Committee
Board of Statutory Auditors Chairman Alessandro Dolcetti Statutory Auditors Enzio Bermani
Renato Colavolpe

6 Interim Report on Operations at September 30, 2009

Interim Report on Operations at September 30, 2009 7
Financial Highlights Income Statement Highlights (amounts in millions of euros)
GROUP Cumulative atSeptember 30, 2009
Cumulative atSeptember 30, 2008 Third quarter 2009 Third quarter 2008
- NET REVENUES 2,847.4 2,876.1 999.3 973.7- EBITDA 265.3 219.9 103.7 78.8- EBIT 356.0 674.2 67.5 231.2- NET PROFIT 285.5 640.1 36.3 213.2- EBIT/REVENUES (%) 12.4 23.3 6.7 23.6- NET PROFIT/REVENUES (%) 10.0 22.1 3.6 21.8
COMPANY
- NET REVENUES 618.2 677.5 201.7 219.2- EBITDA 59.9 40.1 18.4 15.2- EBIT 193.3 551.1 (1.1) 175.3- NET PROFIT 228.2 614.2 (0.4) 167.1- EBIT/REVENUES (%) 30.4 79.2 (0.5) 77.7- NET PROFIT/REVENUES (%) 35.9 88.3 (0.2) 74.1
Balance Sheet Highlights (amounts in millions of euros)
GROUP 9/30/09 6/30/09 12/31/08
- NET FINANCIAL ASSETS 1,082.2 1,130.0 1,108.8- ROI (%)1 26.1 32.3 41.6- ROE (%)1 13.1 17.1 24.5- EQUITY/ASSETS 0.7 0.7 0.7- NET FINANCIAL POSITION/EQUITY (0.4) (0.4) (0.4)
COMPANY
- NET FINANCIAL ASSETS 1,401.1 1,480.3 1,441.2- ROI (%)1 40.6 61.2 86.8- ROE (%)1 11.3 16.8 23.8- EQUITY/ASSETS 0.8 0.9 0.8- NET FINANCIAL POSITION/EQUITY (0.5) (0.5) (0.5)
1 These indices were computed based on annualized data for the income statement and average period data for the balance sheet.
8 Interim Report on Operations at September 30, 2009
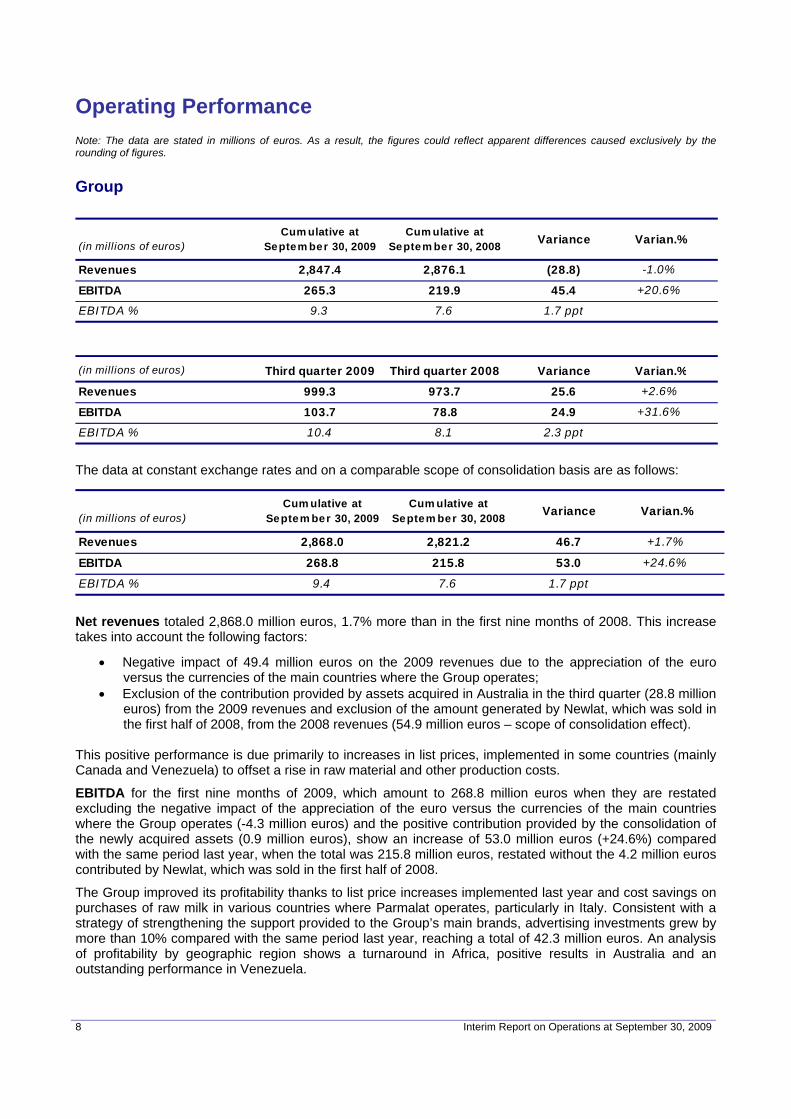
Operating Performance Note: The data are stated in millions of euros. As a result, the figures could reflect apparent differences caused exclusively by the rounding of figures. Group
(in millions of euros)Cum ulative at
Septem ber 30, 2009Cum ulative at
Septem ber 30, 2008 Variance Varian.%
Revenues 2,847.4 2,876.1 (28.8) -1.0%
EBITDA 265.3 219.9 45.4 +20.6%
EBITDA % 9.3 7.6 1.7 ppt
(in millions of euros) Third quarter 2009 Third quarter 2008 Variance Varian.%
Revenues 999.3 973.7 25.6 +2.6%
EBITDA 103.7 78.8 24.9 +31.6%
EBITDA % 10.4 8.1 2.3 ppt
The data at constant exchange rates and on a comparable scope of consolidation basis are as follows:
(in millions of euros)Cum ulative at
Septem ber 30, 2009Cum ulative at
Septem ber 30, 2008 Variance Varian.%
Revenues 2,868.0 2,821.2 46.7 +1.7%
EBITDA 268.8 215.8 53.0 +24.6%
EBITDA % 9.4 7.6 1.7 ppt
Net revenues totaled 2,868.0 million euros, 1.7% more than in the first nine months of 2008. This increase takes into account the following factors:
• Negative impact of 49.4 million euros on the 2009 revenues due to the appreciation of the euro versus the currencies of the main countries where the Group operates;
• Exclusion of the contribution provided by assets acquired in Australia in the third quarter (28.8 million euros) from the 2009 revenues and exclusion of the amount generated by Newlat, which was sold in the first half of 2008, from the 2008 revenues (54.9 million euros – scope of consolidation effect).
This positive performance is due primarily to increases in list prices, implemented in some countries (mainly Canada and Venezuela) to offset a rise in raw material and other production costs.
EBITDA for the first nine months of 2009, which amount to 268.8 million euros when they are restated excluding the negative impact of the appreciation of the euro versus the currencies of the main countries where the Group operates (-4.3 million euros) and the positive contribution provided by the consolidation of the newly acquired assets (0.9 million euros), show an increase of 53.0 million euros (+24.6%) compared with the same period last year, when the total was 215.8 million euros, restated without the 4.2 million euros contributed by Newlat, which was sold in the first half of 2008.
The Group improved its profitability thanks to list price increases implemented last year and cost savings on purchases of raw milk in various countries where Parmalat operates, particularly in Italy. Consistent with a strategy of strengthening the support provided to the Group’s main brands, advertising investments grew by more than 10% compared with the same period last year, reaching a total of 42.3 million euros. An analysis of profitability by geographic region shows a turnaround in Africa, positive results in Australia and an outstanding performance in Venezuela.

Interim Report on Operations at September 30, 2009 9
Like-for-like Net Revenues and EBITDA
Cumulative Net Revenues September 2009 vs 2008
2,876.1 -54.9 2,821.2
135.4
-86.5 -15.7 -1.9
15.6
2,868.0
28.8
-49.42,847.4
2008 netrevenues
before disp.
Disposals 2008 netrevenues
Price Discounts/Returns
Salesvolume
Mix Other 2009 netrevenues
Perimeter Currencytranslation
2009 netrevenues
Cumulative EBITDA September 2009 vs 2008
219.9 -4.2 215.8
48.838.5
-5.3 -5.6 -25.85.3
-3.0 268.8 0.9 -4.3 265.3
2008 EBITDA
before disp.
Disposals 2008EBITDA
Price/Discounts
Variablecosts
Salesvolume
Mix Fixedand gen.
"Operations"costs
CorporateOH
Receivableswrite off& misc.
2009EBITDA
Perimeter Currencytranslation
2009EBITDA

10 Interim Report on Operations at September 30, 2009
Data by Geographic Region
15 17 3 5
(in millions of euros) Cumulative at September 30, 2009 Cumulative at September 30, 2008
RegionRevenues EBITDA EBITDA % Revenues EBITDA EBITDA %
Italy 1 748.2 88.7 11.9 864.9 81.6 9.4
Other Europe 100.9 15.6 15.5 123.1 18.3 14.9
Canada 987.1 87.2 8.8 981.4 88.9 9.1
Africa 254.7 13.8 5.4 247.1 9.0 3.6
Aus tralia 2 340.5 30.2 8.9 339.2 13.6 4.0
Central and South Am erica 416.8 47.2 11.3 323.0 31.1 9.6
Other 3 (0.7) (17.3) n.s. (2.5) (22.5) n.s.
Group 2,847.4 265.3 9.3 2,876.1 219.9 7.6
Regions represent the consolidated countries
3. Includes holding, other minor companies, eliminations between regions
2. 2009 data include net revenues of 28.8 million euros and EBITDA of 0.9 mill ion euros relating to the acquisition of new operations
1. 2008 data include net revenues of 54.9 million euros and EBITDA of 4,2 mill ion euros relating to Newlat, sold in the first half of 2008
Net Revenues by Region
Italy26%Others Europe
4%
Canada34%
Central and South America
15% Africa9%
Australia12%

Interim Report on Operations at September 30, 2009 11
Data by Product Division (in millions of euros) Cumulative at September 30, 2009 Cumulative at September 30, 2008
Division Net Revenues EBITDA EBITDA % Net Revenues EBITDA EBITDA %
Milk 1 1,674.6 137.6 8.2 1,702.7 115.0 6.8
Fruit base drink 2 244.9 48.5 19.8 211.7 39.4 18.6
Milk derivative 3 878.1 92.1 10.5 909.4 82.1 9.0
Other 4 49.8 (12.9) (25.8) 52.3 (16.6) (31.7)
Group 2,847.4 265.3 9.3 2,876.1 219.9 7.6
1 Include milk, cream and bechamel2 Include fruit base drink and tea3 Include yogurt, dessert, cheese4 Include other products and holding
Net Revenues by Product Division
Cumulative at September 30, 2009 Cumulative at September 30, 2008
1 Include milk, cream and bechamel2 Include fruit base drink and tea3 Include yogurt, dessert, cheese4 Include other products and holding
Milk 159.2%
Fruit base drink 2
7.4%
Milk derivative 3
31.6%
Other 41.8%
Milk 158.8%
Fruit base drink 2
8.6%
Milk derivative
330.8%
Other 41.7%
12 Interim Report on Operations at September 30, 2009
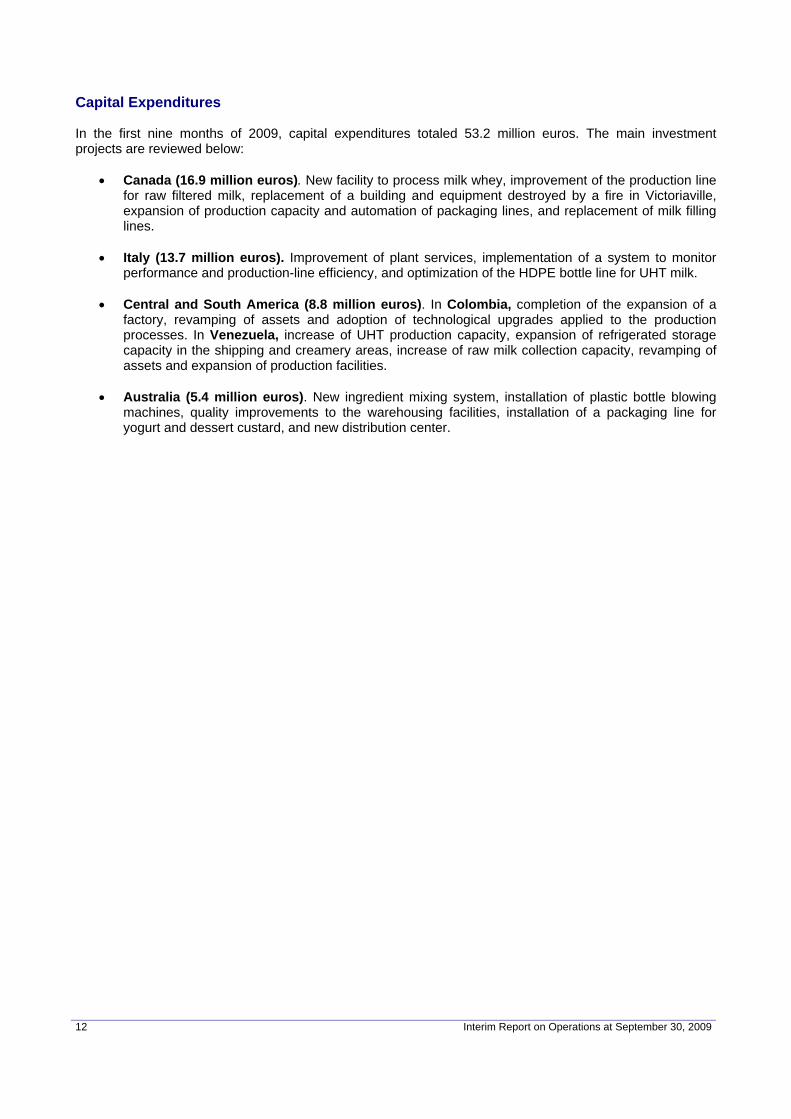
Capital Expenditures In the first nine months of 2009, capital expenditures totaled 53.2 million euros. The main investment projects are reviewed below:
• Canada (16.9 million euros). New facility to process milk whey, improvement of the production line for raw filtered milk, replacement of a building and equipment destroyed by a fire in Victoriaville, expansion of production capacity and automation of packaging lines, and replacement of milk filling lines.
• Italy (13.7 million euros). Improvement of plant services, implementation of a system to monitor
performance and production-line efficiency, and optimization of the HDPE bottle line for UHT milk. • Central and South America (8.8 million euros). In Colombia, completion of the expansion of a
factory, revamping of assets and adoption of technological upgrades applied to the production processes. In Venezuela, increase of UHT production capacity, expansion of refrigerated storage capacity in the shipping and creamery areas, increase of raw milk collection capacity, revamping of assets and expansion of production facilities.
• Australia (5.4 million euros). New ingredient mixing system, installation of plastic bottle blowing
machines, quality improvements to the warehousing facilities, installation of a packaging line for yogurt and dessert custard, and new distribution center.

Interim Report on Operations at September 30, 2009 13
Italy
(in millions of euros)Cumulative at
September 30, 2009Cumulative at
September 30, 2008 Variance Varian.%
Revenues 748.2 864.9 (116.7) -13.5%
EBITDA 88.7 81.6 7.1 +8.8%
EBITDA % 11.9 9.4 2.4 ppt
(in millions of euros) Third quarter 2009 Third quarter 2008 Variance Varian.%
Revenues 242.5 265.0 (22.5) -8.5%
EBITDA 27.0 25.6 1.4 +5.3%
EBITDA % 11.1 9.7 1.5 ppt
Two major divestments occurred in 2008: Newlat (May 2008) and some brands in the cheese category (Ala, Polenghi and Optimus), sold at the end of December 2008. Restated without these assets, the 2008 revenues decrease from 864.9 million euros to 808.6 million euros. The 7.5% decrease in net sales revenues compared with 2008, with data restated on a comparable scope of consolidation basis, is mainly the result of the following factors:
• The decision not to increase list prices in 2009, maintaining the 2008 pass-through effect on sales prices, more than offset by the use of sales incentives, including a policy of discounts and promotions implemented during the first nine months of the year in order to protect market shares and sales volumes in a contracting market;
• A reduction in unit sales that was noticeable in all channels of the fresh milk market segment, but especially in the modern trade due to strong growth by private labels. Despite this challenging environment, Parmalat was able to contain the reduction in the sales volume of fresh milk, thanks to a strong performance by the Blu Premium brand.
Markets and Products Because of the recessionary environment, the market focused strongly on price as the basis for purchasing decisions. Even though inflation was down significantly, consumers continued to prefer to an increasing extent the lowest priced products, private labels and products offered with promotional discounts. In the UHT milk market, the trend was negative (-1.3% on a volume basis) in the first nine months of 2009, due mainly to lower demand for basic products (mainly UHT whole milk), despite an increased use of promotional programs. Volumes increased in the highly digestibility milk segment (+11.3%), but the trend was down (-10.8% on a volume basis) for functional milk. Parmalat reported higher unit sales (+1.2%) and confirmed its leadership position in the UHT milk market, with a value market share of 35.1%, due mainly to the contribution provided by its basic milks. In the high digestibility area, Zymil, which is the segment’s product leader, enjoyed a 6.9% increase in sales volumes. In the first nine months of 2009, demand for pasteurized milk was up modestly only in the modern distribution segment (+0.7% on a volume basis). Private labels used low prices to increase their market share, which grew to 19.4% in the modern channel in September. Higher sales of Blu Premium milk, which reached a volume market share of 4.4%, enabled Parmalat to minimize its overall loss of market share.
14 Interim Report on Operations at September 30, 2009
In the fruit juice market, demand recovered strongly, particularly during the summer months, with volumes returning to last year’s level. Thanks to the success of its Santàl brand, Parmalat further strengthened its leadership position, boosting sales by 8%. The yogurt market showed modest growth, with a positive trend for functional products and a slight contraction in the basic product segment. Overall, Parmalat reported lower unit sales, due mainly to the impact of aggressive competition. Advertising investments by the Italian SBU, which increased from 10.9 million euros in first nine months of 2008 to 13.4 million euros in the same period this year, focused on supporting the Parmalat and Santàl “umbrella” brands and local brands. Raw Milk Overall, milk prices were down in the first nine months of 2009, compared with the exceptionally high levels reached in 2008.

Interim Report on Operations at September 30, 2009 15
Other Countries in Europe
(in millions of euros)Cumulative at
September 30, 2009Cumulative at
September 30, 2008 Variance Varian.%
Revenues 100.9 123.1 (22.2) -18.1%
EBITDA 15.6 18.3 (2.7) -14.9%
EBITDA % 15.5 14.9 0.6 ppt
(in millions of euros) Third quarter 2009 Third quarter 2008 Variance Varian.%
Revenues 33.0 41.3 (8.3) -20.1%
EBITDA 5.0 7.4 (2.4) -32.4%
EBITDA % 15.2 17.9 -2.8 ppt
Russia The Russian ruble lost 21.2% of its value compared with the exchange rate applied in the same period last year. The negative impact of this change on revenues and EBITDA was 10.3 million euros and 1.9 million euros, respectively. While prices were up on average compared with the previous year, unit sales decreased by 14.9% overall. More specifically, shipments of UHT milk, which together with flavored milk account for 33% of total unit sales, were down compared with 2008, as were sales of fruit beverages. The sales shortfall, while indicative of a contraction in consumer demand, also reflects a reduction in shipments to regional distributors affected by a serious liquidity crisis. Despite the reduction in sales volumes and revenues, the SBU maintained a high level of profitability, increasing it compared with the first nine months of 2008 by successfully containing raw milk costs. In Russia, milk is a scarce resource and its price is strongly affected by supply levels both domestically and in the international market. During the first nine months of 2009, milk prices fell sharply due both to a decrease in consumption and an increase in the market supply of raw milk. Portugal In the first nine months of 2009, net revenues totaled 45.2 million euros, or 7.4% less than in the same period last year, but unit sales were up 4.4%. While the business environment remains challenging due to the limited buying power of consumers, a carefully managed pricing policy, made possible by a significant reduction in raw material costs, help support unit sales and produced a slight increase in EBITDA. The Portuguese milk market is dominated by a strong brand leader, but private labels have achieved a significant and growing presence, with a resulting erosion of profit margins. In this market environment, Parmalat is focusing on products with a high value added, such as flavored milk, cream and béchamel. Romania The local currency (new leu) decreased in value by 16.2% compared with the exchange rate applied in the first nine months of 2008, with a negative impact on revenues and EBITDA of 1.2 million euros and 0.1 million euros, respectively. Shipments of fruit beverages, which account for virtually all of the SBU’s sales, were down 23.7% compared with 2008. The profitability of the Romanian SBU, stated on a percentage basis, decreased due both to an increase in the cost of raw materials and packaging materials, caused by the devaluation of the local currency, and to the aggressiveness of competitors.
16 Interim Report on Operations at September 30, 2009
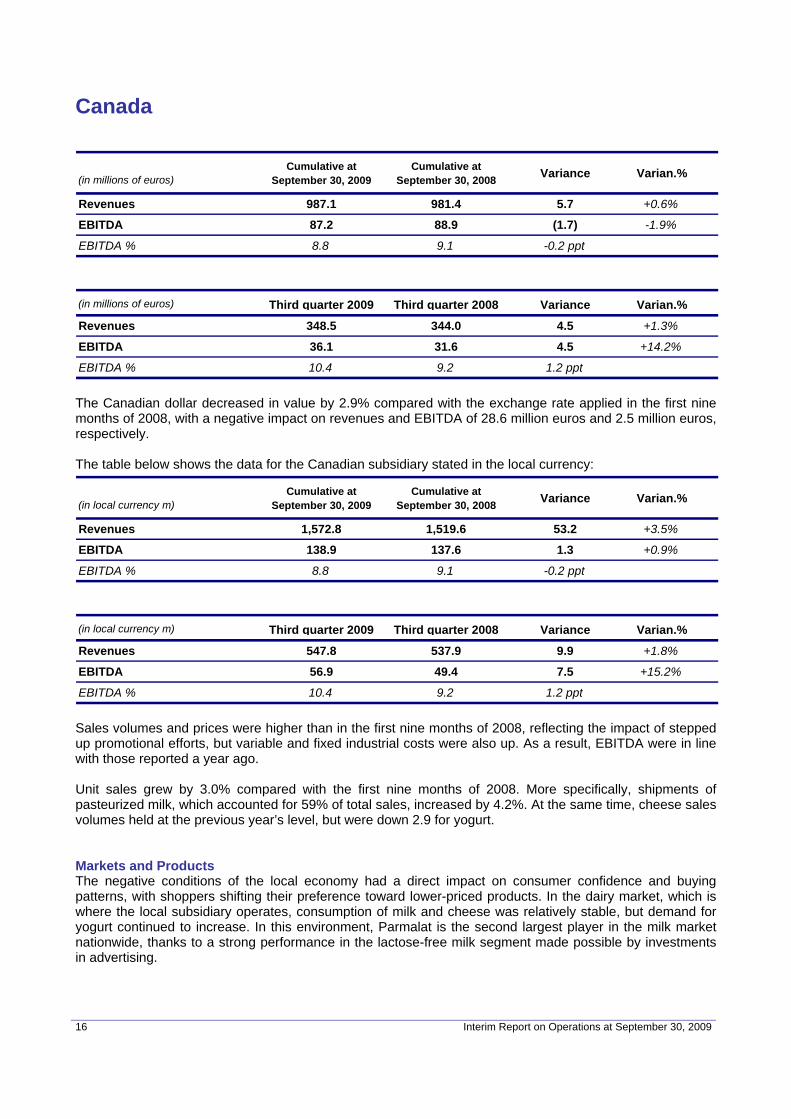
Canada
(in millions of euros)Cumulative at
September 30, 2009Cumulative at
September 30, 2008 Variance Varian.%
Revenues 987.1 981.4 5.7 +0.6%
EBITDA 87.2 88.9 (1.7) -1.9%
EBITDA % 8.8 9.1 -0.2 ppt
(in millions of euros) Third quarter 2009 Third quarter 2008 Variance Varian.%
Revenues 348.5 344.0 4.5 +1.3%
EBITDA 36.1 31.6 4.5 +14.2%
EBITDA % 10.4 9.2 1.2 ppt
The Canadian dollar decreased in value by 2.9% compared with the exchange rate applied in the first nine months of 2008, with a negative impact on revenues and EBITDA of 28.6 million euros and 2.5 million euros, respectively. The table below shows the data for the Canadian subsidiary stated in the local currency:
(in local currency m)Cumulative at
September 30, 2009Cumulative at
September 30, 2008 Variance Varian.%
Revenues 1,572.8 1,519.6 53.2 +3.5%
EBITDA 138.9 137.6 1.3 +0.9%
EBITDA % 8.8 9.1 -0.2 ppt
(in local currency m) Third quarter 2009 Third quarter 2008 Variance Varian.%
Revenues 547.8 537.9 9.9 +1.8%
EBITDA 56.9 49.4 7.5 +15.2%
EBITDA % 10.4 9.2 1.2 ppt
Sales volumes and prices were higher than in the first nine months of 2008, reflecting the impact of stepped up promotional efforts, but variable and fixed industrial costs were also up. As a result, EBITDA were in line with those reported a year ago. Unit sales grew by 3.0% compared with the first nine months of 2008. More specifically, shipments of pasteurized milk, which accounted for 59% of total sales, increased by 4.2%. At the same time, cheese sales volumes held at the previous year’s level, but were down 2.9 for yogurt. Markets and Products The negative conditions of the local economy had a direct impact on consumer confidence and buying patterns, with shoppers shifting their preference toward lower-priced products. In the dairy market, which is where the local subsidiary operates, consumption of milk and cheese was relatively stable, but demand for yogurt continued to increase. In this environment, Parmalat is the second largest player in the milk market nationwide, thanks to a strong performance in the lactose-free milk segment made possible by investments in advertising.

Interim Report on Operations at September 30, 2009 17
In the spoonable yogurt market, Parmalat Canada retained its No. 2 ranking in the English speaking areas of Canada. In the cheese market, Parmalat suffered a slight reduction in market share nationwide due to increased competitive pressure and an aggressive use of promotional programs by its main competitor. However, it consolidated its absolute leadership position in the snack cheese segment. Raw Materials and Packaging In the Canadian market for raw milk, the purchase price is regulated. In 2009, the cost of raw milk purchased for industrial use, which is used mainly to produce cheese, butter and yogurt, increased by about 11%.
18 Interim Report on Operations at September 30, 2009
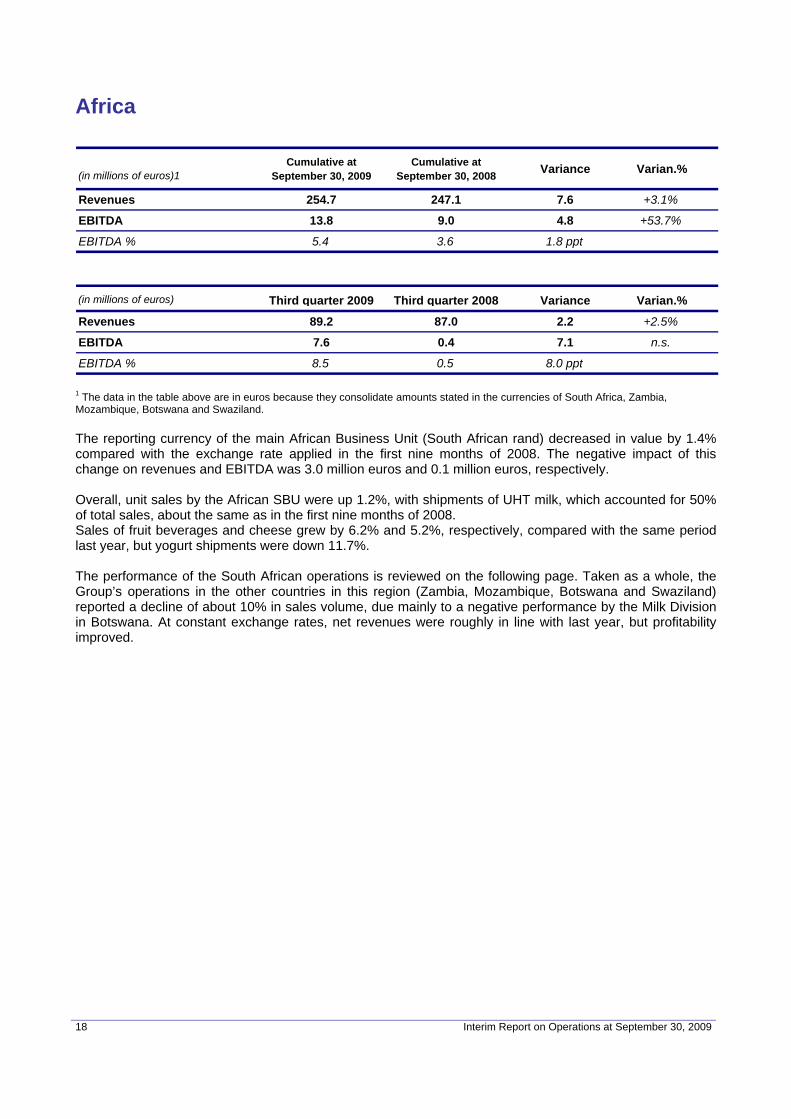
Africa
(in millions of euros)1Cumulative at
September 30, 2009Cumulative at
September 30, 2008 Variance Varian.%
Revenues 254.7 247.1 7.6 +3.1%
EBITDA 13.8 9.0 4.8 +53.7%
EBITDA % 5.4 3.6 1.8 ppt
(in millions of euros) Third quarter 2009 Third quarter 2008 Variance Varian.%
Revenues 89.2 87.0 2.2 +2.5%
EBITDA 7.6 0.4 7.1 n.s.
EBITDA % 8.5 0.5 8.0 ppt
1 The data in the table above are in euros because they consolidate amounts stated in the currencies of South Africa, Zambia, Mozambique, Botswana and Swaziland. The reporting currency of the main African Business Unit (South African rand) decreased in value by 1.4% compared with the exchange rate applied in the first nine months of 2008. The negative impact of this change on revenues and EBITDA was 3.0 million euros and 0.1 million euros, respectively. Overall, unit sales by the African SBU were up 1.2%, with shipments of UHT milk, which accounted for 50% of total sales, about the same as in the first nine months of 2008. Sales of fruit beverages and cheese grew by 6.2% and 5.2%, respectively, compared with the same period last year, but yogurt shipments were down 11.7%. The performance of the South African operations is reviewed on the following page. Taken as a whole, the Group’s operations in the other countries in this region (Zambia, Mozambique, Botswana and Swaziland) reported a decline of about 10% in sales volume, due mainly to a negative performance by the Milk Division in Botswana. At constant exchange rates, net revenues were roughly in line with last year, but profitability improved.
Interim Report on Operations at September 30, 2009 19
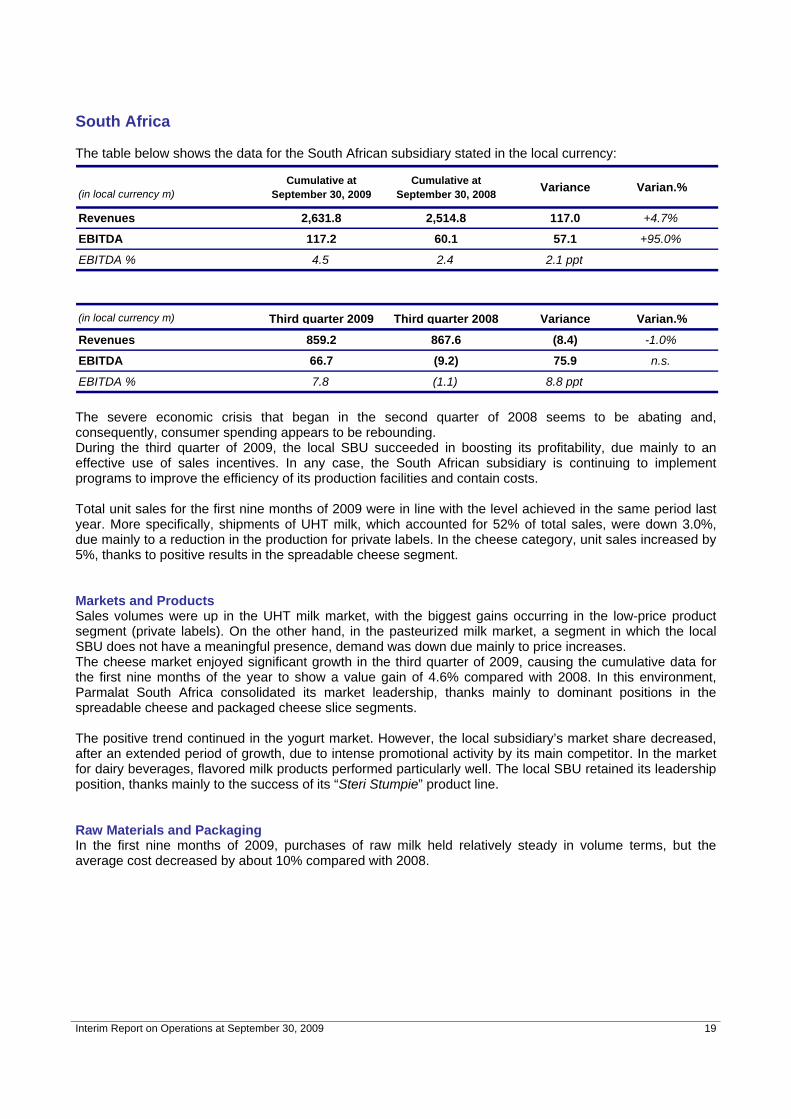
South Africa The table below shows the data for the South African subsidiary stated in the local currency:
(in local currency m)Cumulative at
September 30, 2009Cumulative at
September 30, 2008 Variance Varian.%
Revenues 2,631.8 2,514.8 117.0 +4.7%
EBITDA 117.2 60.1 57.1 +95.0%
EBITDA % 4.5 2.4 2.1 ppt
(in local currency m) Third quarter 2009 Third quarter 2008 Variance Varian.%
Revenues 859.2 867.6 (8.4) -1.0%
EBITDA 66.7 (9.2) 75.9 n.s.
EBITDA % 7.8 (1.1) 8.8 ppt
The severe economic crisis that began in the second quarter of 2008 seems to be abating and, consequently, consumer spending appears to be rebounding. During the third quarter of 2009, the local SBU succeeded in boosting its profitability, due mainly to an effective use of sales incentives. In any case, the South African subsidiary is continuing to implement programs to improve the efficiency of its production facilities and contain costs. Total unit sales for the first nine months of 2009 were in line with the level achieved in the same period last year. More specifically, shipments of UHT milk, which accounted for 52% of total sales, were down 3.0%, due mainly to a reduction in the production for private labels. In the cheese category, unit sales increased by 5%, thanks to positive results in the spreadable cheese segment. Markets and Products Sales volumes were up in the UHT milk market, with the biggest gains occurring in the low-price product segment (private labels). On the other hand, in the pasteurized milk market, a segment in which the local SBU does not have a meaningful presence, demand was down due mainly to price increases. The cheese market enjoyed significant growth in the third quarter of 2009, causing the cumulative data for the first nine months of the year to show a value gain of 4.6% compared with 2008. In this environment, Parmalat South Africa consolidated its market leadership, thanks mainly to dominant positions in the spreadable cheese and packaged cheese slice segments. The positive trend continued in the yogurt market. However, the local subsidiary’s market share decreased, after an extended period of growth, due to intense promotional activity by its main competitor. In the market for dairy beverages, flavored milk products performed particularly well. The local SBU retained its leadership position, thanks mainly to the success of its “Steri Stumpie” product line. Raw Materials and Packaging In the first nine months of 2009, purchases of raw milk held relatively steady in volume terms, but the average cost decreased by about 10% compared with 2008.

20 Interim Report on Operations at September 30, 2009
Australia The data shown below include the contribution of new assets acquired in the third quarter of 2009.
(in millions of euros)Cumulative at
September 30, 2009Cumulative at
September 30, 2008 Variance Varian.%
Revenues 340.5 339.2 1.3 +0.4%
EBITDA 30.2 13.6 16.6 +122.0%
EBITDA % 8.9 4.0 4.9 ppt
(in millions of euros) Third quarter 2009 Third quarter 2008 Variance Varian.%
Revenues 140.3 116.0 24.2 +20.9%
EBITDA 12.6 10.0 2.6 +26.5%
EBITDA % 9.0 8.6 0.4 ppt
The value of the Australian dollar decreased by 9.4% compared with the exchange rate applied in the first nine months of 2008. The negative impact of this change on revenues and EBITDA was 29.2 million euros and 2.7 million euros, respectively. If the data are stated in Australian dollars and without counting the revenues provided by the assets acquired in the third quarter (52.5 million), net revenues show an increase of 0.6%, rising from 565.9 million in the first nine months of 2008 to 569.3 million in the same period this year. A noteworthy development was the positive performance achieved in the yogurt segment thanks to the success of the Vaalia brand and the impact of a more streamlined product catalog. The local SBU reported unit sales that were 3.9% lower than in the first nine months of 2008, with shipments of pasteurized milk, which accounted for 73% of the total sales volume, down 5.3%. In the yogurt category, sales volumes were in line with the previous year. On the same comparable scope of consolidation (i.e., without the amount of 1.6 million Australian dollars generated by the assets acquired in the third quarter), EBITDA for the first nine months of the year increase from 22.7 million Australian dollars in 2008 to 53.5 million Australian dollars in 2009. In addition to the positive impact of an effective pricing policy, the increase in profitability achieved in the first nine months of 2009 reflects the benefits of efficiency gains in variable and fixed industrial costs. It is also worth noting that the results for the first six months of 2008 were penalized by “step-up” increases in raw milk prices applied by Australia’s major cooperatives during the July 2007-June 2008 period. Markets and Products In the “white milk” segment, the substantial difference in average sales price between private labels and branded products caused all major producers to lose market share. Despite this situation, Parmalat Australia maintained its market position. Unit sales of Zymil brand milk were up strongly. The flavored milk market also performed well. In the modern channel, Parmalat increased its value and volume market share. Sales volumes were up in the yogurt market, but Parmalat Australia’s performance reflected the impact of its decision to streamline its product portfolio in order to increase manufacturing efficiency.

Interim Report on Operations at September 30, 2009 21
Central and South America
(in millions of euros)Cumulative at
September 30, 2009Cumulative at
September 30, 2008 Variance Varian.%
Revenues 416.8 323.0 93.8 +29.0%
EBITDA 47.2 31.1 16.0 +51.6%
EBITDA % 11.3 9.6 1.7 ppt
(in millions of euros) Third quarter 2009 Third quarter 2008 Variance Varian.%
Revenues 146.2 120.9 25.3 +20.9%
EBITDA 20.9 10.3 10.6 +102.3%
EBITDA % 14.3 8.5 5.7 ppt
Venezuela The local currency (bolivar) increased in value by 10.3% compared with the exchange rate applied in the first nine months of 2008. The positive impact of this change on revenues and EBITDA was 32.2 million euros and 4.2 million euros, respectively. Overall, unit sales were 12.4% higher than last year. Specifically, shipments were up 13.5% for fruit beverages, which accounted for 48% of the SBU’s total sales volume, and 11.4% for pasteurized milk, while yogurt shipments were in line with those of the first nine months of 2008. The main reasons for the significant increase in the EBITDA amount, compared with the previous year, are a strong performance in the fruit beverage and dairy products segments and a resumption of powdered milk distribution activities. Variable production costs were up significantly, particularly in the case of packaging materials. Fixed costs were also up reflecting the impact of inflationary pressures. Colombia The local currency (peso) decreased in value by 7.0% compared with the exchange rate applied in the first nine months of 2008. The negative impact of this change on revenues and EBITDA was 5.2 million euros and 0.4 million euros, respectively. Total unit sales were down 11.0% compared with the previous year, with shipments of pasteurized milk (which accounted for 77% of the total sales volume) decreasing by 10.0%. Unit sales of UHT milk decreased by 15.0% compared with 2008. The Colombian market was characterized by a decrease in consumer spending, caused in part by the economic crisis. More specifically, the contraction in unit sales and profit margins that occurred in the pasteurized milk category adversely affected the SBU’s performance, which was further penalized by the need to recall some products from the market due to quality problems that occurred in February. This situation was brought back under control later in the first half of the year.

22 Interim Report on Operations at September 30, 2009
Financial Performance During the first nine months of 2009, the Group’s net financial position changed from net financial assets of 1,108.8 million euros at December 31, 2008 to net financial assets of 1,082.2 million euros at September 30, 2009, after a negative foreign exchange effect of 12.2 million euros. The net financial position includes the net indebtedness owed by the Venezuelan subsidiaries, which totaled 149.8 million euros at December 31, 2008 and 148.1 million euros at September 30, 2009.
The cash flow from operations amounted to 108.6 million euros.
The cash flow from nonrecurring activities, which totaled 37.2 million euros, reflects mainly the purchase of some fresh milk production and processing assets from National Foods.
Cash flows from litigation settlements totaled 152.6 million euros, which is the net result of legal costs amounting to 21.9 million euros, income taxes on settlements totaling 11.7 million euros and proceeds of 186.2 million euros generated by settlements reached during the first three months of 2009 with the Deutsche Bank Group (74.0 million euros), the UBI Group (11.0 million euros), the Banca Popolare dell’Emilia Romagna Group (12.5 million euros), the Banca Popolare di Vicenza Group (5.1 million euros), Banca Sella (0.2 million euros), Credito Emiliano S.p.A. (10.0 million euros), the Banco Popolare Group (24.2 million euros), MPS S.p.A. in its capacity as the company that absorbed Banca Antonveneta S.p.A. (19.0 million euros), the Banca CARIGE Group (5.4 million euros), Banca C.R. Firenze of the Intesa Sanpaolo Group (10.4 million euros), Centro Factoring S.p.A. (5.2 million euros), Cassa di Risparmio della Spezia S.p.A. (4.4 million euros), Banca Popolare dell’Etruria e del Lazio Soc. Coop. (4.2 million euros) and Banca BCC di Bene Vagienna (0.5 million euros).
The cash flow from financial transactions totaled 5.6 million euros.
Lastly, in addition to the negative foreign exchange effect of 12.2 million euros mentioned above, the Company paid dividends totaling 232.8 million euros.
Consolidated Cash Flow Jan 1 - Sep 30, 2009
-1,082.2
-1,108.8
-1,094.4
-186.2
-265.3
-0.4-3.6
12.241.0 53.2
4.6
232.8
11.740.842.5 21.96.0
15.4
Net
fina
ncia
las
sets
at
12.3
1.20
08
EBIT
DA
Cha
nge
inne
t wor
king
capi
tal
Tech
nica
lin
vest
men
ts+l
ands
and
build
ings
Inve
stm
ents
in in
tang
ible
s
Cha
nges
inot
her a
sset
san
d lia
bilit
ies
Taxe
s re
latin
gto
ope
ratin
gac
tiviti
es
Dis
posa
lsan
d ot
her i
ncom
e
Acqu
isiti
ons
ofce
rtain
ope
ratio
nsan
d ot
her c
harg
es*
Settl
emen
ts
Litig
atio
n-re
late
dle
gal f
ees
Taxe
s pa
idon
set
tlem
ents
Net
fina
ncia
l inc
ome
(net
of t
rans
latio
ndi
ffere
nces
and
tax
with
hold
ings
)
Exer
cise
of
war
rant
s
Div
iden
ds p
aid
Fina
l net
fina
ncia
las
sets
bef
ore
fore
x
Fore
x
Net
fina
ncia
las
sets
at
9.30
.200
9Cash flows from
operating activities -108.6 Mio€
Cash flows from litigations
-152.6 Mio€
Cash flows from financial activities
5.6 Mio€
Cash flows from extraordinary
activities 37.2 Mio€
Cash flows from operating activities (as per previous formats)-166.5 Mio€
* 1) Acquisition of fresh milk production and processing assets from National Foods (36.2 million euros); 2) Sundry items (4.6 million euros).

Interim Report on Operations at September 30, 2009 23
Human Resources Group Employees The table below provides a breakdown by geographic region of the employees on the Group’s payroll at September 30, 2009 and a comparison with the data at June 30, 2009 and December 31, 2008.
Total number of employees by geographic region
Geographic region September 30, 2009 June 30, 2009 December 31, 2008 Italy 2,228 2,254 2,343 Europe excluding Italy 1,377 1,392 1,404 Canada 2,897 3,002 2,971 Africa 2,367 2,355 2,238 Australia 1,466 1,460 1,462 Central and South America 3,703 3,714 3,750
Total 14,038 14,177 14,168 In the third quarter of 2009, there were 139 fewer employee on the Group’s payroll than in the previous quarter. The largest decrease occurred in the Canadian SBU, due to the expiration of temporary employment contracts that were not renewed.
24 Interim Report on Operations at September 30, 2009
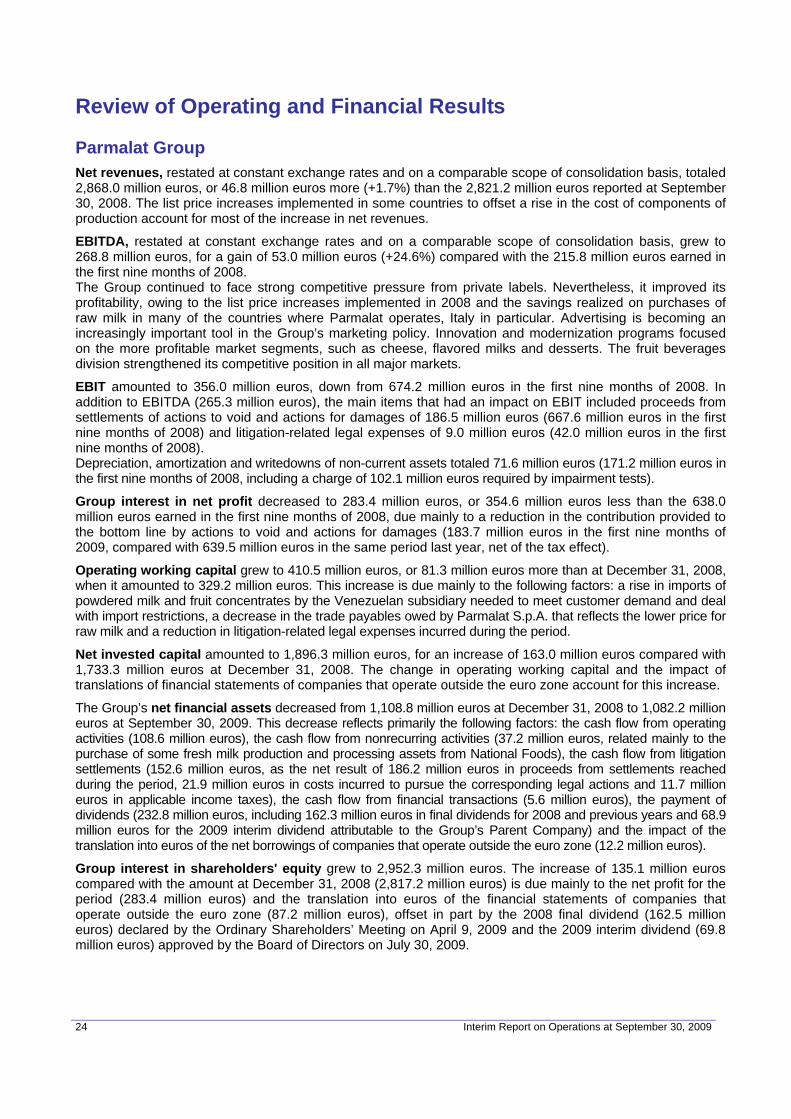
Review of Operating and Financial Results Parmalat Group
Net revenues, restated at constant exchange rates and on a comparable scope of consolidation basis, totaled 2,868.0 million euros, or 46.8 million euros more (+1.7%) than the 2,821.2 million euros reported at September 30, 2008. The list price increases implemented in some countries to offset a rise in the cost of components of production account for most of the increase in net revenues.
EBITDA, restated at constant exchange rates and on a comparable scope of consolidation basis, grew to 268.8 million euros, for a gain of 53.0 million euros (+24.6%) compared with the 215.8 million euros earned in the first nine months of 2008. The Group continued to face strong competitive pressure from private labels. Nevertheless, it improved its profitability, owing to the list price increases implemented in 2008 and the savings realized on purchases of raw milk in many of the countries where Parmalat operates, Italy in particular. Advertising is becoming an increasingly important tool in the Group’s marketing policy. Innovation and modernization programs focused on the more profitable market segments, such as cheese, flavored milks and desserts. The fruit beverages division strengthened its competitive position in all major markets.
EBIT amounted to 356.0 million euros, down from 674.2 million euros in the first nine months of 2008. In addition to EBITDA (265.3 million euros), the main items that had an impact on EBIT included proceeds from settlements of actions to void and actions for damages of 186.5 million euros (667.6 million euros in the first nine months of 2008) and litigation-related legal expenses of 9.0 million euros (42.0 million euros in the first nine months of 2008). Depreciation, amortization and writedowns of non-current assets totaled 71.6 million euros (171.2 million euros in the first nine months of 2008, including a charge of 102.1 million euros required by impairment tests).
Group interest in net profit decreased to 283.4 million euros, or 354.6 million euros less than the 638.0 million euros earned in the first nine months of 2008, due mainly to a reduction in the contribution provided to the bottom line by actions to void and actions for damages (183.7 million euros in the first nine months of 2009, compared with 639.5 million euros in the same period last year, net of the tax effect).
Operating working capital grew to 410.5 million euros, or 81.3 million euros more than at December 31, 2008, when it amounted to 329.2 million euros. This increase is due mainly to the following factors: a rise in imports of powdered milk and fruit concentrates by the Venezuelan subsidiary needed to meet customer demand and deal with import restrictions, a decrease in the trade payables owed by Parmalat S.p.A. that reflects the lower price for raw milk and a reduction in litigation-related legal expenses incurred during the period.
Net invested capital amounted to 1,896.3 million euros, for an increase of 163.0 million euros compared with 1,733.3 million euros at December 31, 2008. The change in operating working capital and the impact of translations of financial statements of companies that operate outside the euro zone account for this increase.
The Group’s net financial assets decreased from 1,108.8 million euros at December 31, 2008 to 1,082.2 million euros at September 30, 2009. This decrease reflects primarily the following factors: the cash flow from operating activities (108.6 million euros), the cash flow from nonrecurring activities (37.2 million euros, related mainly to the purchase of some fresh milk production and processing assets from National Foods), the cash flow from litigation settlements (152.6 million euros, as the net result of 186.2 million euros in proceeds from settlements reached during the period, 21.9 million euros in costs incurred to pursue the corresponding legal actions and 11.7 million euros in applicable income taxes), the cash flow from financial transactions (5.6 million euros), the payment of dividends (232.8 million euros, including 162.3 million euros in final dividends for 2008 and previous years and 68.9 million euros for the 2009 interim dividend attributable to the Group’s Parent Company) and the impact of the translation into euros of the net borrowings of companies that operate outside the euro zone (12.2 million euros).
Group interest in shareholders' equity grew to 2,952.3 million euros. The increase of 135.1 million euros compared with the amount at December 31, 2008 (2,817.2 million euros) is due mainly to the net profit for the period (283.4 million euros) and the translation into euros of the financial statements of companies that operate outside the euro zone (87.2 million euros), offset in part by the 2008 final dividend (162.5 million euros) declared by the Ordinary Shareholders’ Meeting on April 9, 2009 and the 2009 interim dividend (69.8 million euros) approved by the Board of Directors on July 30, 2009.

Interim Report on Operations at September 30, 2009 25
Parmalat Group
RECLASSIFIED CONSOLIDATED INCOME STATEMENT
(in millions of euros) Cumulative at
9/30/09 Cumulative at
9/30/08
REVENUES 2,866.3 2,895.5Net sales revenues 2,847.4 2,876.1Other revenues 18.9 19.4 OPERATING EXPENSES (2,589.0) (2,666.9)Purchases, services and miscellaneous costs (2,248.8) (2,326.3)Labor costs (340.2) (340.6) Subtotal 277.3 228.6 Writedowns of receivables and other provisions (12.0) (8.7) EBITDA 265.3 219.9 Depreciation, amortization and writedowns of non-current assets 1 (71.6) (171.2)Other income and expenses: - Litigation-related legal expenses (9.0) (42.0)- Miscellaneous income and expenses 171.3 667.5 EBIT 356.0 674.2 Financial income 24.1 53.0Financial expense (22.9) (34.5)Net foreign currency translation gain (loss) (0.3) 4.0Other income from (charges for) equity investments 3.2 (0.8) PROFIT BEFORE TAXES 360.1 695.9 Income taxes (74.6) (55.8) NET PROFIT FROM CONTINUING OPERATIONS 285.5 640.1 Net profit (loss) from discontinuing operations - - NET PROFIT FOR THE YEAR 285.5 640.1 Minority interest in net (profit) loss (2.1) (2.1)Group interest in net profit 283.4 638.0 Continuing operations:
Basic earnings per share 0.1670 0.3835
Diluted earnings per share 0.1642 0.3746
1 There were no writedowns of non-current assets in the first nine moths of 2009, as against writedowns totaling 102.1 million euros in the first nine months of 2008.

26 Interim Report on Operations at September 30, 2009
Parmalat Group
RECLASSIFIED CONSOLIDATED BALANCE SHEET
(in millions of euros) 9/30/09 12/31/08
NON-CURRENT ASSETS 1,837.9 1,698.7Intangibles 1,044.7 999.2Property, plant and equipment 723.1 646.3Non-current financial assets 16.0 8.4Deferred-tax assets 54.1 44.8 AVAILABLE-FOR-SALE ASSETS, NET OF CORRESPONDING LIABILITIES 0.1 8.1
NET WORKING CAPITAL 444.8 379.7Inventories 377.2 333.6Trade receivables 471.9 465.5Trade payables (-) (438.6) (469.9) Operating working capital 410.5 329.2
Other current assets 217.1 246.2Other current liabilities (-) (182.8) (195.7)
INVESTED CAPITAL NET OF OPERATING LIABILITIES 2,282.8 2,086.5
PROVISIONS FOR EMPLOYEE BENEFITS (-) (99.1) (87.1)PROVISIONS FOR RISKS AND CHARGES (-) (280.2) (256.4)PROVISION FOR LIABILITIES ON CONTESTED PREFERENTIAL AND PREDEDUCTION CLAIMS (7.2) (9.7) NET INVESTED CAPITAL 1,896.3 1,733.3 Covered by: SHAREHOLDERS' EQUITY 2,978.5 2,842.1Share capital 1,703.1 1,687.4Reserve for creditor challenges and claims of late-filing creditors convertible into share capital 177.9 193.2Other reserves and retained earnings 857.7 393.5Interim dividend (69.8) (130.0)Profit for the year 283.4 673.1Minority interest in shareholders' equity 26.2 24.9
NET FINANCIAL ASSETS (1,082.2) (1,108.8)Loans payable to banks and other lenders 486.2 492.6Loans payable to investee companies 6.0 6.2Other financial assets (-) (393.7) (706.4)Cash and cash equivalents (-) (1,180.7) (901.2) TOTAL COVERAGE SOURCES 1,896.3 1,733.3
Interim Report on Operations at September 30, 2009 27
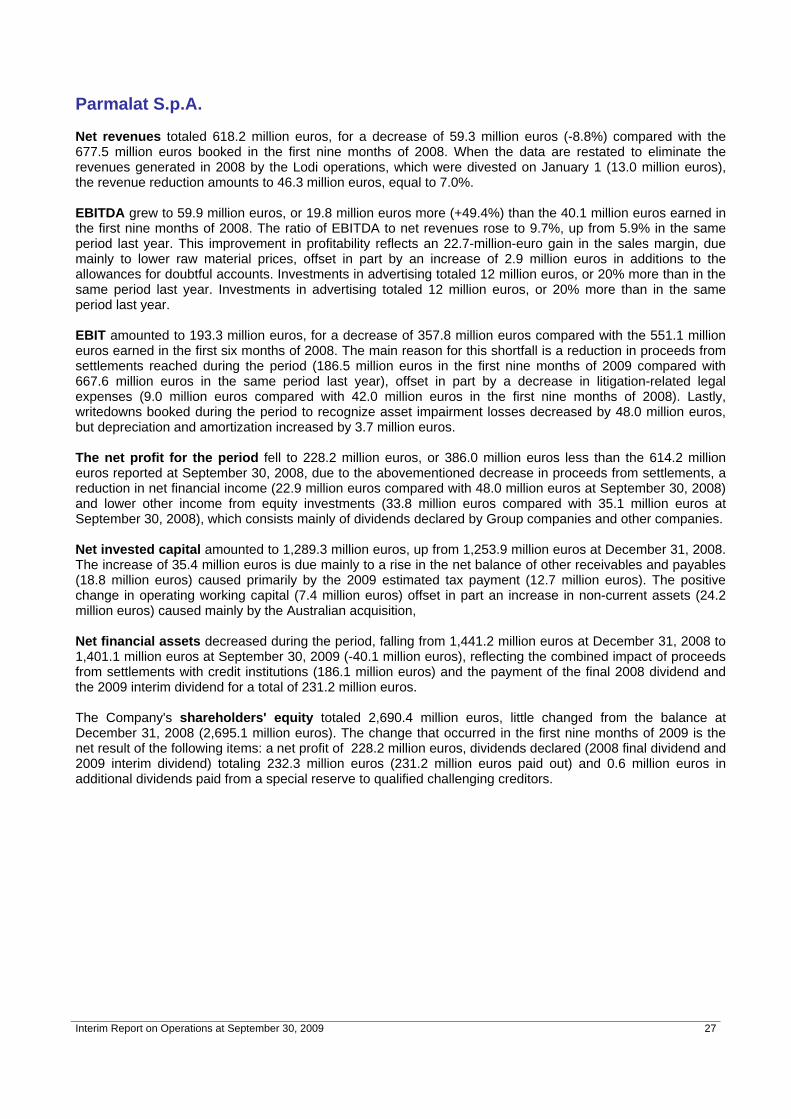
Parmalat S.p.A. Net revenues totaled 618.2 million euros, for a decrease of 59.3 million euros (-8.8%) compared with the 677.5 million euros booked in the first nine months of 2008. When the data are restated to eliminate the revenues generated in 2008 by the Lodi operations, which were divested on January 1 (13.0 million euros), the revenue reduction amounts to 46.3 million euros, equal to 7.0%. EBITDA grew to 59.9 million euros, or 19.8 million euros more (+49.4%) than the 40.1 million euros earned in the first nine months of 2008. The ratio of EBITDA to net revenues rose to 9.7%, up from 5.9% in the same period last year. This improvement in profitability reflects an 22.7-million-euro gain in the sales margin, due mainly to lower raw material prices, offset in part by an increase of 2.9 million euros in additions to the allowances for doubtful accounts. Investments in advertising totaled 12 million euros, or 20% more than in the same period last year. Investments in advertising totaled 12 million euros, or 20% more than in the same period last year. EBIT amounted to 193.3 million euros, for a decrease of 357.8 million euros compared with the 551.1 million euros earned in the first six months of 2008. The main reason for this shortfall is a reduction in proceeds from settlements reached during the period (186.5 million euros in the first nine months of 2009 compared with 667.6 million euros in the same period last year), offset in part by a decrease in litigation-related legal expenses (9.0 million euros compared with 42.0 million euros in the first nine months of 2008). Lastly, writedowns booked during the period to recognize asset impairment losses decreased by 48.0 million euros, but depreciation and amortization increased by 3.7 million euros. The net profit for the period fell to 228.2 million euros, or 386.0 million euros less than the 614.2 million euros reported at September 30, 2008, due to the abovementioned decrease in proceeds from settlements, a reduction in net financial income (22.9 million euros compared with 48.0 million euros at September 30, 2008) and lower other income from equity investments (33.8 million euros compared with 35.1 million euros at September 30, 2008), which consists mainly of dividends declared by Group companies and other companies. Net invested capital amounted to 1,289.3 million euros, up from 1,253.9 million euros at December 31, 2008. The increase of 35.4 million euros is due mainly to a rise in the net balance of other receivables and payables (18.8 million euros) caused primarily by the 2009 estimated tax payment (12.7 million euros). The positive change in operating working capital (7.4 million euros) offset in part an increase in non-current assets (24.2 million euros) caused mainly by the Australian acquisition, Net financial assets decreased during the period, falling from 1,441.2 million euros at December 31, 2008 to 1,401.1 million euros at September 30, 2009 (-40.1 million euros), reflecting the combined impact of proceeds from settlements with credit institutions (186.1 million euros) and the payment of the final 2008 dividend and the 2009 interim dividend for a total of 231.2 million euros. The Company's shareholders' equity totaled 2,690.4 million euros, little changed from the balance at December 31, 2008 (2,695.1 million euros). The change that occurred in the first nine months of 2009 is the net result of the following items: a net profit of 228.2 million euros, dividends declared (2008 final dividend and 2009 interim dividend) totaling 232.3 million euros (231.2 million euros paid out) and 0.6 million euros in additional dividends paid from a special reserve to qualified challenging creditors.

28 Interim Report on Operations at September 30, 2009
Parmalat S.p.A.
RECLASSIFIED INCOME STATEMENT
(in millions of euros) Cumulative at
9/30/09 Cumulative at
9/30/08 REVENUES 635.5 696.0Net sales revenues 618.2 677.5Other revenues 17.3 18.5 OPERATING EXPENSES (569.4) (651.8)Purchases, services and miscellaneous costs (492.9) (568.9)Labor costs (76.5) (83.7) Subtotal 66.1 43.4 Writedowns of receivables and other provisions (6.2) (3.3) EBITDA 59.9 40.1 Depreciation, amortization and writedowns of non-current assets (29.9) (74.2)Other income and expenses: - Litigation-related legal expenses (9.0) (42.0)- Additions to provision for losses of investee companies (12.8) (53.1)- Miscellaneous income and expenses 185.1 680.3 EBIT 193.3 551.1 Financial income 23.4 48.8Financial expense (0.9) (1.1)Net foreign currency translation gain (loss) 0.4 0.3Other income from (charges for) equity investments 33.8 35.1 PROFIT BEFORE TAXES 250.0 634.2 Income taxes (21.8) (20.0) NET PROFIT FROM CONTINUING OPERATIONS 228.2 614.2 Net profit from discontinuing operations - - NET PROFIT FOR THE PERIOD 228.2 614.2

Interim Report on Operations at September 30, 2009 29
Parmalat S.p.A.
RECLASSIFIED BALANCE SHEET
(in millions of euros) 9/30/09 12/31/08
NON-CURRENT ASSETS 1,382.0 1,353.7Intangibles 389.8 401.5Property, plant and equipment 152.4 153.8Non-current financial assets 809.0 773.2Deferred-tax assets 30.8 25.2 AVAILABLE-FOR-SALE ASSETS, NET OF CORRESPONDING LIABILITIES - 4.1
NET WORKING CAPITAL 139.0 127.6Inventories 36.3 39.7Trade receivables 175.4 224.0Trade payables (-) (160.6) (205.2) Operating working capital 51.1 58.5 Other current assets 155.3 169.3Other current liabilities (-) (67.4) (100.2)
INVESTED CAPITAL NET OF OPERATING LIABILITIES 1,521.0 1,485.4 PROVISIONS FOR EMPLOYEE BENEFITS (-) (27.5) (27.7)PROVISIONS FOR RISKS AND CHARGES (-) (198.5) (196.1)PROVISION FOR LIABILITIES ON CONTESTED PREFERENTIAL AND PREDEDUCTION CLAIMS (5.7) (7.7) NET INVESTED CAPITAL 1,289.3 1,253.9 Covered by: SHAREHOLDERS' EQUITY 2,690.4 2,695.1Share capital 1,703.1 1,687.4Reserve for creditor challenges and claims of late-filing creditors convertible into share capital 177.9 193.3Other reserves and retained earnings 651.0 329.0Interim dividend (69.8) (130.0)Profit for the period 228.2 615.4
NET FINANCIAL ASSETS (1,401.1) (1,441.2)Loans payable to banks and other lenders 10.9 5.9Loans receivable from investee companies (25.8) (17.3)Other financial assets (-) (379.2) (679.2)Cash and cash equivalents (-) (1,007.0) (750.6) TOTAL COVERAGE SOURCES 1,289.3 1,253.9

30 Interim Report on Operations at September 30, 2009
Key Events in the Third Quarter of 2009 Litigation Settlements During the third quarter of 2009, Parmalat reached the following out-of-court settlements with credit institutions: • On July 6, 2009, settlement with Banca Popolare dell’Etruria e del Lazio Soc. Coop. amounting to 4.2
million euros; • On July 6, 2009, settlement with Banca di Credito Cooperativo di Bene Vagienna amounting to 0.5
million euros; • On July 28, 2009, settlement with Bank of America amounting to US$98.5 million (settlement subject to
the New York Federal Court granting a contribution bar order). On September 3, 2009, the Irish Court approved the settlement agreement between Parmalat S.p.A. and Eurofood IFSC Limited (in liquidation). Pursuant to this agreement, Eurofood has agreed, in exchange for the issuance by Parmalat S.p.A. of 9 million Parmalat shares, to desist from all legal actions pending against Parmalat S.p.A. and to transfer to Parmalat S.p.A. all rights and claims against Parmalat de Venezuela and Indulac, including a claim for a loan of US$80 million, plus interest. The execution of this agreement is currently pending. Acquisition of Assets in the Fresh Milk Sector from National Foods The transfer from National Foods to the Group of fresh milk production and processing assets located in New South Wales (NSW) and South Australia (SA) was completed on July 27, 2009. These assets were sold pursuant to a contract signed on May 20, 2009 and later approved by the Australian Competition and Consumer Commission. Grant Thornton’s Motion for Summary Judgment is Granted On September 18, 2009, the New York Federal District Court granted the motion for summary judgment filed by Grant Thornton LLP and Grant Thornton International, dismissing the lawsuit filed by Parmalat against the Independent Auditors. Parmalat is appealing this decision.
Events Occurring After September 30, 2009 Settlement with Bank of America On October 2, 2009, following the issuance of a contribution bar order by the New York Federal Court on September 22/23, Parmalat completed a settlement with Bank of America. This settlement resulted in:
• The collection of US$73.5 million, equal to 50.3 million euros; • The transfer to Parmalat S.p.A., for a consideration of US$20 million, of the claims related to a loan
provided to Indulac originally amounting to US$45 million; • The payment, with delayed collection, of an additional US$5 million (3.4 million euros); • The reversal in earnings of the corresponding pro rata share of the provision for “Equity Adjustment
Venezuela” amounting to 19.2 million euros. The total economic effect before taxes is about 86.6 million euros, less legal costs of US$5.9 million (3.9 million euros). The net effect is 60.0 million euros. Parmatour – Proposal of Partial Allocation On September 5, 2009, Parmatour S.p.A. in Extraordinary Administration announced the filing of a Proposal of Partial Allocation with the Court of Parma. The amount allocated to Parmalat S.p.A. is about 49 million euros. This transaction will be completed with the collection of the allocated amount after the Delegated Judge files a decree making the Proposal of Partial Allocation enforceable.

Resoconto intermedio di gestione al 30 settembre 2009 31
Principles for the Preparation of the Interim Report on Operations at September 30, 2009 The Interim Report on Operations at September 30, 2009 was prepared in accordance with the provisions of Article 154-ter “Financial Reporting” of the Uniform Financial Code introduced with Legislative Decree No. 195 of November 6, 2007, by which the Italian Legislature implemented Directive 2004/109/CE (so-called Transparency Directive) on regular financial reporting. The accounting principles applied in the Interim Report on Operations at September 30, 2009 are the same as those used to prepare the Annual Report at December 31, 2008. Consequently, the former should be read together with the latter. The following recently published accounting principles and interpretations went into effect on January 1, 2009, as adopted by the European Commission: IFRS 8 – Operating Segments. Under this principle, which replaces IAS 14, companies are required to base the segment information that they disclose on the same data that management uses to make operating decisions. Consequently, operating segments must be identified based on a company’s internal reporting system, which is regularly reviewed by management to allocate resources to the various segments and assess performance. The adoption of this principle has no impact on the valuation of the items listed in the financial statements, requiring only an increase in the number of segments listed.
Revisions to IAS 1 – Presentation of Financial Statements. This new version of the principle requires companies to disclose in a statement of changes in shareholders’ equity all of the changes generated by transactions with shareholders. All transactions generated with third parties (comprehensive income) must be disclosed either in a single statement of comprehensive income or in two statements (income statement and statement of comprehensive income). The adoption of this principle had no impact on the valuation of the items listed in the financial statements. Revisions to IAS 23 – Borrowing Costs. The new version of this principle requires the capitalization of the borrowing costs incurred to purchase, build or produce qualifying assets that normally become ready for use or for sale only after a significant period of time, thereby eliminating the option of recognizing these costs in earnings on an accrual basis. The adoption of this principle had no impact on the Group. IFRIC 13 – Customer Loyalty Programs. This interpretation deals with the accounting treatment of the liability for rights to receive prizes awarded to customers in connection with customer loyalty programs. The salient points of this interpretation are the following:
• Points awarded to customers are deemed to be an element that can be identified separately from the sale of the product or service for which they are awarded and, therefore, represent a right that customers have implicitly paid for;
• The portion of the consideration allocated to the points must be determined based on the points’ fair value (i.e., the value at which the points could be sold separately) and recognized as revenues, deferred until the company has fulfilled its obligation.
The impact resulting from the adoption of this interpretation was not material. The following principles and interpretations, as adopted by the European Commission, concern situations and issues that do not exist within the Group:
• Revisions to IFRS 2 – Share-based Payments (applicable on January 1, 2009); • Minor revisions to the IFRSs (“IFRS Improvements”) (applicable on January 1, 2009); • IFRIC 15 – Agreements for the Construction of Real Estate (applicable on January 1, 2010); • IFRIC 16 – Hedges of a Net Investment in a Foreign Operation (applicable on January 1, 2010).
32 Interim Report on Operations at September 30, 2009
The Group opted for the early adoption, effective January 1, 2009, of the revised versions of IFRS 3 – Business Combinations and IAS 27 – Consolidated and Separate Financial Statements. The revised version of IFRS 3 requires that incidental costs incurred in connection with a business combination and changes in contingent consideration be recognized in earnings and provides the option of recognizing the full amount of the goodwill generated by the combination, including the goodwill attributable to minority shareholders (full goodwill method). The new rules also change the method currently used to recognize combinations implemented in stages requiring the recognition in earnings of the difference between the fair value on the date of acquisition of the net assets previously held and the corresponding carrying amount. The revised version of IAS 27 calls for the recognition in equity of the effects of the acquisition (divestment) of an equity interest executed after having obtained control, if it does not result in the loss of control. If the sale of an equity interest results in the loss of control, the carrying amount of the remaining equity interest held must be restated to its fair value, and the amount of the restatement must be included in the gain (loss) resulting from the sale.
With the exception of the revised versions of IFRS 3 and IAS 27, the Group did not opt for early adoption of the new accounting principles adopted by the European Union scheduled to go into effect after September 30, 2009. The presentation formats used for the income statement and balance sheet are the same as those used in the Report on Operations section of the Annual Report. As part of the process of preparing the Interim Report on Operations, Directors are required to use accounting principles and methods that, in some instances, require the use of difficult and subjective valuations and estimates based on historical data and assumptions that, in each case, are deemed to be reasonable and realistic under the circumstances existing at that time. The use of these estimates and assumptions has an impact on the amounts reported on the financial statements, which include the balance sheet and the income statement, and affects the disclosures provided therein. The final amounts shown for the financial statement items for which the abovementioned estimates and assumptions were used may differ from the amounts shown on the financial statements due to the uncertainty that is inherent in all assumptions and the conditions upon which the estimates were based. Estimates and assumptions are reviewed periodically and any resulting change is recognized in the accounting records for the period in which the estimate was revised, if the change affects only the current period, or also for subsequent periods, if the change affects the current period and future periods. The financial statement items that require more than others subjective input by the Directors in the development of estimates and with regard to which a change in the conditions underlying the assumptions could have a material impact on the Interim Report on Operations are: goodwill, writedowns of non-current assets, depreciation and amortization, deferred taxes, the allowance for doubtful accounts, the provisions for risks, pension plans and other post-employment benefit plans, and the reserves for creditor challenges and claims of late-filing creditors.
A complete determination as to whether the value of non-current assets has been impaired is carried out only in connection with the preparation of the annual financial statements, when all necessary information is available, except in cases when impairment indicators that require an immediate assessment of any impairment losses are detected.
The income tax liability is recognized based on the best estimate of the average tax rate for the entire year.
Sales of some Group products are more seasonal than those of the rest of the product line, due to different buying habits and consumption patterns. However, the geographic diversification of the Company’s sales significantly reduces this seasonal impact.
The Interim Report on Operations at September 30, 2009 was not audited.
The Board of Directors authorized the publication of this Interim Report on Operations on November 6, 2009.

Resoconto intermedio di gestione al 30 settembre 2009 33
Business Combinations On May, 20, 2009, the Group entered into a binding agreement to acquire from National Foods some fresh milk production and processing assets located in New South Wales (NSW) and South Australia (SA). Pursuant to this agreement, Parmalat Food Products Pty Ltd, a wholly owned subsidiary of Parmalat S.p.A., purchased a portfolio of assets in the fresh milk sector located in the abovementioned regions, including the Lidcombe and Clarence Gardens production facilities, trademark distribution licenses and distribution networks in the NSW, SA and Australian Capital Territory areas. The acquisition was approved by the Australian Competition and Consumer Commission on June 26, 2009, and the transfer of the abovementioned assets was completed on July 27, 2009. The acquisition required a cash payment of 63 million Australian dollars, with adjustments, and the assumption of certain obligations. At September 30, 2009, incidental acquisition costs of 5.7 million Australian dollars were recognized in the consolidated income statement under “Other income and expense.” The price paid was allocated to the acquired assets and liabilities on a provisional basis, due to the time technically necessary to determine their values. Scope of Consolidation During the third quarter of 2009, in addition to the transaction involving Parmalat Food Products Pty Ltd discussed above, the following changes occurred in the scope of consolidation compared with the consolidated financial statements at June 30, 2009:
• On August 19, 2009, Parmalat International SA in liquidation was deleted from the Company Register;
• On September 25, 2009, Lactantia Limited was deleted from the Company Register.

34 Interim Report on Operations at September 30, 2009
Business Outlook for the Balance of 2009 Despite a difficult global economic crisis, the Parmalat Group is confirming its expected results for 2009, due mainly to the following achievements:
• The full return to profitability by the Australian SBU, which, since this past August, has been benefiting from the results generated by assets acquired in the third quarter of 2009;
• An improved performance by the Italian SBU made possible by a reduction in the cost of raw milk and the use of marketing tools to contain a decrease in sales volumes;
• The delivery of positive results by the South African operations, in response to industrial restructuring and reorganization programs and the provision of financial support;
• An outstanding performance by the Venezuelan subsidiary. Preliminary data for the fourth quarter of the year also justify expectations of a revenue increase of 1% to 2% and EBITDA of about 350 million euros.
Certification Pursuant to Article 154 bis, Section 2, of Legislative Decree No. 58/98, as Amended As required by Article 154 bis, Section 2, of the Uniform Financial Code (Legislative Decree No. 58/1998), the Corporate Accounting Documents Officer, Luigi De Angelis, hereby declares that the accounting disclosures provided in this Report are consistent with the data in the supporting documents and in the Company’s other documents and accounting records. Signed: Luigi De Angelis Corporate Accounting Documents Officer
Parmalat S.p.A.
Via delle Nazioni Unite 4 43044 Collecchio (Parma) - Italy
Tel. +39,0521,808,1 www.parmalat.com
Share capital: 1,703,143,566 euros fully paid-in Parma R.E.A. No. 228069
Parma Company Register No. 04030970968 Tax I.D. and VAT No. 04030970968


