1 l INTERIM REPORT Q1 2020 The interim report has been prepared in accordance with the IAS 34 Interim Financial Reporting and requirements set by the Bank of Estonia for quarterly reporting by credit institutions. LUMINOR BANK AS, Estonia
Transcript
1
l
INTERIM REPORT
Q1 2020 The interim report has been prepared in
accordance with the IAS 34 Interim
Financial Reporting and requirements set
by the Bank of Estonia for quarterly
reporting by credit institutions.
LUMINOR BANK AS, Estonia
Luminor Bank AS Interim report for the period ended 31 March 2020
2
CONTENTS
CEO COMMENT ................................................................................................................................................................................. 3
Luminor Bank AS Interim report for the period ended 31 March 2020
3
CEO COMMENT
The first quarter of 2020 witnessed global events that no one could have predicted before the start of the year. The COVID-19 pandemic made us swiftly readjust the priorities that we had set for the year, with ensuring the safety of our employees and customers becoming our main focus.
Luminor is an important part of the Baltic economy. We continue to offer banking services and financial infrastructure in our home markets even under the emergency situations declared by the Baltic governments, while taking comprehensive measures to assure the safety of our employees and customers. We are helping to mitigate the economic harm caused by the pandemic by offering simplified grace period solutions for both private individuals and corporate customers.
Collaboration is one of Luminor’s core values and we view it as vitally important both in dealing efficiently with the current situation and in preparing to come out of it. Luminor has taken an active role in developing the measures that the Baltic governments have prepared for stimulating the economies and mitigating the impact of COVID-19. We will use state guarantees to provide investment and working capital loans to companies in all three countries and we are also investigating how we can participate in the guarantee programmes offered by the European Investment Fund.
Luminor started the year with a significantly improved funding position and we fully intend to use our strong financial standing for the benefit of our customers. We have introduced a new operating model and made our operations more efficient, so we were stronger and nimbler when the crisis hit, which allowed us to adapt quickly to the changing circumstances. We continued to improve our funding structure in the first quarter of 2020 and we have brought the loan-to-deposit ratio down to 99.7% from 108.4% a year ago. The underlying business performance without extraordinary expenses has improved as well. There was a net loss in the first quarter of 21.2 million EUR that was due mainly to provisions for credit impairments caused by the spread of COVID-19.
On 4 March, Luminor issued the first covered bonds from the Baltic region, for 500 million EUR, with an interest rate spread over mid-swap of 0.25% and a final yield of -0.18%. This set the record for the lowest-ever rate paid by a non-government issuer from the Baltics. The funds received were used to broaden our funding base and to increase our liquidity buffers further.
Remote services have become additionally important for health and safety reasons during the current crisis. We have put more people in our call centres to advise our customers, and we launched remote customer onboarding in Latvia in the first quarter of this year, which made us the first bank in the country to provide this service fully remotely. The service will be extended to Lithuania and Estonia during 2020. Another step in promoting our online business was the launch of the e-Commerce Gateway, an acquiring solution for online merchants in all three Baltic countries.
Luminor is also making good progress in becoming independent from the networks and payment systems of our former parent banks. In the first quarter of this year, we finished setting up independent payment infrastructure on all the core banking systems in the three countries. We are also making strong headway with the carveout on international payment flows processed through the Nordea Group, and we plan to become fully independent on those payments during the first half of 2020. Although current circumstances forced us to revisit our migration schedule at the end of March, the process of moving our customer accounts to the targeted unified systems is progressing, and it should be finalised in Latvia, Lithuania and Estonia in 2020. Luminor Retail Banking increased its presence in the housing loan market by 5% and continued to focus on balanced active sales of lending products and on attracting customer deposits in the first quarter of 2020, but market fluctuations caused by the first impacts of the current pandemic were already being witnessed at the end of March. Corporate Banking focused on measures to help our customers cope with the heavy blow dealt to their business developments by the outbreak of the virus. More than 24 million EUR of provisions for credit losses were set up in Corporate Banking in the first quarter, with 90% of those provisions in response to the expected impact of COVID-19 on the financial standing of our customers and to sharply lower oil prices.
The distress caused in financial markets by the pandemic has also impacted pension assets under management, which fell to 1.3 billion EUR. This is down 11% from the end of 2019 and is at the same level as a year before.
Luminor remains committed to our proactive and vigilant stance in detecting and preventing money laundering and terrorism financing, and in the first quarter of 2020 we continued to enhance our financial crime risk management framework.
Like the rest of the euro area, the Baltics are preparing to take a hit from the economic impact of the health crisis and the ensuing lockdown of economies. It is of the utmost importance that we start focusing on how those economies will recover, with the aid of substantial support from both the EU and national governments. The Baltic banks are well capitalised with stronger balance sheets and can be part of the solution by extending liquidity and keeping the credit flowing to the real economy. Intensive work is being done at Luminor to prepare for how the economic lockdown will impact the economy. We are strengthening the organisational capabilities that will let us support our customers, we are working with different scenarios for how the crisis will evolve and for the economic impact it will have, we are reviewing our costs and financial plans, and we are doing much more besides. More importantly, we are preparing for how we can contribute to restarting the economy.
Luminor Bank AS Interim report for the period ended 31 March 2020
4
I am very grateful to the entire Luminor team, who have responded wonderfully well in dealing with these extraordinary circumstances and ensuring the vital banking services and support that our customers need, while also preparing for how we will exit this crisis. Building tomorrow starts today.
Erkki Raasuke
CEO
Luminor Bank AS Interim report for the period ended 31 March 2020
5
MANAGEMENT REPORT
General information
Luminor Bank AS (Luminor) was established on 1 October 2017 through the merger of the Baltic operations of DNB Bank ASA (Commercial Register no. 984 851 006, DNB) and Nordea Bank Abp (Commercial Register no. 2858394-9, Nordea) to create a new-generation financial service provider for local businesses and financially active people.
On 30 September 2019 it was announced that the transaction signed on 13 September 2018 between DNB, Nordea and US-based private equity firm Blackstone had been concluded and as a result a consortium led by private equity funds managed by Blackstone acquired a 60.1% majority stake in the bank. The bank’s initial owners Nordea and DNB each retained a 19.95% equity stake in Luminor, but an arrangement has been made by the consortium and Nordea for the purchase of Nordea’s remaining stake over the coming years.
Luminor is the third-largest provider of financial services in the Baltics, with some 900 000 clients, 2 501 employees, and market share of 16.0% in deposits and 18.0% in lending as at the end of March 2020. Luminor has total shareholders’ equity of 1.6 billion EUR and it is capitalised with a CET1 ratio of 20.5%. Luminor’s core business is serving entrepreneurial people in the Baltics with a primary focus on local companies and the financially active people.
Luminor offers its customers a wide range of products and services through all possible channels, digital and physical, with 34 customer service centres in total in Latvia, Lithuania and Estonia, of which nine are meet-up points. Luminor owns 357 ATMs throughout the Baltic states, and additionally provides services through 100 ATMs in partnership with other financial services providers.
31 March 2020
Estonia Latvia Lithuania GroupGr Total
Number of customers ~132 000 ~226 000 ~566 000 ~924 000
Market shares
Lending 12.9% 22.9% 19.7% 18.0%
Deposits 8.7% 17.2% 20.9% 16.0%
Number of client service centres, including meet- up points
8 10 16 34
Number of employees 600 875 1 026 2 501
Macroeconomic overview
It is clear by now that the COVID-19 outbreak will have significant economic implications, although it is hard to predict the length and severity of its impact. The consensus outlook for global growth for 2020 is clearly negative, with a recovery coming only in 2021. The impact on the Baltic economies is likely to be concentrated in the second and third quarters of the year, and that impact will be severe, but temporary.
There is, however, a significant degree of uncertainty in how the gradual re-opening of the economies will impact the spreading of the virus. The Baltic states were quick at closing borders and imposing social distancing, and hence currently have fatalities per million inhabitants which are less than 5% of the levels seen in large parts of Europe (e.g. the UK, France, Benelux). Whether this is indicative of a more successful strategy of protecting public health, or whether we are looking at a more prolonged impact from the virus in the Baltics, is too early to say.
The experience of other countries hit by COVID-19 suggests that growth will drop substantially in the Baltic economies in the near term, as both production and consumption is negatively impacted by the measures needed to contain the virus, and from the disruption of global supply chains. Sharp recessions in the Baltic economies, concentrated to the second quarter, are very likely, but should be followed by a gradual recovery from Q3 onwards. Some of the key trading partners for the Baltic states, including Germany and Denmark, have already taken the first steps towards a gradual reopening of their economies. GDP growth in the euro area, the
Luminor Bank AS Interim report for the period ended 31 March 2020
6
key destination for Baltic exports, however decelerated noticeably already in the end of 2019, to only 1% in the fourth quarter compared to a year earlier, being dragged down by lower activity levels in manufacturing and trade.
The economic expansion in the Baltic states has been robust in recent years, with GDP growth outpacing the euro area average by a significant margin. In addition, in stark contrast to the situation going into the Global Financial Crisis, Baltic private as well as public sector debt in relation to GDP is among the lowest in Europe, which may cusion the economic shock from the pandemic. Domestic demand and business activity held up well in the region until the pandemic started, with very tight labour markets supporting high-single digit wage growth and strong retail sales. However, this strong starting points does not entirely insulate the region’s economies from feeling the impact from the pandemic.
The European Central Bank (ECB) has delivered substantial support for the euro area as a whole, and the Baltic countries will benefit on top of this from targeted extraordinary fiscal support measures at both the national and EU levels to mitigate the consequences of the crisis. The impact of these measures is yet uncertain however, as the crisis hits subsegments of the economy very differently and the availability of the fiscal support for those sectors mostly hit. There is no doubt that the loss of activity in the coming quarters will be significant, but it is crucial that the economies can recover swiftly after the spread of the virus has been contained and as the gradual reopening from lockdown proceeds.
COVID-19
After the outbreak of COVID-19, all three Baltic countries declared a state of emergency, and as a result the regular way of living was changed immediately. Different measures were put in place to decrease the speed of infection, and thereby protect public health, and ensure the stability of the health care system. Many of these measures have had severe effects on regular activities in the societies, impacting directly or indirectly businesses and jobs.
Following the footsteps of other countries in the world, Estonian, Latvian, and Lithuanian governments have launched programs to stimulate the economies to mitigate the negative effects from the pandemic.
At large, the state measures put in place can be divided into five major categories, represented in all Baltic countries:
• Employment measures – granting limited sums per person to support the individuals, who have lost all or majority of their
income, and companies, to allow them to keep people employed, in order to survive state of emergency;
• Tax measures – allowing exemptions or suspension or deductions of tax contributions of private individuals and companies
in affected sectors;
• Liquidity measures – deferring tax deadlines, granting loan guarantees and loans to companies;
• Stimulating the economy – accelerating investment programs and public expenditure, reducing capital adequacy
requirements for financial institutions;
• Sector- or company-specific measures – targeted financial support or loans to sectors and companies most heavily impacted
(retail, tourism, large employers), important from national interest or recovery perspective (transportation, aviation, etc).
In Estonia, the state-owned financial institution KredEx is providing capital loans and investment loans, and offers extraordinary loan guarantees in co-operation with banks since the end of March. KredEx targets specific sectors and companies hit by pandemic, as well as projects of national importance, covering amounts up to 5 million EUR per company.
In Latvia, the loan guarantees and liquidity loans are provided by state-owned financial institution ALTUM, directly and in cooperation with commercial banks. Latvia has also introduced number of measures to support retail companies to survive the crisis. There are different tax related measures implemented in Latvia, including repayment of overpaid VAT.
Lithuania has introduced a 5 billion EUR “Economic and Financial Action Plan” to support the economy, maintain business liquidity, jobs, and healthcare. As an example, small fixed payouts are distributed to self-employed people affected by the state of emergency. Lithuania is also injecting 1 billion EUR into the economy by accelerating investment programs, and has introduced a number of tax and consumption-oriented measures.
In addition, there are number of measures targeted at banks - banks can operate temporarily below the level of capital defined by the Pillar 2 Guidance, the capital conservation buffer and the liquidity coverage ratio requirements, or use capital instruments that do not qualify as Common Equity Tier 1 instruments. In addition, the countercyclical capital buffer and/or systemic risk buffer requirements have been reduced. The ECB has eased conditions for targeted longer-term refinancing operations (TLTRO III) and added some funding possibilities for banks (including the Pandemic Emergency Funding Facility).
Luminor Bank AS Interim report for the period ended 31 March 2020
7
Being an important part of the Baltic economies, in order to support our customers in this difficult time and offer best financial advice, Luminor has kept its customer service centers open, though strict measures have been adopted to protect our employees and customers – we are more frequently cleaning the facilities and ATM’s, we have put in place mandatory facemasks and safety screens for employees, and we also are limiting the number of simultaneous customer visits to service centers. To prevent the spread of virus, over 70% of our employees are working remotely.
To help our customers withstand the crisis, Luminor offers simplified grace period solutions both to private individuals and corporate customers in all three Baltic countries. This means that bank is not asking any additional documents from the customer, not changing the loan agreement conditions and not taking any fee.
We also aim to help distribute the state guaranteed loans, and utilize other potential programs to ensure the availability of investment and working capital loans for companies in all three countries.
Business development
Luminor completed its cross-border merger on 2 January 2019 and continues its operations in all the three Baltic countries through the bank headquartered in Estonia and its branches in Latvia and Lithuania. After the completion of the merger, all assets, rights and liabilities of Luminor Bank AS (Latvia) and Luminor Bank AB (Lithuania) were transferred to Luminor Bank AS in Estonia. The bank continues its activities in Latvia and Lithuania through its locally established branches. A new organisational set up and a new governance structure were also introduced, and new members of management bodies were appointed.
The deposits and financial instruments of the depositors and customers using the investment services of Luminor Bank AS and its Latvian branch and Lithuanian branch are guaranteed by the deposit guarantee and investor protection scheme established and operated by the Estonian Guarantee Fund.
The process of setting up independent payment infrastructure for all the core banking systems in the three countries was completed in February 2020. Luminor established its own correspondent banks network in 2019 and gained independence in international payments from the correspondent banking accounts of DNB. It is now making good headway with the international payment flows processed through the Nordea Group, planning to become independent on payments during the first half of 2020.
The gradual migration of the legacy Nordea customers in Latvia to the Luminor information systems continued in the beginning of 2020. The process of finalising the systems and migrating the customers to the targeted unified systems is progressing, with the aim to finalize the migration in all countries during 2020. Even with the ongoing pandemic, this remains one of Luminor’s top priorities for the year.
PRODUCT AND DIGITAL DEVELOPMENT
In the first quarter of 2020 Luminor continued strengthening its Daily Banking offering with the launch of several new services. Remote customer onboarding was launched in Latvia, making Luminor the first bank in the country to provide the service fully remotely. Luminor aims to extent this service to Lithuania and Estonia during the year.
Luminor also launched the e-Commerce Gateway, an acquiring solution for online merchants, in all three Baltic states. The e-Commerce Gateway provides card acquiring services for accepting VISA and Mastercard cards, and uses the Open Banking application programming interfaces (APIs) of major banks to enable account-to-account payments to be acquired.
Luminor also launched its Black Card in Latvia. This credit card is an excellent value proposition for domestic and overseas use and the aim is for it to become the target credit card for Luminor customers in all three countries.
The Luminor Investor platform was launched in Estonia in February 2020, following its launch in Latvia and Lithuania in October 2019. The investment platform is tailored for investors of all levels of experience and offers a wide range of non-complex financial instruments, with more than 14 500 instruments in total. The platform was built jointly with Scandinavian partners and gives a simplified customer experience that lets customers build their savings at their own pace.
THE RETAIL BANKING SEGMENT
The focus of the Retail Banking team remained on achieving balanced sales of our lending products and attracting customer deposits, and it increased the bank’s presence in the housing loan market by 5%, mainly through the Latvian and Lithuanian markets. The market share for newly issued consumer loans has increased by some 3% in Latvia and Lithuania, while it declined by 0.4% in the Estonian market. Lending volumes for the mass business customers have remained stable and at the same level as in the first quarter of 2019. The portfolio of deposits of private clients has grown by 4.5% from the same quarter of 2019. By the end of March the Retail
Luminor Bank AS Interim report for the period ended 31 March 2020
8
Banking team was already seeing the first impact of the COVID-19 outbreak as market fluctuations squeezed the assets under management of retail customers by 153 million EUR.
The e-Commerce Gateway was launched for mass business customers at the end of the first quarter and within the first two weeks of launch it had received 52 applications and converted 13 of them into agreements.
The Retail Banking team continued to focus on its migration work during the quarter and the first mass business clients were successfully migrated from the legacy Nordea systems to the targeted Luminor unified information systems. The team continued to consolidate the distribution channels and improve efficiency in related areas. Two service centres were relaunched with a new concept in the first quarter of 2020 and Luminor was serving its customers in a total of 34 locations across the Baltics.
THE CORPORATE BANKING SEGMENT
The top priority for the Corporate Banking team in the first quarter of 2020 was to take measures to help corporate customers cope with the impact of COVID-19 on their business. More than 24 million EUR of provisions for credit losses were set up in corporate banking in the first quarter of 2020, and 90% of those provisions were in response to the expected impact of COVID-19 on the financial standing of clients and to sharply lower oil prices.
The lending portfolio decreased by 19% compared to the last year as a result of the repricing and optimisation of the portfolio and slower new sales, partly due to COVID-19. The deposits of corporate customers remained at the same level as in the first quarter of 2019, as the Corporate Banking team has been putting more emphasis on improving the quality of deposits by replacing large concentrated accounts with more diversified SMEs.
Trading income showed solid results as higher market volatility brought along increased customer activity in the risk hedging transactions.
THE WEALTH MANAGEMENT SEGMENT
Wealth Management introduced several new solutions for our customers in the first quarter.
The Luminor Investor platform was rolled out in full in all three Baltic states and was promoted to customers interested in financial investments, also the new VISA Infinite card for the Private Banking segment was introduced for Latvian and Lithuanian customers.
Business growth and customer satisfaction remained firmly in the focus of the Private Banking and Pensions teams.
The distress caused in financial markets by COVID-19 reduced the pension assets managed to 1.3 billion EUR, which was roughly the same as a year earlier and 11% down from the end of 2019.
By the end of the first quarter Luminor had 291 000 second pillar pension customers and 63 000 third pillar customers.
The Private Banking team focused on growing the assets under management and reached 1.37 billion EUR in the first quarter of 2020, which was 7% more than in the same quarter of 2019 and 3.6% less than at the end of 2019.
The focus remains on achieving a high level of customer satisfaction by being available for our customers, and on ensuring operational communication in the face of the elevated volatility in financial markets.
CORPORATE SOCIAL RESPONSIBILITY
The safety and well-being of Luminor employees and customers has been and remains our top priority in all our activities. We at Luminor are keeping our customer service centers open and continuing to offer banking services to our customers even under the current difficult circumstances, but we have taken comprehensive measures to assure the safety of our employees and our customers. These measures include the maximum possible use of remote work, extra attention to cleaning and the availability of disinfectants in all our facilities and ATM’s, the provision of protective equipment for all our employees, and limits on the number of customer visits to the customer service centers at any one time.
Remote services have become especially crucial in the current pandemic, and Luminor has encouraged customers to use digital services to the greatest extent possible. Working together with our partners, Luminor initiated a community investment project in the first quarter of 2020 that aims to help local companies take their business online or advance their current e-business capabilities. We are also currently offering our payment solution e- Commerce Gateway for free so that we can help promote safer e-business.
Luminor Bank AS Interim report for the period ended 31 March 2020
9
The rapidly changing environment, the large number of unknowns, and the new ways of working can all cause considerable stress. For that reason, we are paying special attention to communication and consultation with our employees so that we can aid them in adapting to the new circumstances and let them focus on their work and life balance. Separate webinars to share the knowledge we have gained have been delivered for Luminor customers, covering topics like remote working and cyber security during the current crisis.
In our concern for environmental sustainability, Luminor developed risk-adjusted environmental and social risk evaluation procedures in the first quarter of 2020 to be applied to all legal entities. The procedure requires E&S evaluation for every new customers and during every annual review of existing customers with a limit extending EUR 0.5 million. To support this, we ran training courses for the employees most connected to the topic.
Efficient governance is of great importance to us and so we reviewed and updated Luminor’s governance policies and procedures. An audit was carried out in this that recommended further improvements to the Management Board.
EFFORTS TO PREVENT FINANCIAL CRIME
Luminor remains vigilant and committed to detecting and preventing financial crime, and we regularly review our anti-financial crime (AFC) practices and invest in the human and technological resources that are needed. We work constantly to get a better understanding of our customers and their transactions, and to manage and report any potential financial crime risk. Luminor predominantly serves residents of Estonia, Latvia and Lithuania, and customers who have a strong personal or business connection to the Baltic states.
During the first quarter of 2020, Luminor has further enhanced its financial crime risk management framework to prevent, detect, manage and report potential financial crime risk, and this has supported its conservative approach towards money laundering and financial crime. The framework covers technology, policies and procedures for detecting financial crime, risk assessments, training and awareness-raising, and ongoing monitoring of new and developing financial crime risks. As we are subject to a wide range of legal requirements, Luminor is transparent in all its activities and works closely with all the supervisory and regulatory authorities. Luminor also follows the international guidelines, recommendations and standards issued by the regulatory and supervisory authorities, international bodies and local banking associations, and the financial intelligence units in each Baltic state.
Luminor continued to invest in its systems and processes so it can adapt in a constantly changing environment. The bank is further developing its common monitoring and screening solution in all three Baltic states and has envisaged several further developments that are to be delivered during 2020.
Luminor considers that awareness-raising activities are an important component of the financial crime risk management framework. During the first quarter, 31 training events related to AFC and corporate compliance areas were held on 10 different topics.
OTHER EVENTS
On January 27 Auri Loog joined Luminor as the Head of Internal Audit Division. She is a Certified Internal Auditor with a solid experience in banking and auditing sectors. The former Head of Internal Audit Jelena Gute went on to lead Luminor’s Group Finance Department.
EVENTS AFTER 31 MARCH 2020
In order to be prepared for dealing efficiently and expertly with the additional workload potentially caused by the economic impact of COVID-19 and support our customers also in the most difficult cases, a Credit Advisory and Restructuring division has been established as of 1 May 2020. It is a temporary dedicated unit with a planned duration of 18 months with a possible 6-month extension period, supporting the current teams working in this field. The Head of the new division is Solvita Deglava. She has strong experience in the restructuring area, having worked in that capacity in different banks.
Luminor Bank AS Interim report for the period ended 31 March 2020
10
Financial results
Net loss in the first quarter amounted to 21.2 million EUR and was mainly driven by loan loss provisions as a result of the COVID-19 pandemic. Loan loss provisions amounted to 26.4 million EUR compared to 7.3 million EUR net reversals in same period last year, resulting in a 1.05% loan loss ratio.
Net interest income in the first quarter was 54.1 million EUR compared to 63.8 million EUR a year ago and was impacted by continued repricing and rightsizing of the balance sheet. Interest income declined by 3% while the loan portfolio decreased by 12% as a result of planned effort to ensure fair pricing of risk and improve profitability. Interest expense increased by 54% or 5.8 million EUR as a result of the process to become an independently funded bank and continuous work with funding diversification. Consequently, net interest income-to-loans ratio in the first quarter was 2.2% compared to 2.3% in the same period last year. Net commission income decreased by 5% compared to same quarter last year, with one of the key drivers being early signs of lower customer activity due to COVID-19 pandemic.
Total operating expenses in the first quarter were 71.4 million EUR and have decreased by 1% compared to the same period last year. Exceptional costs have increased from 17.2 million EUR in the first quarter last year to 25.3 million EUR this year. In the first quarter this year the largest part were IT expenses, which constituted 89% and other costs were 11% of total exceptional expenses. Total operating expenses excluding exceptional costs have decreased by 16% compared to the same period last year. The underlying business performance has improved, which is also reflected in cost-to-income ratio without exceptional costs of 57.5% compared to 59.7% in the first quarter last year.
The funding structure continued to improve as a loan-to-deposit ratio reached 99.7% compared to 108.4% a year ago. It was supported by 567 million EUR increase in deposits and 1.4 billion EUR decline in lending portfolio.
* Quarterly ratios (ROE, ROA, NIM, C/I, Credit impairment ratio) are expressed on an annualised basis
** If loan recoveries prevail, the ratio is negative
Luminor Bank AS Interim report for the period ended 31 March 2020
11
Explanations
Average equity (belonging to the owners of the company) = (equity at the end of the reporting period + equity at the end of the previous period) / 2
Return on equity (ROE) = Net profit / Average equity * 100
Average assets = (assets at the end of the reporting period + assets at the end of the previous period) / 2
Return on assets (ROA) = Net profit / Average assets * 100
Average interest earning assets = (interest-earning assets at the end of the reporting period + interest-earning assets at the end of the previous period) / 2
Net interest margin (NIM) = Net interest income / Average interest earning assets * 100
Cost / Income ratio = Total operating expenses / Net total operating income * 100
Credit impairment ratio = Net losses or reversal on loans to customers / Net loans, average * 100
Loans / Deposits ratio = Loans to customers / Deposits from customers * 100
CET 1 ratio = Common Equity Tier 1 Capital / Risk-weighted Assets
Loans to customers at the end of the first quarter totalled 9.9 billion EUR, having been 10.2 billion EUR in December 2019. The composition has slightly changed during last 12 months as the share of loans to business customers has decreased from 46% to 43% while loans to individual customers have increased from 52% to 56% at the Baltic level. Luminor’s share of the lending market in the Baltics has decreased from 20.9% to 18.0% over the past 12 months.
Deposits from customers at the end of the first quarter totalled 10.0 billion EUR, having been 10.2 billion EUR in December 2019. The composition has been stable, with deposits from individual customers comprising 40% of the deposit portfolio of Luminor at the Baltic level, followed by 39% from business customers and 17% from public sector. Luminor’s share of the deposit market in the Baltics has decreased from 16.9% to 16.0% over the past 12 months.
Luminor Bank AS Interim report for the period ended 31 March 2020
12
ASSET QUALITY FOR Q1 2020
The adverse impact of COVID-19 is reflected in asset quality of Luminor.
The most severe consequences will most probably be seen in industries like accommodation, tourism, and aviation. Even though Luminor’s portfolio towards these economic sectors is relatively small, negative trends in the portfolio are still observed since many other industries are quite severely affected as well. As a result, requests for modifications (including grace period) reached 0.9 billion EUR at the end of March 2020 and exceeded 1.1 billion EUR (11% of the total credit portfolio) by the middle of April 2020.
Considering the situation, and the generous terms for modifications, the number of modifications has been limited so far.
Approximately 70% of modification requests came from business customers. Earlier applications for modification from business customers compared to individual customers can be explained by the following reasons:
• business customers have been affected first; moreover, professional financial management leads business customers to
immediately approach the bank, if foreseeing the need for modifications;
• individual customers often have unemployment benefits.
The largest part of modification requests from business customers are for industries like real estate activities, transportation and storage, wholesale and retail trade, manufacturing.
The most common modification type is grace period on principal payments. Luminor is restrictive (applying only exceptionally) towards granting full grace period (including grace on interest payments).
The volume of overdue loans is fluctuating and not yet showing negative trends, however, depending on the development of the pandemic and measures taken by governments, this might accelerate in the second quarter of 2020.
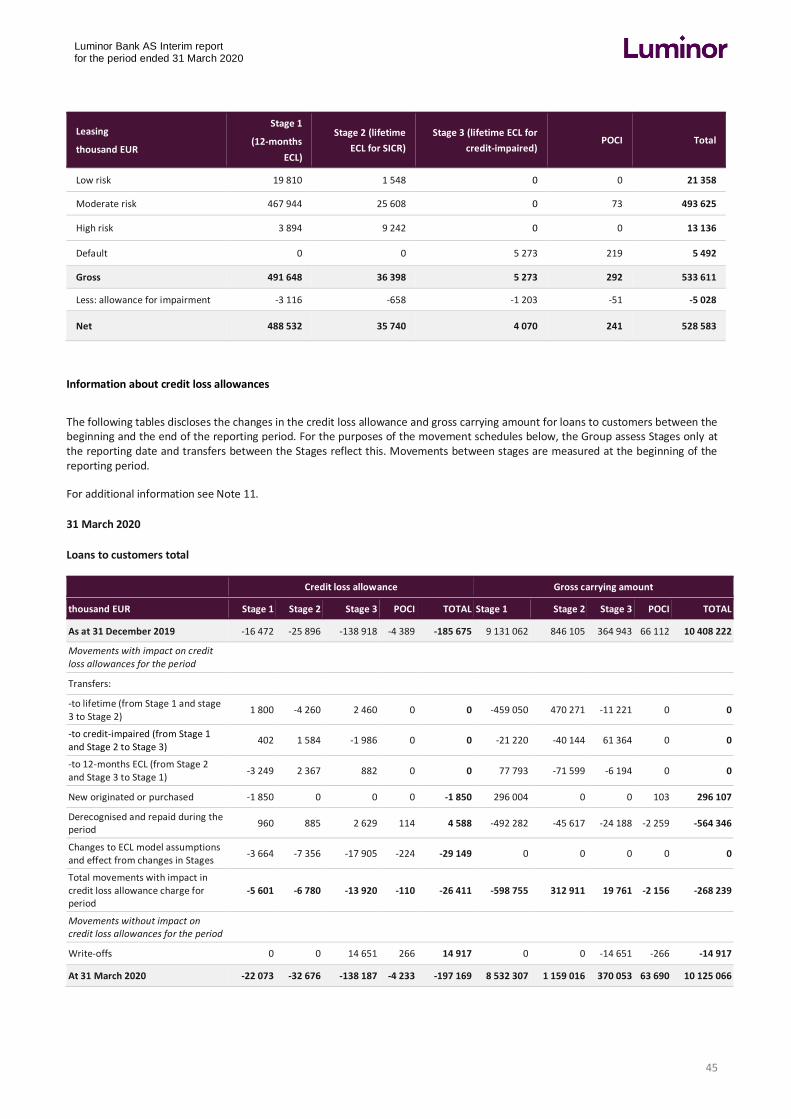
During the first quarter, Luminor loan loss provisions reached 26.4 million EUR. Approximately 50% of the provisions was for Stage 3 while the rest was for Stage 1 and 2 exposures. Stage 1 and 2 provisions increased mainly due to changes in the macroeconomic outlook in the models, and an increase of watch list customers. 60% of Stage 3 provisions in the period related to new non-performing loans (NPLs). In addition, 30% represented additional provisions on existing NPLs relating to the energy sector.
The share of non-performing loans (NPL ratio) was 3.9% at the end of the quarter, which is an increase of 0.1 percentage points from the previous quarter. The NPL ratio for the mortgage loans portfolio was unchanged at 2.9%.
Total impairment allowances on the balance sheet were 197.2 million EUR at the end of the quarter, of which 142.2 million EUR related to Stage 3 exposures. This can be compared with total non-performing loans of 393.5 million EUR.
Luminor Bank AS Interim report for the period ended 31 March 2020
13
Asset quality of Luminor as at 31 March 2020
31 March 2020
thousand EUR* Total Estonia Latvia Lithuania
Financial institutions
Stage 1
Gross carrying amount 8 720 6 688 1 148 884
Impairment allowances -38 -29 -4 -5
Carrying amount 8 682 6 659 1 144 879
Stage 2
Gross carrying amount 5 210 2 860 2 306 44
Impairment allowances -100 -72 -27 -1
Carrying amount 5 110 2 788 2 279 43
Stage 3
Gross carrying amount 104 98 6 0
Impairment allowances -2 -1 -1 0
Carrying amount 102 97 5 0
Total carrying amount for financial institutions 13 894 9 544 3 428 922
Public sector
Stage 1
Gross carrying amount 155 914 67 233 8 702 79 979
Impairment allowances -28 -18 0 -10
Carrying amount 155 886 67 215 8 702 79 969
Stage 2
Gross carrying amount 43 2 0 41
Impairment allowances 0 0 0 0
Carrying amount 43 2 0 41
Stage 3
Gross carrying amount 378 0 0 378
Impairment allowances 0 0 0 0
Carrying amount 378 0 0 378
Total carrying amount for the public sector 156 307 67 217 8 702 80 388
Impairment ratio % = Total Allowances / Total Gross Loans
The credit quality of loans as at 31 March 2020 is disclosed in the table below using the risk scale set in the Luminor Credit Manual: the probability of default for low-risk rating grades (1 to 4) is in the range of 0.00% to 0.75%, for moderate-risk rating grades (5 to 7) it ranges from 0.75% to 3.00%, and for high-risk rating grades (from 8 to 10) it is from 3.00% to 40.00%.
Luminor Bank AS Interim report for the period ended 31 March 2020
16
Economic sectors
The following table breaks down the loans and advances to customers at their carrying amounts, as categorised by the economic sectors of our counterparties.
*Private individuals do not include non-profit organisations and self-employed individuals.
Information about credit-impaired loans and collaterals
The amount of credit-impaired loans is reported together with the value of related collateral held as security in the tables below. Credit-impaired loans are most often secured by real estate and movable assets. The value for such collateral is equal to its market value and not its liquidation value, and this is updated shortly after the default has been identified.
31 March 2020
thousand EUR Gross
Allowance for
impairment Net Fair value of collateral
Business customers 227 752 -96 735 131 017 160 272
One of the main objectives for Luminor is to create a self-sustaining combined banking group. A key requirement for achieving this is that the former parent funding provided in equal parts by DNB and Nordea should gradually be replaced by other forms of funding such as deposits and wholesale funding from third parties.
Luminor has achieved tangible results in getting closer to being a self-funded banking group. Deposits from customers stood at 9 959 million EUR at the end of the first quarter of 2020, and at 10 235 million EUR on 31 December 2019. In March 2020 Luminor issued its inaugural five-year covered bond for 500 million EUR, which received a long-term rating of Aa1 from Moody’s. The covered bond issuance raised the value of bonds outstanding under the EMTN programme to 1 156 million EUR at the end of the first quarter of 2020 from 652 million EUR at 31 December 2019. The senior unsecured bonds issued under the EMTN programme have been assigned a rating of Baa2 by Moody’s.
In addition to its deposits from customers and wholesale funding, Luminor has outstanding debt facility lines with its former parent companies DNB and Nordea. This funding amounted to 150 million EUR at the end of the first quarter of 2020 and was provided in the form of a syndicate, with each syndicate partner providing 50%. The covered bond issuance meant the total amount committed to the facility under the agreement, used and unused combined, was reduced to 2 337 million EUR as at 31 March 2020 from 2 837 million EUR as at 31 December 2019. The amount of the facility is committed for five years from 1 October 2019, initially three years
Luminor Bank AS Interim report for the period ended 31 March 2020
17
with the option for Luminor to extend it by up to two years, and it can be drawn with maturities of one, two or three years. The facility is partly secured, as Luminor has assigned mortgage loans to it with a carrying value of 1 762 million EUR as at 31 March 2020 and 1 929 million EUR as at 31 December 2019. The total committed but unused credit line was 2 187 million EUR as at the end of the first quarter of 2020 and 1 932 million EUR as at 31 December 2019.
On 2 April 2020 Luminor received its minimum own funds and eligible liabilities (MREL) requirement as a decision of the Single Resolution Board (SRB) dated 20 December 2019 that was executed for Luminor by the decision of Finantsinspektsioon, the Estonian FSA, dated 1 April 2020. The MREL decision sets the following MREL requirements for Luminor:
• Luminor Holding AS (parent company of Luminor Bank AS) shall comply with the MREL at the consolidated level of Luminor Bank AS, on a consolidated level of 17.28% of total liabilities and own funds at all times, and 11.97% of total liabilities and own funds shall be met with subordinated instruments;
• Luminor Holding AS shall have a transitional period until 30 June 2022 to comply with these requirements.
As at 31 March 2020 the total MREL ratio stands at 17.0% on the consolidated level of Luminor Bank AS (16.3% as at 31 December 2019) and 12.1% of total liabilities and own funds were subordinated instruments (11.5% as at 31 December 2019) . It should be noted that the MREL requirements have been set using data from 31 March 2019. This means the decision does not consider any subsequent events.
Rating
On 13 September 2018 Moody’s assigned Luminor long and short-term, foreign and local currency deposit ratings of Baa1/Prime-2, with a stable outlook. There have been no changes to Luminor’s ratings since then. On 25 March 2020 Moody’s issued an updated credit opinion for Luminor.
On 11 March 2020 Moody’s assigned a definitive Aa1 rating to the mortgage covered bonds issued by Luminor Bank AS under the Estonian Covered Bonds Act.
LIQUIDITY
Luminor’s structural liquidity risk is conservative and well-balanced, and based on metrics to measure liquidity risk, is appropriately adopted to the current economic and regulatory environment. Luminor uses a range of metrics to measure liquidity risk. One metric used is the Liquidity Coverage Ratio (LCR). The LCR for Luminor was 144% as at the end of the first quarter and 150% as at 31 December 2019 by the definition of the LCR in the Capital Requirements Regulation (CRR). The liquidity buffer is composed of highly liquid central bank eligible securities and cash. Long-term liquidity risk is measured as the Net Stable Funding Ratio (NSFR). As at the end of the first quarter of 2020, Luminor’s NSFR was 126%, while as at 31 December 2019 it was 123%.
372
4 2713 950
1738
150
11561610
All other Liabilities Corporate
deposits
Retail deposits Public sector
deposits
Parent Funding Debt securit ies
issued
Equity
Luminor Bank AS Interim report for the period ended 31 March 2020
18
Q1 2020 Q4 2019 Q3 2019 Q2 2019 Q1 2019
LCR 143.7% 149.8% 144.3% 132.5% 131.2%
NSFR 126.0% 123.0% 118.0% 127.4% 122.0%
Deposit structure
Deposits from customers are predominantly from residents of the Baltics. In total, 99.2% of all deposits in terms of volume are from EU residents.
Deposits by residency per country:
Total Estonia Latvia Lithuania
CAPITAL
The capitalisation of Luminor is sufficient to ensure financial stability and provide the capital needed to deliver the business strategy. As at 31 March 2020 the total consolidated Capital Ratio of Luminor Bank AS was 20.5% and as at 31 December 2019 it was 19.7%, making it comfortably above the internal target of 17%. As at 31 March 2020 the own funds of Luminor were 1 598 million EUR and as at 31 December 2019 they were 1 572 million EUR, and they were fully composed of Common Equity Tier 1 (CET1) capital.
In its Capital Adequacy calculations Luminor uses the standardised method to calculate risk weighted exposure amounts for credit risk and market risk. Risk weighted exposure amounts for operational risk are calculated using the Basic Indicator Approach method.
As at 31 March 2020, the Leverage Ratio, calculated in accordance with the CRR, was 11.5%, and as at 31 December 2019 it was 10.9%. The leverage ratio is calculated as total Tier 1 own funds divided by the total risk exposure measure, including the risk position on assets and off-balance-sheet liabilities.
Capital ratios
Position Q1 2020 Q4 2019 Q3 2019 Q2 2019 Q1 2019
Leverage Ratio 11.46% 10.88% 10.89% 10.59% 12.00%
CET 1 Ratio 20.54% 19.66% 18.73% 17.99% 20.02%
T1 Capital Ratio 20.54% 19.66% 18.73% 17.99% 20.02%
Total Capital Ratio 20.54% 19.66% 18.73% 17.99% 20.02%
1.1%
97.0%
1.9% 1.2%
97.5%
1.3% 0.4%
97.5%
2.1%0.8%
97.8%
1.4%
Baltic, Estonia, Latvia, Lithuania
Other EU Non-EU
Luminor Bank AS Interim report for the period ended 31 March 2020
19
According to the prudential requirements, the Pillar 2 requirement set by the ECB in the 2019 Joint Decision on Capital and the Systemic risk and Countercyclical risk buffer requirements set by the Latvian, Estonian and Lithuanian regulators, Luminor Group is required to hold capital exceeding 10.8% CET1 and 15.2% Total capital. Estonian regulator has set a 1.0 % Systemic risk buffer requirement that applies to Luminor’s exposures in Estonia and translates to 0.2% from Luminor’s total risk weighted exposure amount. As response to the COVID-19 situation, the systemic risk buffer will be 0% starting from 1 of May 2020. Lithuanian regulator has set a 1.0% Countercyclical buffer requirement that applies to Luminor’s exposures in Lithuania and forms 0.5% of Luminor’s total risk weighted exposure amounts. As reponse to the COVID-19 situation, the countercyclical buffer was set to 0% starting from 1 April 2020.
Own funds requirements
thousand EUR 31 March 2020 31 December 2019
TOTAL RISK EXPOSURE AMOUNT 7 781 232 7 969 099
1. RISK-WEIGHTED EXPOSURE AMOUNTS FOR CREDIT, COUNTERPARTY CREDIT AND DILUTION RISKS AND FREE DELIVERIES
Regional governments or local authorities 12 815 13 445
Public sector entities 567 674
Institutions 52 457 54 281
Corporations 3 582 956 3 742 611
Retail 1 341 714 13 742 611
Secured by mortgages on immovable property 1 508 980 1 532 931
Exposures in default 275 703 292 472
Items associated with particularly high risk 154 512 134 498
Equity 6 089 5 778
Other items 118 775 128 517
TOTAL RISK EXPOSURE AMOUNT FOR POSITION, FOREIGN EXCHANGE AND COMMODITIES RISKS
21 921 19 232
TOTAL RISK EXPOSURE AMOUNT FOR OPERATIONAL RISK (OpR ) 684 108 679 644
TOTAL RISK EXPOSURE AMOUNT FOR CREDIT VALUATION ADJUSTMENT 20 635 17 784
Luminor Bank AS Interim report for the period ended 31 March 2020
20
Statement of the Management Board
The interim report of Luminor Bank AS for the first quarter of 2020 consists of the following parts and reports:
• The Management Report;
• The Condensed Consolidated Interim Financial Statements.
The data and additional information presented in the interim report of Luminor Bank AS for the first quarter of 2020 are true and complete. The Condensed Consolidated Interim Financial Statements have been prepared according to the principles of the International Accounting Standard IAS 34 Interim Financial Reporting and the requirements established by the Credit Institutions Act for the disclosure of information.
Luminor Bank AS and the Bank’s subsidiaries are going concerns.
Erkki Raasuke
CEO and Chairman of the
Management Board
Tallinn, 26 May 2020
Luminor Bank AS Interim report for the period ended 31 March 2020
Total equity at 31 December 2019 34 912 1 412 243 1 198 183 916 1 632 269
Total equity at 31 December 2019 34 912 1 412 243 1 198 183 916 1 632 269
Profit (loss) for the period 0 0 0 -21 192 -21 192
Other comprehensive income 0 0 4 0 4
Total comprehensive income for the period 0 0 4 -21 192 -21 188
Transfer to mandatory reserve 0 0 0 0 0
Other 0 0 0 -1 031 -1 031
Total equity at 31 March 2020 34 912 1 412 243 1 202 161 693 1 610 050
* On 28 May 2019 Luminor’s shareholders decided to carry out a bonus share issue, followed by a reduction of share capital. The bonus share issue is based on the bank’s interim balance sheet as of January 2, 2019 and involves a partial conversion of share premium in the amount of 216 030 920 EUR into share capital. Following the bonus issue, the share capital of the bank has been reduced by the same amount and was paid out to the shareholders in September 2019.
Luminor Bank AS Interim report for the period ended 31 March 2020
25
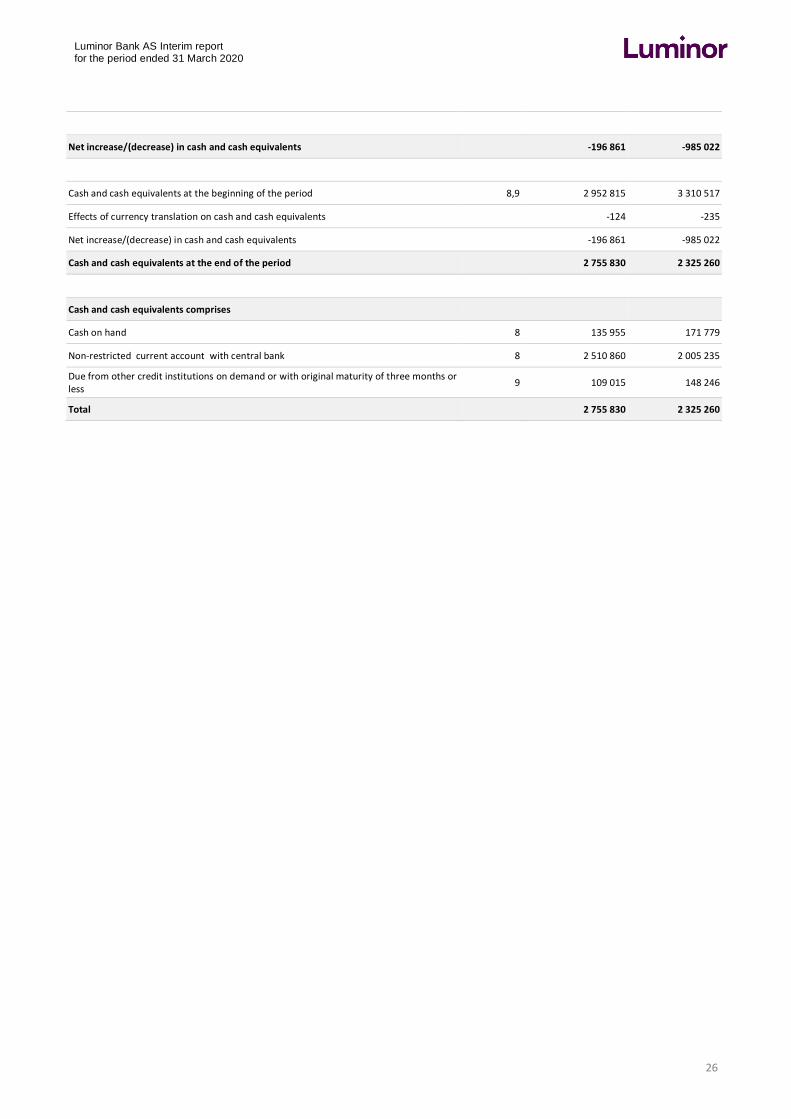
CONDENSED CONSOLIDATED STATEMENT OF CASH FLOWS
thousand EUR Notes Q1 2020 Q1 2019
Cash flows from operating activities
Profit before tax -18 965 28 010
Adjustment for:
-Net impairment (losses)/ reversal on loans to customers 11 26 411 -7 276
-Dividend income -18 -29
-Share of profit from an associate -311 -214
-Loss/(profit) from foreign currency revaluation 124 235
-Depreciation, amortisation and impairment 2 990 3 571
-Other adjustments 1 674 -301
-Interest income 4 -70 624 -74 550
-Interest expenses 4 16 544 10 736
Cash flow from operations before changes in operating assets/liabilities -42 175 -39 818
Change in operating assets/liabilities
Increase (-) / decrease (+) of lending to customers 269 868 211 118
Increase (-) / decrease (+) of other assets -4 740 5 736
Cash flow from operating activites -656 993 -950 991
Investing activities
Acquisition of property and equipment and intangible assets -979 -2 632
Acquisition of investment property 0 800
Proceeds from disposal of property and equipment and intangible assets 625 8 401
Dividend received 18 29
Cash flow from investing activities -336 6 598
Financing activities
Debt securities issued 503 313 0
Payments of principal on leases -670 -811
Cash flows from financing activities 502 643 -811
Luminor Bank AS Interim report for the period ended 31 March 2020
26
Net increase/(decrease) in cash and cash equivalents -196 861 -985 022
Cash and cash equivalents at the beginning of the period 8,9 2 952 815 3 310 517
Effects of currency translation on cash and cash equivalents -124 -235
Net increase/(decrease) in cash and cash equivalents -196 861 -985 022
Cash and cash equivalents at the end of the period 2 755 830 2 325 260
Cash and cash equivalents comprises
Cash on hand 8 135 955 171 779
Non-restricted current account with central bank 8 2 510 860 2 005 235
Due from other credit institutions on demand or with original maturity of three months or less
9 109 015 148 246
Total 2 755 830 2 325 260
Luminor Bank AS Interim report for the period ended 31 March 2020
27
NOTES TO THE CONDENSED CONSOLIDATED INTERIM FINANCIAL STATEMENTS
1. SIGNIFICANT ACCOUNTING POLICIES
CORPORATE INFORMATION
Luminor Bank AS (Luminor, the Bank or the Group) is a local credit institution whose parent company is Luminor Holding AS that is ultimately controlled by BCP VII, an investment fund managed by an affiliate of Blackstone Group Inc. Other shareholders of Luminor Holding AS - Nordea Bank Abp and DNB BANK ASA - are considered to be the entities with significant influence over the Group. The Luminor Bank’s registered legal address is Liivalaia 45, 10145, Tallinn, Republic of Estonia.
New company Luminor Holding AS, established on the 14th of May 2019, is the new parent company of Luminor Bank AS since 23 September 2019. Until 23 September 2019 the parent company was Luminor Group AB.
On 2 January 2019 Luminor Bank AS has completed its cross-border merger and continues its operations in all Baltic countries through the Estonian registered bank, Luminor Bank AS, and its branches in Latvia and Lithuania.
On 30 September 2019 a consortium led by private equity funds managed by Blackstone acquired a 60.1% majority stake in the Luminor Holding AS, the owner of Luminor Bank AS. Luminor Bank AS previous owners, Nordea Bank Abp ("Nordea") and DNB BANK ASA ("DNB"), each retained a 19.95% equity stake in the Bank.
In the current interim report, “Bank” (or Luminor Bank AS) refers to Luminor Bank AS. “Group” refers to the consolidated financial statements of Luminor Bank AS and its subsidiaries.
As at 31 March 2020 Luminor Bank AS directly or indirectly owned majority in the following subsidiaries (100%):
Registered country Republic of Estonia:
Registered country Republic of Latvia:
Registered country Republic of Lithuania:
• Luminor Liising AS
• Luminor Pensions Estonia AS
• Promano Estonia OÜ
• Luminor Asset Management IPAS
• Luminor Finance SIA
• Luminor Latvijas atklātais pensiju fonds AS
• Luminor Līzings SIA
• Luminor Līzings Latvija SIA
• Promano Lat SIA
• Realm SIA
• Salvus SIA
• Salvus 2 SIA
• Salvus 3 SIA
• Salvus 4 SIA
• Salvus 6 SIA
• Trioleta SIA
• Baltic ipasums SIA
• Industrius UAB
• Intractus UAB
• Promano Lit UAB
• Recurso UAB
• Luminor Investiciju Valdymas UAB
• Luminor Lizingas UAB
• Gėlužės projektai UAB (under liquidation)
As at 31 March 2020 Luminor Bank AS had ownership in the following associated companies (25%):
• ALD Automotive AS
• ALD Automotive SIA
• ALD Automotive UAB
• SIA Kredītinformācijas Birojs
Luminor Bank AS Interim report for the period ended 31 March 2020
28
BASIS OF PREPARATION
The condensed consolidated interim financial information of Luminor Bank AS (Luminor, the Bank or the Group) was prepared in accordance with IAS 34 Interim Financial Reporting as adopted by the European Union. The condensed consolidated interim financial information does not contain all the information and disclosures required in the annual financial statements and should be read in conjunction with the annual financial statements of Luminor Bank AS for the year ended 31 December 2019.
The accounting policies adopted in the preparation of the condensed consolidated interim financial information are consistent with those followed in the preparation of the Luminor Bank AS annual financial statements for the year ended 31 December 2019, except for the adoption of new standards effective as of 1 January 2020. The Group has not early adopted any standard, interpretation or amendment that has been issued but is not yet effective. Several amendments and interpretations apply for the first time in 2020, but do not have a material impact on the interim condensed consolidated financial statements of the Group.
Group decided to present financial information in interim report at the same format as it was presented in the annual financial statements of Luminor Bank AS for the year ended 31 December 2019, therefore comparative data for the period Q1 2019 has been updated accordingly.
2. SIGNIFICANT ACCOUNTING ESTIMATES AND JUDGMENTS
The Group makes estimates and applies assumptions that affect the amounts recognised in the consolidated financial statements and the carrying amounts of assets and liabilities. Estimates and judgements are continuously evaluated and are based on management’s experience and expectations of future events. In the first quarter of the 2020 global COVID-19 pandemic affected many economies, individuals and companies and thus also required Luminor to react and make certain judgements which inter alia had the effect on the impairment amounts.
IMPAIRMENT OF FINANCIAL INSTRUMENTS
The Group recognizes credit losses in accordance with IFRS 9. The Standard applies a forward-looking expected credit loss (ECL) approach. The Group is required to recognize an allowance for expected losses for all loans and other debt financial assets not held at fair value through profit or loss (FVPL), together with loan commitments and financial guarantee contracts. The assets to test for impairment are divided into three groups depending on the stage of credit deterioration. Stage 1 includes assets where there has been no significant increase in credit risk since initial recognition or which are classified as low credit risk (credit rating indicating investment grade). The allowances for stage 1 assets are based on the expected credit losses associated with the probability of default in the next twelve months (12-month expected credit loss). Stage 2 includes assets where there has been a significant increase in credit risk. The allowances for stage 2 assets are based on the expected credit losses associated with the probability of default over the life of the asset (lifetime expected credit losses). Stage 3 includes credit-impaired (defaulted) assets, and the allowances reflect the lifetime expected credit losses. Material assets in stage 3 are tested for impairment on an individual basis, while for immaterial stage 3 assets a collective assessment is performed. Loss allowances based on lifetime expected credit losses are calculated also for additional category - purchased or originated credit-impaired assets (POCI) - regardless of the changes in credit risk during the lifetime of an instrument.
The Group’s ECL calculations are outputs of complex models with a number of underlying assumptions regarding the choice of variable inputs and their interdependencies. Elements of the ECL models that are considered accounting judgements and estimates include:
• evaluating the criteria for assessment of significant increase in credit risk and allocation of loans to stage 1 or 2; identification of unlikely to pay criteria and assignment of loans to stage 3;
• classification of forbearance and Watch list;
• assessing accounting interpretations and modelling assumptions used to build the models that calculate ECL, including the various formulas and the choice of inputs;
• the modelling and calculation of key parameters of ECL model, including probability of default (PD), loss given default (LGD) and exposure at default (EAD);
• determining the macro-economic indicators and incorporating forward-looking information into the ECL model;
• estimating the above-mentioned indicators for reliable future period and for three different scenarios (baseline, optimistic and pessimistic) and assigning probabilities to those scenarios;
Luminor Bank AS Interim report for the period ended 31 March 2020
29
• estimating ECL under base case and risk case scenarios for stage 3 material assets individual assessments and assigning probabilities to those scenarios;
• setting principles for stage 3 immaterial assets collective assessment.
The model applied (including triggers for significant increase in credit risk) was not changed in the first quarter of 2020. The macroeconomic parameters were reviewed to reflect the outlook due to COVID-19.
More qualitative and quantitative information on an impairment of financial assets in light of COVID-19 is provided in Note 3 General Risk Management Policies.
FAIR VALUE OF FINANCIAL INSTRUMENTS
Where the fair values of financial assets and financial liabilities recorded on the statement of financial position cannot be derived from active markets, they are determined using a variety of valuation techniques that include the use of mathematical models. The input to these models is taken from observable markets where possible, but where this is not feasible, a degree of judgement is required in establishing fair values. For the fair value of financial assets and liabilities refer to Note 17.
3. GENERAL RISK MANAGEMENT POLICIES
MAIN GOALS
The aim of risk management at Luminor is to achieve an optimal balance between the risk of losses and the earnings potential in a medium- and long-term perspective.
The Luminor Risk Management function is organised in order to ensure efficient and effective risk management and full implementation of the principles and requirements outlined in Luminor’s Risk Policy and Strategy.
The risk management principles are the following:
• Risk Accountability: every area in the Group is accountable for the risks arising from their activities;
• Risk Identification, Assessment, Measurement, Monitoring, Mitigation and Reporting: all material exposures must be identified, assessed, managed and reported in a timely and accurate manner;
• The Group shall have a conservative overall risk profile and only assume risk which Luminor is able to identify, assess, manage and monitor;
• The Group is committed not to offer products or services or perform other acts which entail a risk of contributing to unethical conduct, infringement of human or labour rights, corruption or serious environmental harm.
The Group maintains a Recovery Plan following the Bank Recovery and Resolution Directive adopted by the European Parliament. The plan serves as one of Luminor’s key risk management tools and ensures procedures for restoration of the Group’s solvency following situations of severe stress without any involvement by or support from the authorities or taxpayers.
Luminor’s risk appetite in general is low. The Group assesses its capital and liquidity adequacy on an ongoing basis.
The Group analyses, evaluates, accepts and manages the risks or combinations of risks to which it is exposed to. The most important types of risk the Group is exposed to are solvency risk, credit risk, model risk, market risk, liquidity risk, operational risk, reputational risk, and business model risk. Concentration risk is assessed as part of the credit risk, other types of concentration risk are assessed to be less material for the Group. Market risk includes foreign exchange risk and interest rate risk. Operational risk includes also compliance, fraud and financial crime, business continuity and IT stability risks, as well as risks related to cyber- and information security.
In the light of COVID-19 epidemic developments in Europe, the ECB-led Comprehensive Assessment (i.e. both the Asset Quality Review and Stress Test exercises) has been put on hold until further notice. The ECB will inform Luminor when the new information on revised dates and timelines is available. Luminor has reprioritized its strategic activities for year 2020 accordingly and is focusing on a COVID-19 impact assessment and performs institution-wide stress tests under COVID-19 affected macroeconomic scenarios and financial shocks.
Luminor Bank AS Interim report for the period ended 31 March 2020
30
The risk management in the Group is organised in such a way that any possible conflicts of interest are avoided or escalated.
Organisational Structure of the Risk Management function:
The Enterprise Risk Department is a centralized center of expertise and manages risk management tools and processes which run across different risk types. The control function for operational risk lies under the responsibility of the Operational Risk Department. The Market & Liquidity Risk Department is responsible for market risk and liquidity risk control. The control function for credit risk is split under the responsibility of the Credit Risk Department and Credit Risk Quantification Department. The Model Risk & Validation Department owns the model risk framework and respective validation activities. The Risk Programmes: CA & IRB Department and Risk Transformation Department drive Luminor’s development and further improvement of risk management. The Risk division is part of the second line of defence and the organisational departments within the Risk division report directly to the Group Chief Risk Officer (CRO).
Risk management processes and the effectiveness of internal control are assessed by the Internal Audit function (third line of defence).
The internal control framework – as a system of organisational measures, actions covering the whole Luminor Group, including the Management’s responsibilities and tasks, and the activities of all business lines and internal units, including internal control functions, outsourced activities and distribution channels and internal procedures – ensures the effective and efficient operations and prudent conduct of business, compliance with laws, regulations, supervisory requirements and Luminor’s internal policies, the adequate and continuous identification, assessment, measurement, monitoring, mitigation and reporting of risks, the sound administrative and accounting procedures as well as the reliability of financial and non-financial information and submission thereof in a timely manner. The Management Board is responsible for establishing and monitoring the adequacy and effectiveness of internal control system and for overseeing all business lines and internal units in the Group.
The Management Board and/or Supervisory Council approve the most important policies and strategies comprising the Group’s risk management framework.
The Supervisory Council Risk Committee advises the Supervisory Council regarding the setting and monitoring of risk appetite, strategy and further matters related to risk management. The Supervisory Council Risk Committee raises concerns and warns, where appropriate, when specific developments materially affect or may affect Luminor’s risk profile.
The Credit Committee is a decision-making body regarding individual credit cases and contributes to the development of a sound and uniform credit culture in the Group. The Credit Committee provides recommendations regarding important credit regulations.
COVID-19
The COVID-19 pandemic and the preventive measures imposed by most of the European countries had an adverse impact on economies in the first quarter of 2020. Luminor has been monitoring the spread of COVID-19 since early 2020 and was preparing to adjust its risk management to the new reality. The impact on different types of risks is disclosed further below.
CREDIT RISK
Credit risk is defined as the risk for the Group to incur losses due to customers’ failure to fulfil their financial obligations towards the Group. Credit exposures arise primarily in lending activities, including from off-balance sheet financial instruments, such as loan commitments, guarantees and letters of credit.
The key principles of Luminor’s credit risk management are outlined in the Group Credit Policy, Credit Strategy for Legal Entities and Credit Strategy for Private Individuals. Practical aspects of the application of the principles set out in these documents, and decision-making processes are regulated by the Credit Manual for Legal Entities and Credit Manual for Private Individuals.
Group Chief Risk Officer
Enterprise RiskOperational
RiskMarket &
Liquidity RiskCredit Risk
Credit Risk Quantification
Model Risk & Internal
Validation
Risk Programmes:
CA & IRB
Risk Transformation
Luminor Bank AS Interim report for the period ended 31 March 2020
31
The spread of the COVID-19 is a global tragedy that requires governments, private businesses, and all citizens to work together and fight this disease and its consequences. In a first instance, this has required governments across Europe and also in the Baltic states to impose significant constraints on social- and economic life to slow the spread of the disease, avoid overburdening of the health care system, and by doing so saving lives. These social- and economic constraints carry high costs, because they imply a significant reduction of economic activity, including businesses being almost entirely shut down in certain sectors, and strongly increasing unemployment as a consequence.
Since Luminor is one of the largest banks in the Baltic region, many of Luminor’s customers are directly or indirectly affected by this situation, some of our customers are severely affected. We in Luminor feel therefore strongly that we need to play as constructive role as possible to support our customers during this time of need and to serve the Baltic states and communities by securing a robust and stable financial system and robust and stable financial services.
This also requires from Luminor to extend additional support and additional solutions to our customers in order to make sure that our customers get through this difficult period as well as possible. On the other hand, Luminor is also charged with the responsibility to protect Luminor’s depositors, and to make sure that Luminor’s balance sheet and the Baltic financial system do not become overburdened by businesses for which there is no outlook of recovering from this crisis into a sound and viable business. These customers need to be significantly restructured, and in cases where even that is no longer feasible, some businesses might have to be wound down in an orderly manner.
In order to be able to appropriately work with customers and manage COVID-19 related credit risks, the Group prepared a dedicated “COVID-19 Manual” for Legal Entities. Luminor’s general focus on our customers’ ability and willingness to perform their financial obligations is maintained. When considering modifications, particular emphasis is put on whether deteriorations are triggered by the external COVID-19 shock and a robust recovery is expected afterwards. Luminor’s standard approach and procedures are applied if deteriorations started already before COVID-19 or deteriorations are not related to COVID-19. The industry in which the customer operates, the fact whether Luminor is the main lender, and the type of credit product also play a role. In case of new lending, the financial ability to serve the credit remains a key aspect. For individual customers payment holidays on principal payments for a limited period of time might be granted either automatically if certain predefined conditions are met or through performing individual assessments. By the end of first quarter 2020 no industry-wide private moratoria which would comply with the European Banking Authority’s (the EBA) Guidelines on legislative and non-legislative moratoria on loan repayments applied in the light of the COVID-19 crisis were in place.
Credit decisions are made by Credit Committees and authorised individuals according to defined powers to act, which are risk adjusted. The decision of the Credit Committee must be unanimous. Powers to act for individuals (Credit Officers and persons from Sales, Restructuring & Recovery) are personal and based on competence level. Some extent of flexibility for decision taking on “automatic” changes was introduced to be able to handle more customer requests for modifications.
Modifications and forbearances
Luminor has defined standard modification solutions for COVID-19 affected customers. For individual customers standard/automatic grace period for principal payments is granted if the customer had acceptable payment history (no more than 21 days overdue during last 12 months): up to 6 months for mortgage loans, up to 3 months for consumer loans and leasing agreements. For business customers solutions are also product specific. For commercial loans, a grace period up to 6 months is granted for low and medium risk level customers. For leasing agreements, a grace period up to 3 months is possible, if the leasing object is a passenger car and historical overdues during the last 12 months did not exceed 15 days; and for low and medium risk transportation sector entities where exposure does not exceed 2 million EUR and historical overdues and trends in historical financial results evidence that difficulties are purely COVID-19 related.
Individual evaluation of modification requests is performed for all other cases. For COVID-19 affected customers the state support programmes or state guarantees are used whenever feasible.
Forbearance treatment in essence is kept unchanged, the integral condition is financial difficulties. Currently the modification is not classified as forbearance if
• individual customers have good payment history and acceptable loan-to-value (LTV) ratio, meaning overdues below 21 days during last 12 months and LTV below 85 per cent;
• business customers are considered low and medium risk, taking into account the combination of financial risk and industry risk.
Besides regular reports prepared and presented to the Group’s management bodies to follow the level and developments of the assumed credit risk, specific COVID-19 related reports are being prepared which are also shared with the ECB.
Luminor Bank AS Interim report for the period ended 31 March 2020
32
Impairment policies
The Group recognises credit losses in accordance with the requirements of IFRS 9. IFRS applies a forward-looking expected credit loss (ECL) approach. For more detailed information on the impairment policies, please refer to Note 5 General Risk Management Policies of the Luminor Bank AS Annual Report 2019. In the first quarter of 2020 the impairment methodology remained unchanged.
Different authorities – the ECB, EBA, European Securities and Markets Authority (ESMA), IFRS Foundation, Basel Committee on Banking Supervision (BCBS) – have announced various measures to deal with the crisis and minimise the effect on the economies. The Group acts in line with above mentioned institutions’ guidance in regards of ECL. The modifications granted for COVID-19 affected customers do not automatically indicate Significant Increase in Credit Risk (SICR), nor classification to forbearance or default status. However, the obligation to assess for unlikeliness to pay (which consequently triggers default status) remains in place.
The set of SICR triggers was not changed:
• Significant increase of lifetime PD – significant increase of lifetime PD since initial recognition until the reporting date (2.5 times and 0.6 p.p. jointly);
• Risk grade 9 or 10 – risk grade 9 or 10 as at the reporting date;
• >30 days past due – more than 30 days past due as at the reporting date;
• Forborne performing – forborne performing status as at the reporting date (forbearance not triggering non-performing status) in accordance with FINREP instruction reporting requirements;
• Watch list – watch list status as at the reporting date.
If at least one of the above SICR indicators is identified after initial recognition of the financial instrument and was not present as of its origination the financial asset is treated as facing a significant increase in credit risk.
Three macroeconomic variables - annual change in real GDP, unemployment rate and annual change of residential real estate price - are included in the PD and LGD estimation modelling for the individual customers segment and two of them – annual change in real GDP together with unemployment rate – are used for PD and LGD estimation modelling in case of the business customers segment. The following tables show the parameters that were used for macroeconomic modelling as at 31 March 2020 and 31 December 2019. For the first quarter of 2020 the forecasts of macroeconomic variables were updated by Luminor macroeconomists at the end of March 2020 with projections and assumptions over three years. Following the ECB guidance, excessively procyclical forecasts were avoided assuming not only the nearest short-term downturn (the first year) but also the recovery period in the market after that (the second and the third year). Starting from the fourth year it is assumed that risk parameters (PD and LGD) converge to their long-term average levels (estimated over the cycle).
Luminor Bank AS Interim report for the period ended 31 March 2020
The adverse impact of COVID-19 is reflected in asset quality of Luminor.
The most severe consequences will most probably be seen in industries like accommodation, tourism, and aviation. Even though Luminor’s portfolio towards these economic sectors is relatively small, negative trends in the portfolio are still observed since many other industries are quite severely affected as well. As a result, requests for modifications (including grace period) reached 0.9 billion EUR at the end of March 2020 and exceeded 1.1 billion EUR (11% of the total credit portfolio) by the middle of April 2020.
Considering the situation, and the generous terms for modifications, the number of modifications has been limited so far.
Approximately 70% of modification requests came from business customers. Earlier applications for modification from business customers compared to individual customers can be explained by the following reasons:
Luminor Bank AS Interim report for the period ended 31 March 2020
35
• business customers have been affected first; moreover, professional financial management leads business customers to
immediately approach the bank, if foreseeing the need for modifications;
• individual customers often have unemployment benefits.
The largest part of modification requests from business customers are for industries like real estate activities, transportation and storage, wholesale and retail trade, manufacturing.
The most common modification type is grace period on principal payments. Luminor is restrictive (applying only exceptionally) towards granting full grace period (including grace on interest payments).
The volume of overdue loans is fluctuating and not yet showing negative trends, however, depending on the development of the pandemic and measures taken by governments, this might accelerate in the second quarter of 2020.
Total exposure and respective allowances distribution by Stages is provided further below in this note.
Maximum exposure to credit risk before collateral held or other credit enhancements
The Group’s maximum exposure to credit risk is reflected in the carrying amounts of financial assets in the consolidated statement of financial position. For financial and performance guarantees issued, commitments to extend credit, undrawn credit lines and export/import letters of credit, the maximum exposure to credit risk is the amount of the commitment.
thousand EUR Notes 31 March 2020 31 December 2019
Credit risk exposures relating to on–balance sheet assets subject to impairment are as follows :
12 792 886 13 288 211
Cash and balances with central banks 8 2 755 941 2 924 019
Due from banks and other credit institutions 9 109 048 141 645
Loans to customers 9 927 897 10 222 547
Financial Institutions 11 13 894 29 255
Public Sector 11 156 307 174 715
Business customers 11 4 228 346 4 412 164
Loans 2 992 346 3 060 821
Leasing 1 020 571 1 074 523
Factoring 215 429 276 820
Individual customers 11 5 529 350 5 606 413
Mortgage loans 4 598 849 4 633 239
Leasing 501 298 528 583
Consumer and card loans 130 915 131 410
Other loans 298 288 313 181
Credit risk exposures relating to off–balance sheet items subject to impairment are as follows:
1 883 548 1 788 816
Financial guarantees 16 1 773 322 110 655
Loan commitments and other credit related liabilities 16 110 226 1 678 161
Total credit risk exposure – financial instruments subject to impairment 14 676 434 15 077 027
Luminor Bank AS Interim report for the period ended 31 March 2020
36
thousand EUR Notes 31 March 2020 31 December 2019
Credit risk exposures relating to on–balance sheet assets not subject to impairment are as follows:
Financial assets held for trading: 17 1 827 3 021
Debt securities 1 827 3 021
Financial assets at fair value through profit or loss: 17 256 683 223 863
Debt securities 256 683 223 863
Derivative financial instruments 17 52 117 59 217
Financial assets at fair value through other comprehensive income: 0 0
Debt Securities 0 0
Total credit risk exposures not subject to impairment 310 627 286 101
Total credit risk exposure 14 987 061 15 363 128
The table above represents credit risk exposure as at 31 March 2020 and 31 December 2019, without taking into account any credit risk mitigation techniques. On-balance sheet assets are reported above based on the net carrying amount as they appear in the statement of financial position.
Gross amount and credit loss allowance amount for loans and leases as at 31 March 2020 and 31 December 2019 are disclosed in the tables below:
31 March 2020
thousand EUR Note Gross
Allowance for
impairment Net
Due from banks and other credit institutions 9 109 050 -2 109 048
The credit quality of loans to customers as at 31 March 2020 and 31 December 2019 is disclosed in the tables below according to the internal risk scale for performing customers: probability of default for low risk rating grades (1 to 4) is in the range from 0.00 % to 0.75 %, for moderate risk rating grades (5 to 7) it is from 0.75% to 3.00%, for high risk rating grades (from 8 to 10) it is from 3.00% to 40.00%.
The portfolio distribution as at 31 March 2020 shows an increase in Stage 2 (mostly due to inclusion of customers in Watch-list) and slight increase in Stage 3 (inflow of new non-performing exposures slightly outweighs the outflow) compared to the end of year 2019.
The main drivers for allowances for impairment in the first quarter of 2020 were consequences from COVID-19 (~70% of all impairment) and oil price shock (~20%). Approximately 60% of total impairments during the first quarter of 2020 were made for individually assessed Stage 3 exposures, of which 30% are related to the largest non-performing customer and oil price shock, 60% are for new non-performing customers and 10% are due to reviewed assumptions for existing non-performing customers.
The remainder of the change in allowances for impairment is explained by the change of macroeconomic scenarios for Stage 1 and Stage 2 impairment, Stage 2 portfolio increase and due to higher observed default frequencies compared to modelled PDs.
Luminor Bank AS Interim report for the period ended 31 March 2020
The following tables discloses the changes in the credit loss allowance and gross carrying amount for loans to customers between the beginning and the end of the reporting period. For the purposes of the movement schedules below, the Group assess Stages only at the reporting date and transfers between the Stages reflect this. Movements between stages are measured at the beginning of the reporting period.
For additional information see Note 11.
31 March 2020
Loans to customers total
Credit loss allowance Gross carrying amount
thousand EUR Stage 1 Stage 2 Stage 3 POCI TOTAL Stage 1 Stage 2 Stage 3 POCI TOTAL
As at 31 December 2019 -16 472 -25 896 -138 918 -4 389 -185 675 9 131 062 846 105 364 943 66 112 10 408 222
Movements with impact on credit loss allowances for the period
Transfers:
-to lifetime (from Stage 1 and stage 3 to Stage 2)
Balances due from banks and other credit institutions mainly comprise nostro and custody cash account balances with Luminor correspondent banks.
All banks are risk classified and risk limits are established. In case the external rating for a bank is not available a conservative expert judgment serves as basis for the Group internal rating, which reflects the bank’s credit strength, derived from macroeconomic factors and bank’s own solvency and liquidity factors, together with qualitative non-financial adjustments. The internal risk grade and probability of default (PD) of banks is based on the available risk classifications from rating agencies Moody’s, Standard & Poor’s and Fitch.
In Luminor a separate dedicated Financial Institutions unit acts as a single core competence center and ensures holistic overview of the Group’s credit limits/exposure on banks and countries. Since March 2020, the Financial Institutions unit has switched from quarterly to daily portfolio monitoring. A Financial Institutions Credit Commitee is organised on a regular basis to follow-up the latest market developments and review if any changes/restrictions are needed for established credit limits towards banks and countries.
The Group’s portfolio consists of reputable investment grade correspondent banks that have not experienced credit rating downgrades during the first quarter of 2020 and from COVID-19, except one counterpart bank that has been downgraded by one notch, but is still on BBB level.
Debt securities
Debt securities exposure of the Group at the end of the first quarter of 2020 was 258.5 million EUR compared to 223.8 million EUR at the end of 2019. The credit risk arising from these securities is evaluated with a separate metric, but overall exposure is limited, as most of these debt securities are issued by the governments of Lithuania and Latvia. The remaining part consists of international bonds guaranteed by France, Belgium and Luxembourg governments, Austria sovereign bonds, which are all treated as level 1 assets in the LCR (Liquidity Coverage Ratio) calculation, and a minor position of Lithuanian corporate bonds. The average weighted duration of the total portfolio is 3 years compared to 3.1 at the end of 2019. Debt securities investments are performed in accordance with the limits set by Luminor’s Management Board and the Supervisory Council. Limit utilization is monitored on daily basis.
Luminor Bank AS Interim report for the period ended 31 March 2020
58
MARKET RISK
The Group has a low risk appetite for market risk, which is defined as the risk of losses in on- and off-balance sheet positions arising from adverse movements in market parameters such as interest rates (interest rate risk), credit spreads (credit spread risk), currency exchange rates (foreign exchange or FX risk), equity prices (equity price risk) or commodity prices (commodity price risk). The most significant parts of the market risk for the Group are interest rate risk, credit spread risk and foreign exchange risk, while the significance of other risks is lower.
Interest rate risk is assessed using the basis-point-value (BPV) method, which measures the impact on the value of net cash flows from a one basis point (0.01%) parallel shift in market interest rates. The BPV calculations are performed on a regular basis and submitted to the Group’s Management.
Credit spread risk is evaluated analysing the bank’s consolidated bond portfolio, including liquidity bond portfolio managed by Treasury and Asset and Liability Management Department, trading bond portfolio managed by Markets Department’s Fixed Income desk and debt securities owned by separate entities within the Group if any. Changes in the credit spreads for debt instruments are estimated evaluating bond credit rating, asset liquidity, interest rates, default history if any.
Currency risk (foreign exchange or FX risk) is evaluated calculating open foreign exchange positions on Group level.
All the above risks are limited by the Risk Appetite Framework and/or lower level limits monitored on a regular basis. Additionally, derivative transactions from operations of Markets Department can only be performed on back-to-back basis. Therefore, the Group’s overall exposure towards market risk remains low.
With regard to the spread of the novel corona virus COVID-19, the major negative impact to the Group in terms of market risk could arise from credit spread risk. This risk is mitigated by limits as well as certain quality requirements for the bond portfolios. The potential impact of the credit spread risk is disclosed in the corresponding section below considering stress assumptions.
Market risk measurement approaches
Luminor is mainly focused on the management of interest rate risk, credit spread risk and foreign exchange risk, which are, as outlined above, the most significant risks.
Interest rate risk is assessed as the impact of a yield curve parallel shift on the present value of the gap between total assets and total liabilities. In general, assets have longer maturities than liabilities, which creates risks due to open interest rate positions. Therefore, interbank funding is attracted to decrease the discrepancy between long and short terms. In addition to this, interest rate swaps are used to achieve and maintain an acceptable level of interest rate risk on total level, on currency level and within individual time bands.
Credit spread risk for the Group arises from debt securities in the liquidity bond portfolio (sovereign and covered bonds) and exposures in the trading debt portfolio mostly consisting of sovereign and corporate debt. The Group measures the stressed spread impact to its liquidity bond portfolio only due to materiality, assuming a 100 basis points spread widening towards risk-free alternative investments of matching maturity profile for A-rated bonds and a 50 basis points spread widening for corresponding AA-rated bonds.
FX risk is assessed as an open position between assets and liabilities for a respective currency. Open positions for all currencies in the Group are restricted by the limits set by the Luminor’s Management Board and the Supervisory Council, and monitored on a daily basis.
INTEREST RATE RISK
The main source of interest rate risk in the Group is the repricing risk – risk related to the timing mismatch in the maturity and repricing of assets and liabilities of on- and off-balance sheet positions. Pursuant to Luminor’s Market Risk Policy, interest rate risk is limited in terms of basis point value (BPV), i.e. the change in net cash flows (gaps) given a one basis point (0.01%) parallel shift in the market interest rates. Separate limits for banking and trading activities are approved by the Management Board and the Supervisory Council of Luminor Bank AS, as well as limits for different currencies: EUR, USD, NOK and sum of all other currencies. When calculating the total exposure the sums of BPV in each currency are aggregated irrespective if the total exposure in each individual currency is a short or long position, i.e. netting of positions between currencies is not allowed. The main part of the interest rate risk arises from the positions that are denominated in EUR. Using derivatives as hedges is a major part of interest risk management, please also refer to Note 10.
The risk from changes in interest rates increases for longer duration time buckets due to higher uncertainty of future rates. To limit risk exposure resulting from different time buckets, so-called gapping limits are determined for each of them. Limit established for each time bucket is defined as a percentage of the total BPV limit allocated to the relevant currency. All time buckets till one year period are
Luminor Bank AS Interim report for the period ended 31 March 2020
59
limited to 100% of total BPV, 1-2 years gap is limited to 120% of total BPV, and all time buckets above 2 years are limited to 150% of total BPV.
The Group’s BPV exposure by currencies for both trading and banking activities (thousand EUR):
Currency 31 March 2020 31 December 2019
EUR -25 299 -41 291
USD 3 587 4 965
NOK 331 727
Other currencies -340 -65
Sensitivity to interest rate risk
Interest rate risk exposure cannot exceed BPV limits approved by the Luminor’s Management Board and the Supervisory Council. Assuming a 200 basis points parallel shift of the yield curve, sensitivity of interest rate risk shall be calculated multiplying total BPV exposure by interest rate change. The above mentioned shift of the yield curve creates the following impact on the Group’s equity and profit/loss (thousand EUR):
31 March 2020 31 December 2019
Equity 3 191 9 410
Profit/Loss 16 636 14 029
CREDIT SPREAD RISK
The Bank follows a rigorous framework for debt securities management. Bond portfolios managed by Treasury and Asset and Liability Management and Markets Departments are restricted in size, level of quality, region available and counterparty, limiting credit risk exposure. However, the bank measures the stressed spread impact to its liquidity bond portfolio as part of the Risk Appetite Framework. Assuming a 100 basis points spread widening towards risk-free alternative investments of matching maturity profile for A-rated bonds and a 50 basis points spread widening for corresponding AA-rated bonds, the projected decrease in market value of the bonds would be the following:
31 March 2020 31 December 2019
Market value loss projection due to increase in credit spreads 6.5 6.4
FOREIGN EXCHANGE (FX) RISK
The Group’s main exposure is towards euro currency (EUR), while positions of other currencies are not significant. A conservative approach to FX risk is followed within the Group. It is measured as the nominal value of the open FX positions converted to EUR using the ECB rates. The Group has both intraday and overnight limits. Some technical deviations from the limits are allowed only for a short term when servicing customers. The Group has approved separate limits for the United States Dollar (USD), sum of other currencies, max of other currencies and total currencies.
Luminor Bank AS Interim report for the period ended 31 March 2020
60
The Group’s exposure to FX risk (thousand EUR):
Currency 31 March 2020 31 December 2019
USD 77 97
Max of other currencies* 97 302
Sum of other currencies** 318 609
Total*** 307 383
*Max of other currencies – this represents the maximum absolute exposure of all foreign currencies other than USD. **Sum of other currencies – this represents the sum of all foreign currency exposures in absolute terms excluding USD. ***Total – this represents the higher absolute value between sum of positive exposures and sum of negative exposures of all foreign currency open positions.
Sensitivity of foreign exchange risk
The bank applies value-at-risk (VaR) model for simulation of volatility parameters which are then applied to the actual open foreign exchange positions to evaluate loss projection. VaR model is set considering the 99 percent confidence level, assuming 10-day holding period and calibrated from at least 5-year long time series, including periods of market turbulence. Risk parameters for currencies other than USD are increased by 50%.
FX stress test under the above mentioned conditions indicates a possible loss of EUR 30 thousands as of the first quarter of 2020.
EQUITY AND COMMODITY RISK
The Group does not have any open position in commodity instruments, thus is not exposed to commodity price risk.
The Group does not have any open positions in equity instruments held for trading. However, the Group owns some shares on its balance sheet which are recognized as participation in the settlement systems rather than any kind of investment in shares. The total value of these shares has increased over the year 2019 due to a positive trend of underlying instruments, thus, in accordance to external audit recommendations, equity instruments have been reclassified as debt securities at fair value through profit/loss. In terms of stress test, a value-at-risk (VaR) model has been used with a 99% confidence level and 1 year holding period, whereas the horizon of data analyzed includes the latest financial crisis in 2008-2009 and consists of at least 5 years of historical developments of share prices. The resulting shock applied to the total value of shares produced an outcome of possible loss equal to 2.1 million EUR as at the end of the first quarter of 2020.
LIQUIDITY RISK
Liquidity risk is defined as the risk that the Group is unable to meet its financial obligations in time, the risk of incurring losses due to the sudden decrease in financial resources (e.g. a financial crisis situation may result in a delay of incoming payments) or an increase of the price of new resources for refinancing. The consequence of liquidity risk may be failure to meet obligations to repay depositors and fulfil loan commitments. The Group uses a range of liquidity metrics for measuring, monitoring and controlling liquidity risk including the Liquidity Coverage Ratio (LCR), the Net Stable Funding Ratio (NSFR) and internal liquidity limits.
Liquidity risk is managed to ensure a constant ability to settle contractual obligations. The Group has developed a set of early warning indicators for a timely identification of liquidity crises, and business and funding contingency funding plans to manage the Group’s liquidity during market disruptions. The liquidity risk management strategy is reviewed at least annually or after any significant change in the internal or external environment the Group operates in.
Luminor Bank AS Interim report for the period ended 31 March 2020
61
Liquidity risk is managed across the three Lines of Defence:
• The First Line of Defence comprises the Group’s Treasury and Asset and Liability Management (TALM) and the business areas. TALM is responsible for the daily liquidity management and funds transfer pricing (FTP). To ensure the funding in situations where Luminor is in urgent need of cash and the normal funding sources do not suffice, Luminor holds a liquidity buffer that consists of central bank cash and high quality securities that can be readily sold or used as collateral in funding operations;
• Market and Liquidity Risk Department is the Second Line of Defence and is responsible for providing independent oversight and control of liquidity risk and the First Line of Defence;
• The Internal Audit function is the Third Line of Defence, which is responsible for providing independent assurance over the First and Second Lines of Defence activities.
Liquidity risk management is divided into long-term (1 year), short-term (1 week to 3 months) risk management and intraday liquidity management. The aim of short-term liquidity management is to meet the daily need for funds to ensure compliance with the reserve and liquidity requirements set by the ECB, as well as compliance with internal liquidity limits. Short-term liquidity is maintained through the daily monitoring of the liquidity status and day-to-day funding and trading the appropriate financial instruments for liquidity purposes. Long-term liquidity risk management is supported by analysing the estimated future cash flows taking into account deposit and loan portfolio growth, as well as possible refinancing sources.
For the purpose of the liquidity risk assessment, the liquidity gap is analysed considering the maturity of cash flows. The liquidity risk is restricted by imposing internal limits on the liquidity gap. Utilisation of this limit is subject to regular monitoring and reporting to management bodies in the Group.
The liquidity gap is calculated by analysing the Group’s net refinancing situation within one week, one month and three months applying a "business as usual" approach. Liquid assets and short-term liabilities are included in liquidity gap calculation for respective terms (1 week to 3 months).
The Liquidity Coverage Ratio is calculated as the ratio of a credit institution’s liquidity buffer to its net liquidity outflows over a 30-calendar-day stress period and is expressed as a percentage. The minimum regulatory limit of LCR is set at 100%, however the Group has a substantial buffer and maintains a higher ratio. The LCR is intended to promote the short-term resilience of the Group’s liquidity risk profile and requires the holding of risk-free assets that may be easily liquidated to meet required payments for outflows net of inflows during a thirty-day crisis period without support from the central bank.
Luminor Bank AS Interim report for the period ended 31 March 2020
62
The liquidity risk analysis of the Group main balance sheet items per remaining maturity is as follows:
Carrying amount
31 March 2020
thousand EUR
On demand and
less than 1
month
1-3
months
3-12
months 1-5 years Over 5 years TOTAL
Cash and deposits with central banks 2 755 941 0 0 0 0 2 755 941
Due from other credit institutions 109 039 0 0 9 0 109 048
Financial assets held for trading 0 0 698 358 771 1 827
The main funding source for Luminor are customer deposits. Since the creation of Luminor, the Bank has been funded by former parent banks in the form of a syndicated loan. Taking into account Luminor’s plan to become an independent self-financed financial institution, parent funding will be gradually substituted by other sources of funding – from clients’ deposits to the funding received through capital markets.
Funding tranches maturing in 2020 will be paid back or prolonged according to the terms of the Facility Agreement and Luminor’s funding needs. Terms and conditions of the Facility Agreement – under which funding from former parents is provided – were modified due to the changes of ownership in 2019. Due to the changes the commitment is partly or fully collateralized.
The Net Stable Funding Ratio (NSFR) is defined as the amount of available stable funding relative to the amount of required stable funding over a one-year time horizon. The minimum requirement for NSFR is 100%, however the Group has a substantial buffer and maintains a higher ratio.
The Group has set the limits in place for various measures, including LCR, NSFR, liquidity gaps, and manages those within the set limits by ensuring the proper maturity structure of its assets and liabilities, for example, via issuing long dated debt.
Luminor Bank AS Interim report for the period ended 31 March 2020
65
Off-balance sheet items
The analysis of nominal off-balance sheet items by remaining maturity is as follows:
31 March 2020
thousand EUR
On demand and
less than 1 month
1-3
months
3-12
months 1-5 years
Over 5
years TOTAL
Loan commitments 1 225 039 0 0 0 0 1 225 039
Financial guarantees 110 226 0 0 0 0 110 226
Performance guarantees 150 037 0 0 0 0 150 037
Other commitments* 398 246 0 0 0 0 398 246
Total 1 883 548 0 0 0 0 1 883 548
* Other commitments given include different type of guarantees (warranty, payment and advance payment quarantees, etc)
31 December
2019
thousand EUR
On demand and
less than 1
month
1-3 months 3-12 months 1-5 years Over 5 years TOTAL
Loan
commitments 1 134 434 0 0 0 0 1 134 434
Financial
guarantees 110 655 0 0 0 0 110 655
Performance
guarantees 74 647 0 0 0 0 74 647
Other
commitments* 469 080 0 0 0 0 469 080
Total 1 788 816 0 0 0 0 1 788 816
* Other commitments given include different type of guarantees ( warranty, payment and advance payment quarantees, etc)
Liquidity buffer and collateral management
Luminor has a contractual agreement for funding in place with shareholders DNB Bank ASA and Nordea Bank Abp. This strongly mitigates the likelihood of funding liquidity risk which may be caused by deposit run off, wholesale funding risk (roll over and new issuance), unexpected outflows from off-balance sheet obligations and legal risks (e.g. not being able to issue funding due to legal restrictions). As the Group is moving towards more reliance on self-funding rather than on support from shareholders, other funding sources are being established or are already in place for diversifying the funding base.
The Group is taking part in the ECB’s Eurosystem open market operations. In particular, the Group is a user of the ECB Targeted Long Term Refinancing Operations (TLTRO). In addition, a significant part of funding is attracted through retail and corporate deposits. Moreover, the Group has already issued 650 million EUR of its own senior debt securities and 500 million EUR of covered bonds, and is considering to increase this amount in the future even more, which would further diversify the funding opportunities.
The main part of the liquidity buffer is held with the Central Bank Accounts where the Group held 2.6 billion EUR at the end of March 2020. This buffer can be utilized at any time when the need arises.
Survival horizon
The survival horizon indicator within the Risk Appetite Framework captures the liquidity buffer available outright to be used in liquidity stress situations within 12 months. It can also be described as the availability of liquidity which obviates the need to take any extraordinary measures.
Three different scenarios are considered while measuring survival horizon: bank-specific, market-wide and the combination of the most severe assumptions from the previous two. Stress testing assumptions include but are not limited to severe deposit withdrawals, including early termination of term deposits and run-off of top 5 depositors, deterioration of financial assets, decrease of loan
Luminor Bank AS Interim report for the period ended 31 March 2020
66
repayment levels, increase of utilization of credit commitments, availability of credit lines from shareholders based on facility agreements.
The liquidity buffer for the survival horizon indicator is strongly affected by the assumption of outgoing deposits in the first few days and weeks of the turbulence period, with the smaller continuous run-off occurring in the following months. Due to rather high concentration of top depositors, the Group tests resistance towards a run-off of the 5 largest depositors as well. However, Luminor has substantial unused credit line from shareholders which can be utilized any time based on the mutual facilities agreement. Furthermore, the majority of liquid assets are held with central banks in the form of cash. The previous mentioned agreement and considerable volume of highly liquid assets substantially softens the consequences of deteriorating liquidity in case of high outflows.
Therefore, even during the COVID-19 pandemic, the Group’s liquidity situation is sufficiently strong to survive severe external shocks.
Luminor Bank AS Interim report for the period ended 31 March 2020
67
Economic sectors
The following tables break down Loans to customers at their carrying amounts as categorised by the economic sectors of our counterparties.
Cash and loans to central bank, credit institutions, and customers
Group
thousand EUR 31 March 2020 31 December 2019
Cash on Hand 135 955 140 518
Central Banks 2 619 986 2 783 501
Credit Institutions 109 048 141 645
Financial Institutions 13 894 29 255
Public Sector 156 307 174 715
Individual Customer 5 529 350 5 606 413
Business Customers 4 228 346 4 412 164
Agriculture, forestry and fishing 318 874 337 080
Mining and quarrying 15 818 23 658
Manufacturing 527 550 571 675
Electricity, gas, steam and air conditioning supply 123 435 132 176
Water supply 29 962 31 948
Construction 191 166 197 785
Wholesale and retail trade 834 168 937 197
Transport and storage 405 822 394 660
Accommodation and food service activities 44 307 48 768
Information and communication 23 639 26 558
Real estate activities 1 114 141 1 132 767
Professional, scientific and technical activities 229 120 210 089
Administrative and support service activities 211 697 209 227
Public administration and defence, compulsory social security 4 780 5 358
Education 6 526 7 106
Human health services and social work activities 21 793 21 432
Arts, entertainment and recreation 12 544 13 607
Other services 113 004 111 073
TOTAL 12 792 886 13 288 211
OPERATIONAL RISK
Operational risk in Luminor is defined as the risk of loss resulting from inadequate or failed internal processes, people and systems or from external events. This definition includes legal risk, but excludes strategic and reputational risk. Operational risk management in Luminor is governed by the Operational Risk Policy. Key principles are that operational risk should be low/medium and Luminor’s operational risk management framework should ensure that the risk of unexpected losses is reduced. Each manager and process owner is responsible for the management of risks inherent to the activities and processes of their area of responsibility and for fostering a
Luminor Bank AS Interim report for the period ended 31 March 2020
68
sound risk management culture. The Operational Risk Management Department is an independent internal control function within the second line of defence and covers operational risk management, information security and personal data protection.
Operational risk management in the first quarter of 2020 was affected by the spread of COVID-19. At the end of February 2020 central crisis management was initiated to assure business continuity and resilience and to protect Luminor employees. As main mitigation actions, remote working, social distancing and basic hygiene methods were used for employee protection. To ensure business continuity, business continuity plans were reviewed and updated, particular for critical services. Also critical vendor continuity readiness was reviewed and assessed. Throughout the crisis so far, all of Luminor’s business processes and client services are operational without negative impact for Luminor customers.
Luminor management is kept updated on the status of operational risk through periodic and ad hoc risk reporting.
CAPITAL MANAGEMENT
Luminor’s regulatory capital consists fully of Tier 1/Common Equity Tier 1 (CET1) capital. Tier1/CET1 capital consists of ordinary shares, share premium, mandatory reserve, retained earnings of the previous financial year, the audited profit of the current financial year and less the intangible assets, deferred tax assets, revaluation profit of investment properties, current year losses, if any, and other deductions.
The capital is calculated and allocated for risk coverage following the regulations in the CRD IV and CRR of the European Union and the local legal acts. The Group’s objectives in capital management are as follows:
• consistency with Luminor Group’s long-term strategy (including meeting the risk appetite of the Group) and the Dividend policy;
• the ability to pursue the business objectives;
• fulfilment of both internal and external capitalisation targets (capital adequacy);
• sufficient and proper composition of capital that would withstand stressful events.
The capital adequacy assessment is performed on a quarterly basis in accordance with the information guidelines for the risk management and capital adequacy disclosure (Pillar 3) report.
Luminor Bank AS Interim report for the period ended 31 March 2020
69
Quantitative information regarding the capital managed by the Group is presented below:
According to the prudential requirements, the Pillar 2 requirement set by the ECB in the 2019 Joint Decision on Capital and the Systemic risk and Countercyclical risk buffer requirements set by the Latvian, Estonian and Lithuanian regulators, Luminor Group is required to hold capital exceeding 10.8% CET1 and 15.2% Total capital. Total capital and CET1 capital requirements consist of the following components:
Total capital CET1
Minimum Pillar 1 requirement 8.0 % 4.5 %
Pillar 2 requirement 2.0 % 1.1 %
O-SII (other systemically important
institution) buffer
2.0 % 2.0 %
Capital conservation buffer 2.5 % 2.5 %
Systemic risk buffer* 0.2 % 0.2 %
Countercyclical buffer 0.5 % 0.5 %
Total regulatory requirement 15.2 % 10.8 %
* Estonian regulator has set a 1.0 % Systemic risk buffer requirement that applies to Luminor’s exposures in Estonia and transl ates to 0.2% from Luminor’s total risk weighted exposure amount. As response to the COVID-19 situation, the systemic risk buffer will be 0% starting from 1 May 2020. Lithuanian regulator has set a 1.0% Countercyclical buffer requirement that applies to Luminor’s exposures in Lithuania and f orms 0.5% of Luminor’s total risk weighted exposure amounts. As reponse to the COVID-19 situation, the countercyclical buffer was set to 0% starting from 1 April 2020.
According to the Regulatory Requirements for Calculating the Minimum Capital Requirements, the Group shall provide own funds, which must at all times exceed or equal the sum of the capital requirements for:
• credit risk;
• market risk;
• operational risk.
thousand EUR 31 March 2020 31 December 2019
OWN FUNDS
1. TIER 1 CAPITAL 1 598 032 1 566 637
1.1. COMMON EQUITY TIER 1 CAPITAL 1 598 032 1 566 637
1.1.1. Capital instruments eligible as CET1 Capital 1 447 155 1 447 155
Paid-up capital instruments 34 912 34 912
Share premium 1 412 243 1 412 243
1.1.2. Retained earnings 161 692 129 919
1.1.3. (-) Other intangible assets -7 579 -7 848
1.1.4 Other reserves 938 938
1.1.5 Adjustments to CET1 due to prudential filters -1 925 -1 281
1.1.6 CET1 capital elements or deductions - other 0 0
1.1.7 Accumulated other comprehensive income 265 261
1.1.8 (-) Additional deductions of CET1 Capital due to Article 3 CRR 0 0
1.1.9 (-) Deferred tax assets that rely on future profitability and do not arise from temporary
differences net of associated tax liabilities
-2 162 -2 155
1.1.10 (-) Goodwill -351 -351
Luminor Bank AS Interim report for the period ended 31 March 2020
70
In compliance with these regulations, the Group calculates the credit risk and market risk minimum capital requirements by using the Standardised approach. The Group does not apply any VaR or other internal models for the calculation of the market risk capital requirement and applies the Basic Indicators Approach for calculating the operational risk capital requirements.
The risk-weighted assets are measured by means of risk weights classified according to the nature of each asset and counterparty, taking into account the collaterals and guarantees eligible for risk mitigation. A similar treatment with some adjustments is adopted for the off-balance sheet exposures.
The Group reviews and improves the risk identification and management policies and procedures according to changes in the Group’s activities and financial situation at least once a year. Amendments and updates are mostly done during the annual internal capital adequacy assessment process when significant risks are to be reassessed or identified and assessed.
The Group complied with all externally imposed capital requirements during the reporting period.
GOING CONCERN
The Luminor’s management is fully convinced of a stable and balanced performance going forward and, based on that, prepared these financial statements on a going concern basis.
4. NET INTEREST INCOME
thousand EUR Q1 2020 Q1 2019
Interest income calculated using the effective interest method:
Loans and advances to customers at amortised cost 56 826 59 112
Deposits with other banks 1 386 593
Total interest income calculated using effective interest method 58 212 59 705
Other similar income:
Finance Leases 12 281 14 673
Other interest 131 172
Total other similar income 12 412 14 845
Total interest income 70 624 74 550
Interest expense:
Loans and deposits from credit institutions -4 857 -4 110
Deposits from customers -3 507 -3 356
Impact of hedging activities 199 50
Debt securities issiued -2 551 -1 295
Other* -5 828 -2 025
Total interest expense -16 544 -10 736
Net interest income 54 080 63 814
* Mainly includes interest expenses to the Supervisory Authorities and interest on unused credit limits
Luminor Bank AS Interim report for the period ended 31 March 2020
71
5. NET FEE AND COMMISSION INCOME
thousand EUR Q1 2020 Q1 2019
Securities 213 172
Clearing and settlement* 8 099 8 160
Asset Managment 1 683 1 660
Custody 258 229
Payment services* 5 059 6 539
Collective Investments commission 708 772
Insurance commission 695 927
Loan commitments given 756 854
Financial guarantees given 1 446 1 231
Factoring 673 1 008
Other* 4 695 3 707
Total fee and commission income 24 285 25 259
Clearing and settlement* -5 150 -5 214
Custody -63 -81
Financial guarantees received -22 -9
Other* -1 280 -1 241
Fee and commission expense -6 515 -6 545
Net fee and commission income 17 770 18 714
* Fee and commission are recognised at a point in time when the Group satisfies its performance obligation, usually upon execution of the underlying transaction. The amount of fee or commission received or receivable represents the transaction price for the services identified as distinct performance obligations. Such income includes fees for arranging a sale or purchase of foreign currencies on behalf of a cust omer, fees for processing payment transactions, fees for cash settlements, collection or cash disbursements, as well as, commissions. Other fee mainly includes penalty, termination, amendment fees and other service fees
The breakdown of net fee and commission income division by segments is the following:
thousand EUR Q1 2020 Q1 2019
Corporate 6 574 6 945
Retail 10 508 10 648
Wealth Managment 504 532
Other 184 589
Net fee and commission income 17 770 18 714
Luminor Bank AS Interim report for the period ended 31 March 2020
Social security tax payments include a contribution to state pension funds. The Group has no legal or constructive obligation to make pension or similar payments beyond the social security tax.
7. OTHER ADMINISTRATIVE EXPENSES
thousand EUR Q1 2020 Q1 2019
IT related expenses -30 300 -15 245
Consulting and professional services -5 452 -5 996
Advertising and marketing expenses -716 -632
Real estate expenses -1 837 -2 629
Taxes and membership fees -239 -223
Travel Expenses -246 -377
Other expenses* -3 116 -3 300
Total -41 906 -28 402
*Other expenses include mostly costs related to collection services, information services, postal, transport and other services.
8. CASH AND BALANCES WITH CENTRAL BANKS
thousand EUR 31 March 2020 31 December 2019
Cash on hand 135 955 140 518
Cash balances at central banks 2 619 986 2 783 501
Total 2 755 941 2 924 019
of which mandatory reserve requirement 109 126 112 800
Total cash and balances with central banks 2 755 941 2 924 019
9. DUE FROM OTHER CREDIT INSTITUTIONS
thousand EUR 31 March 2020 31 December 2019
Demand deposit 109 015 141 596
Loans 35 58
Total 109 050 141 654
Allowance -2 -9
Total 109 048 141 645
Luminor Bank AS Interim report for the period ended 31 March 2020
73
10. DERIVATIVE FINANCIAL INSTRUMENTS
The Bank enters into derivative transactions with household customers. These mainly include interest rate swaps, collars and CAPs.
As at 31 March 2020 the Group had total three interest rate swap agreements in place, two of them with a notional amounts of 200 million EUR and 150 million EUR, whereby the Group receives a fixed rate of interest of 1.50% and pays floating interest at 6 months EURIBOR + 1.478% and 3 months EURIBOR + 1.526% and interest rate swap agreement with notional amount of 300 million EUR, whereby the Group receives a fixed rate of interest of 1.375% and pays floating interest at 3 months EURIBOR + 1.732% on the notional amount respectively.
One additional interest rate swap agreement with notional amount of 500 million EUR, whereby the Group receives a fixed rate of interest of 0.01% and pays floating interest at 6 months EURIBOR + 0.289% on the notional amount was concluded in March 2020 and was linked to the issuance of the Covered Bond. The swaps are being used to hedge the exposure to changes in the fair value of its fixed rate senior unsecured bonds. Trade date for 200 million EUR and 150 million EUR interest swap agreements is 10 October 2018, effective date is 18 October 2018 and maturity date is 18 October 2021. For 300 million EUR interest swap agreement trade date is 11 June 2019, effective date is 21 June 2019 and maturity date 21 October 2022. For 500 million EUR interest swap agreement trade date is 04 March 2020, effective date is 11 March 2020 and maturity date 11 March 2025.
There is an economic relationship between the hedged item and the hedging instruments as the terms of the interest rate swaps match the terms of the fixed rate loan (i.e. notional amount, maturity, payment and reset dates). The Group has established a hedge ratio of 1:1 for the hedging relationships, as the underlying risk of the interest rate swaps is identical to the hedged risk component. To test hedge effectiveness, the Group uses the hypothetical derivative method and compares the changes in the fair value of the hedging instrument against the changes in the fair value of the hedged item attributable to the hedged risk.
Hedge ineffectiveness can theoretically arise from:
• A different interest rate curve applied to discount the hedged item and hedging instrument;
• Differences in the timing of cash flows of the hedged item and hedging instrument, also a different day count;
• The counterparties’ credit risk differently impacting the fair value movements of the hedging instrument and hedged item.
Luminor Bank AS Interim report for the period ended 31 March 2020
74
31 March 2020 Notional amount Carrying Amount Line item in the statement of financial position
Luminor Bank AS Interim report for the period ended 31 March 2020
77
13. DEPOSITS FROM CUSTOMERS
thousand EUR 31 March 2020 31 December 2019
Term deposits 1 901 748 2 161 033
Demand deposits 8 056 532 8 074 410
Total 9 958 280 10 235 443
Due to customers by type of customers
Due to corporate customers 4 271 210 4 578 084
Due to public sector customers 1 737 570 1 623 323
Due to individuals 3 949 500 4 034 036
Total 9 958 280 10 235 443
Due to customers, registered in Estonia, Latvia, Lithuania 9 739 996 9 825 534
Due to customers, registered in EU (except Estonia, Latvia, Lithuania)
142 352 326 379
Due to customers, registered in other countries 75 932 83 530
Total 9 958 280 10 235 443
14. DEBT SECURITIES ISSUED
LUMINO 1 1/2 18/10/21
In October 2018 Luminor Bank AS issued its inaugural bond under the Luminor Euro Medium Term Notes (EMTN) Programme. The company issued 350 000 000 EUR of fixed-rate bonds maturing October 2021, with annual coupons and bearing interest at an annual rate of 1.50%. There were no specific covenants related to the bond issuance.
LUMINO 1 3/8 21/10/22
In June 2019 Luminor Bank AS issued the bond under the Luminor EMTN Programme. The company issued 300 000 000 EUR of fixed-rate bonds maturing October 2022, with annual coupons and bearing interest at an annual rate of 1.375%. There were no specific covenants related to the bond issuance.
LUMINO 0.01 11/03/2025
In March 2020 Luminor Bank AS issued its inaugural covered bond under the Luminor EMTN and Covered Bond Programme. The company issued 500 000 000 EUR of fixed-rate bonds maturing in March 2025, with annual coupons and bearing interest at an annual rate of 0.01%.
Luminor Bank AS Interim report for the period ended 31 March 2020
78
thousand EUR 31 March 2020 31 December 2019
LUMINO 1 1/2 18/10/21
Nominal amount 350 000 350 000
Intragroup transactions -200 -1 000
Fees at amortized costs -1 085 -1 269
Accrued interest 2 384 1 079
Hedged item fair value changes 1 501 2 982
Carrying amount 352 600 351 792
LUMINO 1 3/8 21/10/22
Nominal amount 300 000 300 000
Fees at amortized costs -893 -982
Accrued interest 1 839 814
Hedged item fair value changes -752 92
Carrying amount 300 194 299 924
COVERED BONDS
Nominal amount 500 000 0
Fees at amortized costs 3 257 0
Accrued interest 3 0
Carrying amount 503 260 0
Total 1 156 054 651 716
Luminor Bank AS Interim report for the period ended 31 March 2020
79
15. OTHER FINANCIAL LIABILITIES
thousand EUR 31 March 2020 31 December 2019
Payments in transit 52 649 41 865
Other 370 3 438
Total 53 019 45 303
16. CONTINGENT ASSETS AND LIABILITIES AND COMMITMENTS
thousand EUR 31 March 2020 31 December 2019
Pledged assets
Loans* 2 348 879 1 999 895
Total 2 348 879 1 999 895
Contingent liabilities
Loan commitments given 1 225 039 1 134 434
Financial guarantees given 110 226 110 655
Performance guarantees 150 037 74 647
Other commitments given 398 246 469 080
Total 1 883 548 1 788 816
* Includes 528 500 thousand EUR of loans pledged for Covered Bond
17. FAIR VALUE OF FINANCIAL ASSETS AND LIABILITIES
The carrying amount of the major part of the Group’s assets and liabilities is a reasonable approximation of their fair value. Where the fair values of financial assets and liabilities recorded on the statement of financial position cannot be derived from active markets, they are determined in a way that unobservable inputs used to measure fair value would reflect the assumptions that market participants would use when pricing assets and liabilities, including assumptions about the risk. Where observable market data is not available, expert judgment is required to establish fair values. For the purposes of current financial statements, the above mentioned techniques related to unobservable inputs were not used as no such financial assets and liabilities exist on the statement of financial position of the Group.
Luminor Bank AS Interim report for the period ended 31 March 2020
80
FAIR VALUE OF FINANCIAL INSTRUMENTS AT AMORTISED COSTS
thousand EUR
Carrying amount Fair value Carrying amount Fair value
31 March 2020 31 March 2020 31 December 2019 31 December 2019
Assets
Financial assets at amortised cost
Cash and balances with central banks
2 755 941 2 755 941 2 924 019 2 924 019
Due from other credit institutions 109 048 109 048 141 645 141 645
The next table below summarises the fair value measurement hierarchy of the Bank’s financial assets and liabilities. Financial instruments are distributed by 3 levels of the fair value:
• Level 1 — quoted prices (unadjusted) in active markets for identical assets or liabilities that the entity can access at the measurement date. A quoted price in an active market provides the most reliable evidence of fair value and shall be used without adjustment to measure fair value whenever available;
• Level 2 — valuation techniques for which inputs other than quoted prices included within Level 1 are observable for the asset or liability, either directly or indirectly. If the asset or liability has a specified (contractual) term, a Level 2 input must be observable for a substantial part of the term of the asset or liability;
• Level 3 — valuation techniques for which inputs are unobservable for the asset or liability. Unobservable inputs shall be used to measure fair value to the extent that relevant observable inputs are not available, thereby allowing for situations in which there is little, if any, market activity for the asset or liability at the measurement date. However, the fair value measurement objective remains the same, i.e. an exit price at the measurement date from the perspective of a market participant that holds the asset or owes the liability. Therefore, unobservable inputs shall reflect the assumptions that market participants would use when pricing the asset or liability, including assumptions about the risk.
Luminor Bank AS Interim report for the period ended 31 March 2020
81
FAIR VALUE HIERARCHY FOR FINANCIAL INSTRUMENTS
Fair value measurement of financial instruments as at 31 March 2020 was as follows:
Fair value measurement using thousand EUR
Quoted prices in active markets
(Level 1)
Significant observable inputs
(Level 2)
Significant unobservable
inputs (Level 3) Total
Assets
Assets for which fair values are disclosed
Cash and balances with central banks 2 755 941 0 0 2 755 941
Due from other credit institutions 109 015 33 0 109 048
Loans to customers 0 0 10 027 176 10 027 176
Other financial assets 7 250 7 250
Financial assets at fair value
Financial assets held for trading
Debt securities 1 827 0 0 1 827
Financial assets at fair value through profit or loss
Luminor Bank AS Interim report for the period ended 31 March 2020
83
The following methods and assumptions were used to estimate the fair values:
Non-trading financial assets mandatorily at fair value through profit or loss (Pension Funds) - The value date method is used in the acquisition of pension fund units managed by Luminor Pensions Estonia AS and they are initially recognised at acquisition cost, which is the fair value paid for them. Pension fund units are revalued according to the effective net asset value on the balance sheet date.The following methods and assumptions were used to estimate the fair values:
• Cash and cash balances with central banks – the fair value equals to its carrying amount as the assets can be realized at the same price in an orderly transaction;
• Due from other credit institutions – the fair value equals to its carrying amount as the assets can be realized at the same price in an orderly transaction. Due from other credit institutions are demand deposits;
• Loans to customers – fair value has been estimated by discounting estimated future cash flows with the base curve used by the Bank (6m Euribor curve as average for all loans) as adjusted by credit riks factors. In 2018 Luminor had various different approaches to the fair value estimation (in the legacy organizations) and that Luminor has made an effort in 2019 to align the methodologies across the different geographies. The current approach is in accordance with Fair Value procedure. Same valuation technique is applied to all loan classes and accordingly all loan classes are classified under fair value level 3;
• Financial assets at fair value through profit or loss (debt securities) - for domestic debt instruments issued in the Baltic states, the quotes of local (Baltic) market makers shall be the priority source. Local market makers (usually banks) publish the trading offers in the form of prices, yields or equivalent figures. If there are more than one market maker locally, the average of bid prices shall be used taking the data from Bloomberg. If the debt instrument is issued outside the Baltic states, or there are no quotes available from local market makers on particular debt issue, or quotes of local market makers are clearly incorrect or artificial, the prices of particular debt securities shall be derived from liquid market data using sources like Bloomberg or similar;
• The fair value of interest-bearing financial instruments is estimated based on discounted cash flows using the interest rates for items with similar terms and risk characteristics. The fair value of a liability is measured using the assumptions that market participants would use when pricing the liability, assuming that market participants act in their economic best interest;
• Financial assets at fair value through other comprehensive income (equities, debt securities):
• The quotes of local (Baltic) market makers shall be the priority source for local equities. These are securities for which active market exists based on the turnover, meaning availability of quotes at which market participants transact in the local stock market. The quotes of foreign equities shall be taken from Bloomberg giving the priority to the primary market, and then to the country of issuer if the active market exists there. Otherwise, the market with the highest liquidity (turnover) shall be used as a source for pricing. If the quotes in primary data sources are clearly incorrect or artificial, the price of particular equity shall be derived from liquid market data using sources like Bloomberg or similar. Correctness of the quotes described above are the subject of expert judgment of the Market and Liquidity Risk Management Department member together with the Bank’s Markets Department’s dealer responsible for equity trading. For equities of non-listed companies for which active market does not exist, any available trusted public information on recent trades shall be used for the pricing of the equity. Alternatively, dividend discount model shall be used to determine the price of equity. Expert opinion based on other available related market data shall be used for pricing of equity if the previously described methods are not possible;
• For domestic debt instruments issued in the Baltic states, the quotes of local (Baltic) market makers shall be the priority source. Local market makers (usually banks) publish the trading offers in the form of prices, yields or equivalent figures. If there are more than one market maker locally, the average of bid prices shall be used taking the data from Bloomberg. If the debt instrument is issued outside the Baltic states, or there are no quotes available from local market makers on particular debt issue, or quotes of local market makers are clearly incorrect or artificial, the prices of particular debt securities shall be derived from liquid market data using sources like Bloomberg or similar;
• The fair value of interest-bearing financial instruments is estimated based on discounted cash flows using the interest rates for items with similar terms and risk characteristics. The fair value of a liability is measured using the assumptions that market participants would use when pricing the liability, assuming that market participants act in their economic best interest;
• Derivative financial instruments – market data from financial data vendors, electronic trading platforms or third-party valuation are used for valuation purposes. The derivatives represent non-complex products valued with generally accepted models. Valuation inputs are derived from the market data;
Luminor Bank AS Interim report for the period ended 31 March 2020
84
• Loans and deposits from credit institutions – the fair value of loans equals to their carrying value. Pricing of the loans from credit institutions is under market conditions. Expected cash flows of the liabilities from the banks are discounted with the same market rates as loans. Loans from credit institutions are long-term. Deposits from credit institutions are demand deposits. The fair value of deposits equals to their carrying value. Pricing of the deposits from credit institutions is under market conditions;
• Deposits from customers – the gross carrying amount of demand deposits as a fair value is applied as an approximation due to very short maturities;
• Debt securities issued – the debt securities issued by the Bank are initially recognized at fair value less transaction costs and are subsequently carried at amortized cost using effective interest rate (EIR) method. The fair value is calculated by discounting the future cash flows using the market interest rate yield curve.
18. RELATED PARTIES
Parties are considered to be related if one party has the ability to control the other party or exercise significant influence over the other party in making financial or operational decisions.
Related parties are defined as shareholders, members of the Supervisory Council and the Management Board as key management personnel, their close relatives and companies in which they have a controlling interest as well as associated companies.
The immediate parent of Luminor Bank AS is Luminor Holding AS that is ultimately controlled by BCP VII, an investment fund managed by an affiliate of Blackstone Group Inc. BCP VII is treated to be both the ultimate parent and ultimate controlling entity of Luminor Bank AS. Other shareholders of Luminor Holding AS - Nordea Bank Abp and DNB BANK ASA - are considered to be the entities with significant influence over the Group. More information disclosed in Note 1. A number of banking transactions are entered into with related parties in the normal course of business. These include loans, deposits foreign currency transactions and financial instruments. These transactions were carried out on commercial terms and at market rates. There have been no doubtful debts due from related parties as well as allowances for doubtful debts as at 31 March 2020 and 31 December 2019.
The volumes of related party transactions outstanding balances and related income and expense were as follows:
TRANSACTIONS WITH RELATED PARTIES
thousand EUR Q1 2020 Q1 2019
Interest income
Entities with significant influence over the entity 38 395
Interest expenses
Entities with significant influence over the entity -3 616 -1 275
Net commission and fee income
Entities with significant influence over the entity -8 -30
Net gain from financial derivatives
Entities with significant influence over the entity 6 762 4 079
Other administrative expenses
Entities with significant influence over the entity -4 365 -1 905
Other expenses
Entities with significant influence over the entity -2 275 -4 160
Total -3 464 -2 896
Luminor Bank AS Interim report for the period ended 31 March 2020
85
thousand EUR 31 March 2020 31 December 2019
Loans to credit institutions
Entities with significant influence over the entity 47 743 77 572
Loans to customers
Key management personnel 686 697
Derivative instruments
Entities with significant influence over the entity 37 118 46 519
Other assets
Entities with significant influence over the entity 3 450 199
Total assets 88 997 124 987
Due to credit institutions
Entities with significant influence over the entity 155 296 912 807
Deposits from customers
Key management personnel 931 983
Derivative instruments
Entities with significant influence over the entity 26 011 19 849
Other liabilities
Entities with significant influence over the entity 2 525 1 345
Total liabilities 184 763 934 984
Payments to the key management personnel in the first quarter of 2020 were 537 thousand EUR (in the first quarter of 2019: 385 thousand EUR).
As at 31 March 2020 loans and advances with associates ALD Automotive (3 entities) amounted to 15 209 thousand EUR (31 December 2019: 15 919 thousand EUR), deposits – 1 628 thousand EUR (31 December 2019: 985 thousand EUR), interest income for the first quarter of 2020 was 8 thousand EUR (the first quarter of 2019: 4 thousand EUR) and net fee and commission income for the first quarter of 2020 was 1 thousand EUR (the first quarter of 2019: 1 thousand EUR).
19. SEGMENT REPORTING
MEASUREMENT OF OPERATING SEGMENTS PERFORMANCE
The measurement principles and allocation between operating segments follow the information reported to the Chief Operating Decision Maker (CODM) as required by IFRS 8. In the Bank, the CODM has been defined as the Management Board. The Management Board monitors the operating results of its business units separately for the purpose of making decisions about resource allocation and performance assessment. Segment performance is evaluated based on profit before tax and is measured consistently with profit before tax in the consolidated financial statements. Interest income is reported net of expenses after internal funds transfer pricing, as management primarily relies on net interest revenue across product categories as a performance measure. Fees and commission income for segment performance is also reported net of expenses and split is made between different product categories for segment reporting.
Financial results are presented for the three main operating segments: Corporate Banking, Retail Banking and Wealth Management. Operating segments are reported in a manner consistent with the internal reporting provided to the CODM. Corporate Banking segment services business customers that have a dedicated relationship manager and all leasing customers who do not have a bank relationship. Retail Banking segment services business customers without a dedicated relationship manager and private individuals not belonging to Wealth Management segment. Wealth Management services wealthy private individuals and holding companies associated with those individuals. Results of other operating segments are included in Other segment.
Luminor Bank AS Interim report for the period ended 31 March 2020
86
Segment results consist of income and expenses associated directly to the customers belonging under respective segments (including internal funds transfer pricing result between operating segments and Other segment) and income and expenses not booked on customer level, which are allocated between the operating segments using internally agreed allocation mechanisms. Only assets and liabilities relating to customers who belong to the operating segments are reported under the respective segments, all other balance sheet items are reported under Other segment.
From the first quarter of 2020 it was decided to transfer customers with leasing exposures but without a relationship to bank entities from Other segment to Corporate segment and restatement was made also to historic periods. From the first quarter of 2020 Luminor started applying Activity Based Costing to allocate personnel costs, administrative costs and depreciation between operating segments and restatement was also made to segment split of costs to 2019 figures.
thousand EUR Corporate Retail Wealth
Managment Other Total
Q1 2020
The Group
Net interest income 30 437 27 688 1 789 -5 834 54 080
Net fees & commission income 6 574 10 508 504 184 17 770
In order to be prepared for dealing efficiently and expertly with the additional workload potentially caused by the economic impact of COVID-19 and support our customers also in the most difficult cases, a Credit Advisory and Restructuring division has been established as of 1 May 2020. It is a temporary dedicated unit with a planned duration of 18 months with a possible 6-month extension period, supporting the current teams working in this field. The Head of the new division is Solvita Deglava. She has strong experience in the restructuring area, having worked in that capacity in different banks.
Luminor Bank AS Interim report for the period ended 31 March 2020