22
Interim report Q4 2018 February 5, 2019 Per Lindberg, President and CEO Anders Lindén, CFO
Interim report
Q4 2018
February 5, 2019
Per Lindberg, President and CEO
Anders Lindén, CFO

© 2019 by Epiroc. All rights reserved.
Key highlights
• High demand and growth
– Orders received +16%
– Revenues +22%
– Operating profit +25%
– Adjusted operating margin 20.3%
• Increased pace of introducing new products
• Acquisitions to enhance customer offerings
– Six acquisitions closed and two more agreed
• Establishment of Epiroc
– Listing on Nasdaq in June
Full year 2018
0
3
6
9
12
15
18
21
24
0
5,000
10,000
15,000
20,000
25,000
30,000
35,000
40,000
2015 2016 2017 2018
Revenues, SEK million Operating margin, %
Operating margin, adj., %
2
© 2019 by Epiroc. All rights reserved.
Key highlights
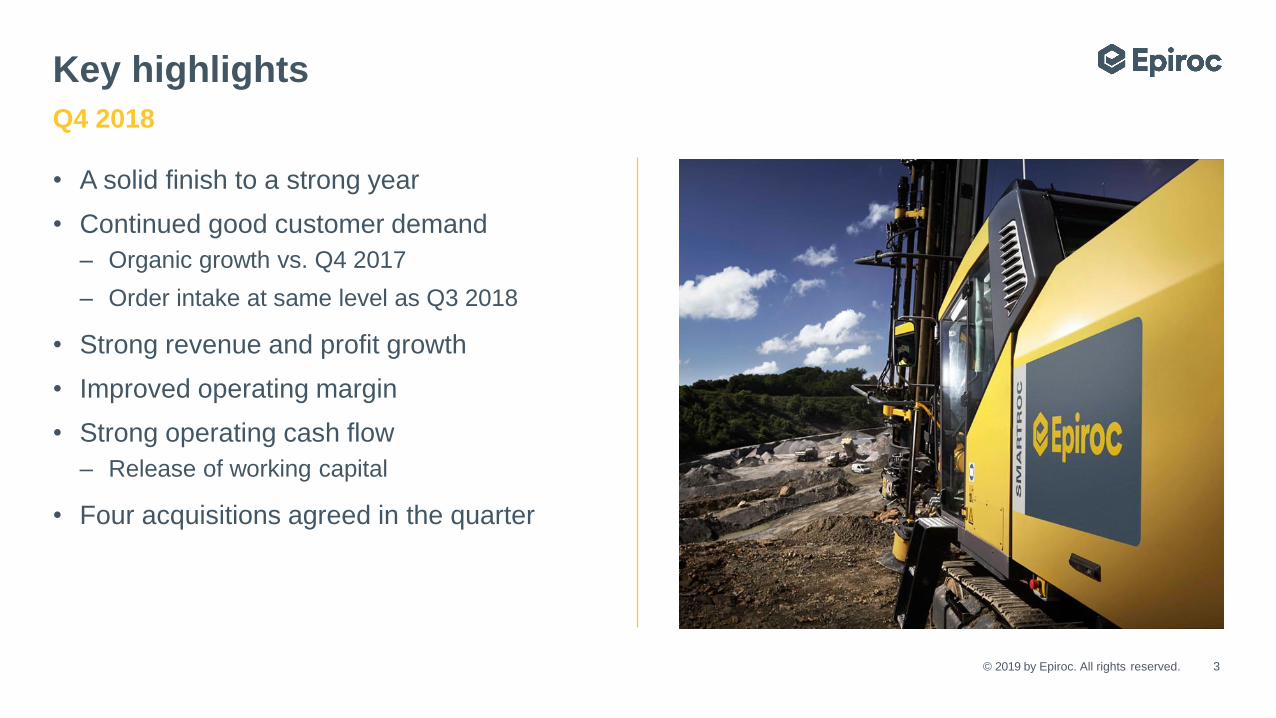
• A solid finish to a strong year
• Continued good customer demand
– Organic growth vs. Q4 2017
– Order intake at same level as Q3 2018
• Strong revenue and profit growth
• Improved operating margin
• Strong operating cash flow
– Release of working capital
• Four acquisitions agreed in the quarter
Q4 2018
3
© 2019 by Epiroc. All rights reserved.
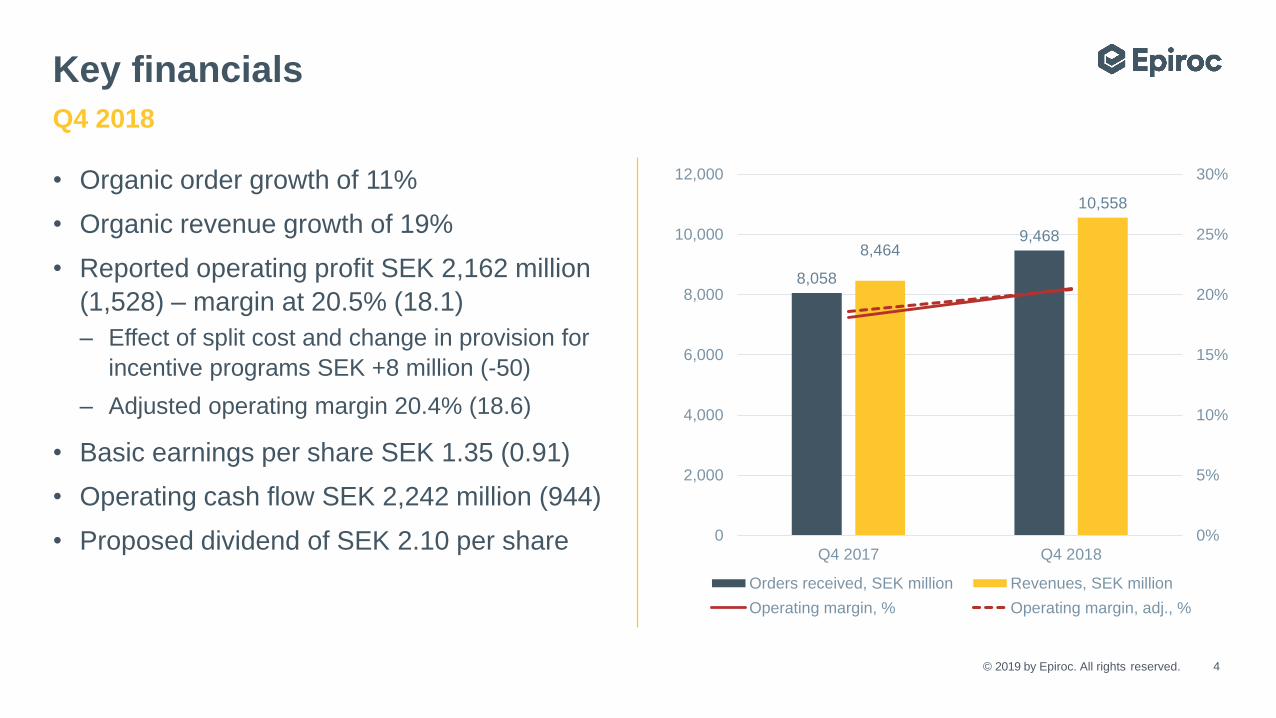
Key financials
• Organic order growth of 11%
• Organic revenue growth of 19%
• Reported operating profit SEK 2,162 million
(1,528) – margin at 20.5% (18.1)
– Effect of split cost and change in provision for
incentive programs SEK +8 million (-50)
– Adjusted operating margin 20.4% (18.6)
• Basic earnings per share SEK 1.35 (0.91)
• Operating cash flow SEK 2,242 million (944)
• Proposed dividend of SEK 2.10 per share
Q4 2018
8,058
9,4688,464
10,558
0%
5%
10%
15%
20%
25%
30%
0
2,000
4,000
6,000
8,000
10,000
12,000
Q4 2017 Q4 2018
Orders received, SEK million Revenues, SEK million
Operating margin, % Operating margin, adj., %
4

© 2019 by Epiroc. All rights reserved.
Orders received
Q4 2018 – change in local currency
5
25%
18%
21%
13%
23%
North America South America
Europe Africa/Middle East
Asia/Australia
73%
27%
Mining Infrastructure
North America
+36%
South America
+29%
Africa/Middle East
+0%
Europe
-4%
Asia/Australia
+16% Orders received by customer type 2018
Orders received by region Q4 2018
© 2019 by Epiroc. All rights reserved.
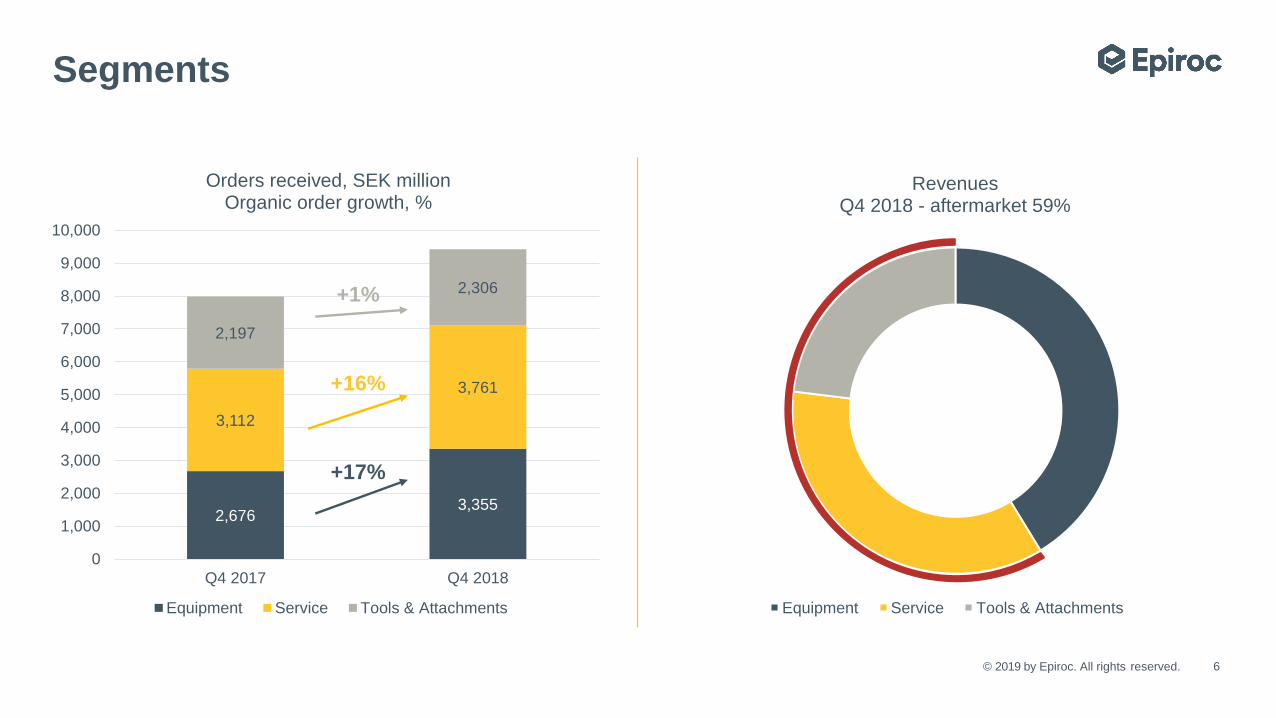
RevenuesQ4 2018 - aftermarket 59%
Equipment Service Tools & Attachments
Segments
6
2,6763,355
3,112
3,761
2,197
2,306
0
1,000
2,000
3,000
4,000
5,000
6,000
7,000
8,000
9,000
10,000
Q4 2017 Q4 2018
Orders received, SEK millionOrganic order growth, %
Equipment Service Tools & Attachments
+1%
+16%
+17%
© 2019 by Epiroc. All rights reserved.
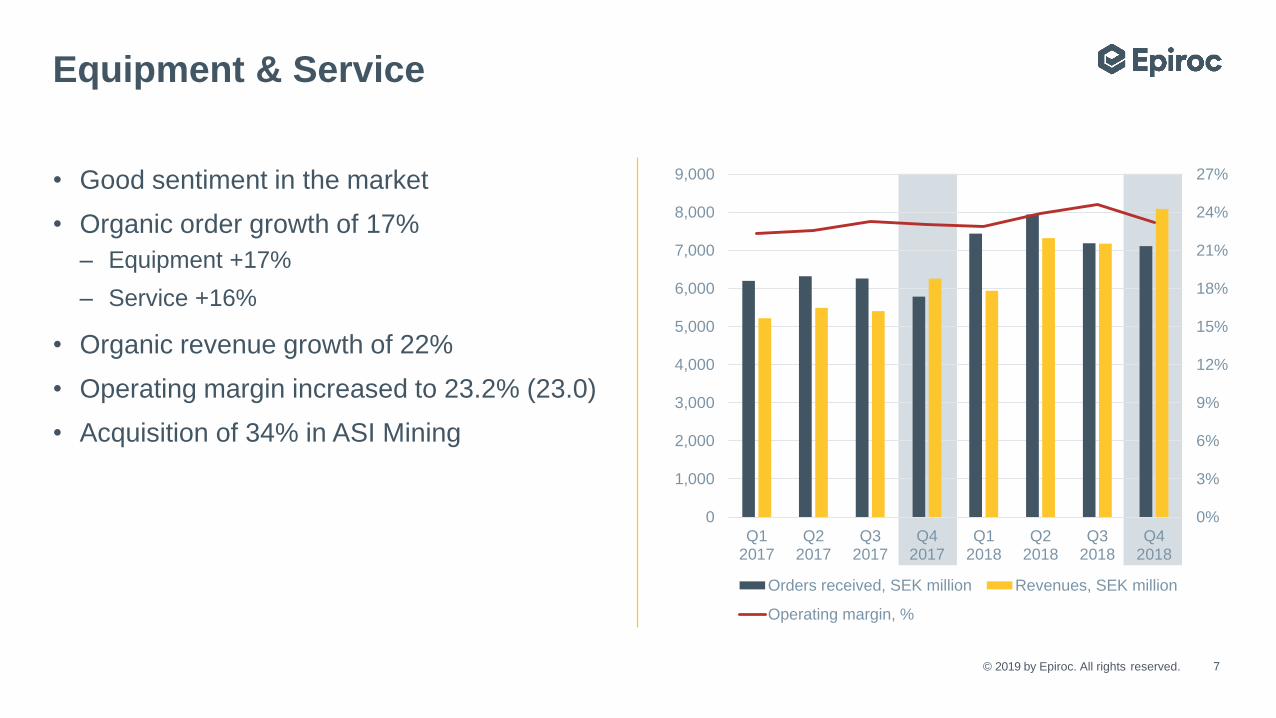
Equipment & Service
• Good sentiment in the market
• Organic order growth of 17%
– Equipment +17%
– Service +16%
• Organic revenue growth of 22%
• Operating margin increased to 23.2% (23.0)
• Acquisition of 34% in ASI Mining
7
0%
3%
6%
9%
12%
15%
18%
21%
24%
27%
0
1,000
2,000
3,000
4,000
5,000
6,000
7,000
8,000
9,000
Q12017
Q22017
Q32017
Q42017
Q12018
Q22018
Q32018
Q42018
Orders received, SEK million Revenues, SEK million
Operating margin, %

© 2019 by Epiroc. All rights reserved.
Tools & Attachments
• Good business environment
• Organic order growth of 1%
– Impact from measures to improve product mix
and efficiency actions
• Organic revenue growth of 10%
• Operating margin improved to 13.3% (10.2)
• Agreement to acquire manufacturers of
exploration drilling tools and rock
reinforcement products
– Total turnover of about SEK 1.2 billion
8
0%
2%
4%
6%
8%
10%
12%
14%
16%
0
500
1,000
1,500
2,000
2,500
3,000
Q12017
Q22017
Q32017
Q42017
Q12018
Q22018
Q32018
Q42018
Orders received, SEK million Revenues, SEK million
Operating margin,%

© 2019 by Epiroc. All rights reserved.
Business development / Innovations
• Second generation battery equipment
– Larger fossil-free machines
• Agreement with Ericsson
– Ecosystem required for automation and
digitalization
• New drum cutters strengthen our offering in
hydraulic attachments
Q4 2018
Financials
© 2019 by Epiroc. All rights reserved.
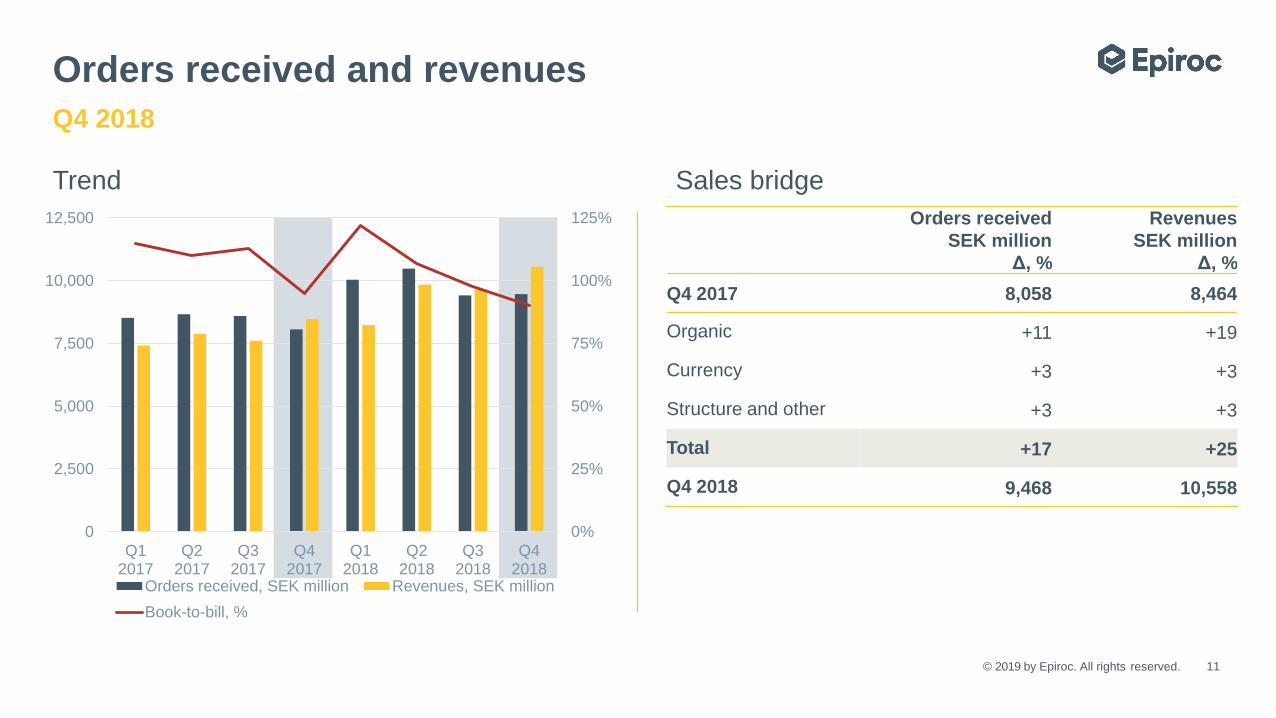
Orders received and revenues
Trend Sales bridge
Q4 2018
Orders received
SEK million
Δ, %
Revenues
SEK million
Δ, %
Q4 2017 8,058 8,464
Organic +11 +19
Currency +3 +3
Structure and other +3 +3
Total +17 +25
Q4 2018 9,468 10,558
11
0%
25%
50%
75%
100%
125%
0
2,500
5,000
7,500
10,000
12,500
Q12017
Q22017
Q32017
Q42017
Q12018
Q22018
Q32018
Q42018
Orders received, SEK million Revenues, SEK million
Book-to-bill, %

© 2019 by Epiroc. All rights reserved.
Operating profit and margin
Trend Profit bridge
Q4 2018
Operating profit
SEK million
Margin, %
Δ, pp
Q4 2017 1,528 18.1
Organic +407 +1.0
Currency +143 +1.0
Structure and other* +84 +0.4
Total +634 +2.4
Q4 2018 2,162 20.5
0%
5%
10%
15%
20%
25%
0
500
1,000
1,500
2,000
2,500
Q12017
Q22017
Q32017
Q42017
Q12018
Q22018
Q32018
Q42018
Split and incentive, SEK million Operating profit, SEK million
Operating margin, % Operating margin, adj., %
*Includes one-time costs related to the split from Atlas Copco and changes in provision
for share-based long-term incentive programs.
*Includes operating profit/loss from acquisitions, contract manufacturing, one-time costs, and
changes in provision for share-based long-term incentive programs.
.
© 2019 by Epiroc. All rights reserved.
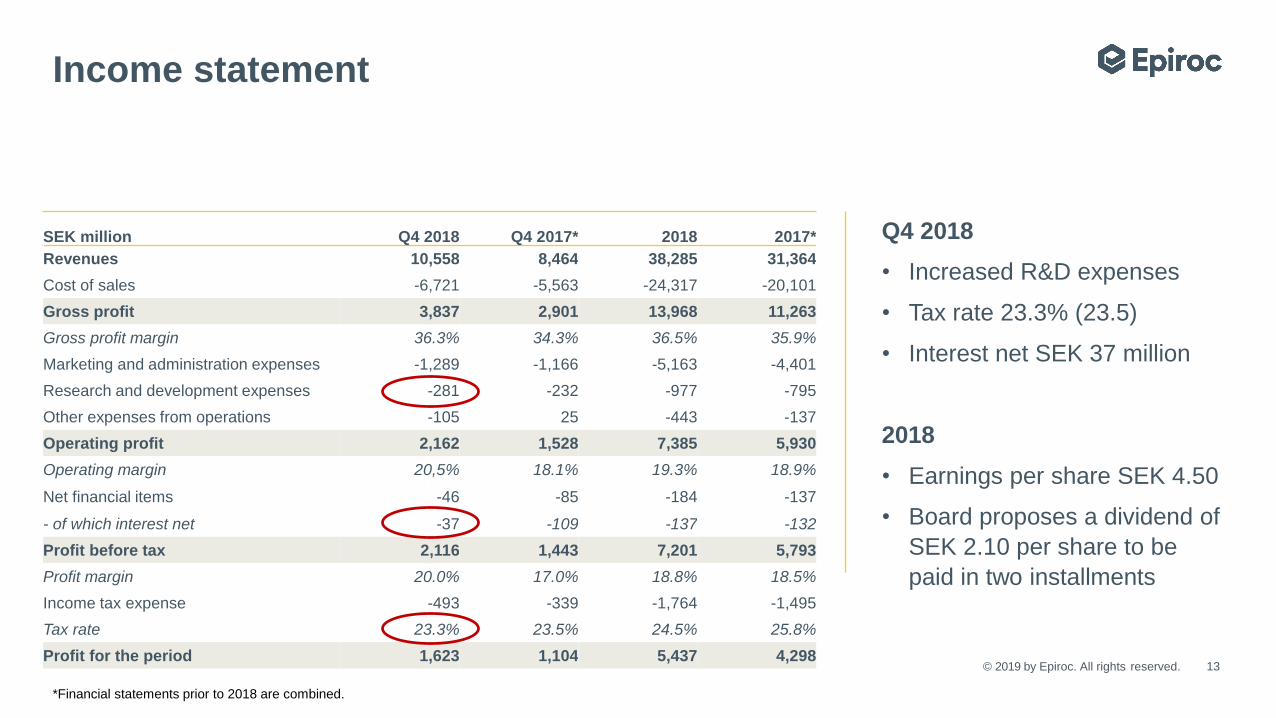
Income statement
SEK million Q4 2018 Q4 2017* 2018 2017*
Revenues 10,558 8,464 38,285 31,364
Cost of sales -6,721 -5,563 -24,317 -20,101
Gross profit 3,837 2,901 13,968 11,263
Gross profit margin 36.3% 34.3% 36.5% 35.9%
Marketing and administration expenses -1,289 -1,166 -5,163 -4,401
Research and development expenses -281 -232 -977 -795
Other expenses from operations -105 25 -443 -137
Operating profit 2,162 1,528 7,385 5,930
Operating margin 20,5% 18.1% 19.3% 18.9%
Net financial items -46 -85 -184 -137
- of which interest net -37 -109 -137 -132
Profit before tax 2,116 1,443 7,201 5,793
Profit margin 20.0% 17.0% 18.8% 18.5%
Income tax expense -493 -339 -1,764 -1,495
Tax rate 23.3% 23.5% 24.5% 25.8%
Profit for the period 1,623 1,104 5,437 4,298
Q4 2018
• Increased R&D expenses
• Tax rate 23.3% (23.5)
• Interest net SEK 37 million
2018
• Earnings per share SEK 4.50
• Board proposes a dividend of
SEK 2.10 per share to be
paid in two installments
13
*Financial statements prior to 2018 are combined.
© 2019 by Epiroc. All rights reserved.
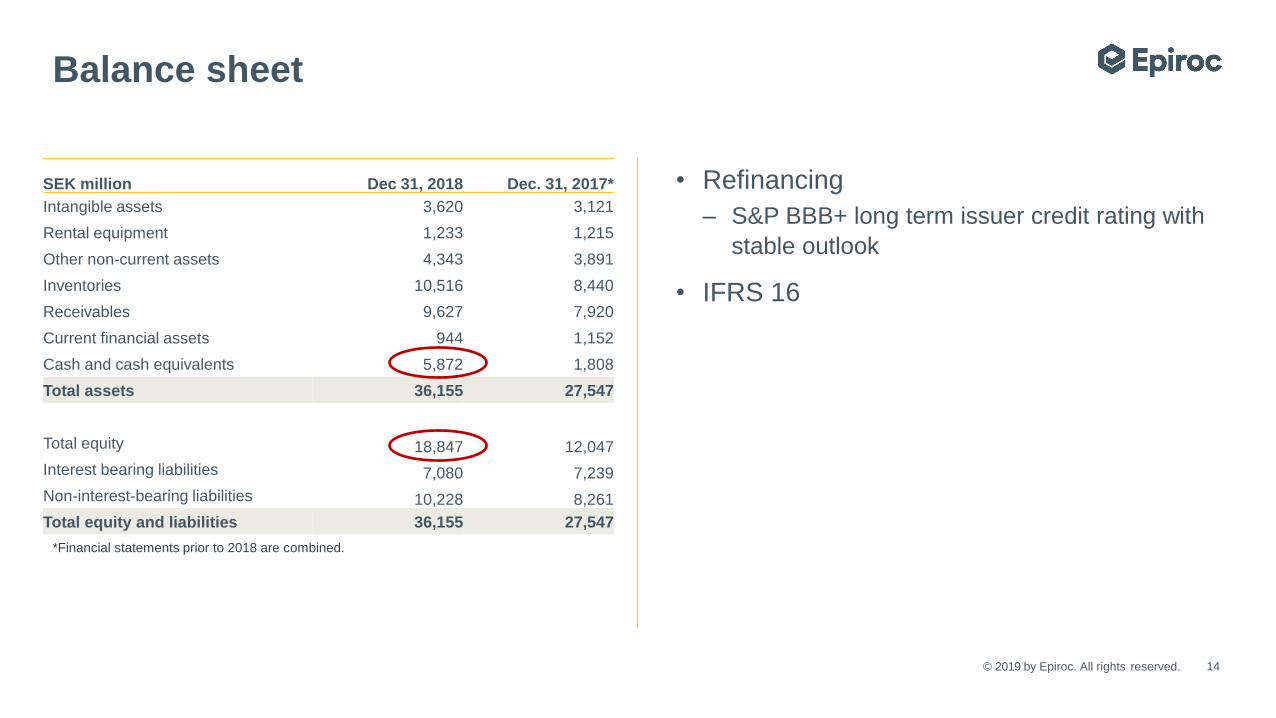
Balance sheet
SEK million Dec 31, 2018 Dec. 31, 2017*
Intangible assets 3,620 3,121
Rental equipment 1,233 1,215
Other non-current assets 4,343 3,891
Inventories 10,516 8,440
Receivables 9,627 7,920
Current financial assets 944 1,152
Cash and cash equivalents 5,872 1,808
Total assets 36,155 27,547
Total equity 18,847 12,047
Interest bearing liabilities 7,080 7,239
Non-interest-bearing liabilities 10,228 8,261
Total equity and liabilities 36,155 27,547
• Refinancing
– S&P BBB+ long term issuer credit rating with
stable outlook
• IFRS 16
14
*Financial statements prior to 2018 are combined.
© 2019 by Epiroc. All rights reserved.
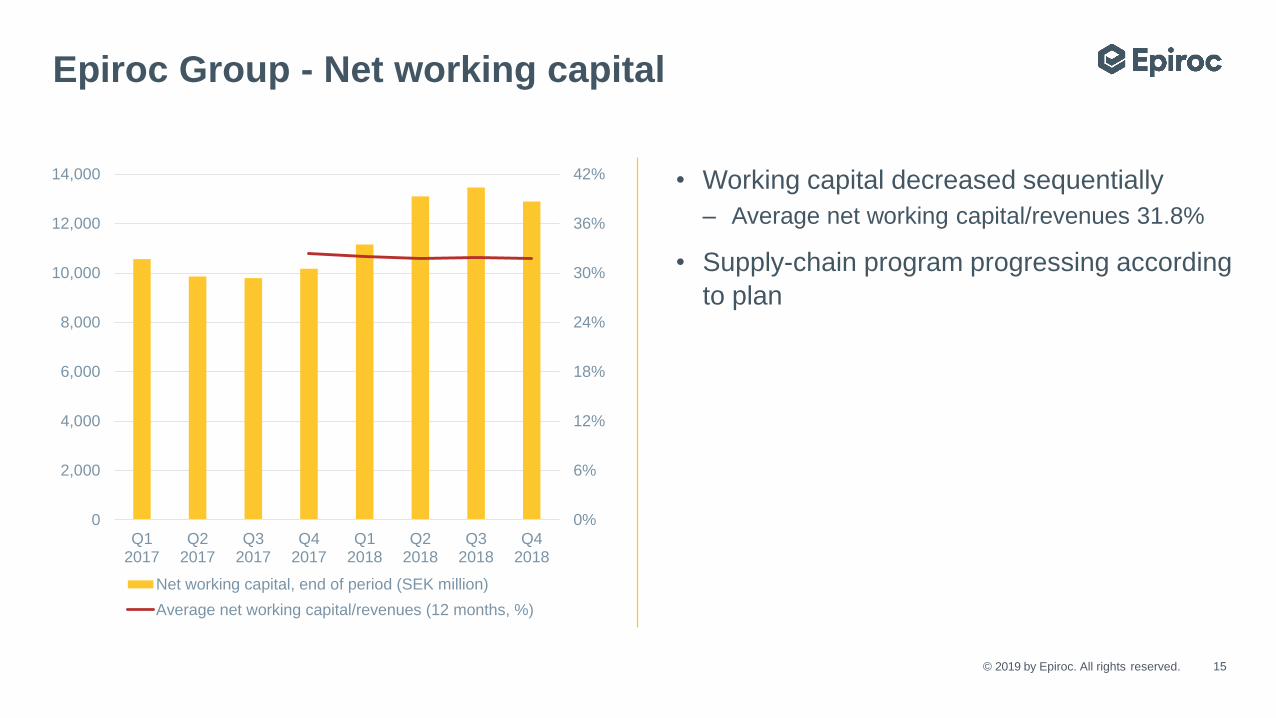
Epiroc Group - Net working capital
0%
6%
12%
18%
24%
30%
36%
42%
0
2,000
4,000
6,000
8,000
10,000
12,000
14,000
Q12017
Q22017
Q32017
Q42017
Q12018
Q22018
Q32018
Q42018
Net working capital, end of period (SEK million)
Average net working capital/revenues (12 months, %)
• Working capital decreased sequentially
– Average net working capital/revenues 31.8%
• Supply-chain program progressing according
to plan
15
© 2019 by Epiroc. All rights reserved.
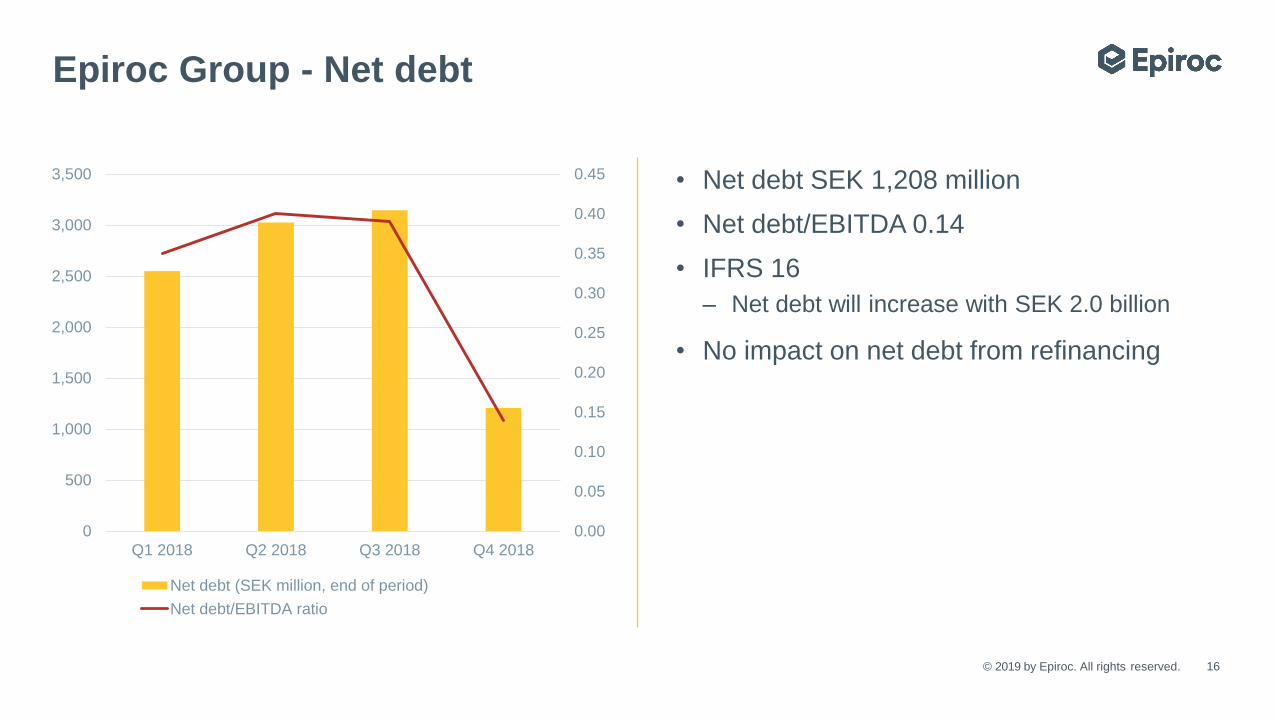
Epiroc Group - Net debt
0.00
0.05
0.10
0.15
0.20
0.25
0.30
0.35
0.40
0.45
0
500
1,000
1,500
2,000
2,500
3,000
3,500
Q1 2018 Q2 2018 Q3 2018 Q4 2018
Net debt (SEK million, end of period)
Net debt/EBITDA ratio
• Net debt SEK 1,208 million
• Net debt/EBITDA 0.14
• IFRS 16
– Net debt will increase with SEK 2.0 billion
• No impact on net debt from refinancing
16

© 2019 by Epiroc. All rights reserved.
Cash flow
SEK million Q4 2018 Q4 2017*
Operating profit 2,162 1,528
Depreciation, amortization and impairment 350 341
Capital gain/loss and other non-cash items -81 -112
2,431 1,757
Net financial items received/paid -24 -279
Taxes paid -326 -180
Pension funding 4 -13
Change in working capital 415 -157
Increase in rental equipment, net -13 -112
Net cash from operating activities 2,487 1,016
Investments in PPE, net -149 -76
Investments in intangible assets -146 -73
Other investments, net 118 3,011
Other adjustments -68** -2,934***
Operating cash flow 2,242 944
Acquisitions of subsidiaries 64 0
• Operating cash flow SEK 2,242 million
• Working capital decreased
17
*Financial statements prior to 2018 are combined.
**Mainly currency hedges of loans and divestment of Payment Solutions credit portfolios.
***Mainly changes in cash-pool with Atlas Copco and currency hedges of loans.
Summary

© 2019 by Epiroc. All rights reserved.
Key highlights
• A solid finish to a strong year
• Continued good customer demand
– Organic growth vs. Q4 2017
– Order intake at same level as Q3 2018
• Strong revenue and profit growth
• Improved operating margin
• Strong operating cash flow
– Release of working capital
• Four acquisitions agreed in the quarter
• Near-term demand expected to remain at
current level
Q4 2018
19
Q&A
United. Inspired.Performance unites us, innovation inspires us,
and commitment drives us to keep moving forward.
Count on Epiroc to deliver the solutions you need
to succeed today and the technology to lead tomorrow.
epiroc.com


