25
July 2017 Interim Results Half Year 2017

July 2017
Interim Results
Half Year 2017

A new strategy
“NSI will be the leading specialist in the Dutch office market, with a strong and
efficient platform that will drive returns through pro-active asset management, value-
add initiatives and active capital recycling.
NSI will be the partner of choice for investors looking to team up with a best-in-class
operator”
NSI Full Year results 2016 I 2
Half Year 2017
NSI interim results 2017 I 3
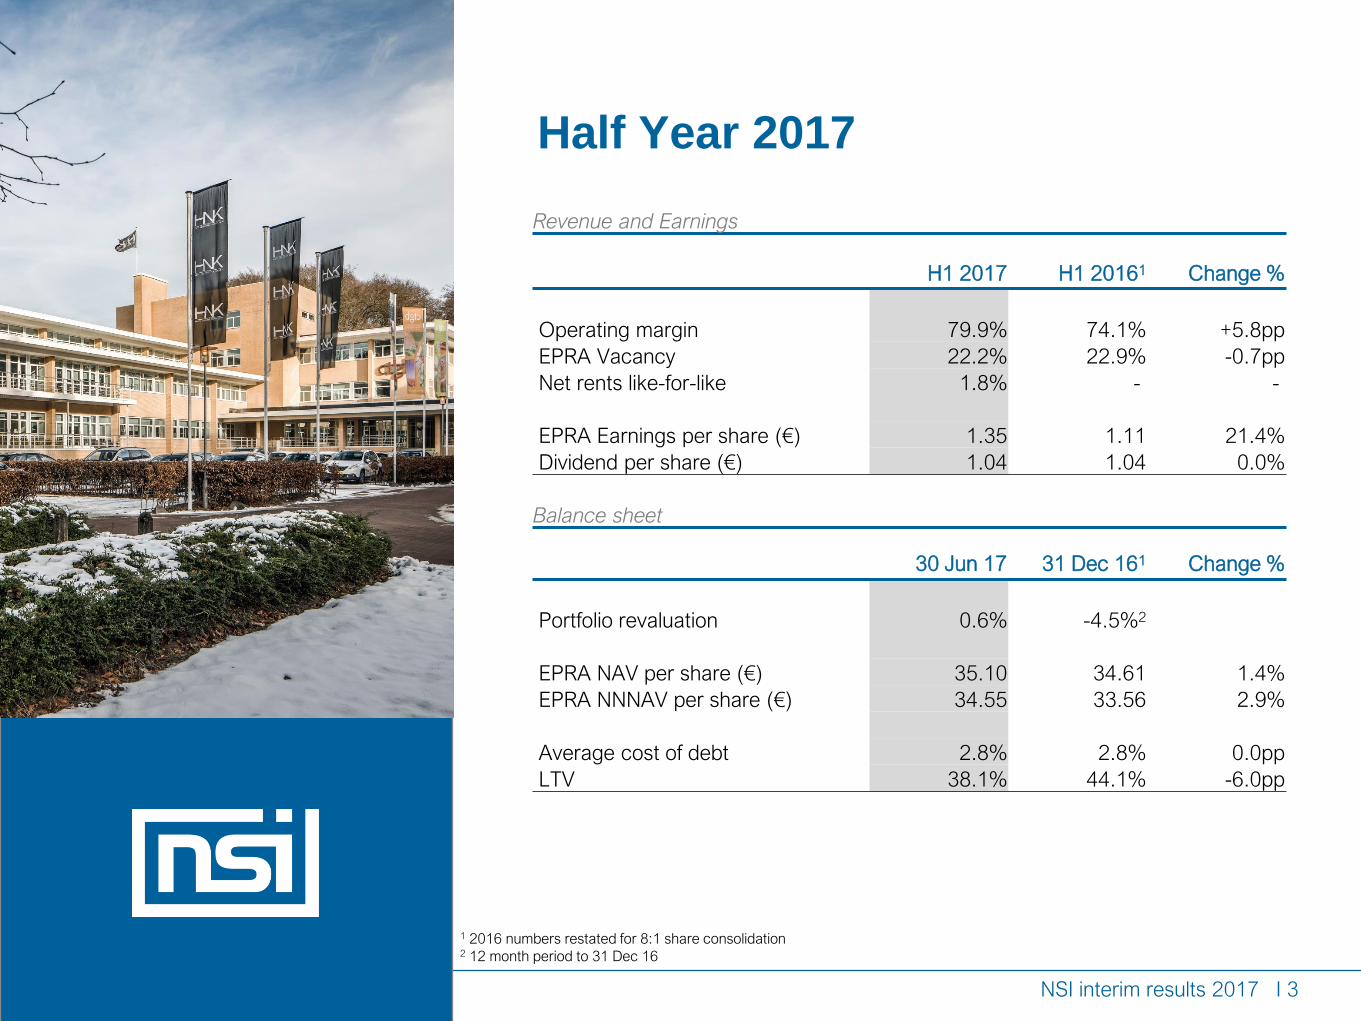
Revenue and Earnings
H1 2017 H1 20161 Change %
Operating margin 79.9% 74.1% +5.8pp
EPRA Vacancy 22.2% 22.9% -0.7pp
Net rents like-for-like 1.8% - -
EPRA Earnings per share (€) 1.35 1.11 21.4%
Dividend per share (€) 1.04 1.04 0.0%
Balance sheet
30 Jun 17 31 Dec 161 Change %
Portfolio revaluation 0.6% -4.5%2
EPRA NAV per share (€) 35.10 34.61 1.4%
EPRA NNNAV per share (€) 34.55 33.56 2.9%
Average cost of debt 2.8% 2.8% 0.0pp
LTV 38.1% 44.1% -6.0pp
1 2016 numbers restated for 8:1 share consolidation2 12 month period to 31 Dec 16
Progress
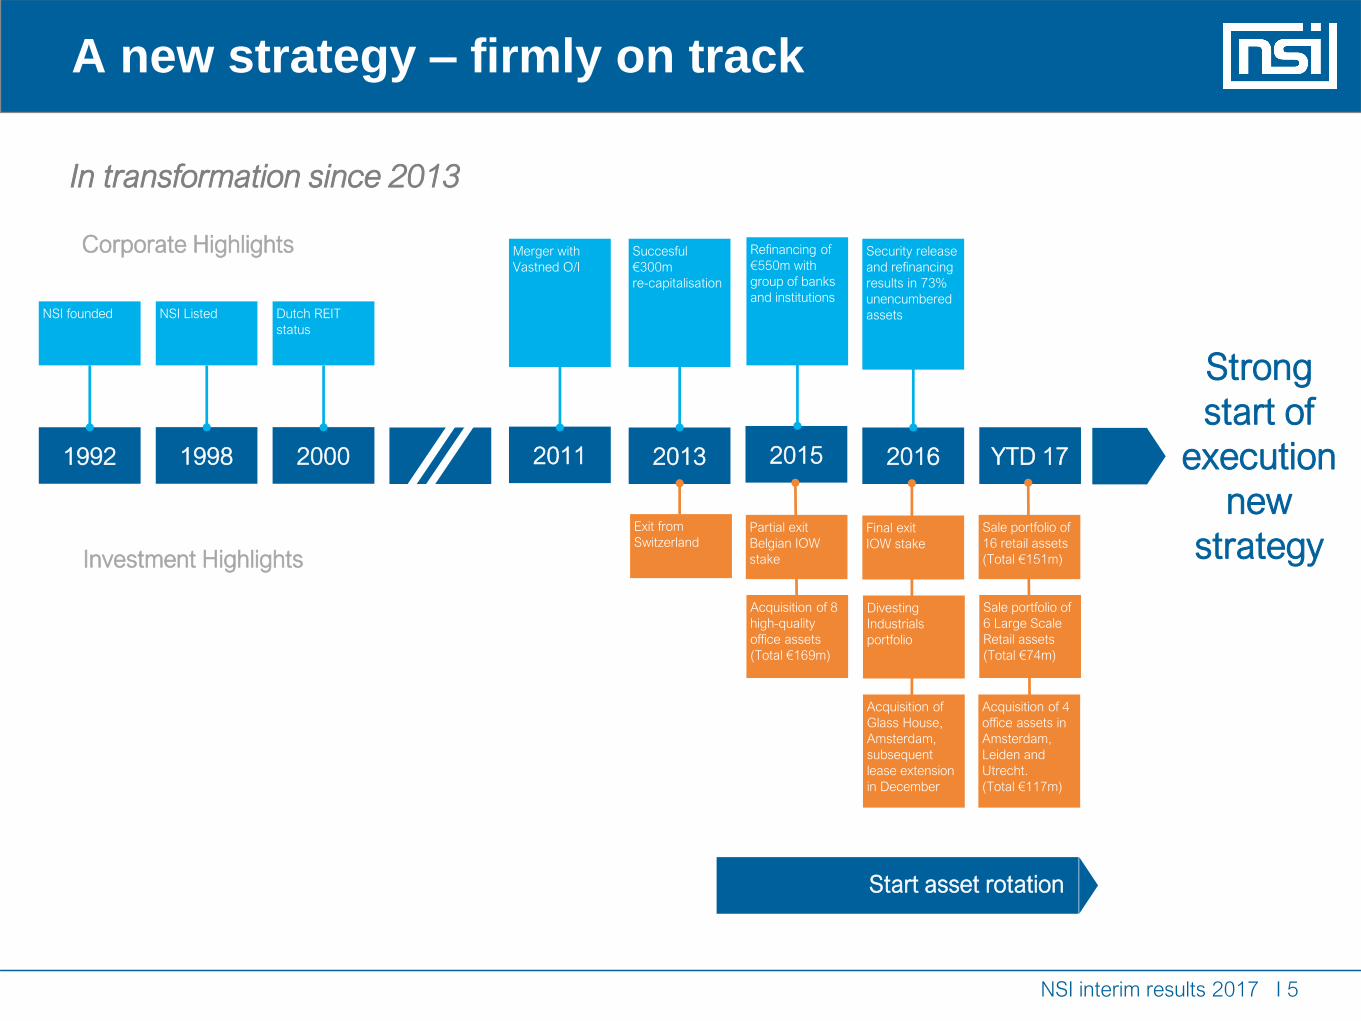
A new strategy – firmly on track
2011 2013 YTD 172015 2016200019981992
Corporate Highlights
Investment Highlights
NSI founded NSI Listed Dutch REIT
status
Merger with
Vastned O/I
Succesful
€300m
re-capitalisation
Refinancing of
€550m with
group of banks
and institutions
Security release
and refinancing
results in 73%
unencumbered
assets
Exit from
SwitzerlandPartial exit
Belgian IOW
stake
Acquisition of 8
high-quality
office assets
(Total €169m)
Final exit
IOW stake
Divesting
Industrials
portfolio
Acquisition of
Glass House,
Amsterdam,
subsequent
lease extension
in December
Sale portfolio of
16 retail assets
(Total €151m)
Sale portfolio of
6 Large Scale
Retail assets
(Total €74m)
Start asset rotation
Strong
start of
execution
new
strategy
In transformation since 2013
Acquisition of 4
office assets in
Amsterdam,
Leiden and
Utrecht.
(Total €117m)
NSI interim results 2017 I 5
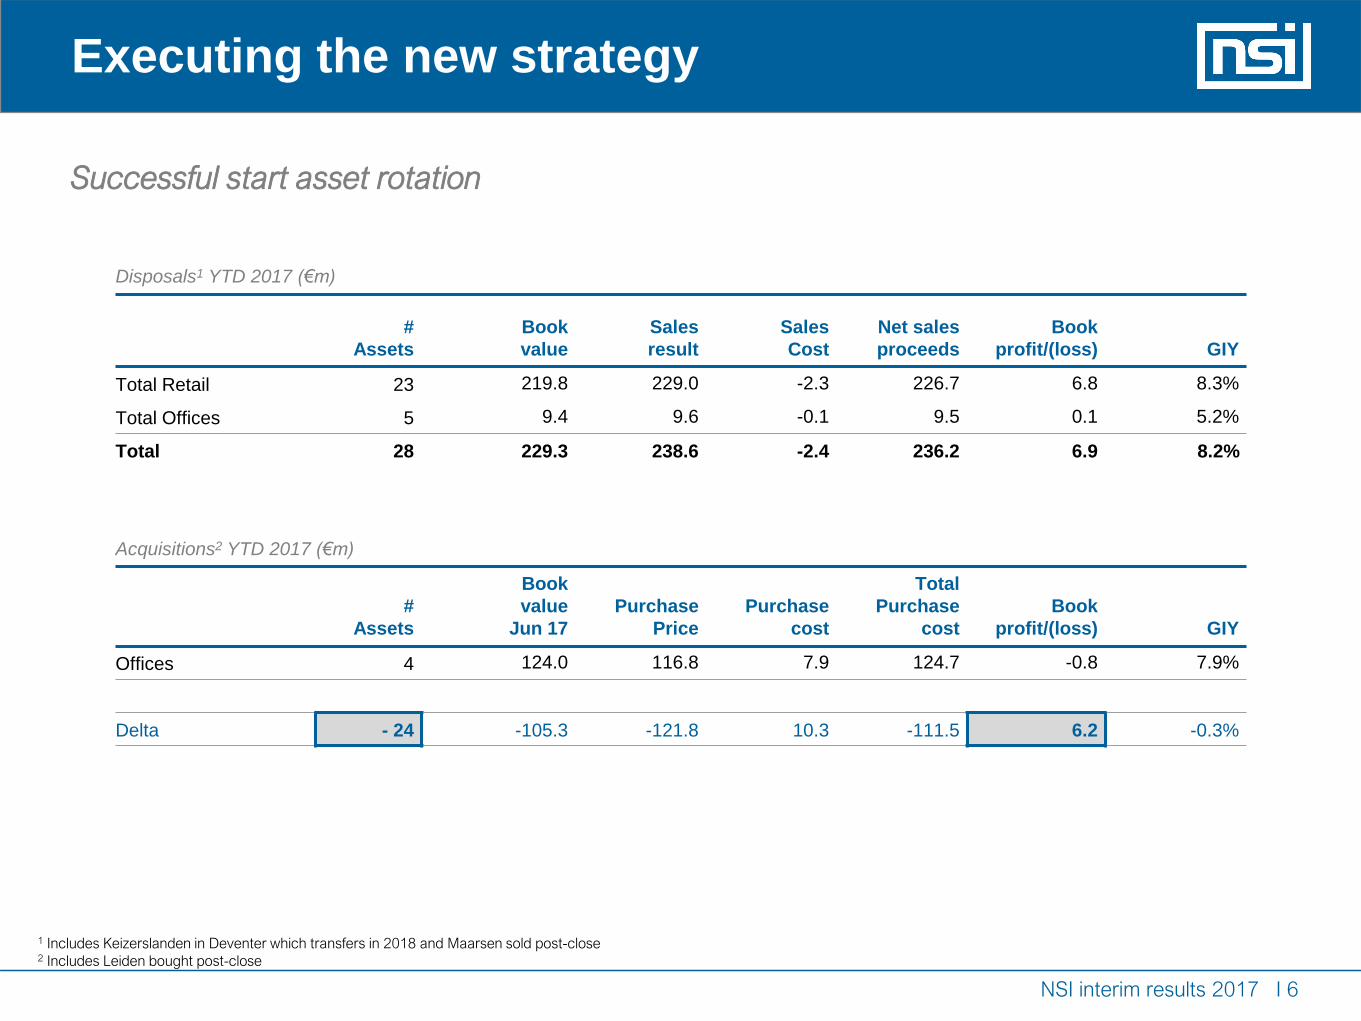
Executing the new strategy
NSI interim results 2017 I 6
Disposals1 YTD 2017 (€m)
#
Assets
Book
value
Sales
result
Sales
Cost
Net sales
proceeds
Book
profit/(loss) GIY
Total Retail 23 219.8 229.0 -2.3 226.7 6.8 8.3%
Total Offices 5 9.4 9.6 -0.1 9.5 0.1 5.2%
Total 28 229.3 238.6 -2.4 236.2 6.9 8.2%
Acquisitions2 YTD 2017 (€m)
#
Assets
Book
value
Jun 17
Purchase
Price
Purchase
cost
Total
Purchase
cost
Book
profit/(loss) GIY
Offices 4 124.0 116.8 7.9 124.7 -0.8 7.9%
Delta - 24 -105.3 -121.8 10.3 -111.5 6.2 -0.3%
1 Includes Keizerslanden in Deventer which transfers in 2018 and Maarsen sold post-close 2 Includes Leiden bought post-close
Successful start asset rotation
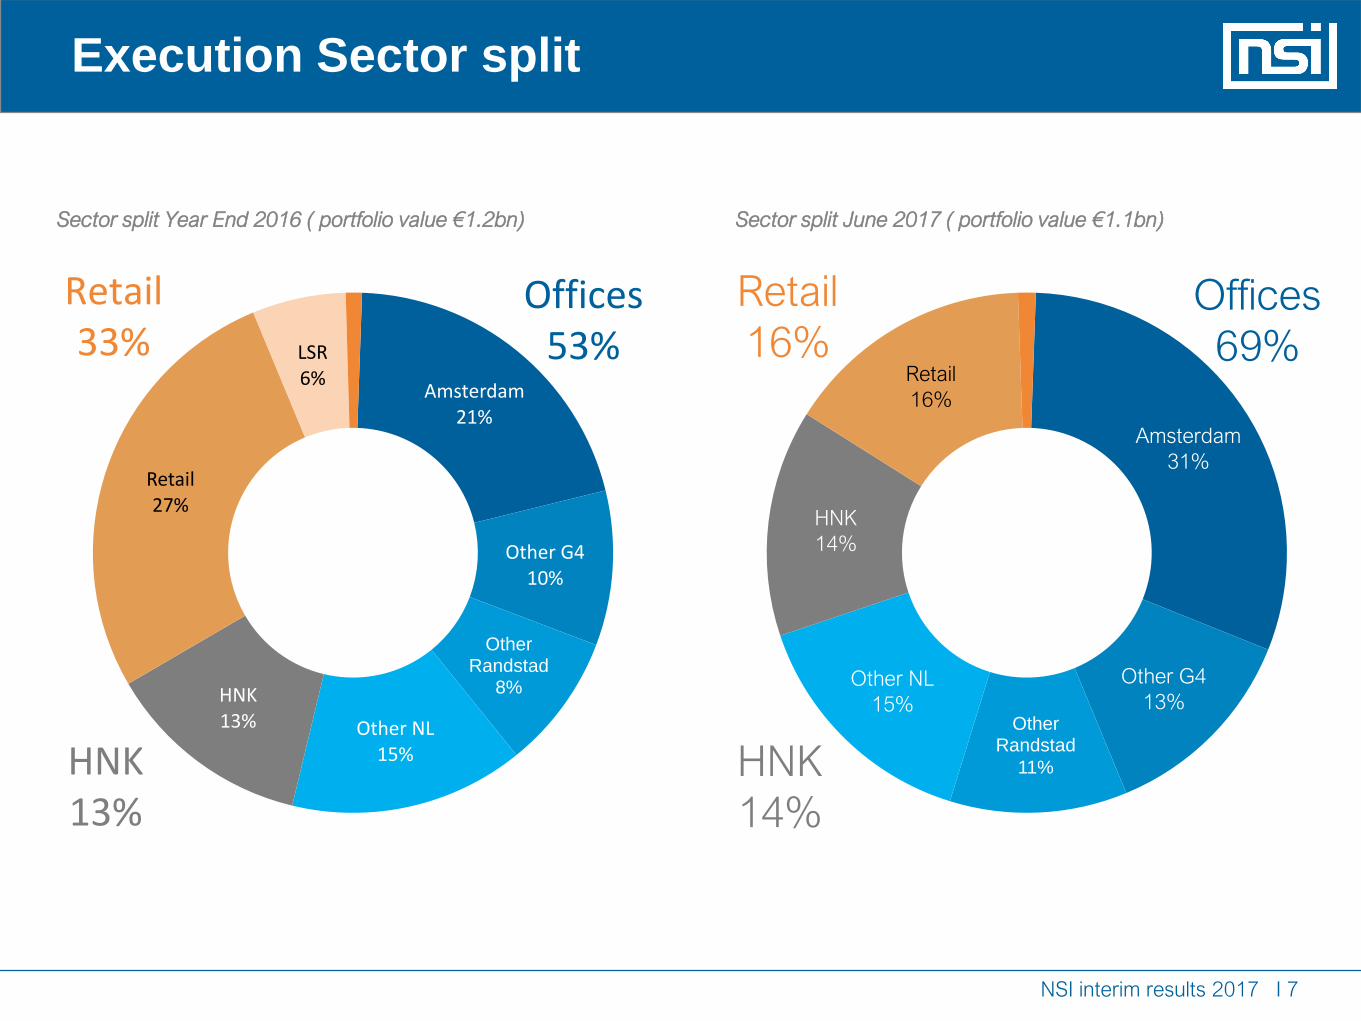
Execution Sector split
Amsterdam
31%
Other G4
13%Other
Randstad
11%
Other NL
15%
HNK
14%
Retail
16%
Retail
16%
HNK
14%
Offices
69%Amsterdam
21%
Other G410%
Other Randstad
8%
Other NL15%
HNK13%
Retail27%
LSR6%
Retail33%
HNK13%
Offices53%
Sector split Year End 2016 ( portfolio value €1.2bn) Sector split June 2017 ( portfolio value €1.1bn)
NSI interim results 2017 I 7

Portfolio update
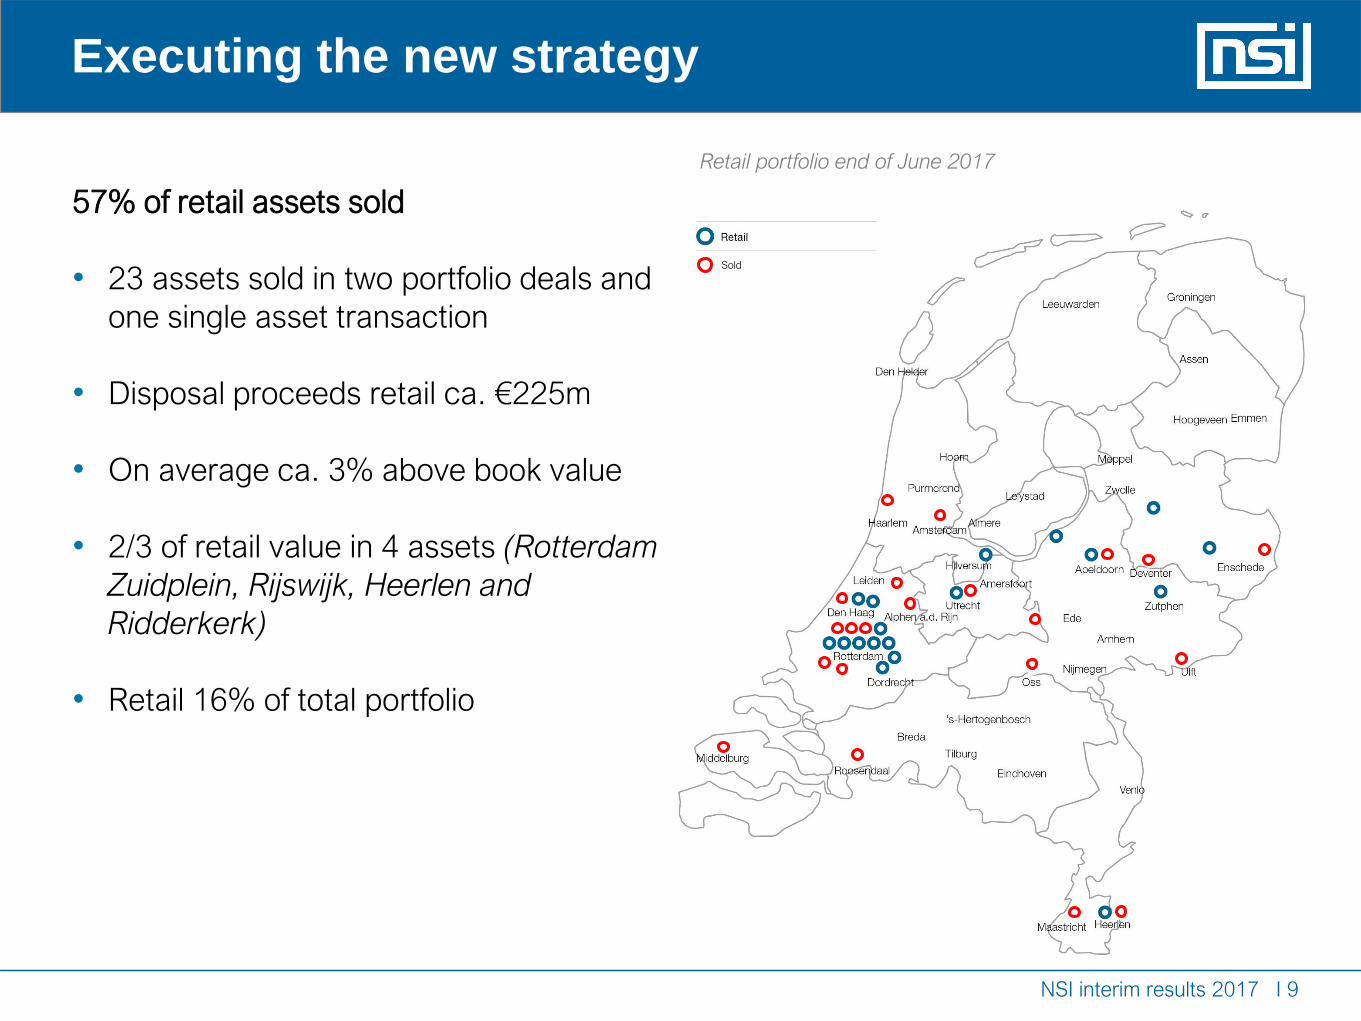
57% of retail assets sold
• 23 assets sold in two portfolio deals and
one single asset transaction
• Disposal proceeds retail ca. €225m
• On average ca. 3% above book value
• 2/3 of retail value in 4 assets (Rotterdam
Zuidplein, Rijswijk, Heerlen and
Ridderkerk)
• Retail 16% of total portfolio
Executing the new strategy
Retail portfolio end of June 2017
Sold
NSI interim results 2017 I 9
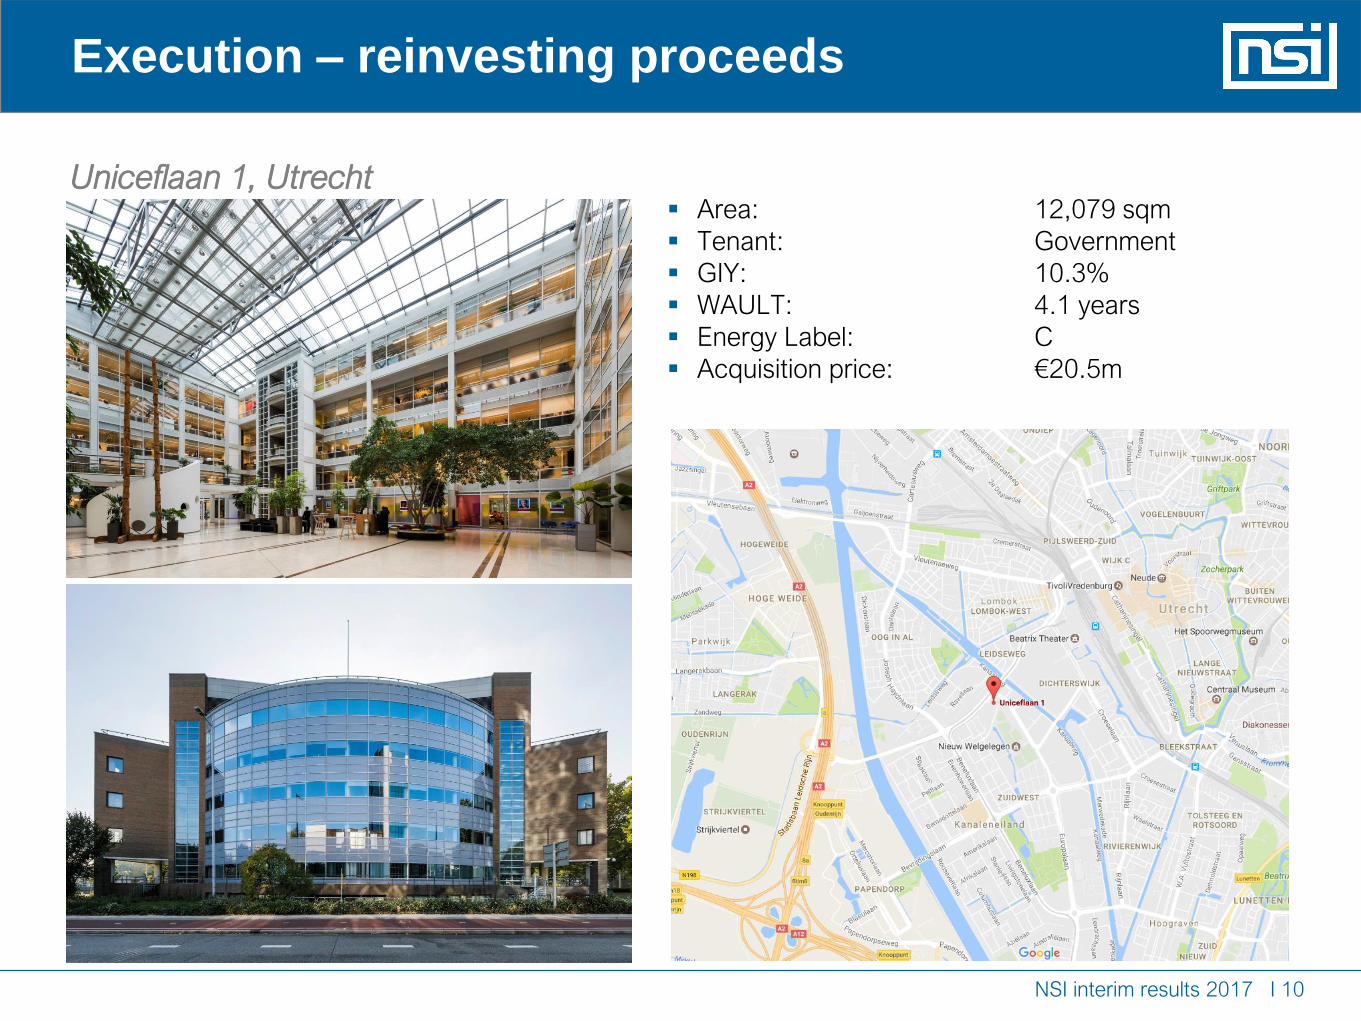
▪ Area: 12,079 sqm
▪ Tenant: Government
▪ GIY: 10.3%
▪ WAULT: 4.1 years
▪ Energy Label: C
▪ Acquisition price: €20.5m
Uniceflaan 1, Utrecht
Execution – reinvesting proceeds
NSI interim results 2017 I 10
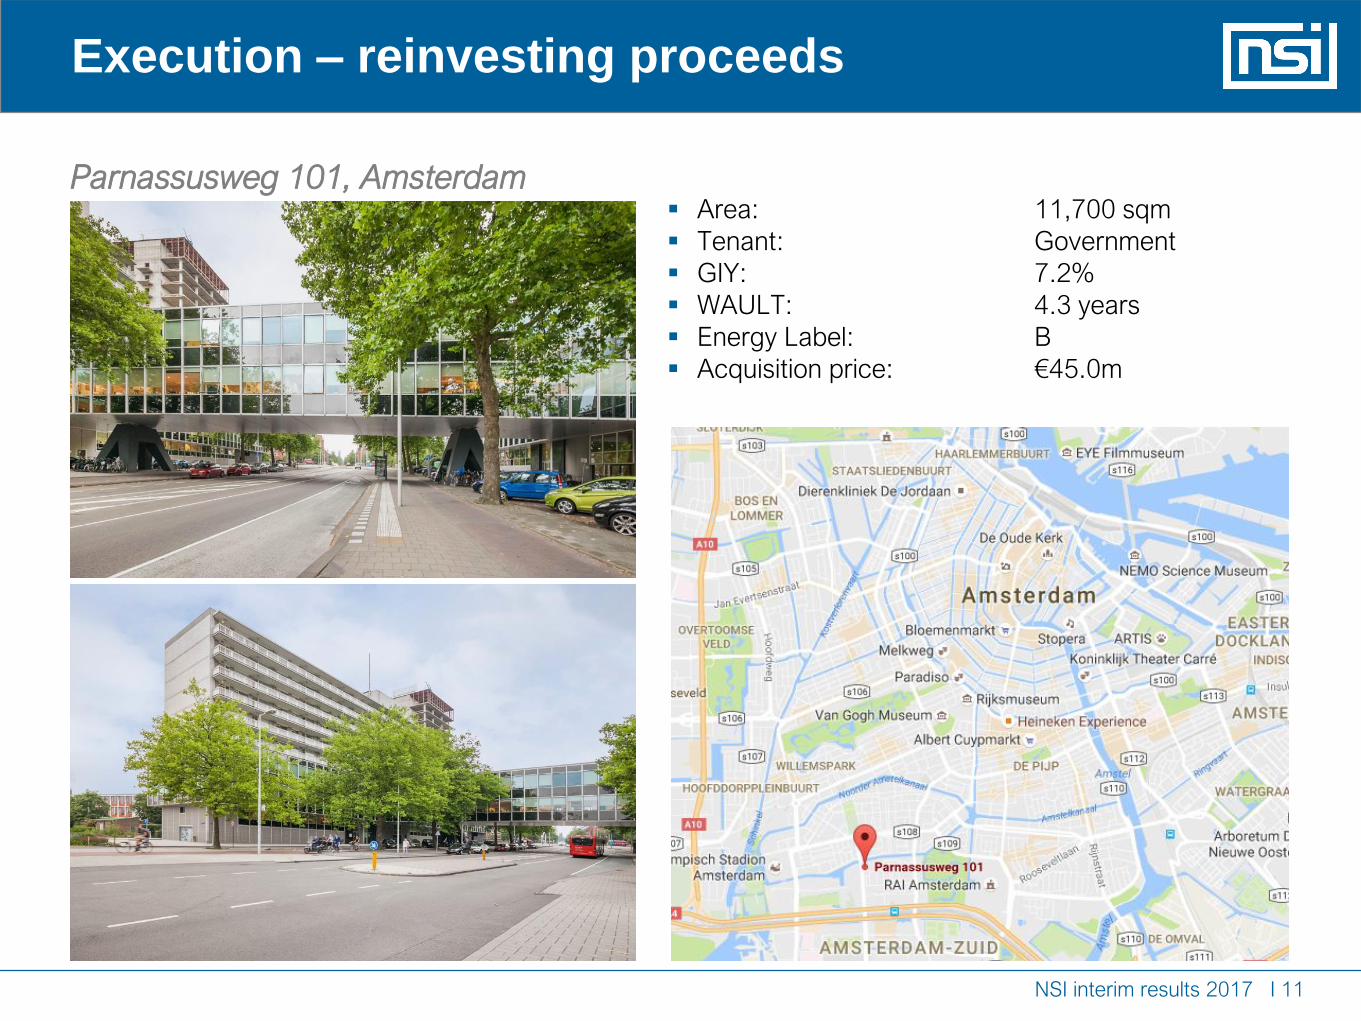
▪ Area: 11,700 sqm
▪ Tenant: Government
▪ GIY: 7.2%
▪ WAULT: 4.3 years
▪ Energy Label: B
▪ Acquisition price: €45.0m
Parnassusweg 101, Amsterdam
Execution – reinvesting proceeds
NSI interim results 2017 I 11
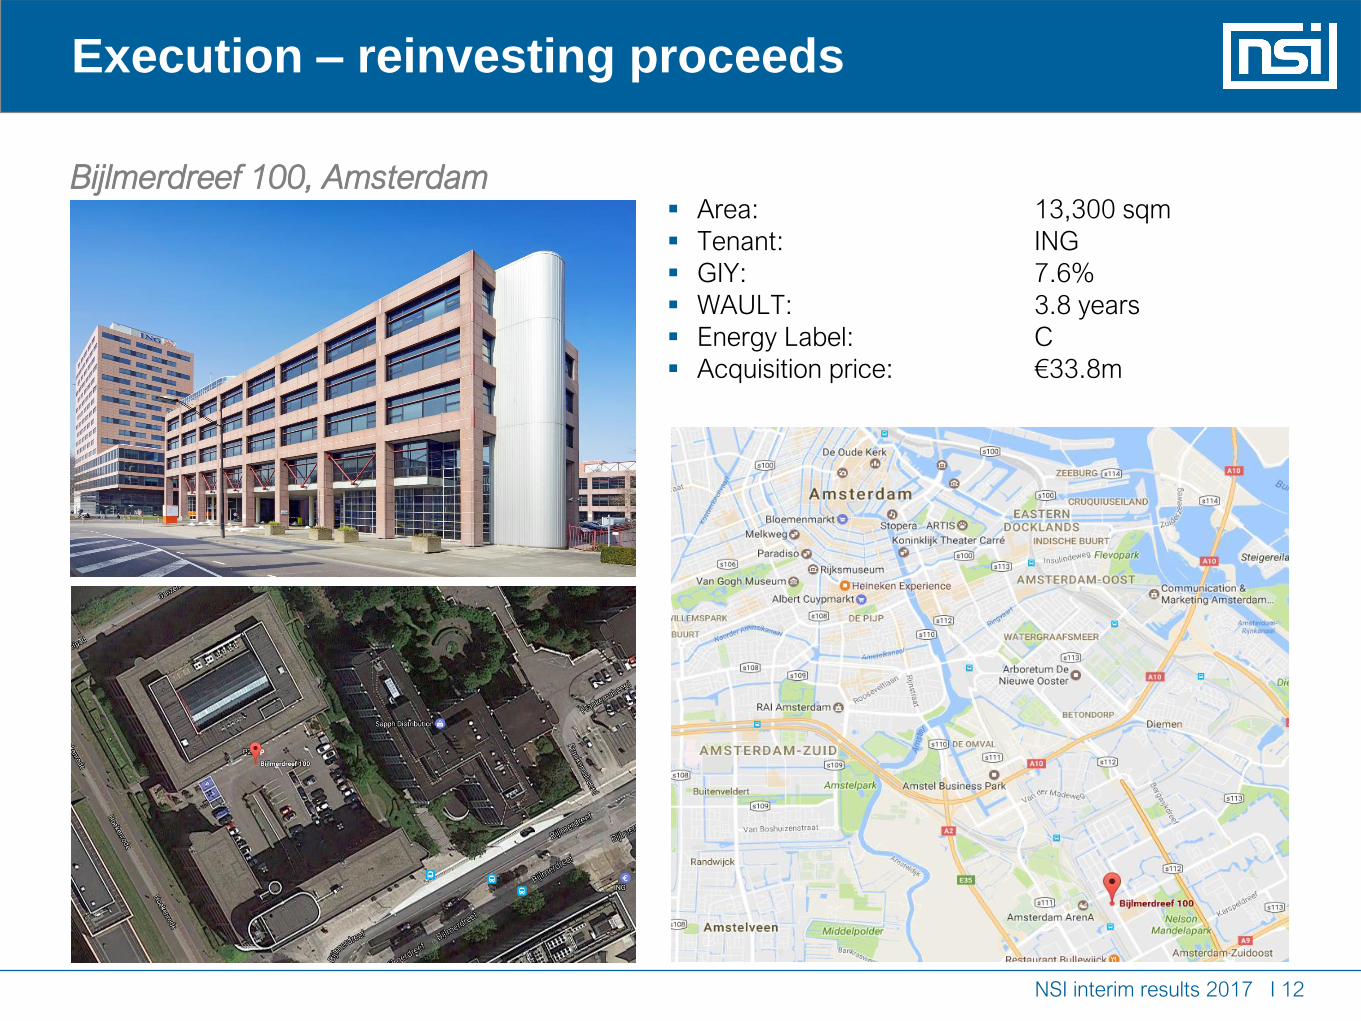
▪ Area: 13,300 sqm
▪ Tenant: ING
▪ GIY: 7.6%
▪ WAULT: 3.8 years
▪ Energy Label: C
▪ Acquisition price: €33.8m
Bijlmerdreef 100, Amsterdam
Execution – reinvesting proceeds
NSI interim results 2017 I 12
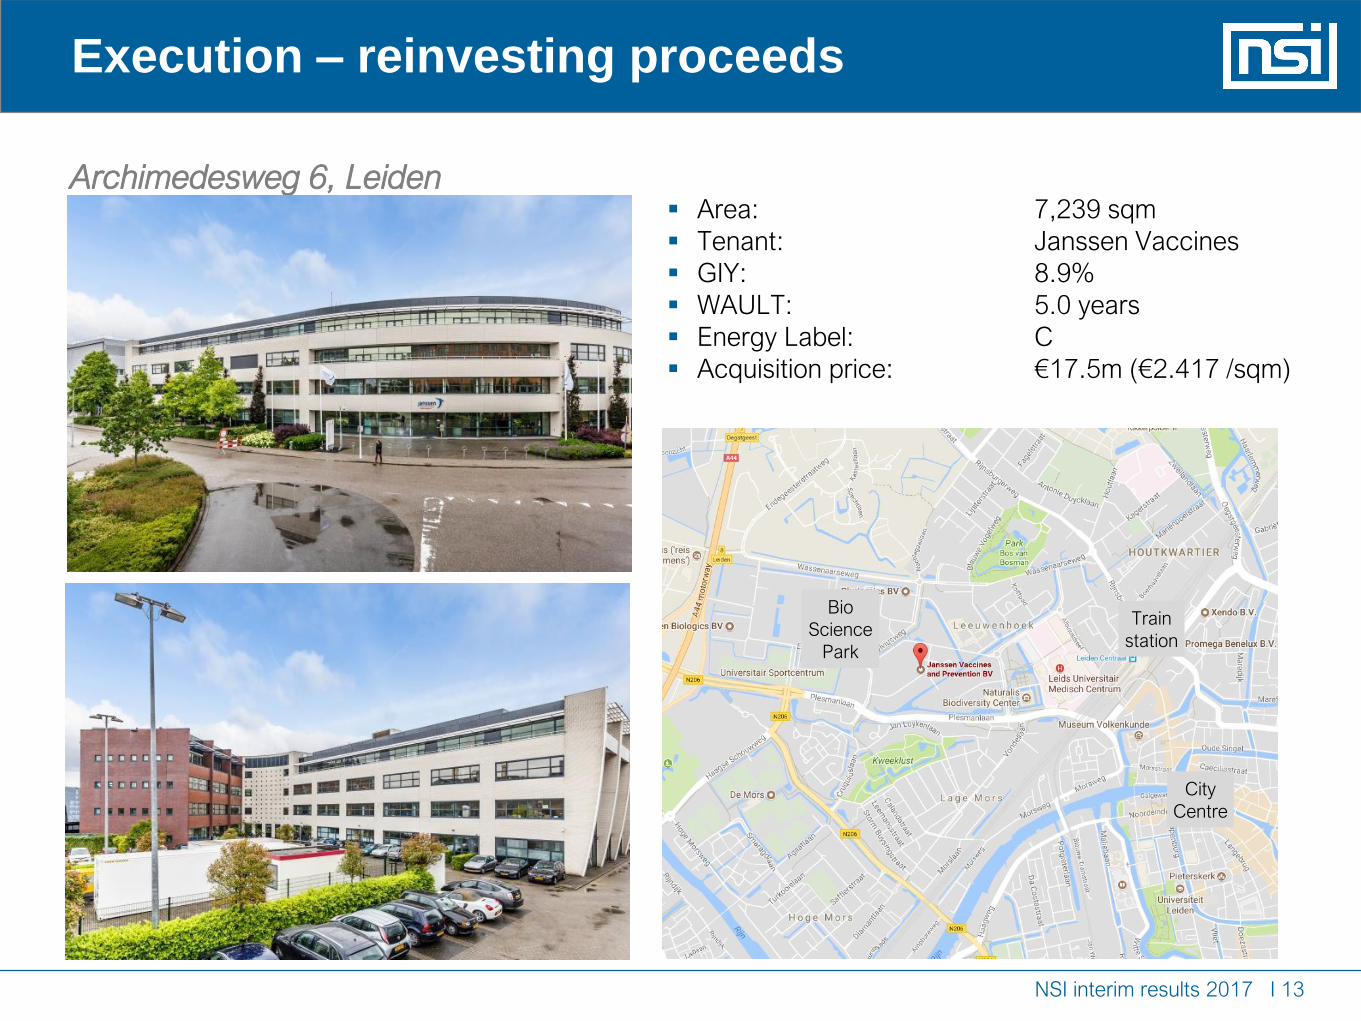
▪ Area: 7,239 sqm
▪ Tenant: Janssen Vaccines
▪ GIY: 8.9%
▪ WAULT: 5.0 years
▪ Energy Label: C
▪ Acquisition price: €17.5m (€2.417 /sqm)
Archimedesweg 6, Leiden
Execution – reinvesting proceeds
Train
station
City
Centre
Bio
Science
Park
NSI interim results 2017 I 13
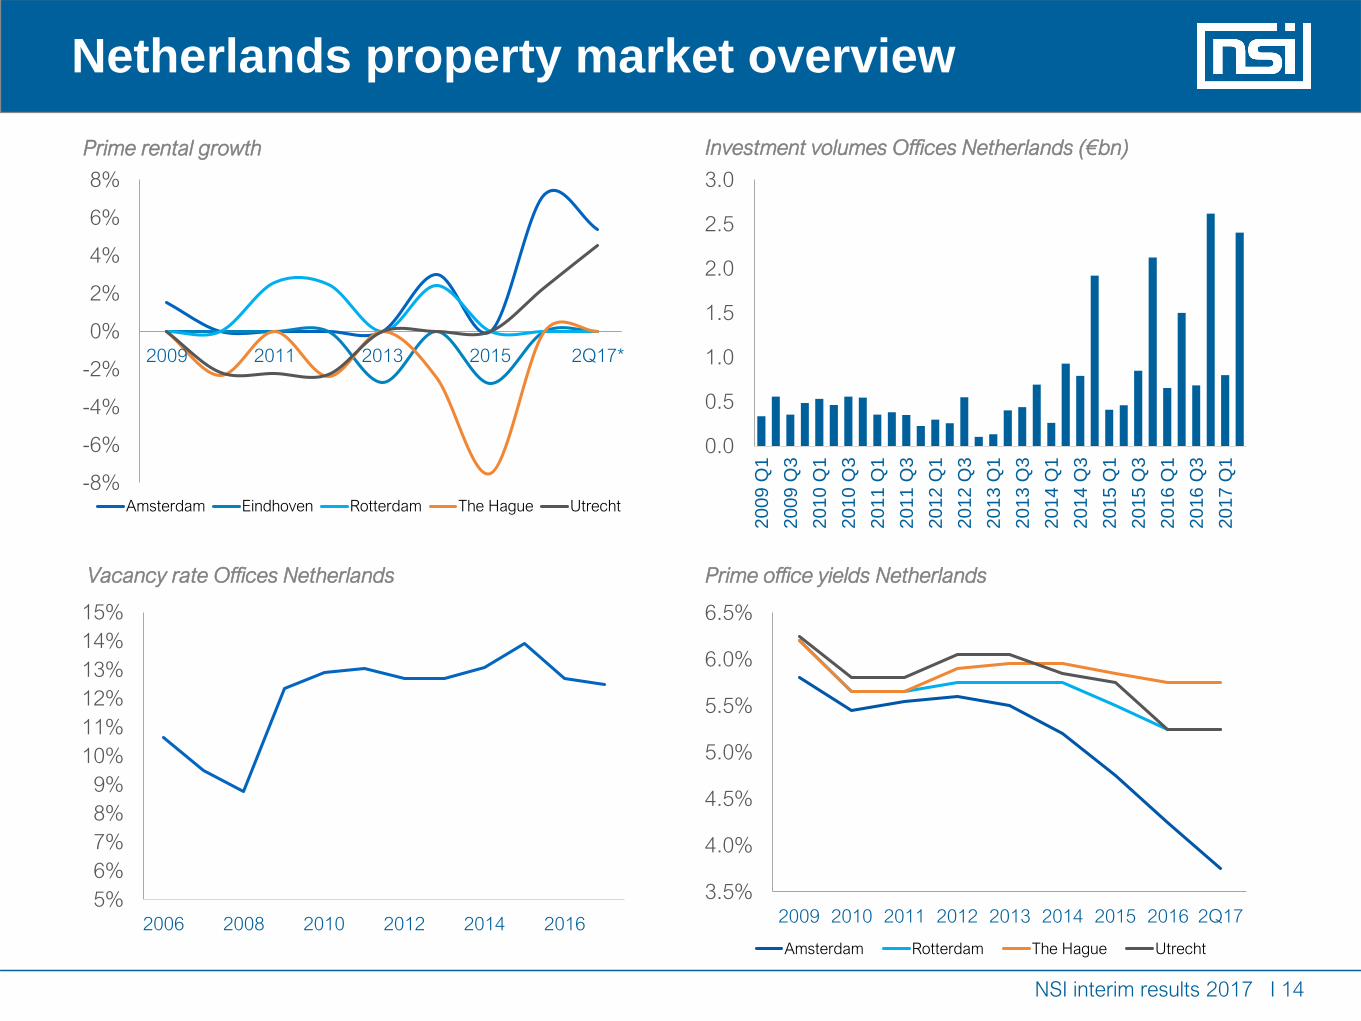
Netherlands property market overview
NSI interim results 2017 I 14
0.0
0.5
1.0
1.5
2.0
2.5
3.0
20
09
Q1
20
09
Q3
20
10
Q1
20
10
Q3
20
11
Q1
20
11
Q3
20
12
Q1
20
12
Q3
20
13
Q1
20
13
Q3
20
14
Q1
20
14
Q3
20
15
Q1
20
15
Q3
20
16
Q1
20
16
Q3
20
17
Q1
Investment volumes Offices Netherlands (€bn)
Prime office yields Netherlands
-8%
-6%
-4%
-2%
0%
2%
4%
6%
8%
2009 2011 2013 2015 2Q17*
Amsterdam Eindhoven Rotterdam The Hague Utrecht
3.5%
4.0%
4.5%
5.0%
5.5%
6.0%
6.5%
2009 2010 2011 2012 2013 2014 2015 2016 2Q17
Amsterdam Rotterdam The Hague Utrecht
Prime rental growth
5%
6%
7%
8%
9%
10%
11%
12%
13%
14%
15%
2006 2008 2010 2012 2014 2016
Vacancy rate Offices Netherlands
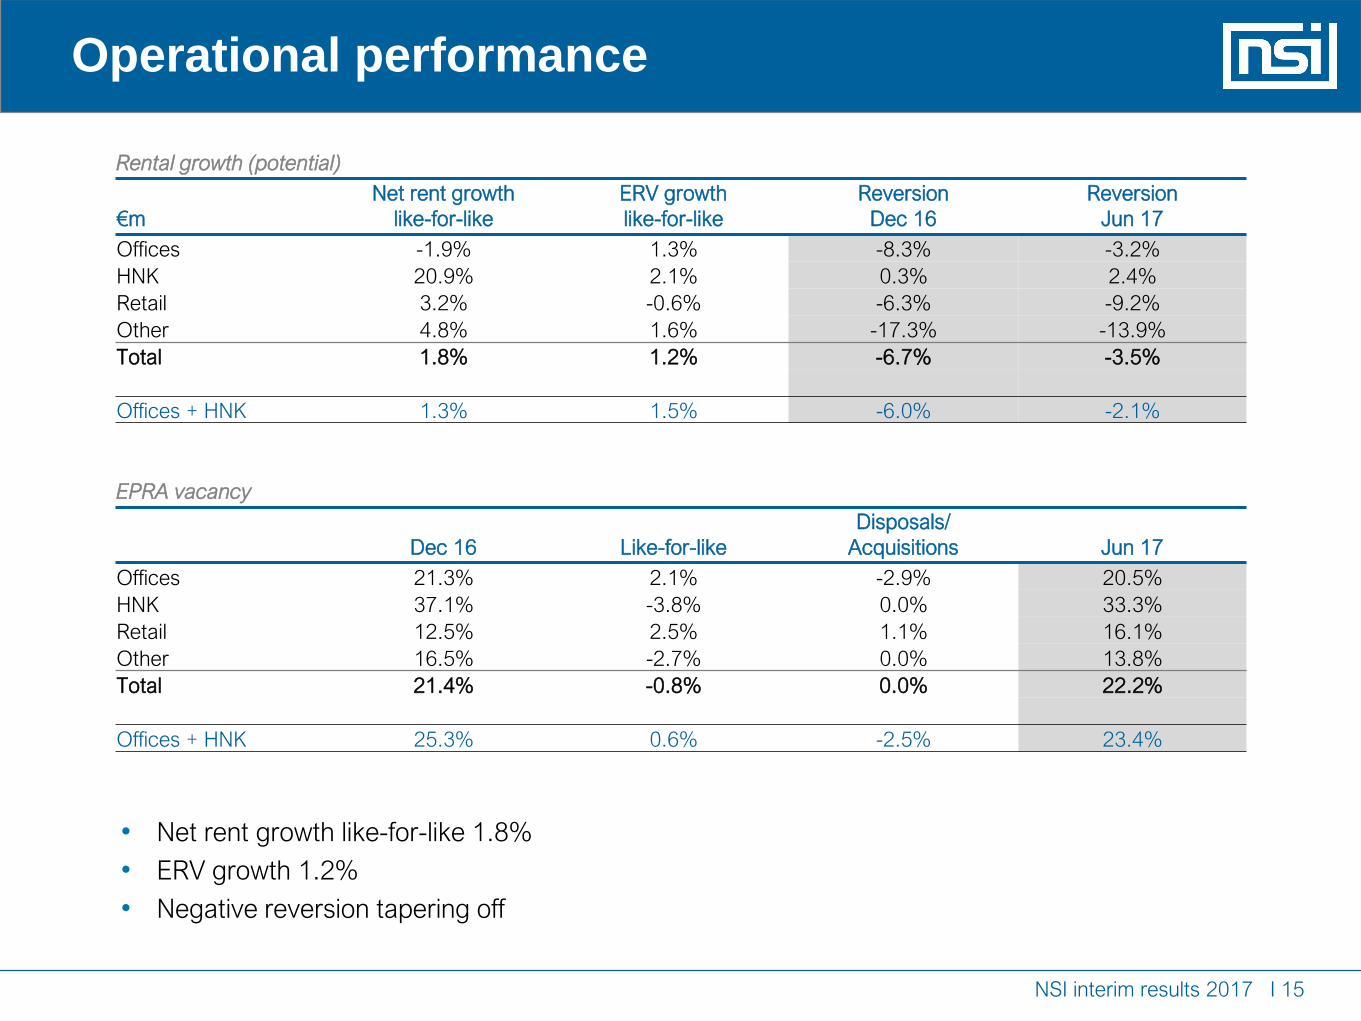
Operational performance
Rental growth (potential)
€m
Net rent growth
like-for-like
ERV growth
like-for-like
Reversion
Dec 16
Reversion
Jun 17
Offices -1.9% 1.3% -8.3% -3.2%
HNK 20.9% 2.1% 0.3% 2.4%
Retail 3.2% -0.6% -6.3% -9.2%
Other 4.8% 1.6% -17.3% -13.9%
Total 1.8% 1.2% -6.7% -3.5%
Offices + HNK 1.3% 1.5% -6.0% -2.1%
EPRA vacancy
Dec 16 Like-for-like
Disposals/
Acquisitions Jun 17
Offices 21.3% 2.1% -2.9% 20.5%
HNK 37.1% -3.8% 0.0% 33.3%
Retail 12.5% 2.5% 1.1% 16.1%
Other 16.5% -2.7% 0.0% 13.8%
Total 21.4% -0.8% 0.0% 22.2%
Offices + HNK 25.3% 0.6% -2.5% 23.4%
• Net rent growth like-for-like 1.8%
• ERV growth 1.2%
• Negative reversion tapering off
NSI interim results 2017 I 15
0.6%0.6%
3.1%
-0.8%-2.9%
-40
-30
-20
-10
0
10
20
30
40
Total Office HNK Retail Others
Positive revaluation Negative revaluation
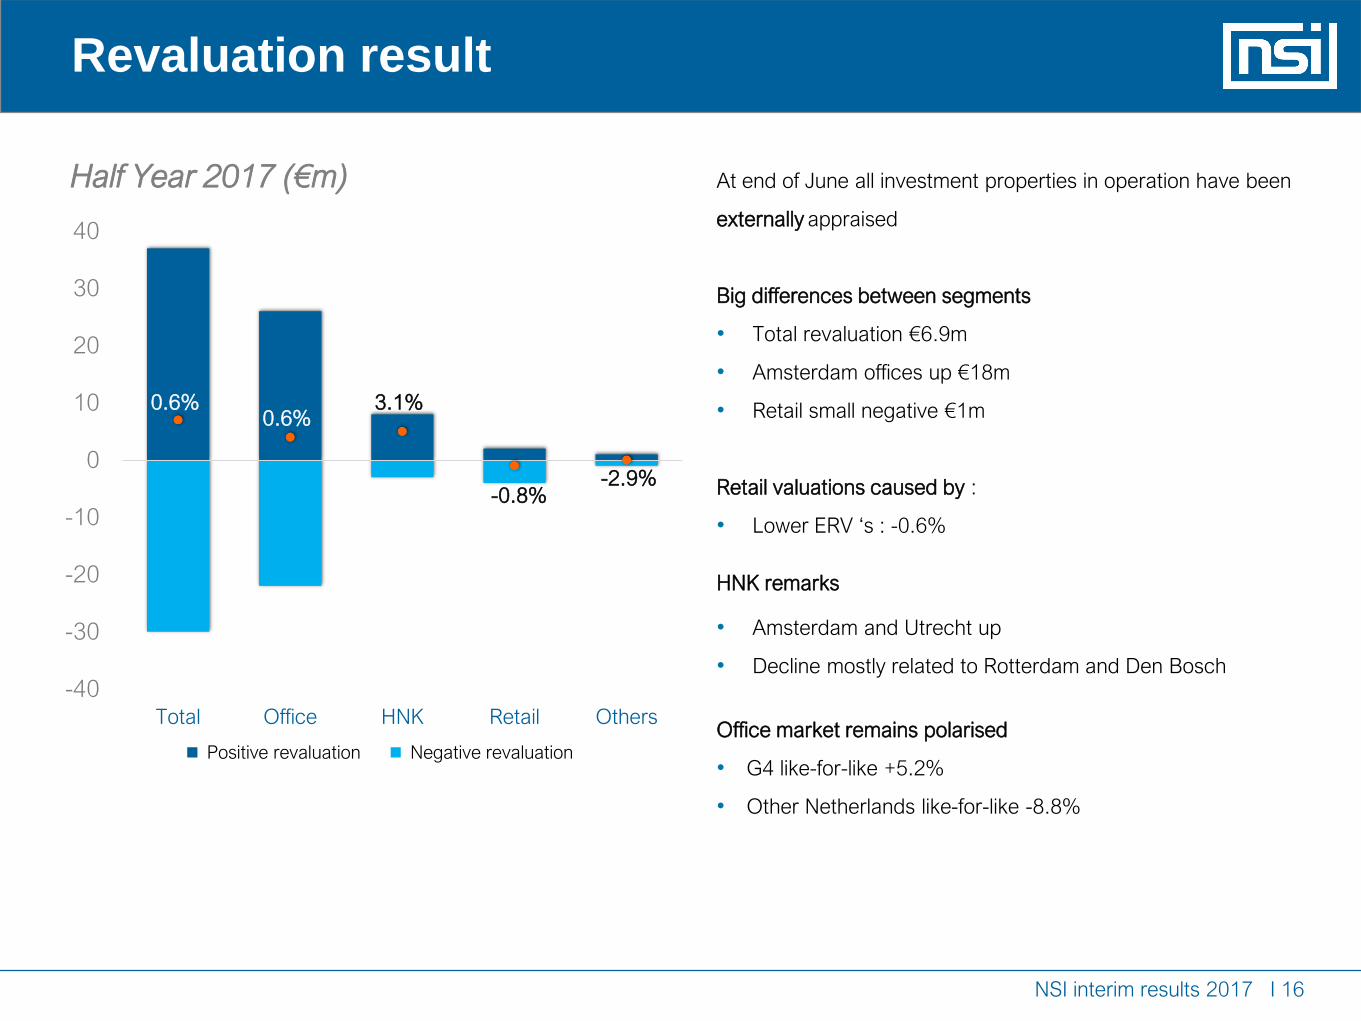
Half Year 2017 (€m)
Revaluation result
At end of June all investment properties in operation have been
externally appraised
Big differences between segments
• Total revaluation €6.9m
• Amsterdam offices up €18m
• Retail small negative €1m
Retail valuations caused by :
• Lower ERV ‘s : -0.6%
HNK remarks
• Amsterdam and Utrecht up
• Decline mostly related to Rotterdam and Den Bosch
Office market remains polarised
• G4 like-for-like +5.2%
• Other Netherlands like-for-like -8.8%
NSI interim results 2017 I 16
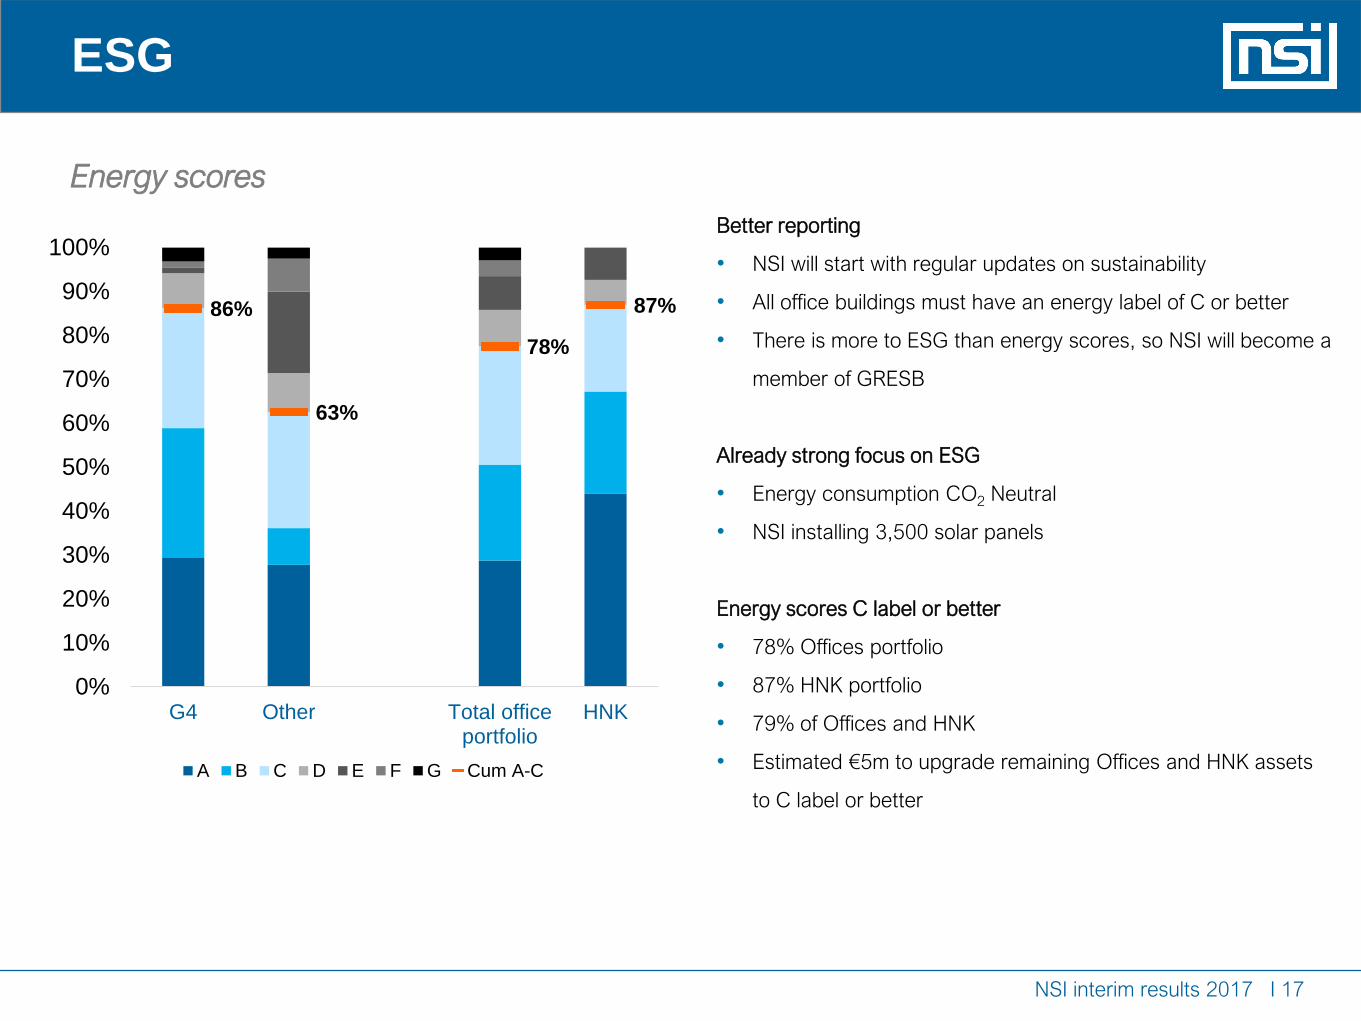
Energy scores
ESG
Better reporting
• NSI will start with regular updates on sustainability
• All office buildings must have an energy label of C or better
• There is more to ESG than energy scores, so NSI will become a
member of GRESB
Already strong focus on ESG
• Energy consumption CO2 Neutral
• NSI installing 3,500 solar panels
Energy scores C label or better
• 78% Offices portfolio
• 87% HNK portfolio
• 79% of Offices and HNK
• Estimated €5m to upgrade remaining Offices and HNK assets
to C label or better
NSI interim results 2017 I 17
86%
63%
78%
87%
0%
10%
20%
30%
40%
50%
60%
70%
80%
90%
100%
G4 Other Total officeportfolio
HNK
A B C D E F G Cum A-C

Financials
EPRA Earnings
1.11
1.35
-0.01
-0.03
0.06
0.09 0.01
0.12
1.00
1.05
1.10
1.15
1.20
1.25
1.30
1.35
1.40
1.45
1.50
EP
RA
EP
S
H1
20
16
Gro
ss
ren
tal
inco
me
Se
rvic
e c
osts
no
t re
ch
arg
ed
Op
era
tin
g
co
sts
Ad
min
istr
ative
co
sts
Ne
t fin
an
cin
g
resu
lt Oth
er
EP
RA
EP
S
H1
20
17
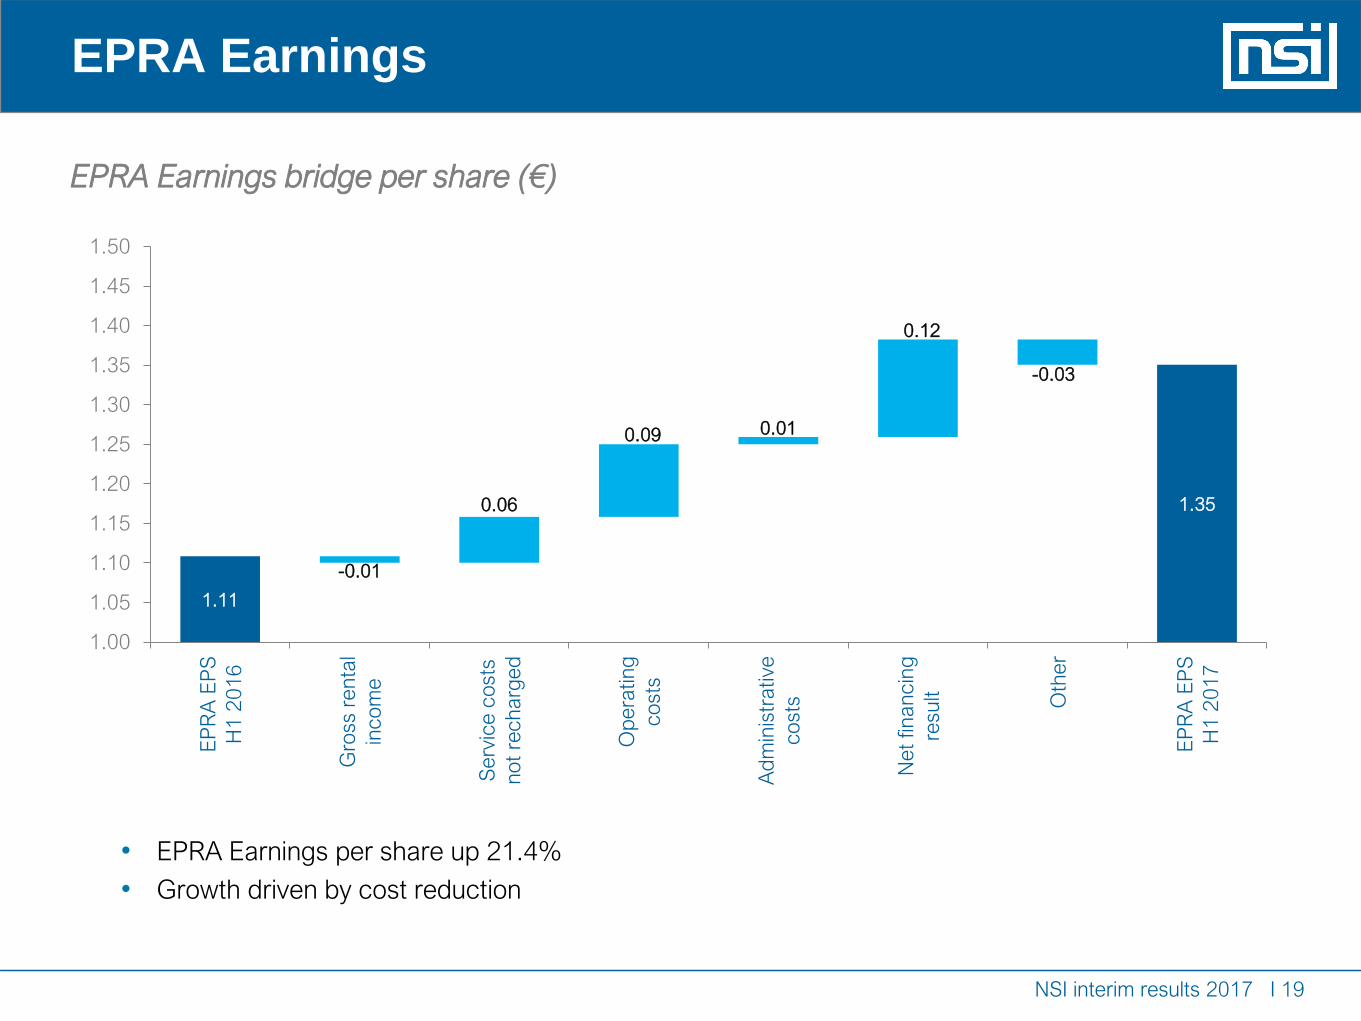
EPRA Earnings bridge per share (€)
NSI interim results 2017 I 19
• EPRA Earnings per share up 21.4%
• Growth driven by cost reduction
EPRA Earnings
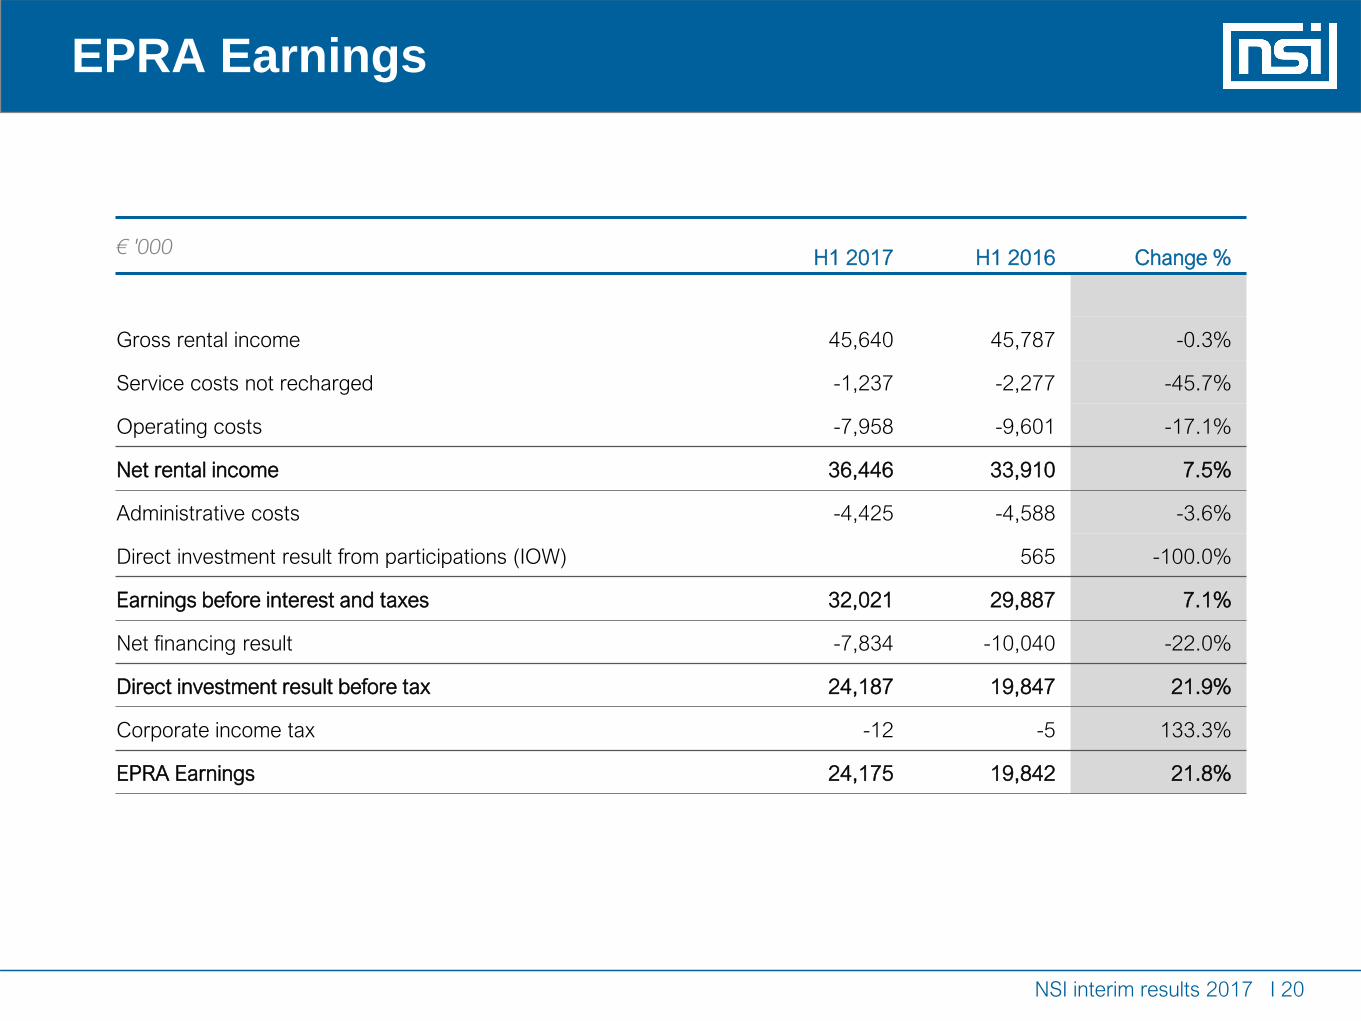
€ '000H1 2017 H1 2016 Change %
Gross rental income 45,640 45,787 -0.3%
Service costs not recharged -1,237 -2,277 -45.7%
Operating costs -7,958 -9,601 -17.1%
Net rental income 36,446 33,910 7.5%
Administrative costs -4,425 -4,588 -3.6%
Direct investment result from participations (IOW) 565 -100.0%
Earnings before interest and taxes 32,021 29,887 7.1%
Net financing result -7,834 -10,040 -22.0%
Direct investment result before tax 24,187 19,847 21.9%
Corporate income tax -12 -5 133.3%
EPRA Earnings 24,175 19,842 21.8%
NSI interim results 2017 I 20
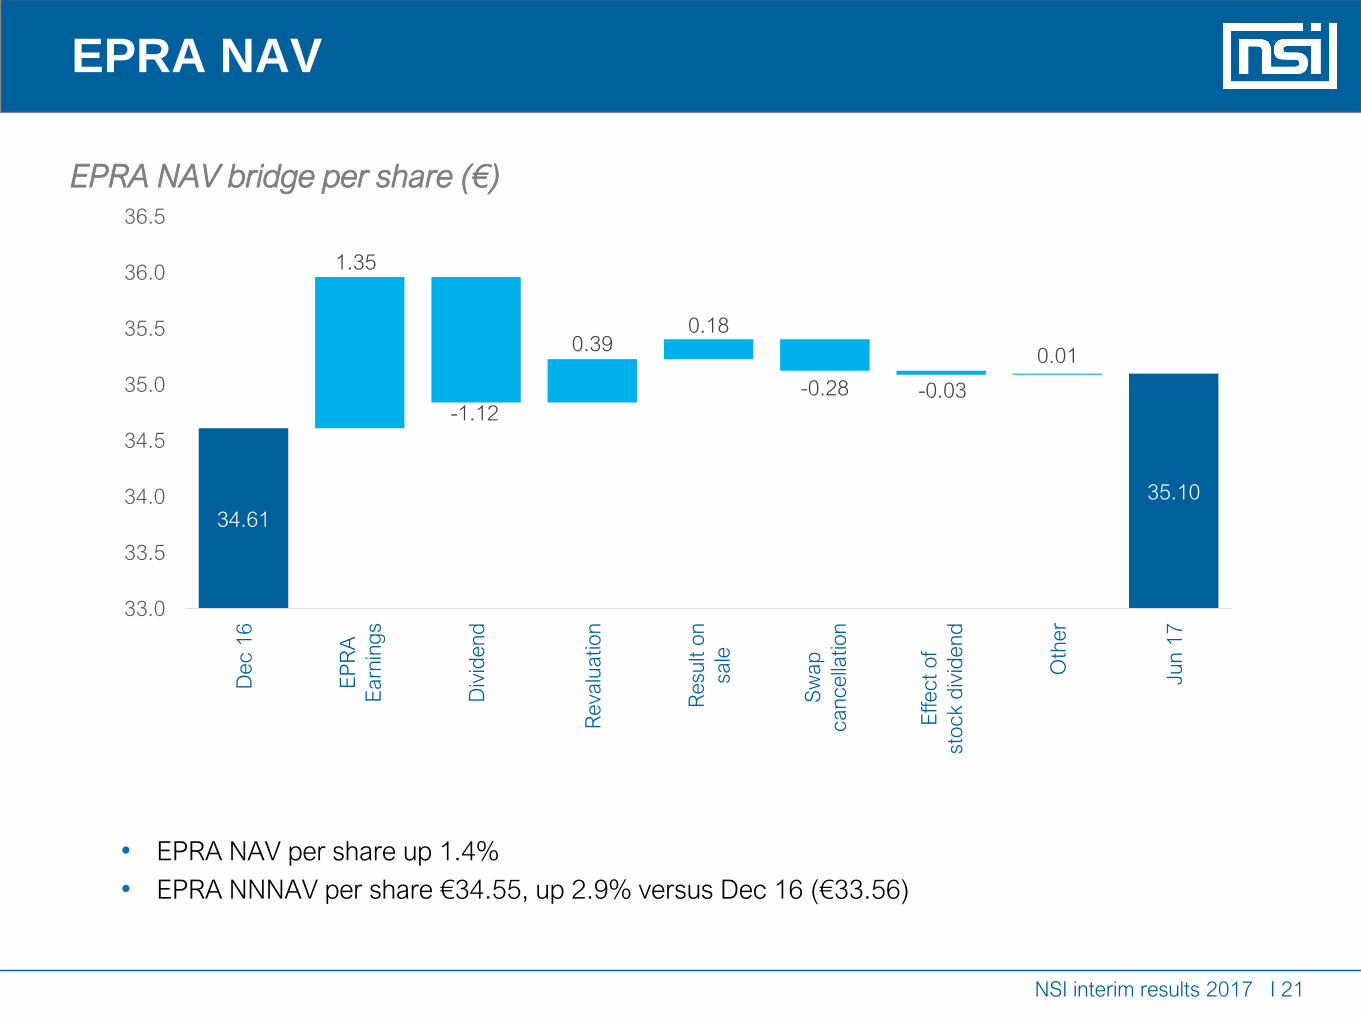
EPRA NAV
EPRA NAV bridge per share (€)
NSI interim results 2017 I 21
• EPRA NAV per share up 1.4%
• EPRA NNNAV per share €34.55, up 2.9% versus Dec 16 (€33.56)
34.61
35.10
-1.12
-0.28 -0.03
1.35
0.390.18
0.01
33.0
33.5
34.0
34.5
35.0
35.5
36.0
36.5
De
c 1
6
EP
RA
Ea
rnin
gs
Div
ide
nd
Re
va
lua
tio
n
Re
sult o
n
sa
le
Sw
ap
ca
nce
llatio
n
Effe
ct
of
sto
ck d
ivid
en
d
Oth
er
Ju
n 1
7
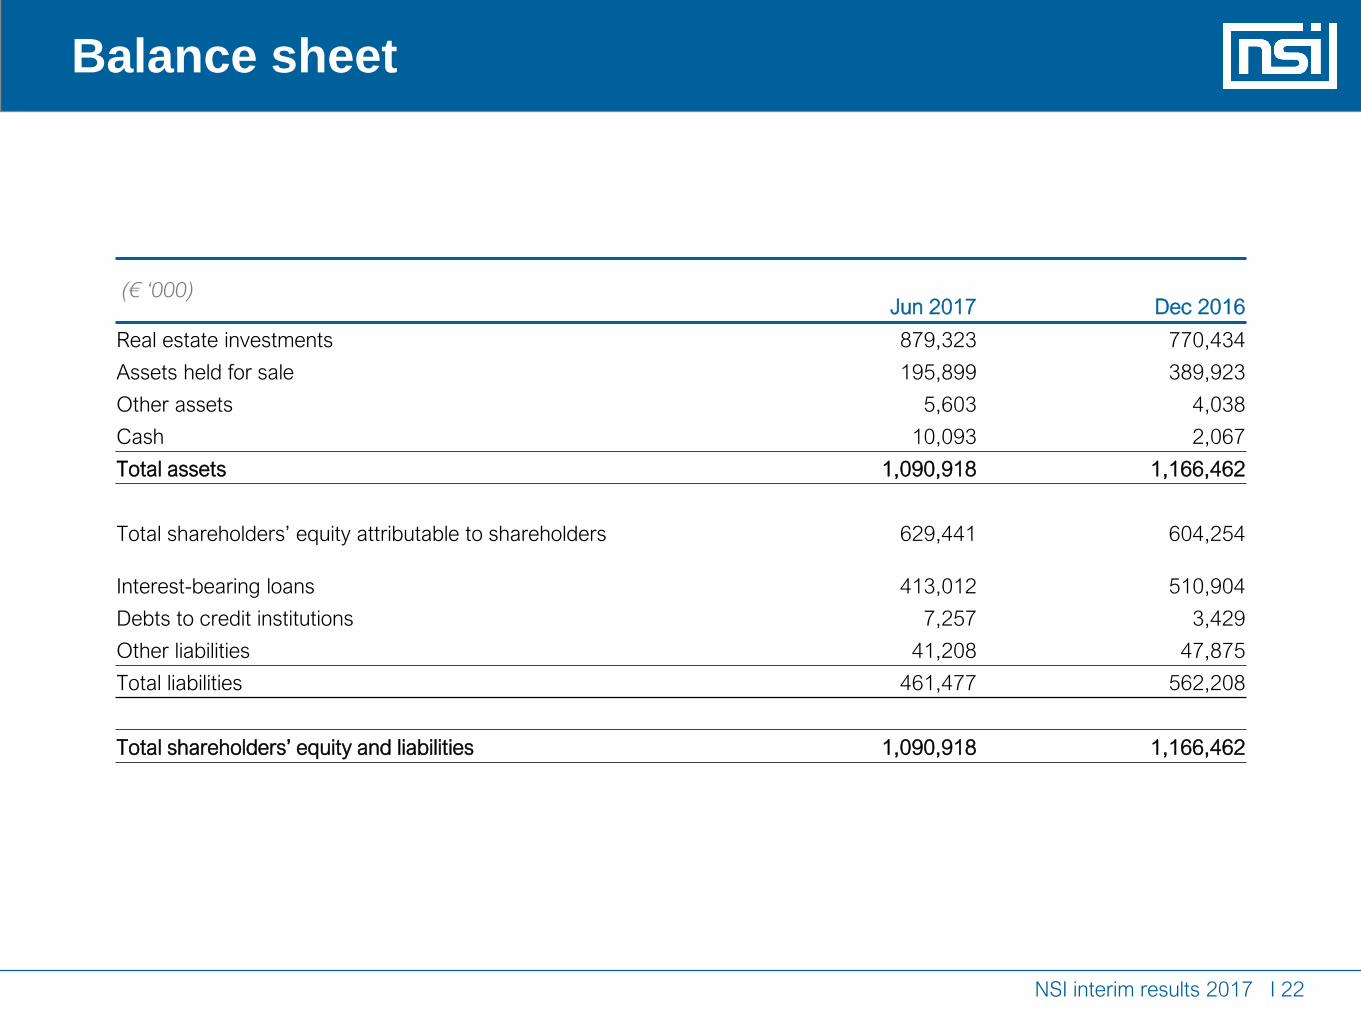
Balance sheet
(€ ‘000)Jun 2017 Dec 2016
Real estate investments 879,323 770,434
Assets held for sale 195,899 389,923
Other assets 5,603 4,038
Cash 10,093 2,067
Total assets 1,090,918 1,166,462
Total shareholders’ equity attributable to shareholders 629,441 604,254
Interest-bearing loans 413,012 510,904
Debts to credit institutions 7,257 3,429
Other liabilities 41,208 47,875
Total liabilities 461,477 562,208
Total shareholders’ equity and liabilities 1,090,918 1,166,462
NSI interim results 2017 I 22
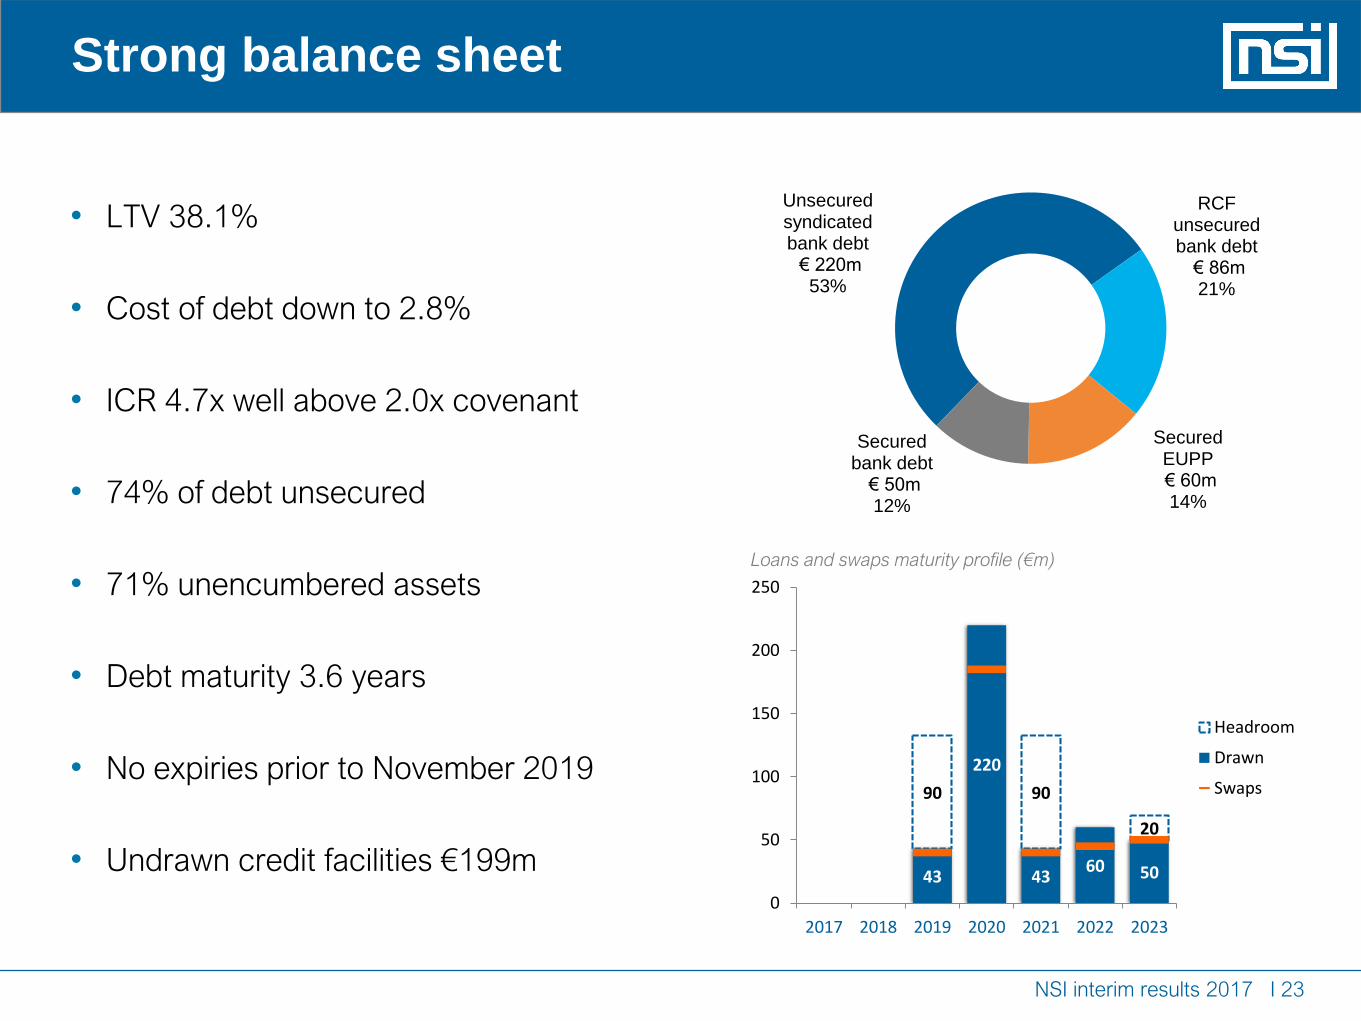
43
220
4360 50
90 90
20
0
50
100
150
200
250
2017 2018 2019 2020 2021 2022 2023
Headroom
Drawn
Swaps
Unsecured syndicated bank debt
€ 220m53%
RCF unsecured bank debt
€ 86m21%
Secured EUPP€ 60m14%
Secured bank debt
€ 50m12%
Strong balance sheet
• LTV 38.1%
• Cost of debt down to 2.8%
• ICR 4.7x well above 2.0x covenant
• 74% of debt unsecured
• 71% unencumbered assets
• Debt maturity 3.6 years
• No expiries prior to November 2019
• Undrawn credit facilities €199m
Loans and swaps maturity profile (€m)
NSI interim results 2017 I 23

Final remarks
• Disposal of retail assets
• Further asset rotation in offices
• Continued focus on costs
• Identifying value-add opportunities for 2018/2019
• 2017 EPS guidance of 2.52-2.55
Final remarks
NSI interim results 2017 I 25


![NSI Newsletter - March 2016 › Newsletter › NSI Newsletter - March 2016.pdfNSI Newsletter [ 3 ] Secretary’s Message Obituary NSI mourns the sad, untimely demise of a young upcoming](https://static.documents.pub/doc/80x56/5f2689493896984d0e36119a/nsi-newsletter-march-a-newsletter-a-nsi-newsletter-march-2016pdf-nsi-newsletter.jpg)


