36
John Laing Infrastructure Fund Interim Results Presentation September 2016

John Laing Infrastructure Fund
Interim Results Presentation
September 2016

Disclaimer
2
Nothing in this document or in any accompanying management discussion of this document constitutes, nor is it intended to constitute: (i) an invitation or inducement to engage in any investment activity, whether in the United Kingdom, the United States or in any other jurisdiction; (ii) any recommendation or advice in respect of the shares ("Shares") in John Laing Infrastructure Fund Limited ("JLIF"); or (iii) any offer for the sale, purchase or subscription of any Shares. This document does not constitute an offer to sell to or solicitation of an offer to purchase from any investor or in any jurisdiction in which such an offer or solicitation is not permitted or would be unlawful. Each investor must comply with all legal requirements in each jurisdiction in which it purchases, offers or sells JLIF’s securities, and must obtain any consent, approval or permission required by it.
This document has not been approved by a person authorised under the Financial Services & Markets Act 2000 ("FSMA") for the purposes of section 21 FSMA. This document is limited to and intended for distribution in the United Kingdom only to persons who (i) are qualified investors (within the meaning of the Prospectus Directive 2003/71/EC) and (ii) who have professional experience in matters relating to investments who fall within the definition of "investment professionals" in Article 19(5) of the Financial Services and Markets Act 2000 (Financial Promotion) Order 2005 (the "FPO") and/or to high net worth bodies corporate, unincorporated associations and partnerships and trustees of high value trusts as described in Article 49(2)(a) to (d) of the FPO or to those persons to whom it may otherwise be lawfully communicated. The recipients of this document should not engage in any behaviour in relation to qualifying investments or related investments (as defined in FSMA and the Code of Market Conduct made pursuant to FSMA) which would or might amount to market abuse for the purposes of FSMA.
Although JLIF has attempted to ensure the contents of this document are accurate in all material respects, no representation or warranty, express or implied, is made as to, and no reliance should be placed on, the fairness, accuracy, completeness or correctness of the information, or opinions contained herein. All data is sourced by JLIF unless identified as otherwise. Neither JLIF, its investment adviser John Laing Capital Management Limited ("JLCM"), nor any of JLIF's advisors or representatives shall have any responsibility or liability whatsoever (for negligence or otherwise) for any loss howsoever arising from any use of this document or its contents or otherwise arising in connection with this document. Nothing in this paragraph shall exclude, however, liability for any representation or warranty made fraudulently. The information set out herein may be subject to updating, completion, revision, verification and amendment and such information may change materially.
The information communicated in this document contains certain statements that are or may be forward-looking. These statements typically contain words such as "expects" and "anticipates" and words of similar import. By their nature forward-looking statements involve risk and uncertainty because they relate to events and depend on circumstances that may occur in the future. JLIF and its advisors and representatives expressly disclaim any obligation or undertaking to disseminate any updates or revisions to any forward-looking statements contained herein to reflect any change in their expectations with regard thereto or any change in events, conditions or circumstances on which any such statement is based.
Where reference has been made to past performance, it is worth noting that past performance is not a guide to future performance and the value of any investment or the income derived from it may go down as well as up and you may not get back the full amount originally invested. Some assets within JLIF may be denominated in a foreign currency and will be exposed to movements in the rates of exchange. JLIF will also be exposed to changes in the rates of interest, these movements may have an adverse effect on the value of the investment or the income derived from it.
This document and the information contained herein, are not for publication or distribution, directly or indirectly, in any jurisdiction where its publication or distribution would breach any applicable law or regulation except in compliance with applicable securities laws. JLCM is acting only for JLIF and is not acting for any other person (a "third party"). JLCM will not be responsible to a third party for providing the protections afforded to clients of JLCM and will not be advising a third party on investing in JLIF.

John Laing Infrastructure Fund
Summary

Summary – six months to 30 June 2016
Portfolio growth of £39.4m to £1,038.1 million on a rebased Portfolio Value of £998.7 million
– Underlying portfolio growth of 3.95%
– £3.6m ahead of growth expected from unwind of discount rate
Completed acquisitions totalling £178.6 million in the period (further €62.5 million in July)
Disposal of two investments for £43.4 million
– An uplift of c.36% on their carrying value as at 31 March 2016
– Generating an aggregate realised IRR of approximately 16%
Net Asset Value of £1,022.2 million
– NAV per share of 113.8 pence, up 5.0% against that as at 31 December 2015
– In addition, dividend of 3.41 pence per share paid in May
Declared a dividend of 3.41 pence per share, payable in October
Some operational issues at a few UK projects
4

Fund Characteristics
5
Portfolio 60 operational assets Active market for third party asset purchases Access to buy future John Laing assets as they mature
Size Current market cap c.£1,207.3m (8 September 2016)
Dividends Dividend maintained at 3.41pps for H1 2016 Dividend yield of 5.1% (8 September 2016)
Limits Single asset limit of 25% UK assets to exceed 50% (72.0% as at 30 June) Demand based assets < 15% (7.1% as at 30 June) Construction assets < 30% (0% as at 30 June) Infrastructure assets non-PPP/PFI < 10% (0% as at 30 June)
Gearing of Fund Up to a maximum 25% of Total Assets £180m revolving credit facility, matures August 2020, currently drawn by £92.5m1
£150m accordion facility, matures June 2019, currently undrawn Margin on both facilities of 1.75% over LIBOR
Management contract John Laing Capital Management Ltd, FCA authorised and regulated Base fee 1.1% up to £500m, 1.0% for £500m-£1.0bn, and 0.9% for over £1.0bn No acquisition fee for assets from John Laing
Ongoing charges (FY15) 1.24% (ongoing charges AIC methodology)
New investment fee 0.75% on new investments (excluding John Laing assets), no performance fees
NAV per share 113.8p at 30 June 2016
Discount Rate 7.85% weighted average (range of 7.11-10.00%) as at 30 June 2016
1 As at 12 September 2016, the facility was drawn £41.0m and €63.0m (translated at a rate of 1.223 in the £92.5m above)
80
90
100
110
120
130
140
150
JLIF share price FTSE All Share
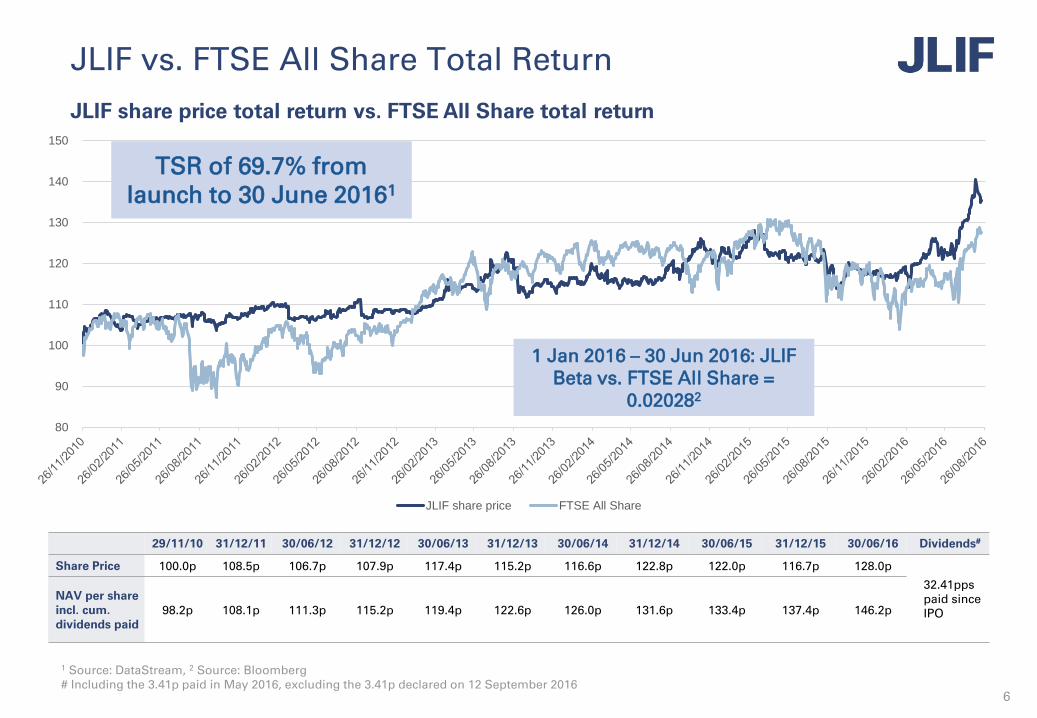
JLIF vs. FTSE All Share Total Return
JLIF share price total return vs. FTSE All Share total return
6
1 Source: DataStream, 2 Source: Bloomberg# Including the 3.41p paid in May 2016, excluding the 3.41p declared on 12 September 2016
TSR of 69.7% from launch to 30 June 20161
29/11/10 31/12/11 30/06/12 31/12/12 30/06/13 31/12/13 30/06/14 31/12/14 30/06/15 31/12/15 30/06/16 Dividends#
Share Price 100.0p 108.5p 106.7p 107.9p 117.4p 115.2p 116.6p 122.8p 122.0p 116.7p 128.0p
32.41pps paid since IPO
NAV per share incl. cum. dividends paid
98.2p 108.1p 111.3p 115.2p 119.4p 122.6p 126.0p 131.6p 133.4p 137.4p 146.2p
1 Jan 2016 – 30 Jun 2016: JLIF Beta vs. FTSE All Share =
0.020282
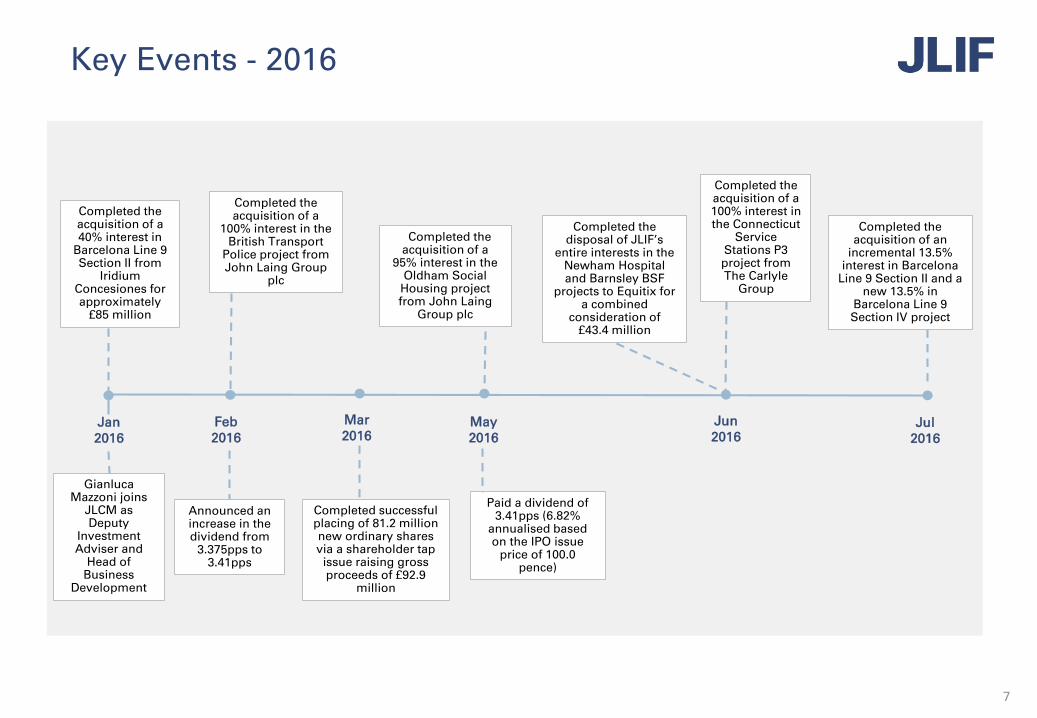
Key Events - 2016
7
Completed the acquisition of a
95% interest in the Oldham Social
Housing project from John Laing
Group plc
Completed the acquisition of a
100% interest in the British Transport
Police project from John Laing Group
plc
Jan 2016
Jul2016
Completed the acquisition of a 40% interest in
Barcelona Line 9 Section II from
Iridium Concesiones for approximately
£85 million
Completed successful placing of 81.2 million new ordinary shares via a shareholder tap issue raising gross proceeds of £92.9
million
Announced an increase in the dividend from
3.375pps to 3.41pps
Feb 2016
Mar 2016
May 2016
Jun 2016
Paid a dividend of 3.41pps (6.82%
annualised based on the IPO issue
price of 100.0 pence)
Completed the disposal of JLIF’s
entire interests in the Newham Hospital and Barnsley BSF
projects to Equitix for a combined
consideration of £43.4 million
Completed the acquisition of a 100% interest in the Connecticut
Service Stations P3 project from The Carlyle
Group
Completed the acquisition of an
incremental 13.5% interest in Barcelona
Line 9 Section II and a new 13.5% in
Barcelona Line 9 Section IV project
Gianluca Mazzoni joins
JLCM as Deputy
Investment Adviser and
Head of Business
Development

John Laing Infrastructure Fund
Portfolio
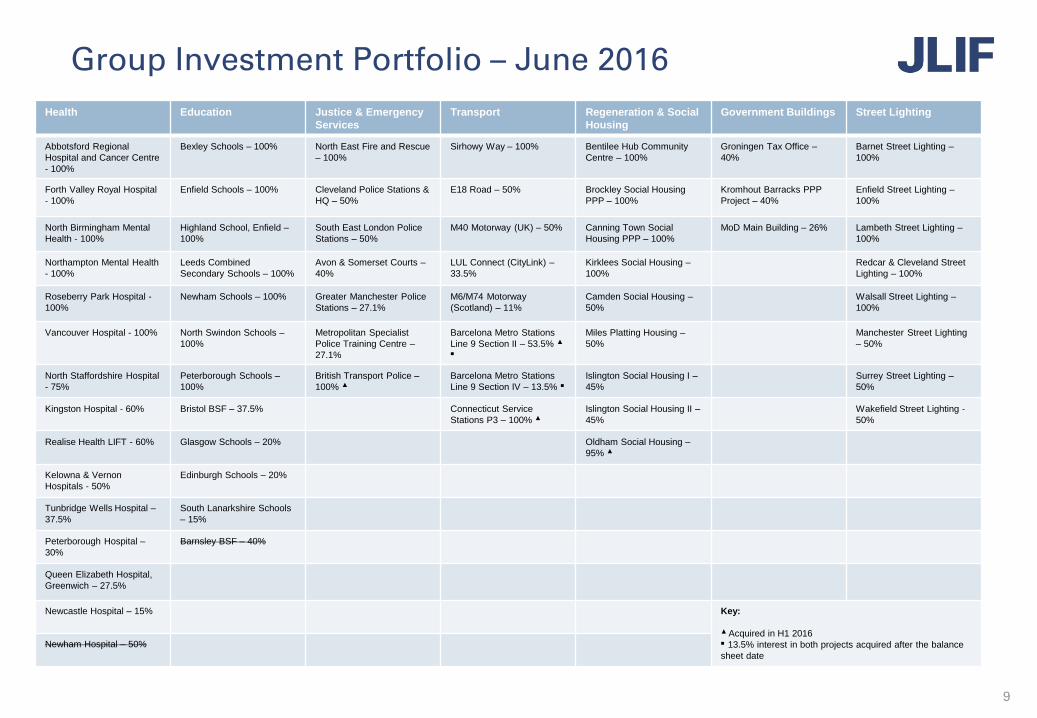
Group Investment Portfolio – June 2016
9
Health Education Justice & Emergency
Services
Transport Regeneration & Social
Housing
Government Buildings Street Lighting
Abbotsford Regional
Hospital and Cancer Centre
- 100%
Bexley Schools – 100% North East Fire and Rescue
– 100%
Sirhowy Way – 100% Bentilee Hub Community
Centre – 100%
Groningen Tax Office –
40%
Barnet Street Lighting –
100%
Forth Valley Royal Hospital
- 100%
Enfield Schools – 100% Cleveland Police Stations &
HQ – 50%
E18 Road – 50% Brockley Social Housing
PPP – 100%
Kromhout Barracks PPP
Project – 40%
Enfield Street Lighting –
100%
North Birmingham Mental
Health - 100%
Highland School, Enfield –
100%
South East London Police
Stations – 50%
M40 Motorway (UK) – 50% Canning Town Social
Housing PPP – 100%
MoD Main Building – 26% Lambeth Street Lighting –
100%
Northampton Mental Health
- 100%
Leeds Combined
Secondary Schools – 100%
Avon & Somerset Courts –
40%
LUL Connect (CityLink) –
33.5%
Kirklees Social Housing –
100%
Redcar & Cleveland Street
Lighting – 100%
Roseberry Park Hospital -
100%
Newham Schools – 100% Greater Manchester Police
Stations – 27.1%
M6/M74 Motorway
(Scotland) – 11%
Camden Social Housing –
50%
Walsall Street Lighting –
100%
Vancouver Hospital - 100% North Swindon Schools –
100%
Metropolitan Specialist
Police Training Centre –
27.1%
Barcelona Metro Stations
Line 9 Section II – 53.5% ▲
■
Miles Platting Housing –
50%
Manchester Street Lighting
– 50%
North Staffordshire Hospital
- 75%
Peterborough Schools –
100%
British Transport Police –
100% ▲Barcelona Metro Stations
Line 9 Section IV – 13.5% ■Islington Social Housing I –
45%
Surrey Street Lighting –
50%
Kingston Hospital - 60% Bristol BSF – 37.5% Connecticut Service
Stations P3 – 100% ▲Islington Social Housing II –
45%
Wakefield Street Lighting -
50%
Realise Health LIFT - 60% Glasgow Schools – 20% Oldham Social Housing –
95% ▲
Kelowna & Vernon
Hospitals - 50%
Edinburgh Schools – 20%
Tunbridge Wells Hospital –
37.5%
South Lanarkshire Schools
– 15%
Peterborough Hospital –
30%
Barnsley BSF – 40%
Queen Elizabeth Hospital,
Greenwich – 27.5%
Newcastle Hospital – 15% Key:
▲Acquired in H1 2016■ 13.5% interest in both projects acquired after the balance
sheet date
Newham Hospital – 50%

Connecticut Service Stations P3
JLIF’s first US acquisition
Sterling-equivalent consideration of approximately £76.6 million
The renovation (completed in Aug 2015), operation and maintenance of 23 highway service stations, located between New York and Boston
Exclusive 35-year concession, with potential 10-year extension
100% interest acquired out of fund managed by The Carlyle Group on a bilateral-basis
Concession ends Dec 2044. Long term tenancy agreements (15-35 years) with major food and fuel providers
Just over half the US Dollars purchased pre-EU referendum vote
Demand-related revenues c.37% of total forecast revenues over the concession1
Debt refinanced at acquisition on 7-year term
USA
10
1 NPV basis
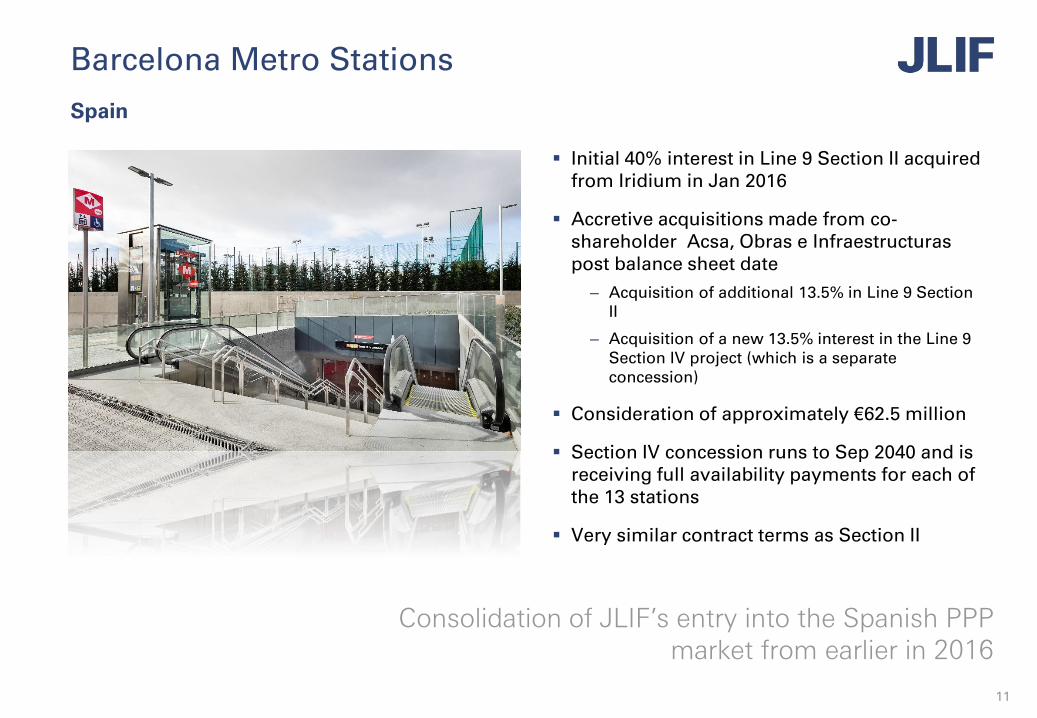
Barcelona Metro Stations
Initial 40% interest in Line 9 Section II acquired from Iridium in Jan 2016
Accretive acquisitions made from co-shareholder Acsa, Obras e Infraestructuras post balance sheet date
– Acquisition of additional 13.5% in Line 9 Section II
– Acquisition of a new 13.5% interest in the Line 9 Section IV project (which is a separate concession)
Consideration of approximately €62.5 million
Section IV concession runs to Sep 2040 and is receiving full availability payments for each of the 13 stations
Very similar contract terms as Section II
Consolidation of JLIF’s entry into the Spanish PPP market from earlier in 2016
Spain
11

John Laing Infrastructure Fund
Interim Results

Portfolio Valuation Movements – six months to 30 June 2016
13
£ 178.6 m
£ 19.2 m £ 25.4 m
£ 35.9 m
£ 3.6 m
(£ 43.4 m)
(£ 49.1 m)
£ 867.8 m
£ 998.7 m£ 1,038.1 m
500.0
600.0
700.0
800.0
900.0
1,000.0
1,100.0
PortfolioValuation 31
December 2015
Acquistions Disposals Distributions Growth due tochanges in
discount rates
Growth due toexchange rates
movements
RebasedPortfolio
valuation at 31December 2015
Growth fromdiscount rate
unwind
Growth fromvalue
enhancementsand other
movements
PortfolioValuation at 30
June 2016
£ m
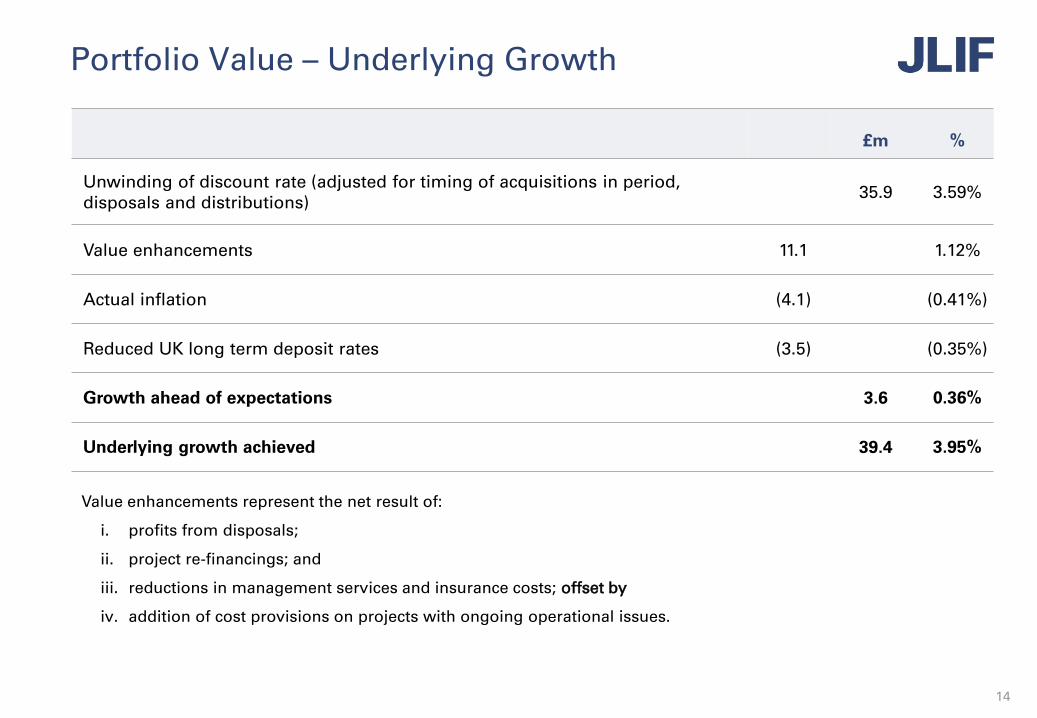
Portfolio Value – Underlying Growth
14
£m %
Unwinding of discount rate (adjusted for timing of acquisitions in period, disposals and distributions)
35.9 3.59%
Value enhancements 11.1 1.12%
Actual inflation (4.1) (0.41%)
Reduced UK long term deposit rates (3.5) (0.35%)
Growth ahead of expectations 3.6 0.36%
Underlying growth achieved 39.4 3.95%
Value enhancements represent the net result of:
i. profits from disposals;
ii. project re-financings; and
iii. reductions in management services and insurance costs; offset by
iv. addition of cost provisions on projects with ongoing operational issues.
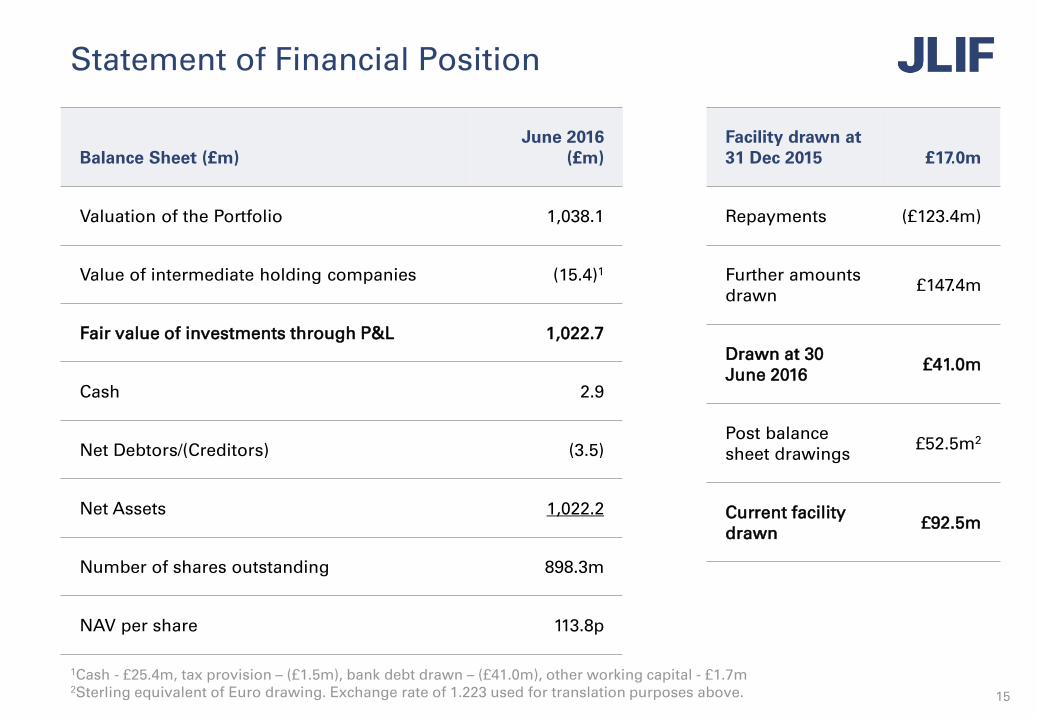
Statement of Financial Position
15
Balance Sheet (£m)June 2016
(£m)
Valuation of the Portfolio 1,038.1
Value of intermediate holding companies (15.4)1
Fair value of investments through P&L 1,022.7
Cash 2.9
Net Debtors/(Creditors) (3.5)
Net Assets 1,022.2
Number of shares outstanding 898.3m
NAV per share 113.8p
1Cash - £25.4m, tax provision – (£1.5m), bank debt drawn – (£41.0m), other working capital - £1.7m2Sterling equivalent of Euro drawing. Exchange rate of 1.223 used for translation purposes above.
Facility drawn at 31 Dec 2015 £17.0m
Repayments (£123.4m)
Further amounts drawn
£147.4m
Drawn at 30 June 2016
£41.0m
Post balance sheet drawings
£52.5m2
Current facility drawn
£92.5m

£m
Cash at 1 January 2016 33.8
Capital raising 92.9
Listing / share issue costs (1.1)
Acquisition of projects (178.6)
Acquisition costs (1.9)
Proceeds from divestments 43.4
Cash received from projects (net of withholding tax) 49.1
Administrative and other expenses (6.8)
Borrowings 24.0
Financing costs (net of interest income) (1.7)
Exchange rate gain on non-Sterling cash 0.2
Dividends paid to shareholders (25.0)
Cash at 30 June 2016 28.3
JLIF Group Cash Flow Summary
16

John Laing Infrastructure Fund
Portfolio Analysis

Geographic Breakdown
18
As at 30 June 2016
UK, 72.0% (Dec 2015: 87.5%)
North America, 15.6% (Dec 2015:
8.4%)
Continental Europe, 12.4%
(Dec 2015: 4.1%)

Sector Breakdown
19
As at 30 June 2016
Education, 11.7%
Government Buildings, 6.5%
UK Health, 26.8%
North American Health, 8.4%
Justice & Emergency Services, 5.6%
Regeneration & Social Housing, 10.4%
Street Lighting, 3.3%
Transport, 27.3%

Top 10 Assets
20
Average asset size as at 30 June 2016 - £17.5 million
As at 30 June 2016
Barcelona Metro Stations L9T2
9%Connecticut Service
Stations7%
Forth Valley Royal Hospital
7%
North Staffordshire Hospital
6%
Abbotsford Regional Hospital & Cancer
Centre5%
LUL Connect (CityLink)
5%Ministry of Defence
Main Building4%M40 Motorway
4%
Leeds Combined Secondary Schools
4%
Peterborough Hospital
2%
Other47%
% third party acquisitions by
value
Since launch (incl. IPO) 41%
Since launch (excl. IPO) 54%
2016 YTD 90%

Asset Breakdown
21
Average life as at 30 June 2016 19.5 years
1 A proportion of the income received by the SPV for the Connecticut Service Stations P3 project is variable, relating to retail and fuel sales. This project is therefore classified as being demand-based. 2 The Shadow toll mechanisms for the investments in the M40 and M6/M74 motorway projects are not regarded as carrying demand risk due to their relative insensitivity to traffic movement
Remaining Concession Length Shareholding
JLIF’s Portfolio is 100% operational
Payment Basis
20 to 30 years, 52.8%
10 to 20 years, 39.5%
Less than 10 years, 7.6%
0-50%, 35.8%
50-100%, 21.2%
100% ownership,
42.9%
Availability-based93%
Demand-based1
7%

John Laing Infrastructure Fund
Outlook

Outlook for JLIF
Existing portfolio
Contractual operations and income
Public sector counterparties continuing to look for ways to cut costs of PPP contracts
Visible pipeline – 3 years
First Offer Agreements with John Laing Group plc remain in place
– Access to a pipeline valued by John Laing at approximately £393 million1
– Approximately £312 million of which are rail assets2
Some co-shareholder opportunities
Tertiary and later sales
£130 million of assets in advanced discussions announced mid-May 2016 delayed indefinitely
Longer term growth
Active/growing markets with similar regimes in Australia, Canada and Continental Europe and USA
A presence established in the USA
Important global procurement method by which governments deliver improvements to infrastructure
Opportunities being monitored in younger PPP markets such as Chile
Infrastructure requirements driven by population growth, urbanisation and wealth increase
23
1 Figures provided by John Laing Group plc in February 20162 Under second agreement formed in Q1 2014

Conclusion
Solid growth in Portfolio value
– Six new investments1, all acquired on bilateral-basis
Underlying growth ahead of discount rate unwind
– Supported by value enhancements and asset disposals
– Some ongoing operational issues
Cash flows from the Portfolio ahead of project forecast
– Dividend well covered
Disciplined approach to acquisitions, seeking out value adding opportunities
Experienced and incentivised management team
Dividend maintained following February increase
Low risk portfolio with good yield and inflation protection
Solid low risk cash yield with potential upside value
24
1 Including post-balance sheet investments in Barcelona Metro Stations projects

Q&A
25

John Laing Infrastructure Fund
AppendicesAdditional Information

Summary
Low Risk
– Fully seeded with mature PPP assets
– Contracted revenues up to 30 years
– Government-backed revenue streams
– Diversified portfolio
Strong predictable dividend yield
Inflation-linked returns
Steady growth with low volatility
PPP & infrastructure experience and dedicated management team
Potential for value growth
Solid low risk cash yield with potential upside value
London Stock Exchange Listed
27
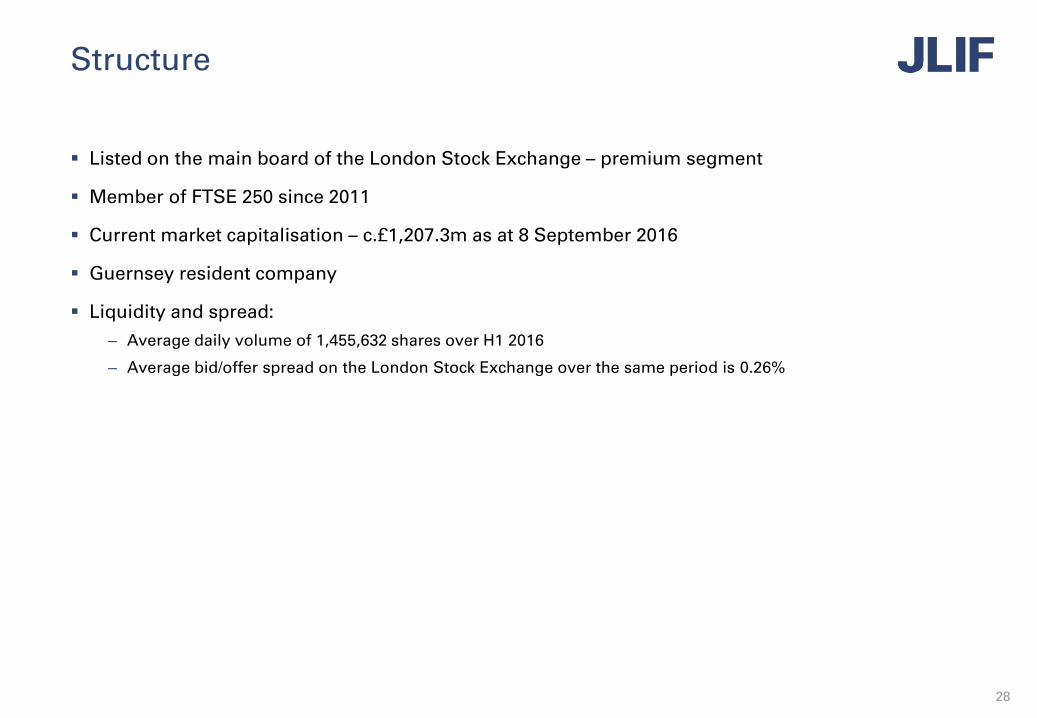
Structure
Listed on the main board of the London Stock Exchange – premium segment
Member of FTSE 250 since 2011
Current market capitalisation – c.£1,207.3m as at 8 September 2016
Guernsey resident company
Liquidity and spread:
– Average daily volume of 1,455,632 shares over H1 2016
– Average bid/offer spread on the London Stock Exchange over the same period is 0.26%
28

Movement in NAV
29
NAV per share 31 December 2015 108.4p NAV at 31 December 2015 £883.1m
Dividend to shareholders (3.4p) Dividend to shareholders (£27.8m)
Uplift from net proceeds issued at a premium to NAV
0.5p Capital raised £91.9m
Portfolio Growth Portfolio Growth
Expected NAV growth 4.0p Expected NAV growth £35.9m
Project outperformance 0.4p Project outperformance £3.6m
Discount rate movements 2.1p Discount rate movements £19.2m
Exchange rate movements 2.8p Exchange rate movements £25.4m
9.3p £84.1m
Other movements (fund costs, creditors, debtors, scrip dividend election)
(1.0p)Other movements (fund costs, creditors, debtors, scrip dividend saving)
(£9.1m)
(1.0p)
NAV per share 30 June 2016 113.8p NAV 30 June 2016 £1,022.2m

Fund Objectives
30
Return* Targeted dividend at least 6.0 pence per annum (dividend paid semi-annually)
Target IRR of 7 to 8%
Assets Low risk PPP projects
Operational
Predominantly availability-based
Inflation-linked
Upside potential
Markets Fiscally strong countries
Committed to PPP
Currently UK, Canada, USA, Spain, the Netherlands and Finland
* These are targets only and not profit forecasts. There can be no assurances that these targets are met or that the Company will make any distributions at all.

Cash Yield
31
Illustrative cash flows from projects over remaining life (30 June 2016)
This illustration represents a target only and not a profit forecast. There can be no assurance that this target will be met.Source: John Laing Capital Management Limited
£m
£20m
£40m
£60m
£80m
£100m
£120m
2017 2018 2019 2020 2021 2022 2023 2024 2025 2026 2027 2028 2029 2030 2031 2032 2033 2034 2035 2036 2037 2038 2039 2040 2041 2042 2043 2044 2045 2046
IPO Portfolio as at 30 June 2016 Portfolio as at 30 June 2016 (inc. PBSE acquisitons)

John Laing Infrastructure Fund
What is PPP?

Structure of PPP Contracts
Example
33
Public Authority
Special Purpose Co
Investor Senior Lender
Builder Operator
ShareholdersAgreement
Facility Management Agreement
Finance Agreements
Project Agreement20 – 25 year concession
Procure Facility and Pay annual fee
Invest Equity (10%) and receive coupons,
dividends and principal
Lend Senior Debt (90%)and receive interest
and principal
Fixed price Fixed price with regular
benchmarking
Source Fund Assets
Design & Build Agreement
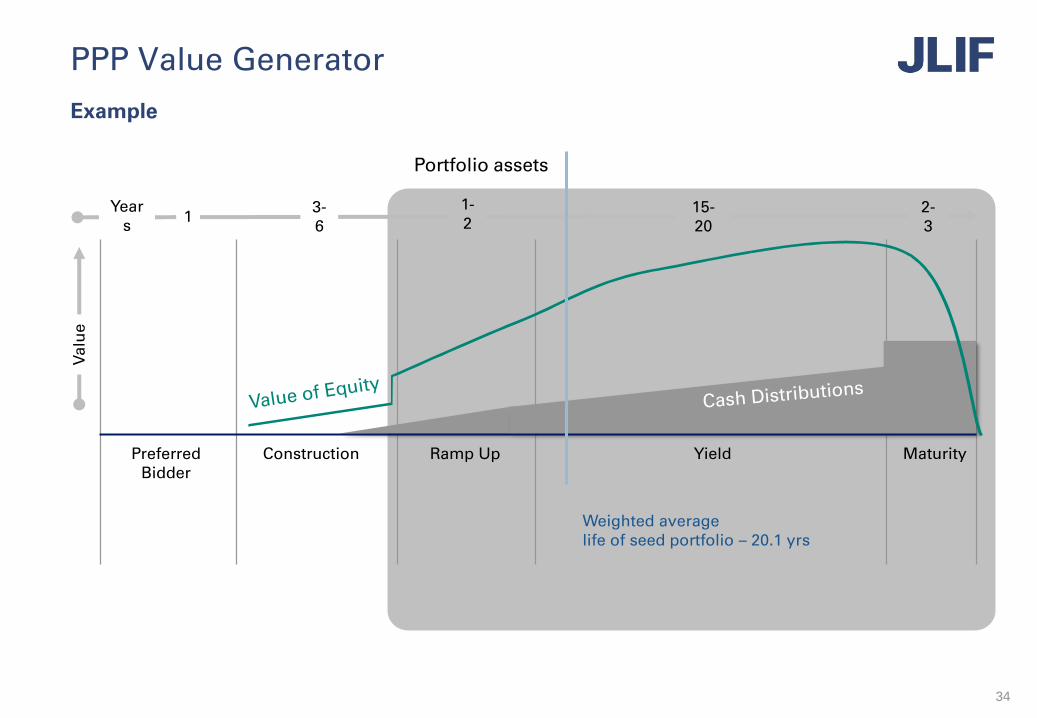
PPP Value Generator
Example
34
1-2
Va
lue
Preferred Bidder
Construction Ramp Up Yield Maturity
13-6
15-20
2-3
Years
Weighted average life of seed portfolio – 20.1 yrs
Portfolio assets
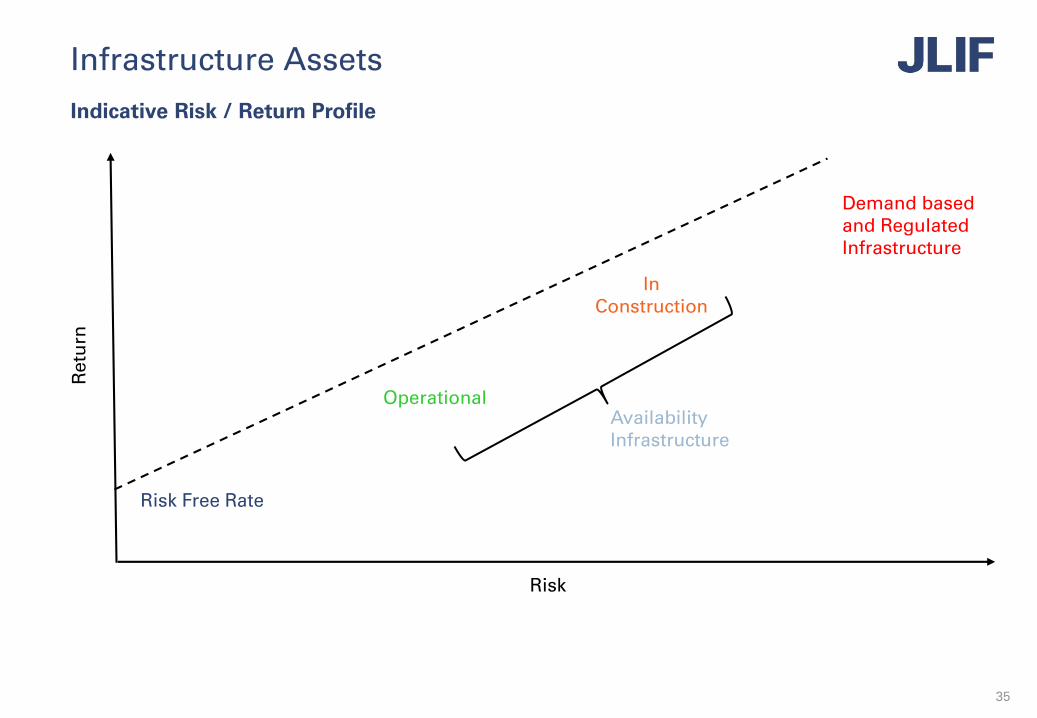
Infrastructure Assets
Indicative Risk / Return Profile
35
Re
turn
Risk
Risk Free Rate
Availability Infrastructure
Demand based and RegulatedInfrastructure
Operational
In Construction

Value Enhancement Opportunities
Strong Track Record of Delivering Enhanced Value
36
Value Creation


![Laing Heating Circulator Ecocirc Vario[1]](https://static.documents.pub/doc/80x56/552675504a7959c3238b46fe/laing-heating-circulator-ecocirc-vario1.jpg)


