38
www.smiths.com SMITHS GROUP PLC INTERIM RESULTS 22 MARCH 2019

www.smiths.com
SMITHS GROUP PLC INTERIM RESULTS
22 MARCH 2019
SMITHS GROUP PLC Interim Results 2019
2
DISCLAIMER
This presentation contains certain statements that are forward-looking statements. Theyappear in a number of places throughout this presentation and include statementsregarding the intentions, beliefs and/or current expectations of Smiths Group plc (the“Company”) and its subsidiaries (together, the “Group”) and those of their respectiveofficers, directors and employees concerning, amongst other things, the results ofoperations, financial condition, liquidity, prospects, growth, strategies and thebusinesses operated by the Group. By their nature, these statements involve uncertaintysince future events and circumstances can cause results and developments to differmaterially from those anticipated. The forward-looking statements reflect knowledge andinformation available at the date of preparation of this presentation and, unlessotherwise required by applicable law, the Company undertakes no obligation to updateor revise these forward-looking statements. Nothing in this presentation should beconstrued as a profit forecast. The Company and its directors accept no liability to thirdparties. This presentation contains brands that are trademarks and are registered and/orotherwise protected in accordance with applicable law.

SMITHS GROUP PLC Interim Results 2019
3
Introduction Andy Reynolds Smith
FY19 Interim Results John Shipsey
AGENDA
Strategic Update Andy Reynolds Smith

SMITHS GROUP PLC Interim Results 2019
4
INTRODUCTION
ANDY REYNOLDS SMITHCHIEF EXECUTIVE

SMITHS GROUP PLC Interim Results 2019
5
BUILDING ON OUR STRATEGIC PROGRESS
SUSTAINABLE GROWTH
20192018
RETURN TO GROWTH
2017
SIGNIFICANT PROGRESS
2016
A NEW DIRECTION
H1 CY2020
SEPARATION OF MEDICAL
OUTPERFORMING OUR CHOSEN
MARKETS
AMBITION

SMITHS GROUP PLC Interim Results 2019
6
FY19 INTERIM RESULTS
JOHN SHIPSEYCHIEF FINANCIAL OFFICER

SMITHS GROUP PLC Interim Results 2019
7
HEADLINE FINANCIAL RESULTS1
£m H1 2019 H1 20182 REPORTED CHANGE
REVENUE 1,573 1,542 +2% +2% underlying, +3% excluding Medical
OPERATING PROFIT 246 248 (1)% (2)% underlying, +2% excluding Medical
OPERATING MARGIN 15.6% 16.1% (50)bps
PROFIT BEFORE TAX 216 218 (1)%
EPS 40.2p 40.7p (1)% (2)% underlying
FREE CASH-FLOW3 71 113 (37)% 74% cash conversion
ROCE 14.5% 15.2% (70)bps
DIVIDEND PER SHARE 14.1 13.8p +2.2%
1 Headline excludes non operating items as defined in note 3 of the accounts. Underlying modifies headline performance to: adjust prior year to reflect an equivalent period of ownership for divested businesses; and exclude the effects of foreign exchange, acquisitions and supplemental sales for divested businesses.
2 Restated for IFRS 15 3 Statutory

SMITHS GROUP PLC Interim Results 2019
8
H1 UNDERLYING REVENUE UP 2%1,3
1 Underlying modifies headline performance to: adjust prior year to reflect an equivalent period of ownership for divested businesses; and exclude the effects of foreign exchange, acquisitions and supplemental sales for divested businesses.2 Includes disposals and HY2019 performance from acquisitions that do not have comparators for the prior year3 Restated for IFRS15
1,549
1,5421,548
1,573
21
29 10
10
( 7 )
( 15 )
( 12 )
(12)
H1 2018 IFRS 15 H1 2018RESTATED
FX ACQUISITIONS &DISPOSALS
H1 2018PROFORMA
JOHN CRANE SMITHSDETECTION
FLEX-TEK SMITHSINTERCONNECT
SMITHSMEDICAL
H1 2019
£m
(3)%+7% (3)% +6% +7%
2
+3% underlying ex. Medical
+2% underlying

SMITHS GROUP PLC Interim Results 2019
9
H1 REVENUE BY DIVISION1,2
1 Underlying modifies headline performance to: adjust prior year to reflect an equivalent period of ownership for divested businesses; and exclude the effects of foreign exchange, acquisitions and supplemental sales for divested businesses.2 Restated for IFRS15
+7% £449m
JOHN CRANE
Oil & Gas c.+9%
Non-Oil & Gas c.+4%
SMITHS MEDICAL
OE +7%
Aftermarket +8%Strong growth
led by OE and AM
SMITHS DETECTION
Air Transportation (7)%
P&B, Defence and Urban Security +3%Programme
phasing
(3)% £361m
Legacy issues and adverse pricing
Improving trend and on track for growth in H2, regulatory
issues abating and NPIs ramping up
(3)%£430m
+7% £149m
Good growth driven by Semiconductor
phasing and Defence
SMITHS INTERCONNECT
+6% £184m
Continued good growth driven by Heat Solutions
and Construction
FLEX-TEK

SMITHS GROUP PLC Interim Results 2019
10
H1 UNDERLYING OPERATING PROFIT DOWN (2)%1,2
1 Headline excludes non operating items as defined in note 3 of the accounts. Underlying modifies headline performance to: adjust prior year to reflect an equivalent period of ownership for divested businesses; and exclude the effects of foreign exchange, acquisitions and supplemental sales for divested businesses.
2 Restated for IFRS15
£m
Operating Margin
16.9%
FY2017 Pro-forma Operating
Margin
16.8%
247248
252
2461
4
4
1
3
2
( 6 )( 10 )
Operating margin
15.6%
Operating margin
16.1%
FX H1 2018 PROFORMA
JOHN CRANE
SMITHS DETECTION
FLEX-TEX SMITHS INTERCONNECT
CENTRAL COSTSSMITHS MEDICAL
H1 2019H1 2018REPORTED
IFRS15 H1 2018 RESTATED
Operating margin
16.0%

SMITHS GROUP PLC Interim Results 2019
11
JOHN CRANE
FLEX-TEK
SMITHS MEDICALSMITHS DETECTION
SMITHS INTERCONNECT
OP
£97m +5%
• Improving volumes
• Investing for future growth
• Lower volumes
• Segment mix and pricing
• Continued strong performance
• One-off non cash costs
• Higher volumes
• Restructuring benefits
• Lower volumes and adverse pricing
• Impact of Notified Body transition
• Operating inefficiencies
OP
£71m(12)%
Margin
16.5%
Margin
21.7%
OP
£55m (9)%
Margin
15.2%
OP
£33m +3%
Margin
18.0%
OP
£18m +19%
Margin
11.9%
H1 OPERATING PROFIT BY DIVISION1,2
1 Underlying modifies headline performance to: adjust prior year to reflect an equivalent period of ownership for divested businesses; and exclude the effects of foreign exchange, acquisitions and supplemental sales for divested businesses.2 Restated for IFRS15

SMITHS GROUP PLC Interim Results 2019
12
£m H1 2019 H1 20182
OPERATING PROFIT1,2 246 248
CAPEX, DEPRECIATION AND AMORTISATION (10) 2 Asset light
WORKING CAPITAL (68) (19) Build up to support growth in H2
OTHER 12 10
OPERATING CASH-FLOW1 180 241 74% cash conversion, expected to be muchstronger for the year
INTEREST & TAXATION1 (77) (69) Headline1 ETR 26%
PENSION (15) (30) c. £40m estimated for the full year
OTHER INVESTMENT AND NON-HEADLINE (17) (29)
FREE CASH-FLOW 71 113
CASH-FLOW REFLECTING H2 WEIGHTED PROFILE
1 Headline excludes non operating items as defined in note 3 of the accounts2 Restated for IFRS15
SMITHS GROUP PLC Interim Results 2019
13
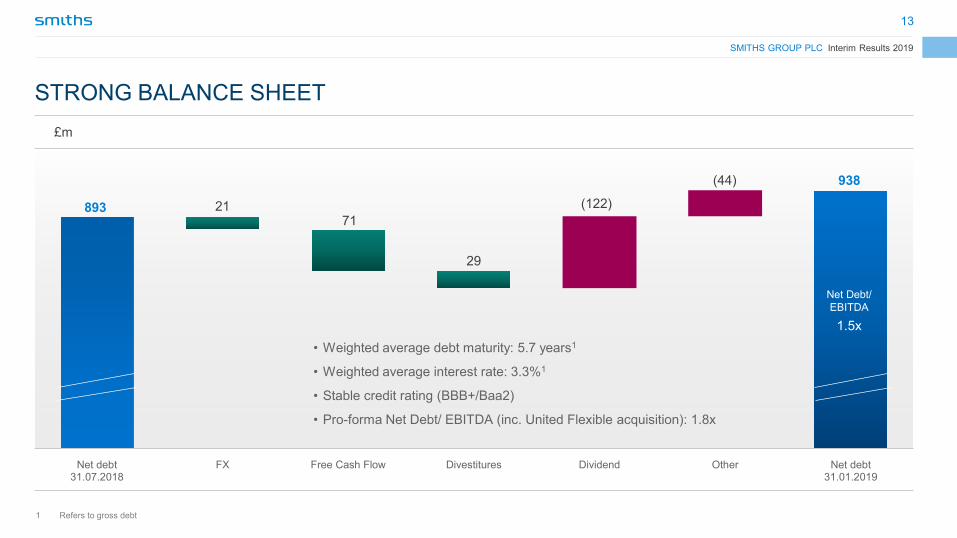
STRONG BALANCE SHEET
1 Refers to gross debt
893
938
(122)
(44)
2171
29
Net debt31.07.2018
FX Free Cash Flow Divestitures Dividend Other Net debt31.01.2019
• Weighted average debt maturity: 5.7 years1
• Weighted average interest rate: 3.3%1
• Stable credit rating (BBB+/Baa2)
• Pro-forma Net Debt/ EBITDA (inc. United Flexible acquisition): 1.8x
Net Debt/EBITDA
1.5x
£m

SMITHS GROUP PLC Interim Results 2019
14
CASH GENERATION
DISCIPLINED CAPITAL ALLOCATION
INVESTMENT IN ORGANIC GROWTH
VALUE CREATIVE M&A
PROGRESSIVE DIVIDEND
Cash R&D % sales 5.1%
United Flexible acquisition completed in February 2019
Interim dividend growth 2.2%

SMITHS GROUP PLC Interim Results 2019
15
2019 OUTLOOK REAFFIRMED
Sustained growth of at least 2%
- Smiths Medical and Smiths Detection to deliver growth in H2
- Other divisions: continued growth, albeit against a strong H2 comparator
Continued focus on operational excellence and cash generation

SMITHS GROUP PLC Interim Results 2019
16
ANDY REYNOLDS SMITHCHIEF EXECUTIVE
STRATEGIC UPDATE
SMITHS GROUP PLC Interim Results 2019
17
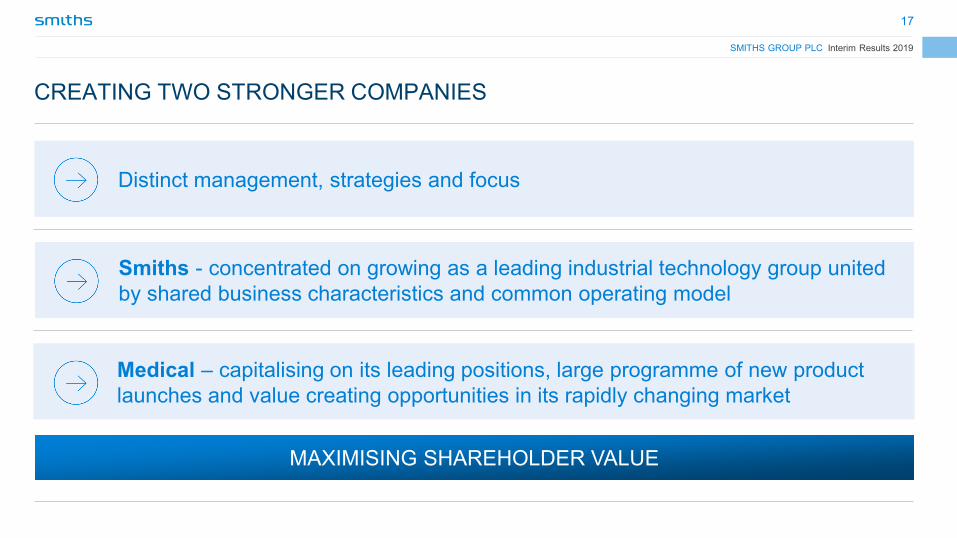
Distinct management, strategies and focus
Medical – capitalising on its leading positions, large programme of new product launches and value creating opportunities in its rapidly changing market
CREATING TWO STRONGER COMPANIES
MAXIMISING SHAREHOLDER VALUE
Smiths - concentrated on growing as a leading industrial technology group united by shared business characteristics and common operating model

SMITHS GROUP PLC Interim Results 2019
18
UK DEMERGER – PROGRESS
To be completed during H1 CY2020
Building on an improving trajectory
Good progress made on key workstreams, including:• Pensions• Tax• Capital structure• Dividend
Near-term milestones: Medical CEO appointment
H2 return to growth Ongoing NPD including Large Volume Pump
A BETTER POSITIONED, FOCUSED BUSINESS
SMITHS GROUP PLC Interim Results 2019
19
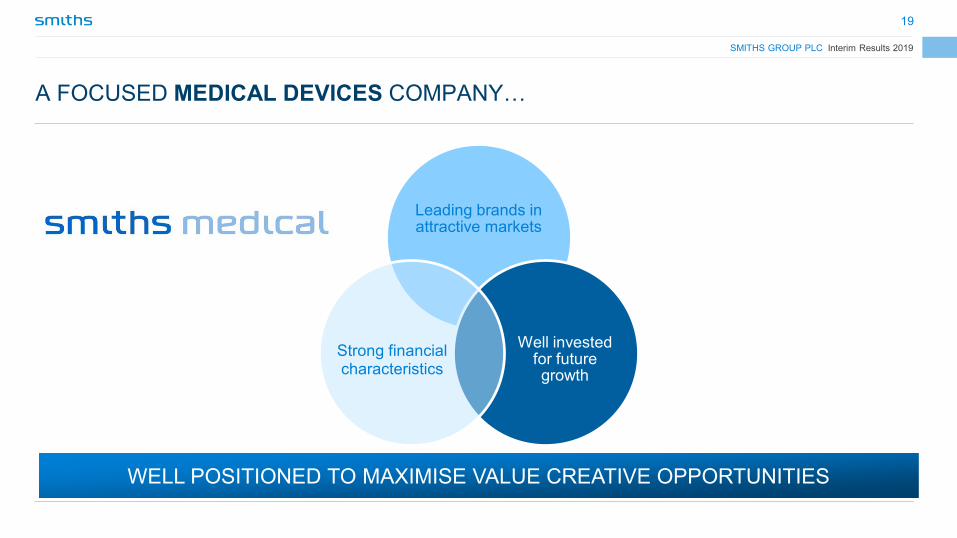
A FOCUSED MEDICAL DEVICES COMPANY…
Leading brands in attractive markets
Well invested for future growth
Strong financial characteristics
WELL POSITIONED TO MAXIMISE VALUE CREATIVE OPPORTUNITIES
SMITHS GROUP PLC Interim Results 2019
20
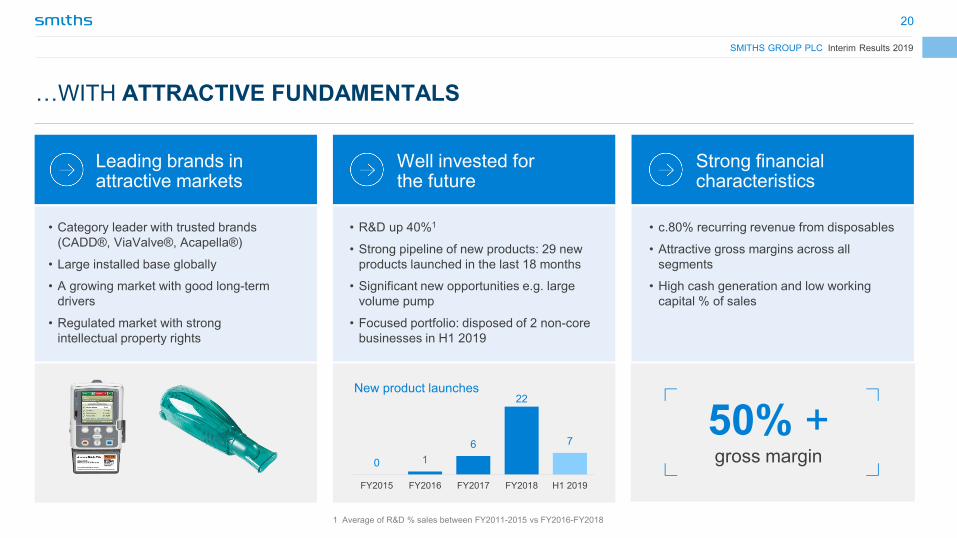
…WITH ATTRACTIVE FUNDAMENTALS
Leading brands in attractive markets
• Category leader with trusted brands (CADD®, ViaValve®, Acapella®)
• Large installed base globally
• A growing market with good long-term drivers
• Regulated market with strong intellectual property rights
1 Average of R&D % sales between FY2011-2015 vs FY2016-FY2018
Well invested for the future
• R&D up 40%1
• Strong pipeline of new products: 29 new products launched in the last 18 months
• Significant new opportunities e.g. large volume pump
• Focused portfolio: disposed of 2 non-core businesses in H1 2019
0 16
22
7
FY2015 FY2016 FY2017 FY2018 H1 2019
New product launches
50% + gross margin
Strong financial characteristics
• c.80% recurring revenue from disposables
• Attractive gross margins across all segments
• High cash generation and low working capital % of sales

SMITHS GROUP PLC Interim Results 2019
21
SMITHS - A LEADING INDUSTRIAL TECHNOLOGY COMPANY
STRONG FINANCIAL
FRAMEWORK
OPERATIONAL EXCELLENCE
GENERATING SUPERIOR RETURNS
LEADING BUSINESSES
IN ATTRACTIVE MARKETS
• >90% of portfolio in top 3 leadership positions
• Underlying markets growing 3-4% p.a.
• High proportion of aftermarket • Through-cycle resilience
• Common operating model focused on efficiency and excellence
• People plan to attract, retain and inspire the very best
• Group wide innovation framework
• Asset light• Highly cash generative• Leverage below 2x net debt/
EBITDA• Disciplined capital allocation
• ROCE 16-18% through the cycle
• Progressive dividend policy covered by FCF
SMITHS GROUP PLC Interim Results 2019
22
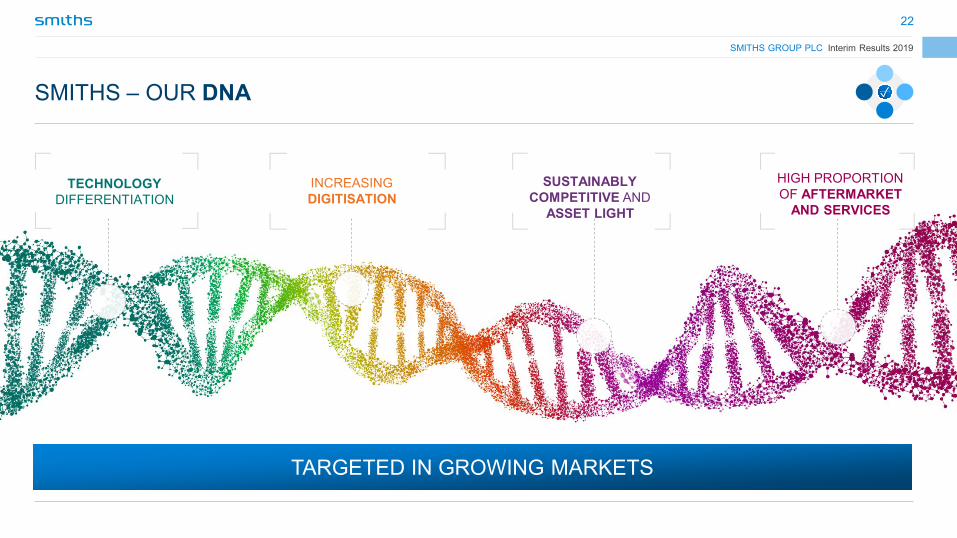
SMITHS – OUR DNA
HIGH PROPORTION OF AFTERMARKET
AND SERVICES
SUSTAINABLY COMPETITIVE AND
ASSET LIGHT
INCREASING DIGITISATION
TECHNOLOGY DIFFERENTIATION
✓
TARGETED IN GROWING MARKETS
SMITHS GROUP PLC Interim Results 2019
23
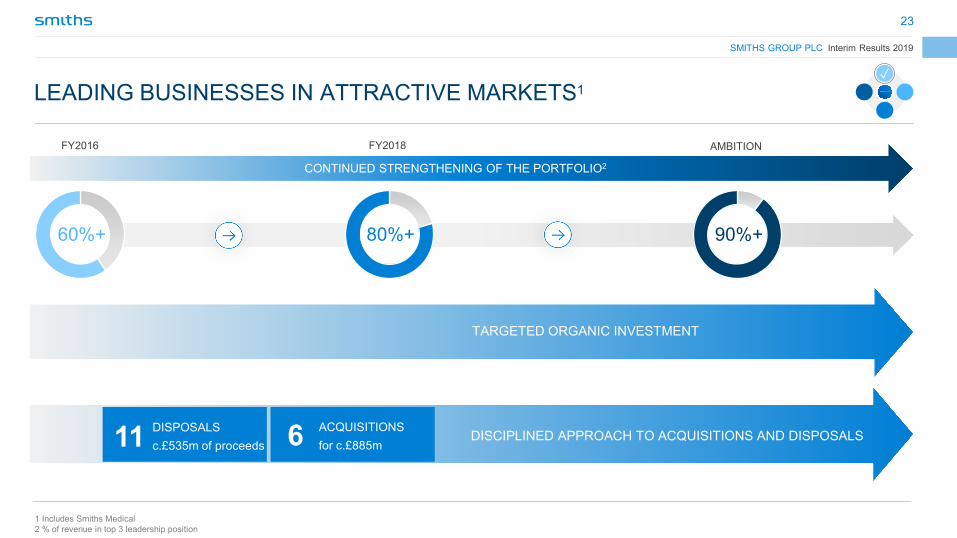
LEADING BUSINESSES IN ATTRACTIVE MARKETS1✓
1 Includes Smiths Medical2 % of revenue in top 3 leadership position
611 DISPOSALSc.£535m of proceeds
ACQUISITIONS for c.£885m
DISCIPLINED APPROACH TO ACQUISITIONS AND DISPOSALS
TARGETED ORGANIC INVESTMENT
FY2016 FY2018 AMBITION
60%+ 90%+80%+
CONTINUED STRENGTHENING OF THE PORTFOLIO2

SMITHS GROUP PLC Interim Results 2019
24
OPERATIONAL EXCELLENCE1
Smiths Excellence System - embedded operating model driving speed and efficiency- Improving execution – reduction in WC % sales 28%- 26% (FY2016-FY2018)- Reducing costs – reduction in cost of poor quality from 2.1% to 1.7% (FY2017-FY2018)
I3 Group-wide innovation framework - Identifying and translating market trends into revenue opportunities - New Vitality Index measure at 13%, with 20% ambition
Global People Plan- Attract, retain, develop, engage and inspire the best people
✓
I3 Group-wide innovation framework - R&D has increased by 25% (FY2016-FY2018)- New Vitality Index measure at 13%, with 20% ambition
THE FOUNDATIONS FOR SUSTAINABLE GROWTH1 Includes Smiths Medical

SMITHS GROUP PLC Interim Results 2019
25
-2%
0%
3% 3%
FY 2016 FY 2017 FY 2018 H1 2019
GROWTH (underlying revenue growth)
MARGIN1
CASH (Free Cash Flow)2 RETURN (ROCE1 %)
+260 bps
£85m£180m
£149m
FY2016
FY2017
FY2018
+160 bps despite the dilutive impact of MorphoCash conversion consistently above 100%
A STRONG FINANCIAL FRAMEWORK
1 Both FY 2016 and FY 2017 have been adjusted for the restructuring and pension administration costs that are now recorded as headline items for comparability 2 Free Cash Flow not adjusted for interest, tax that could be apportioned to Smiths Medical
HISTORICAL PERFORMANCE EXCLUDING SMITHS MEDICAL
13.7%14.9% 15.3%
FY 2016 FY 2017 FY 2018
14.1%15.3%
16.7%
FY 2016 FY 2017 FY 2018
✓

SMITHS GROUP PLC Interim Results 2019
26
DRIVING LONG-TERM, SUSTAINABLE VALUE
100%+ cash conversion 18-20% margin
Outperforming our markets
Value creative investment
Strong dividend covered by FCF
STRONG FINANCIAL
FRAMEWORK
OPERATIONAL EXCELLENCE
GENERATING SUPERIOR RETURNS
LEADING BUSINESSES
IN ATTRACTIVE MARKETS

SMITHS GROUP PLC Interim Results 2019
27
FURTHER STRATEGIC PROGRESS
SUSTAINABLE GROWTH
20192018
RETURN TO GROWTH
2017
SIGNIFICANT PROGRESS
2016
A NEW DIRECTION
H1 CY2020
SEPARATION OF MEDICAL
OUTPERFORMING OUR CHOSEN
MARKETS
AMBITION

28

29

SMITHS GROUP PLC Interim Results 2019
30
#Z
£m H1 2019 H1 20182 Change
Revenue 1,573 1,542 +2%
Headline1 operating profit 246 248 (1)%
Morpho integration costs (5) (12)
Legacy liabilities 4 4
Pension settlement gain/(losses)/ GMP (29) 4
Amortisation of acquired intangibles (17) (15)
Acquisition and disposals costs/ provision release (3) 2
Profit/ (loss) from divestitures 17 (1)
Total non-headline items (33) (18)
Statutory operating profit 213 230 (7)%
PBT - Headline1 216 218 (1)%
- Statutory continuing 174 200 (13)%
EPS - Headline1 40.2p 40.7p (1)%
- Statutory continuing 30.3p 26.3p +15%
INCOME STATEMENT
1 Headline excludes non operating items as defined in note 3 of the accounts2 Restated for IFRS 15

SMITHS GROUP PLC Interim Results 2019
31
RESTATEMENT EXCLUDING SMITHS MEDICAL – H1 2019
£m Smiths Group Smiths Medical Smiths Group excluding Smiths Medical
Revenue (£m) 1,573 430 1,143
Underlying1,3 revenue growth (%) +2% (3)% +3%
Headline2 operating profit (£m) 246 71 175
Underlying1,3 operating profit growth (%) (2)% (12)% +2%
Headline2 operating margin (%) 15.6% 16.5% 15.3%
Reported change in headline2,3
operating margin (50)bps (190)bps +10bps
1 Underlying modifies headline performance to: adjust prior year to reflect an equivalent period of ownership for divested businesses; and exclude the effects of foreign exchange, acquisitions and supplemental sales for divested businesses.2 Headline excludes non operating items as defined in note 3 of the accounts3 Restated for IFRS15

SMITHS GROUP PLC Interim Results 2019
32
ORGANIC GROWTH: R&D INVESTMENT
Income statement costs (expensed and amortised)1
£69m£67m
H1 2019 H1 2018
H1 2018
H1 2019
John Crane Smiths Detection Flex-Tek Smiths Interconnect Central Smiths Medical
1 Reported2 Restated for IFR15
3% growth
CASH COSTS1
£80m 5.1% of revenue
£70m 4.6% of revenue2
4.8% of revenue excluding Medical

SMITHS GROUP PLC Interim Results 2019
33
• For each $0.10 move, the annual operating profit impact is c.£20m
• For each €0.10 move, the annual operating profit impact is c.£10m
FX SENSITIVITY
Currency H1 2019 average rate H1 2018 average rate % change 21/03/2019
USD 1.29 1.33 +3% 1.31
EUR 1.12 1.12 - 1.15

SMITHS GROUP PLC Interim Results 2019
34
COMPETITIVE STRENGTHS
• A strong presence in flow control for rotating equipment
• Strong proprietary technology and expertise in applied engineering
• Broad installed base in Oil & Gas and Non-Oil & Gas
• Strong aftermarket service offering with c. 200 sales and service centres
• Long-term customer relationships
OE/AM
Aftermarket 68%
Original Equipment 32%
GROWTH DRIVERS
• Oil & gas markets recovering driven by underlying energy demand
• Expansion in high-growth markets• Pent-up demand for maintenance and
upgrades in oil & gas and petrochemical• Need for operational improvements in non-
oil and gas process industries• Disruptive innovations including material
science advancements and digital transformation
END MARKETS
c.56% OIL & GAS
- 85% downstream- 15% midstream
GEOGRAPHIES
Americas 42%
Europe 25%
RoW 14%
APAC 19%
c.44% NON-OIL & GAS
- Pharmaceutical- Chemicals- Pulp & paper- Water treatment
COMPETITIVE LANDSCAPE
• Competitors range from large multinationals through to small, more focused companies across the product portfolio
• Examples include: Flowserve,EagleBurgmann,Danaher, Hydac, RexnordR&D % sales
1.9%
Revenue£449m
(29% of Group)
Headline OP £97m
(35% of Group)
Margin21.7%
JOHN CRANE: Mission-critical solutions for global energy and process industries
ROCE23.0%

SMITHS GROUP PLC Interim Results 2019
35
COMPETITIVE STRENGTHS
• A global leader with differentiated technologies leveraged across markets
• Significant R&D capability• Operating in several regulated markets
requiring product certification• Increasing digitisation and aftermarket
revenue• Long-term customer relationships
OE/AM
GROWTH DRIVERS
• Persistent and evolving terror threats• Changing security regulations for air cargo and
passengers• Growing urbanisation and need to protect people
and assets• Global trade, e-commerce and passengers
numbers• Equipment replacement cycle, typically 7-10 years• Growth of security infrastructure in emerging
markets
GEOGRAPHIES
COMPETITIVE LANDSCAPE
• Competitors range from large multinationals through to small, more focused companies across the product portfolio
• Example include: Nuctech, Rapiscan, L3-SDS
SMITHS DETECTION: A global leader in the detection and identification of security threats and contraband
END MARKETS
Revenue£361m
(23% of Group)
Headline OP £55m
(20% of Group)
Margin15.2%
R&D % sales8.8%
Americas 41%
Europe 25%
RoW 16%
APAC 18%
Original Equipment 50%
Aftermarket 50%
Air Transportation 63%
Ports & Borders 12%
Urban Security 22%
Defence 3%
ROCE11.8%

SMITHS GROUP PLC Interim Results 2019
36
END MARKETSGEOGRAPHIES
COMPETITIVE LANDSCAPE
• Competitors range from large multinationals through to small, more focused companies across the product portfolio
• Examples include: Parker-Hannifin, Eaton Zoppas and Nibe
FLEX-TEK: Innovative components to heat and move fluids and gases
COMPETITIVE STRENGTHS
• High-performance products • Leading capability in design and
manufacture• Increasing pace of innovation • Strong customer relationships• Culture, safety and quality
GROWTH DRIVERS
• Steady growth of US housing construction
• Continued increase in large commercial aircraft production
• International expansion
Revenue£184m
(12% of Group)
Headline OP £33m
(12% of Group)
Margin18.0%
R&D % sales0.7%
Americas 82%
Europe 9%
RoW 0%
APAC 9%
Construction 34%
Fluid Management 24%
Flexible Technologies 17%
Heat Solutions 25%
ROCE33.3%

SMITHS GROUP PLC Interim Results 2019
37
END MARKETSGEOGRAPHIES
COMPETITIVE LANDSCAPE
• Competitors range from large multinationals through to small, more focused companies across the product portfolio
• Examples include Amphenol, TE Connectivity, Molex
SMITHS INTERCONNECT: Solutions for high-speed, secure connectivity in demanding applications
Revenue£149m
(9% of Group)
Headline OP £18m
(7% of Group)
Margin11.9%
R&D % sales7.4%
COMPETITIVE STRENGTHS
• Innovative and technically differentiated offerings• Ultra-high reliability solutions used in demanding
applications • Strong research and engineering capabilities• Customer intimacy, responsiveness and product
customisation• Global presence, reach and support
GROWTH DRIVERS
• Increased connectivity• Growing urbanised population requiring
transports and infrastructure• Increasing geopolitical uncertainty• Ageing population and rising need for
healthcare services
Americas 60%
Europe 20%
RoW 2%
APAC 18%
Defence 43%Semiconductor 18%
Space 6%Medical 11%
Commercial Aerospace 9%
Rail, Industrial, Other 13%
ROCE12.9%

SMITHS GROUP PLC Interim Results 2019
38
COMPETITIVE STRENGTHS
• Category leader in our chosen markets• Trusted brands with a reputation for quality and
safety • Strong, defensible intellectual property• Over 80% of revenue is from single-use devices
and proprietary consumables• Strong customer relationships and extensive
global sales network
OE/AM
GROWTH DRIVERS
• Ageing populations with increasing personalised healthcare and patient expectation/quality of life
• Increasing incidence of chronic diseases• Increasing need for connected systems and
data analytics• Growth of alternate site and home-based
healthcare• Growing healthcare spend in developing
markets
GEOGRAPHIES
COMPETITIVE LANDSCAPE
• Competitors range from large multinationals through to small, more focused companies across the product portfolio
• Examples include: Medtronic, Becton-Dickinson, Baxter, B Braun
SMITHS MEDICAL: High-quality, cost-effective medical devices and consumables that are vital to patient care globally
Revenue£430m
(27% of Group)
Headline OP £71m
(26% of Group)
Margin16.5%
R&D % sales5.8%
Americas 56%
Europe 24%
RoW 3%
APAC 17%
Consumables 83%
Original Equipment 17%
END MARKETS
Infusion systems 35%
Vascular access 32%
Vital Care and Specialty products 33%
ROCE11.9%


