21
INTERIM STATEMENT Q3/2019 Q 3

INTERIM STATEMENT Q3/2019
Q3

Group key figuresKey financial figures 1–9/2017 1–9/2018 1–9/2019Revenues € million 604.5 552.0 614.5EBITDA € million 29.7 31.0 32.41
EBIT € million 14.8 17.0 15.1EBIT margin 2.5% 3.1% 2.5%EBT € million 13.9 11.7 9.9Net profit for the period € million 11.1 10.6 9.0
Cash flow from operating activities € million -50.7 -83.4 -136.3Investments2 € million 11.8 11.3 11.0
Total assets3 € million 689.7 756.3 954.2Equity in % of total assets 34.0% 29.7% 24.4%4
Capital employed (average) € million 504.8 518.1 615.0Return on capital employed 2.9% 3.3% 2.5%Return on equity 5.8% 5.1% 4.2%Net debt € million 254.0 293.7 425.6Trade working capital € million 401.7 440.1 537.7Gearing ratio 108.2% 130.6% 182.9%
Key performance figures 1–9/2017 1–9/2018 1–9/2019Order backlog as of Sep. 30 € million 803.4 1,093.6 1,223.8Order intake € million 654.4 789.9 784.1
Employees as of Sep. 30 3,374 3,546 3,781
Key stock exchange figures 1–9/2017 1–9/2018 1–9/2019Closing share price € million 57.0 50.2 39.3Number of shares million units 6.8 6.8 6.8Market capitalization € million 387.6 341.4 267.2Earnings per share € 0.5 0.6 0.3
1 EBITDA without application of IFRS 16: € 29.2 million2 Investments relate to rights and property, plant and equipment (without usage rights according to IFRS 16)3 Details on IFRS 16 under “Explanatory notes”, page 144 Equity ratio without application of IFRS 16: 25.0%

Content
2 INTERIM GROUP MANAGEMENT REPORT 6 INTERIM CONSOLIDATED FINANCIAL STATEMENTS 6 Consolidated statement of financial position 8 Consolidated income statement 9 Presentation of the consolidated statement of comprehensive income 10 Changes in consolidated equity 12 Consolidated statement of cash flows 13 Segment reporting 14 Explanatory notes
18 STATEMENT OF ALL LEGAL REPRESENTATIVES 19 CONTACT AND FINANCIAL CALENDAR

2 INTERIM STATEMENTQ3/2019
ECONOMIC ENVIRONMENT
After a significant slowdown in the first three quarters of the previous year, global economic activity continued to weaken in 2019. In particular, manufacturing activities lost momentum and fell to levels similar to those seen at the time of the global financial crisis. Moreover, intensified economic and geopolitical disputes have raised doubts about the future of the global trading system and international cooperation and have also dampened economic optimism. At the same time, an accommodative monetary policy has cushioned the impact of these tensions on sentiment across financial markets, and a resilient service sector has created more employment.
Against this background, the International Monetary Fund (IMF) once again reduced its forecast for the global economy, which it expects to grow by 3.0% this year and by 3.4% in 2020. This corresponds to a reduction in the outlook of 0.3 and 0.2 percentage points compared with April.
The global firefighting industry is a typical “laggard” and continues to record robust demand in this environment. This is particularly defined by countries with steady procurement. This year, North America and Europe should therefore see even stronger growth.
DEVELOPMENT OF REVENUES AND EARNINGS
RevenuesThe Rosenbauer Group generated revenues of € 614.5 million in the first three quarters of 2019 (1–9/2018: € 552.0 million). In particular, deliveries to North America, Central Europe and Asia were higher, while the Middle East, Northern and Western Europe recorded declines.
Group revenues are currently divided across the sales areas as follows1: 34% in the CEEU area, 10% in the NISA area, 8% in the MENA area, 13% in the APAC area, 32% in the NOMA area, and 3% in the Stationary Fire Protection segment.
1 CEEU: Central and Eastern Europe; NISA: Northern Europe, Iberia, South America and Africa; MENA: Middle East and North Africa; APAC: Asia-Pacific, Australia, China; NOMA: North and Middle America
Result of operationsA pronounced seasonality is characteristic of the firefighting industry. This is because the vast majority of customers are public institutions that manage their budgets in line with government accounting regulations. Accordingly, inventories tend to build up in the first six months of a year, while deliveries are made predominantly in the second half of the year.
At € 15.1 million, EBIT in the first three quarters of 2019 was below the corresponding figure from the previous year (1–9/2018: € 17.0 million). This was due to higher expenses for staff and materials.
Consolidated EBT for the reporting period therefore amounted to € 9.9 million (1–9/2018: € 11.7 million).
ORDERS
Incoming orders presented dynamically in the first nine months and were on par with the previous year at € 784.1 million (1–9/2018: € 789.9 million). By far the strongest year-on-year growth was reported in the area NISA and CEEU.
The order backlog was € 1,223.8 million (1–9/2018: € 1,093.6 million), which is a new historical record value. This order backlog gives the Rosenbauer Group a satisfactory level of capacity utilization at its production facilities and good visibility for the remaining quarter and the year 2020.
Interim Groupmanagement report

INTERIM GROUP MANAGEMENT REPORT
3
SEGMENT DEVELOPMENT
In line with the organizational structure, segment reporting is presented based on the five defined areas or sales regions: the CEEU area (Central and Eastern Europe), the NISA area (Northern Europe, Iberia, South America and Africa), the MENA area (Middle East and North Africa), the APAC area (Asia, Pacific, Australia, China), and the NOMA area (North and Middle America). In addition to this geographical structure, the SFP (Stationary Fire Protection) segment is shown as a further segment in internal reporting.
CEEU area segmentThe CEEU area comprises most countries of Central and Eastern Europe, with the D-A-CH region (Germany, Austria, Switzerland) as its historic domestic market, as well as the Baltics.
The CEEU area includes the Group companies Rosenbauer International and Rosenbauer Österreich in Leonding, Rosenbauer Deutschland in Luckenwalde, Rosenbauer Karlsruhe (Germany), Rosenbauer Slovenia in Radgona, Rosenbauer Rovereto (Italy) and Rosenbauer Schweiz in Oberglatt (Switzerland). The plants produce products for sale in CEEU, but also deliver products to all other areas. Since mid-2018, Rosenbauer has also been present in Poland with its own sales and service company.
Business developmentRevenues in the CEEU area segment rose to € 210.3 million in the period under review after € 169.6 million in the same period of the previous year. EBIT rose to € 7.4 million (1–9/2018: € 3.5 million) thanks to higher deliveries.
NISA area segmentThe NISA area comprises Western European countries from the North Cape to Gibraltar and almost all African and South American nations.
The NISA area includes the Group companies Rosenbauer Española in Madrid (Spain), Rosenbauer South Africa in Johannes-burg (South Africa), Service 18 in Chambéry (France) and Rosenbauer UK in Meltham (UK).
Business developmentIn the reporting period, revenues of the NISA area segment were significantly lower than in the comparative period of the previous year at € 60.0 million (1–9/2018: € 66.4 million). Thanks to a favorable product mix, EBIT is positive at € 0.4 million (1–9/2018: € 24 thousand).
MENA area segmentThe MENA area comprises the countries in the Middle East and North Africa.
The sales area includes Rosenbauer Saudi Arabia in Riyadh (Saudi Arabia) including the King Abdullah Economic City (KAEC) production site and a number of service locations.
Business developmentThe MENA area segment posted lower revenues year-on-year at € 48.4 million (1–9/2018: € 69.9 million). As a result of declining business and insufficient coverage of fixed costs, EBIT was still negative at € -2.5 million in the reporting period (1–9/2018: € 6.0 million).

4 INTERIM STATEMENTQ3/2019
APAC area segmentThe APAC area comprises the entire Asia-Pacific region, Russia, Turkey, India and China.
The APAC area includes the Group companies S.K. Rosenbauer in Singapore (Singapore) and Rosenbauer Australia, Brisbane, (Australia). There are further sales and service locations in China, Brunei, the Philippines and Hong Kong.
Business developmentRevenues in the APAC area segment increased to € 82.6 million in the reporting period (1–9/2018: € 74.7 million). EBIT fell to € 3.4 million (1–9/2018: € 3.8 million) due to an unfavorable product mix.
NOMA area segmentThe NOMA area comprises primarily the US, Canada, and countries in Central America, and the Caribbean.
In addition to the holding company Rosenbauer America, based in Lyons, the area also includes the production companies Rosen-bauer Minnesota and Rosenbauer Motors, also in Wyoming (Minnesota), Rosenbauer South Dakota in Lyons (South Dakota) and Rosenbauer Aerials in Fremont (Nebraska).
Business developmentRevenues in the NOMA area segment increased to € 195.9 million in the first three quarters of this year (1–9/2018: € 154.9 mil-lion). EBIT was therefore also higher at € 8.2 million (1–9/2018: € 5.4 million).
Stationary Fire Protection (SFP) segmentStationary Fire Protection handles the planning, installation, and maintenance of stationary firefighting and alarm systems. The segment is being cultivated by the two Group companies Rosenbauer Brandschutz in Leonding and Rosenbauer Brand-schutz Deutschland in Mogendorf (Germany). Rosenbauer is therefore a full-service supplier in this field as well.
Business developmentRevenues in the SFP segment increased to € 17.3 million between January and September of this year (1–9/2018: € 16.5 million). Segment EBIT was negative in the reporting period at € -1.7 million (1–9/2018: € -1.8 million) due to insufficient coverage of fixed costs and more intensive sales activities.
FINANCIAL AND NET ASSETS POSITION
For reasons specific to the industry, the structure of the Rosenbauer Group’s statement of financial position as of the end of the first three quarters is characterized by high trade working capital. Total assets increased to € 954.2 million by period comparison (September 30, 2018: € 756.3 million), which can be attributed in particular to the higher current assets compared with the balance sheet date of December 31, 2018. The first-time application of IFRS 16 contributed to an extension of the balance sheet total in the amount of € 23.8 million.
The major changes result from inventories and current receiva-bles. Inventories increased to € 502.2 million (September 30, 2018: € 366.3 million), € 66.9 million of which are attributable to the conversion to IFRS 15. The current receivables were above the previous year’s level at € 224.1 million (September 30, 2018: € 185.7 million). Owing to the high level of trade working capital the cash flow from operating activities was still negative at € -136.3 million (1–9/2018: € -83.4 million). A significant improvement in the cash flow from operating activities is expected by the end of the year.
The Group’s net debt (the net amount of interest-bearing liabilities less cash and cash equivalents and securities) increased year-on-year to € 425.6 million (September 30, 2018: € 293.7 million).
INVESTMENTS
Capital expenditure amounted to € 11.0 million in the reporting period (1–9/2018: € 11.3 million). The completion of ongoing investment projects is particularly important. Above all, this includes for example the modernization of Plant I in Leonding, which is undergoing reorganization with a view to increasing efficiency and profitability, as well as the complete robotization of the welding of aerials at the Karlsruhe location.

INTERIM GROUP MANAGEMENT REPORT
5
OUTLOOK
The IMF recently again reduced its global growth forecast. International trade conflicts and geopolitical tensions are slowing investment decisions and trade. Next year, growth should stabilize again and the global economy should be able to move up by 3.4%.
As shown from past experience, the firefighting industry follows the general economy at a delay of several months. Demand is robust and, not least thanks to full order books, the sector is holding its ground despite slowing economic growth. A consist-ently vital international project landscape should also support further market growth and prolong the successful development of the sector. In particular North America and Europe should expand their volume.
In view of the very strong capacity utilization at the production facilities, the Rosenbauer Executive Board is raising its revenue target for 2019 to more than € 980 million, the EBIT margin will be expected at around 5.1%.
SIGNIFICANT EVENTS AFTER THE END OF THE REPORTING PERIOD
By the time of the preparation of this report, there have been no events of particular significance to the Group that would have altered its net assets, financial position, or result of operations since the end of the reporting period.

6 INTERIM STATEMENTQ3/2019
Interim consolidatedfinancial statements
CONSOLIDATED STATEMENT OF FINANCIAL POSITION
ASSETS (in € thousand) Sep. 30, 2018 Dec. 31, 2018 Sep. 30, 2019
A. Non-current assetsI. Property, plant and equipment 146,264.6 147,266.5 147,057.6 II. Intangible assets 27,076.4 26,169.6 26,811.7 III. Right-of-use assets 23,737.8 IV. Securities 778.3 735.9 779.6 V. Investments in companies accounted for using the equity
method 5,857.0 5,558.7 5,609.2 VI. Receivables and other assets 94.1 0.0 0.0 VII. Deferred tax assets 6,528.9 5,529.7 7,630.1
186,599.3 185,260.4 211,626.0
B. Current assetsI. Inventories 366,282.0 368,139.1 502,167.3 II. Receivables and other assets 185,664.3 202,808.9 224,100.3 III. Income-tax receivables 63.7 698.2 139.0 IV. Cash and cash equivalents 17,657.6 25,348.9 16,190.5
569,667.6 596,995.1 742,597.1
Total ASSETS 756,266.9 782,255.5 954,223.1

INTERIM CONSOLIDATED FINANCIAL STATEMENTS
7
EQUITY AND LIABILITIES (in € thousand) Sep. 30, 2018 Dec. 31, 2018 Sep. 30, 2019
A. EquityI. Share capital 13,600.0 13,600.0 13,600.0 II. Capital reserves 23,703.4 23,703.4 23,703.4 III. Other reserves -7,137.3 -8,698.6 -9,312.5 IV. Accumulated results 166,073.9 179,956.7 173,538.2
Equity attributable to shareholders of the parent company 196,240.0 208,561.5 201,529.1 V. Non-controlling interests 28,567.3 28,500.0 31,118.0 Total equity 224,807.3 237,061.5 232,647.1
B. Non-current liabilitiesI. Non-current interest-bearing liabilities 107,718.3 92,178.5 311,267.9 II. Other non-current liabilities 1,362.9 3,713.0 1,721.7 III. Non-current provisions 31,621.5 32,019.5 32,439.6 IV. Deferred tax liabilities 1,441.6 1,552.2 1,434.2
142,144.3 129,463.2 346,863.4
C. Current liabilitiesI. Current interest-bearing liabilities 204,375.4 165,392.0 131,260.8 II. Advance payments received 30,522.3 0.0 0.0 III. Contract liabilities 0.0 106,942.1 98,805.6 IV. Trade payables 61,003.6 44,043.4 50,420.4 V. Other current liabilities 71,469.2 70,074.6 78,945.5 VI. Provisions for taxes 2,567.1 6,855.0 1,169.6 VII. Other provisions 19,377.7 22,423.7 14,110.7
389,315.3 415,730.8 374,712.6
Total EQUITY AND LIABILITIES 756,266.9 782,255.5 954,223.1

8 INTERIM STATEMENTQ3/2019
CONSOLIDATED INCOME STATEMENT
in € thousand 1–9/2018 1–9/2019 7–9/2018 7–9/2019
1. Revenues 552,024.6 614,504.4 199,302.8 219,890.52. Other income 3,442.2 2,230.8 802.4 978.63. Change in inventory of finished goods and work in progress 80,288.1 138,218.1 8,702.2 79,262.04. Capitalized development costs 840.0 2,757.7 278.0 1,015.75. Costs of goods sold -377,573.9 -469,181.0 -119,965.2 -199,130.46. Staff costs -160,717.9 -179,863.4 -55,053.7 -61,959.2
7.Depreciation and amortization expense on property, plant and equipment and intangible assets -13,924.5 -17,300.6 -4,629.1 -5,909.8
8. Impairment losses on property, plant and equipment and intangible assets 0.0 0.0 0.0 0.0
9. Other expenses -67,344.9 -76,263.0 -22,482.4 -24,288.010. Operating result (EBIT) before share in results of companies
accounted for using the equity method 17,033.7 15,103.0 6,955.0 9,859.4
11. Financing expenses -6,026.3 -5,001.3 -1,497.2 -1,924.012. Financing income 1,120.1 198.1 183.5 14.813. Share in results of companies accounted for using the equity method -377.8 -438.0 -4.0 -79.114. Profit before income tax (EBT) 11,749.7 9,861.8 5,637.3 7,871.1
15. Income tax -1,146.7 -892.4 -358.6 -500.916. Net profit for the period 10,603.0 8,969.4 5,278.7 7,370.2
thereofNon-controlling interests 6,218.9 6,887.9 1,872.0 2,359.5Shareholders of parent company 4,384.1 2,081.5 3,406.7 5,010.7
Average number of shares outstanding 6,800,000 6,800,000 6,800,000 6,800,000Basic earnings per share 0.64 0.31 0.50 0.74Diluted earnings per share 0.64 0.31 0.50 0.74
INTERIM CONSOLIDATED FINANCIAL STATEMENTS
9
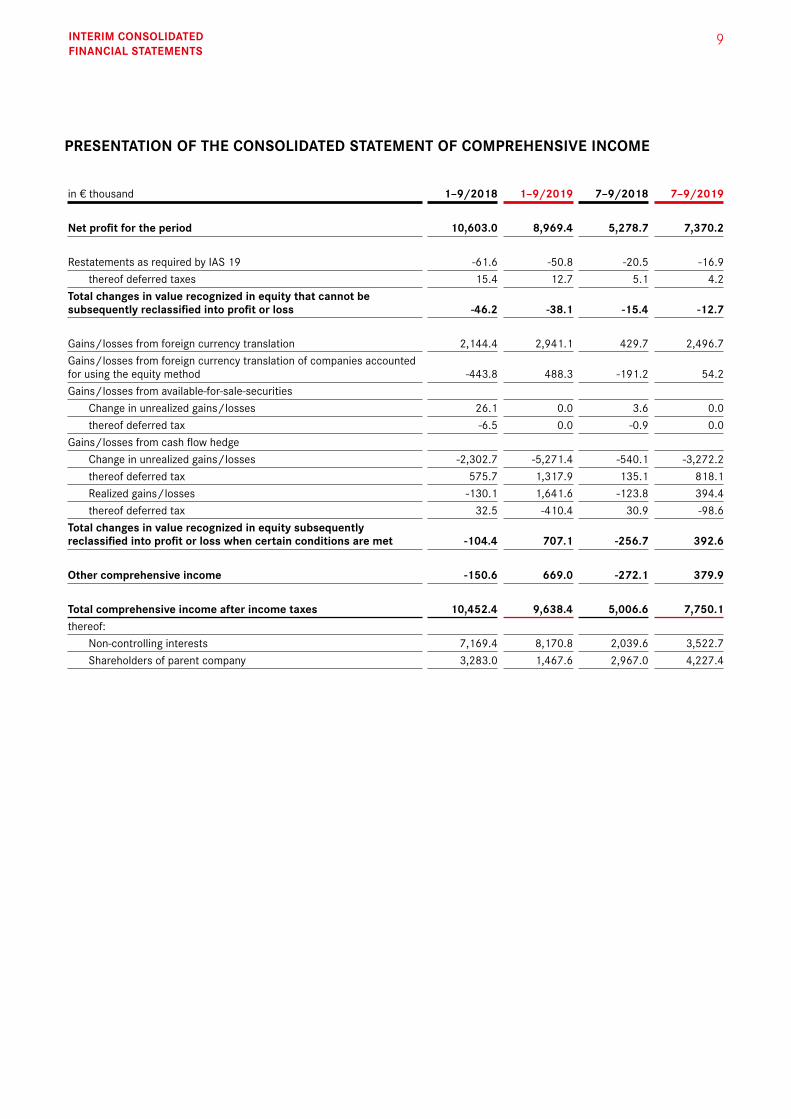
PRESENTATION OF THE CONSOLIDATED STATEMENT OF COMPREHENSIVE INCOME
in € thousand 1–9/2018 1–9/2019 7–9/2018 7–9/2019
Net profit for the period 10,603.0 8,969.4 5,278.7 7,370.2
Restatements as required by IAS 19 -61.6 -50.8 -20.5 -16.9thereof deferred taxes 15.4 12.7 5.1 4.2
Total changes in value recognized in equity that cannot be subsequently reclassified into profit or loss -46.2 -38.1 -15.4 -12.7
Gains / losses from foreign currency translation 2,144.4 2,941.1 429.7 2,496.7Gains / losses from foreign currency translation of companies accounted for using the equity method -443.8 488.3 -191.2 54.2Gains / losses from available-for-sale-securities
Change in unrealized gains / losses 26.1 0.0 3.6 0.0thereof deferred tax -6.5 0.0 -0.9 0.0
Gains / losses from cash flow hedgeChange in unrealized gains / losses -2,302.7 -5,271.4 -540.1 -3,272.2thereof deferred tax 575.7 1,317.9 135.1 818.1Realized gains / losses -130.1 1,641.6 -123.8 394.4thereof deferred tax 32.5 -410.4 30.9 -98.6
Total changes in value recognized in equity subsequently reclassified into profit or loss when certain conditions are met -104.4 707.1 -256.7 392.6
Other comprehensive income -150.6 669.0 -272.1 379.9
Total comprehensive income after income taxes 10,452.4 9,638.4 5,006.6 7,750.1thereof:
Non-controlling interests 7,169.4 8,170.8 2,039.6 3,522.7Shareholders of parent company 3,283.0 1,467.6 2,967.0 4,227.4
10 INTERIM STATEMENTQ3/2019
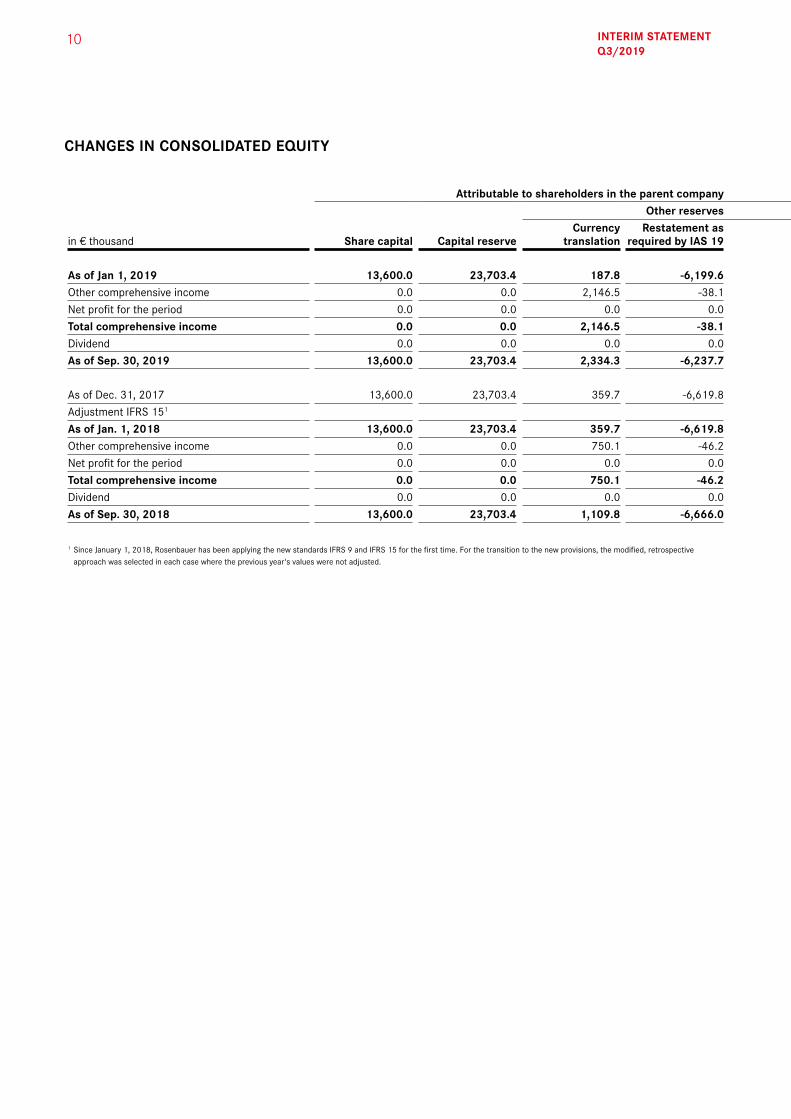
CHANGES IN CONSOLIDATED EQUITY
Attributable to shareholders in the parent companyOther reserves
in € thousand Share capital Capital reserveCurrency
translationRestatement as
required by IAS 19Revaluation
reserve Hedging reserveAccumulated
results SubtotalNon-controlling
interests Group equity
As of Jan 1, 2019 13,600.0 23,703.4 187.8 -6,199.6 0.0 -2,686.8 179,956.7 208,561.5 28,500.0 237,061.5Other comprehensive income 0.0 0.0 2,146.5 -38.1 0.0 -2,722.3 0.0 -613.9 1,282.9 669.0Net profit for the period 0.0 0.0 0.0 0.0 0.0 0.0 2,081.5 2,081.5 6,887.9 8,969.4Total comprehensive income 0.0 0.0 2,146.5 -38.1 0.0 -2,722.3 2,081.5 1,467.6 8,170.8 9,638.4Dividend 0.0 0.0 0.0 0.0 0.0 0.0 -8,500.0 -8,500.0 -5,552.8 -14,052.8As of Sep. 30, 2019 13,600.0 23,703.4 2,334.3 -6,237.7 0.0 -5,409.1 173,538.2 201,529.1 31,118.0 232,647.1
As of Dec. 31, 2017 13,600.0 23,703.4 359.7 -6,619.8 126.3 97.6 176,960.9 208,228.1 30,977.8 239,205.9Adjustment IFRS 151 -8,471.1 -8,471.1 -2,620.0 -11,091.1As of Jan. 1, 2018 13,600.0 23,703.4 359.7 -6,619.8 126.3 97.6 168,489.8 199,757.0 28,357.8 228,114.8Other comprehensive income 0.0 0.0 750.1 -46.2 19.6 -1,824.6 0.0 -1,101.1 950.5 -150.6Net profit for the period 0.0 0.0 0.0 0.0 0.0 0.0 4,384.1 4,384.1 6,218.9 10,603.0Total comprehensive income 0.0 0.0 750.1 -46.2 19.6 -1,824.6 4,384.1 3,283.0 7,169.4 10,452.4Dividend 0.0 0.0 0.0 0.0 0.0 0.0 -6,800.0 -6,800.0 -6,959.9 -13,759.9As of Sep. 30, 2018 13,600.0 23,703.4 1,109.8 -6,666.0 145.9 -1,727.0 166,073.9 196,240.0 28,567.3 224,807.3
1 Since January 1, 2018, Rosenbauer has been applying the new standards IFRS 9 and IFRS 15 for the first time. For the transition to the new provisions, the modified, retrospective approach was selected in each case where the previous year's values were not adjusted.

INTERIM CONSOLIDATED FINANCIAL STATEMENTS
11
Attributable to shareholders in the parent companyOther reserves
in € thousand Share capital Capital reserveCurrency
translationRestatement as
required by IAS 19Revaluation
reserve Hedging reserveAccumulated
results SubtotalNon-controlling
interests Group equity
As of Jan 1, 2019 13,600.0 23,703.4 187.8 -6,199.6 0.0 -2,686.8 179,956.7 208,561.5 28,500.0 237,061.5Other comprehensive income 0.0 0.0 2,146.5 -38.1 0.0 -2,722.3 0.0 -613.9 1,282.9 669.0Net profit for the period 0.0 0.0 0.0 0.0 0.0 0.0 2,081.5 2,081.5 6,887.9 8,969.4Total comprehensive income 0.0 0.0 2,146.5 -38.1 0.0 -2,722.3 2,081.5 1,467.6 8,170.8 9,638.4Dividend 0.0 0.0 0.0 0.0 0.0 0.0 -8,500.0 -8,500.0 -5,552.8 -14,052.8As of Sep. 30, 2019 13,600.0 23,703.4 2,334.3 -6,237.7 0.0 -5,409.1 173,538.2 201,529.1 31,118.0 232,647.1
As of Dec. 31, 2017 13,600.0 23,703.4 359.7 -6,619.8 126.3 97.6 176,960.9 208,228.1 30,977.8 239,205.9Adjustment IFRS 151 -8,471.1 -8,471.1 -2,620.0 -11,091.1As of Jan. 1, 2018 13,600.0 23,703.4 359.7 -6,619.8 126.3 97.6 168,489.8 199,757.0 28,357.8 228,114.8Other comprehensive income 0.0 0.0 750.1 -46.2 19.6 -1,824.6 0.0 -1,101.1 950.5 -150.6Net profit for the period 0.0 0.0 0.0 0.0 0.0 0.0 4,384.1 4,384.1 6,218.9 10,603.0Total comprehensive income 0.0 0.0 750.1 -46.2 19.6 -1,824.6 4,384.1 3,283.0 7,169.4 10,452.4Dividend 0.0 0.0 0.0 0.0 0.0 0.0 -6,800.0 -6,800.0 -6,959.9 -13,759.9As of Sep. 30, 2018 13,600.0 23,703.4 1,109.8 -6,666.0 145.9 -1,727.0 166,073.9 196,240.0 28,567.3 224,807.3
1 Since January 1, 2018, Rosenbauer has been applying the new standards IFRS 9 and IFRS 15 for the first time. For the transition to the new provisions, the modified, retrospective approach was selected in each case where the previous year's values were not adjusted.

12 INTERIM STATEMENTQ3/2019
CONSOLIDATED STATEMENT OF CASH FLOWS
in € thousand 1–9/2018 1–9/2019
Profit before income tax 11,749.7 9,861.8+ Depreciation 13,924.5 17,300.6± Gains / losses of companies accounted for using the equity method 377.8 438.0+ Interest expenses 5,736.3 4,365.9 - Interest and securities income -1,120.1 -198.1± Unrealized gains / losses from currency translation 1,294.9 3,343.4± Change in inventories -113,732.1 -134,028.2± Change in receivables and other assets -30,495.7 -21,784.9± Change in trade payables / advance payments received and contract liabilities 31,355.2 -1,510.3± Change in other liabilities 3,705.5 3,412.9± Change in provisions (excluding income tax deferrals) -216.5 -7,892.9
Cash earnings -77,420.5 -126,691.8
- Interest paid -3,046.1 -3,736.3+ Interest received and income of securities 741.5 194.1- Income tax paid -3,696.9 -6,052.6
Net cash flow from operating activities -83,422.0 -136,286.6
- Proceeds / Payments from the sale / purchase of property, plant and equipment, intangible assets and securities -11,486.4 -11,246.9
- Income from capitalized development costs -840.0 -2,757.7Net cash flow from investing activities -12,326.4 -14,004.6
- Payments from the acquisition of non-controlling interests 0.0 -3,099.0- Dividends paid -6,800.0 -8,500.0- Dividends paid to non-controlling interests -6,959.9 -5,552.8+ Proceeds from interest-bearing liabilities 180,742.4 243,742.2- Repayment of interest-bearing liabilities -73,573.5 -85,543.6
Net cash flow from financing liabilities 93,409.0 141,046.8
Net change in cash and cash equivalents -2,339.4 -9,244.4+ Cash and cash equivalents at the beginning of the period 20,041.1 25,348.9± Adjustment from currency translation -44.1 86.0
Cash and cash equivalents at the end of the period 17,657.6 16,190.5

INTERIM CONSOLIDATED FINANCIAL STATEMENTS
13
SEGMENT REPORTING
Business Segments in T€ 1–9/2018 1–9/2019
External revenuesArea CEEU 169,557.6 210,301.8Area NISA 66,413.5 60,005.9Area MENA 69,914.4 48,355.9Area APAC 74,730.7 82,621.3Area NOMA 154,924.4 195,923.5SFP1 16,484.0 17,296.0Group 552,024.6 614,504.4
Operating result (EBIT)Area CEEU 3,545.4 7,370.4Area NISA 23.7 355.6Area MENA 6,040.3 -2,543.4Area APAC 3,784.5 3,374.2Area NOMA 5,438.8 8,226.2SFP1 -1,799.0 -1,680.0EBIT before share of results of companies accounted for using the equity method 17,033.7 15,103.0Finance expenses -6,026.3 -5,001.3Financial income 1,120.1 198.1Share in results of companies accounted for using the equity method -377.8 -438.0Profit before income tax (EBT) 11,749.7 9,861.8
Business Units in T€ 1–9/2018 1–9/2019
External revenuesVehicles 428,762.7 472,344.8Fire & Safety Equipment 46,823.4 56,162.2Stationary Fire Protection (SFP) 16,484.0 17,532.0Customer Service 41,340.1 44,564.5Others 18,614.4 23,900.9Group 552,024.6 614,504.4
1 Stationary Fire Protection

14 INTERIM STATEMENTQ3/2019
Explanatory notes to the Quarterly Report as of September 30, 2019
1. INFORMATION ON THE COMPANY AND THE BASIS OF PREPARATION
The Rosenbauer Group is an international group of companies whose parent company is Rosenbauer Interna-tional AG, Austria. Its main focus is on the production of firefighting vehicles, the development and manufacture of firefighting systems, equipping vehicles and their crews and preventive firefighting. The Group’s head office is located at Paschinger Strasse 90, 4060 Leonding, Austria.
With the exception of standards that have come into effect in the interim, the interim consolidated financial statements have been prepared on the basis of the same accounting policies as those applied as of December 31, 2018. The condensed interim consolidated financial statements therefore do not contain all the information or explanatory notes stipulated by IFRS for consolidated financial statements as of the end of the fiscal year, and should instead be read in conjunction with the IFRS consolidated financial statements published by the company for fiscal year 2018.
The interim consolidated financial statements have been prepared in thousands (€ thousand) and, unless expressly stated, this also applies to the figures shown in the notes.
2. FIRST-TIME APPLICATION OF IFRS STANDARDS
In accordance with IFRS 16, which was adopted in January 2016 and replaces IAS 17 and the related interpreta-tions, there is a new regulation for the accounting of leases. Lessees must recognize assets and liabilities in the statement of financial position for most leases regardless of whether they are operating or finance leases under past IAS 17 criteria. While payment obligations for operating leases previously had to be recognized as an expense in the income statement and disclosed in the notes, right-of-use assets (the value of which is the present value of the future lease payments plus directly attributable costs) and – at the same time – lease liabilities for the obligation to make future lease payments must be recognized in the future. While the lease liabilities are remeasured in line with financial circumstances over the term of the lease as under the regulations of IAS 17, the right-of-use asset is amortized. The lessees are required to remeasure the lease liability if changes are made to significant components of the contract. Correspondingly, the adjustment to the amount is recog-nized as a change to the right-of-use asset. The standard contains exceptions for low-value leases and short-term leases (a term of less than one year). In accordance with these exceptions, right-of-use assets and lease liabilities are not recognized for low-value leases or short-term leases. Instead, the underlying expenses are recognized, as before, as the basis of the leases in the income statement. The Rosenbauer Group will use the exceptions for low-value leases and short-term leases.

15INTERIM CONSOLIDATED FINANCIAL STATEMENTS
The Rosenbauer Group’s total assets increased as of the first-time adoption date of January 1, 2019 due to the recognition of right-of-use assets and the corresponding liability of lease liabilities to the amount of € 24,099.4 thousand.
The impact of IFRS 16 as of the first-time adoption date are described in detail below:
in € thousandOperating performance obligations in accordance with IFRS 16 as of January 1, 2019 33,588.6Simplification option for leases and non-lease components -4,079.3Leases that do not meet the criteria of IFRS 16 -2,745.7Gross lease liabilities as of January 1, 2019 26,763.6Discounts -2,664.2Additional lease liabilities as a result of the first-time application of IFRS 16 as of January 1, 2019 24,099.4
The average weighted lessee’s incremental borrowing rate used to discount the lease liabilities in the table above was 1.8% as of January 1, 2019.

16 INTERIM STATEMENTQ3/2019
3. COMPARATIVE FIGURES FOR IFRS 16
IThe following tables depict the effects of the standard IFRS 16, which was applied for the first time, on the consolidated financial statements of September 30, 2019.
in thousand EUR 1–9/2019
Adjustment IFRS 16
1–9/2019
1–9/2019 without
application IFRS 16
1. Revenues 614,504.4 614,504.42. Other income 2,230.8 2,230.83.
Change in inventory of finished goods and work in progress 138,218.1 138,218.1
4. Capitalized development costs 2,757.7 2,757.75. Costs of goods sold -469,181.0 -469,181.06. Staff costs -179,863.4 -179,863.47.
Depreciation and amortization expense on property, plant and equipment and intangible assets -17,300.6 -3,021.8 -14,278.8
8. Impairment losses on property, plant and equipment and intangible assets 0.0 0.0
9. Other expenses -76,263.0 3,206.0 -79,469.010.
Operating result (EBIT) before share in results of companies accounted for using the equity method 15,103.0 184.2 14,918.8
11. Financing expenses -5,001.3 -358.4 -4,642.912. Financing income 198.1 198.113. Share in results of companies accounted
for using the equity method -438.0 -438.014.Profit before income tax (EBT) 9,861.8 -174.2 10,036.015. Income tax -892.4 43.5 -935.916.Net profit for the period 8,969.4 -130.7 9,100.1
thereofNon-controlling interests 6,887.9 -39.3 6,927.2Shareholders of parent company 2,081.5 -91.4 2,172.9
Average number of shares outstanding 6,800,000 6,800,000 6,800,000Basic earnings per share 0.31 -0.01 0.32Diluted earnings per share 0.31 -0.01 0.32

17INTERIM CONSOLIDATED FINANCIAL STATEMENTS
Balance sheet item / in thousand EUR Sep. 30, 2019
Adjustment IFRS 16
Sep. 30, 2019
Sep. 30, 2019 without
application IFRS 16
A. Non-current assetsIII. Right-of-use assets 23,737.8 23,737.8 0.0VI. Deferred tax assets 7,630.1 43.5 7,586.6
A. EquityIV. Accumulated results 173,538.2 -91.4 173,629.6V. Non-controlling interests 31,118.0 -39.3 31,157.3
B. Non-current liabilitiesI. Non-current interest-bearing liabilities 311,267.9 19,771.2 291,496.7
C. Current liabilitiesI. Current interest-bearing liabilities 131,260.8 4,140.8 127,120.0
4. COMPANIES INCLUDED IN CONSOLIDATION
In accordance with IFRS 10, the consolidated financial statements as of September 30, 2019 include three Austrian and 24 foreign subsidiaries, all of which are legally and actually controlled by Rosenbauer International AG and therefore included in consolidation. The shares in the associate in Russia (PA “Fire-fighting special technics,” Rosenbauer share: 49%) and the shares in the joint venture in Spain (Rosenbauer Ciansa S.L., Rosenbauer share: 50%) – established with the co-owner and Managing Director of Rosenbauer Española – are accounted for using the equity method.
5. SEASONAL FLUCTUATIONS
Owing to the high degree of dependency on public sector clients, the usual pattern in the fire equipment sector is for a very high proportion of its deliveries to be made in the second half of the year, especially in the final quarter. There can therefore be considerable differences – in terms of revenues and earnings – between the respective interim reporting periods. In the period under review there were no unusual developments over and above the seasonal fluctuations characteristic of the industry. Further information on developments in the period under review can be found in the interim Group management report.
6. SIGNIFICANT EFFECT OF ESTIMATES
In the consolidated financial statements, to a certain degree, estimates and assumptions must be made that affect the recognized assets and liabilities, the disclosure of other obligations at the end of the reporting period and the reporting of income and expenses during the reporting period. The actual amounts that arise in the future can differ from estimates. Deviations from estimates had no significant effect on the financial statements in the reporting period.
7. EVENTS AFTER THE END OF THE REPORTING PERIOD
No significant events occurred by the time of the preparation of the Quarterly Statement.

18 INTERIM STATEMENTQ3/2019
STATEMENT OF ALLLEGAL REPRESENTATIVES
We confirm to the best of our knowledge that the condensed interim financial statements give a true and fair view of the assets, liabilities, financial position and profit or loss of the group as required by the applicable accounting standards and that the interim group management report gives a true and fair view of important events that have occurred during the first nine months of the financial year and their impact on the condensed interim financial statements, and of the principal risks and uncertainties for the remaining three months of the financial year.
In the case of this report it was decided to dispense with an audit or review by an external auditor.
Leonding, November 12, 2019
Dieter Siegel Andreas Zeller Daniel Tomaschko Sebastian WolfCEO CSO CTO CFOGlobal central functions: Global central functions: Global central functions: Global central functions:Corporate Development, Area Management Stationary Fire Protection, Group Controlling,Human Resources, APAC, CEEU, MENA, Supply Chain Management, Group Accounting and Tax,Strategy, NISA and NOMA, Central Technics, Legal, Compliance &Innovation & Marketing, Sales Administration, CoC Operations Insurance, Export Finance,Group Communication, Customer Service Treasury, Investor Relations,Fire & Safety Equipment, Internal Audit, ITProduct Management

19
CONTACT AND FINANCIAL CALENDAR 2019
INVESTOR RELATIONS
Tiemon KiesenhoferPhone: +43 732 6794-568E-mail: [email protected]/group
CAPITAL MARKET CALENDAR
November 27, 2019 Shareholders’ Day, LeondingFebruary 12, 2020 Publication of the preliminary results 2019April 3, 2020 Publication of the results 2019May 1, 2020 Record date “Annual General Meeting”May 11, 2020 28th Annual General Meeting, LinzMay 18, 2020 Ex-dividend dateMay 19, 2020 Publication of the interim statement Q1/2020May 19, 2020 Record date “Dividends”May 20, 2020 Dividend payout dateAugust 14, 2020 Publication of the Half-year Financial Report 2020November 17, 2020 Publication of the interim statement Q3/2020
ROSENBAUER SHARE DETAILS
ISIN AT0000922554Reuters RBAV.VIBloomberg ROS AVShare class No-par-value shares, bearer or registeredATX prime weighting 0.27%
Published by
Rosenbauer International AG, Paschinger Straße 90, 4060 Leonding, Austria
Rosenbauer International AG does not guarantee in any way that the forward-looking assumptions and estimates contained in this Quarterly
Report will prove correct, nor does it accept any liability for loss or damages that may result from any use of or reliance on this report. Minimal
arithmetical differences may arise from the application of commercial rounding to individual items and percentages in this report. The English
translation of the Rosenbauer Quarterly Report is for convenience. Only the German text is binding.


