Interim targets: Guideposts to reaching long-term climate change goals Brian O’Neill International Institute for Applied Systems Analysis Laxenburg, Austria Contributors: James Wang & Bill Chameides, Environmental Defense Michael Oppenheimer, Princeton University Annie Petsonk, Environmental Defense Ilkka Keppo & Keywan Riahi, IIASA Presented at the IIASA-RITE International Symposium 12 March 2007, Tokyo
Transcript
Interim targets: Guideposts to reaching long-term climate change goals
Brian O’NeillInternational Institute for Applied Systems Analysis
Laxenburg, Austria
Contributors:James Wang & Bill Chameides, Environmental Defense
Presented at the IIASA-RITE International Symposium12 March 2007, Tokyo
Long-term Climate ChangePolicy Goals
1992: Framework ConventionObjective: “...stabilization of greenhouse gas concentrations concentrations in the atmosphere at a level that would prevent dangerous anthropogenic interference with the climate system.”“…within a time-frame sufficient to allow ecosystems to adapt naturally to climate change, to ensure that food production is not threatened and to enable economic development to proceed in a sustainable manner. ….”
Short-term Climate ChangePolicy Goals
1997: Kyoto ProtocolLegally binding emissions reductions targets for industrialized countries for 2008-2012
2001: Many details of flexible mechanisms agreed to at COP 10 in Marrakech2005: Entry into force
Dangerous interference:Criteria for Concern, IPCC
Source: Smith et al., 2001, IPCC TAR WG2, Ch. 19.
ProblemWill be difficult (in the near future, impossible?) to agree on what level of climate change is “dangerous”Meanwhile,
we may commit ourselves to potentially dangerous levels of climate changewe may commit ourselves to potentially dangerous rates of climate changewe lack policy signals to guide decisions with long time horizons – exactly the kinds of decisions necessary for meeting long-term goals
Short-term policies (e.g., Kyoto Protocol) do not sufficiently guard against these problems
Keep a range of century-scale targets feasible while uncertainties are narrowedLimit rates of climate change in the medium termBetter inform multi-decade planning horizonsMay broaden grounds for agreement in policy discussions Would require periodic review and updating as new information became availableDoes not imply any single policy regime for achieving it
Interim Concentration Targets
Targets could take range of forms, from weak to strong:
Evaluation framework for climate policy proposalsInformal aspirational goal(s)Formal targets under Convention/Protocol regime
Integrating point for parallel policy regimes?
Why Concentrations?
Balances uncertainty in consequences with uncertainty in required mitigation activity
Easier to detect progress toward concentration goal than temperature goalEquivalent CO2 integrates across multiple gases
Psychologically tractablePolitical precedents (GATT/WTO, Social Security)Long enough to affect rates of temperature change, short enough to constrain themConsistent with timescale of long-lived capital
Related Proposals or AnalysesMedium-term emissions goals by countries (e.g., UK) or states (e.g., California)
Global emissions goals (Corfee-Morlot and Hoehne, 2003; Pacala and Socolow, 2004)
Technology needs in medium term (Hoffert et al., 2002; Pershing and Tudela, 2003)
Recent policy proposals:WBCSD (Nov. 2006): mid-century global emissions goal
GROCC (Feb. 2007): “ambitious but achievable” mid-century CO2 concentration target
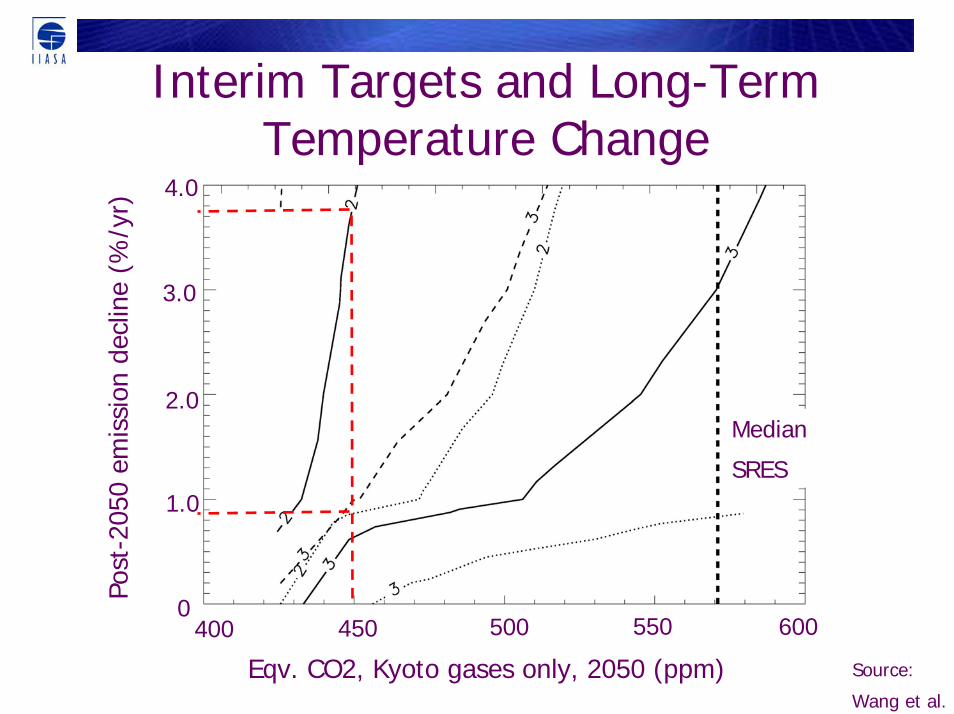
Constraining Rates of Change
Rate of Temperature ChangeDifferent pathways to same long-term stabilization level imply substantially different rates of warming in the interim periodDifferences in rates of warming are large enough to be of concern for impacts that might be considered “dangerous”Examples: Thermohaline circulation shutdown, ecosystem impacts.
Medium-term Conditions in GGI Mitigation Scenarios
0%
20%
40%
60%
80%
100%
400 420 440 460 480 500 520 540 560 580
CO2 concentration (2050)
Prob
abili
ty o
f sta
ying
bel
ow th
e ta
rget
2°C
3°C
A2rB1r
Source: Keppo et al., TFSC, 2007.
Medium-term Conditions in GGI Mitigation Scenarios
0%
20%
40%
60%
80%
100%
0% 20% 40% 60% 80% 100%
Share of zero-carbon energy (2050)
Prob
abili
ty o
f sta
ying
bel
ow th
e ta
rget
2°C
3°C
2000
A2r B1r
Source: Keppo et al., TFSC, 2007.
ConclusionsAn interim target could constrain rates of temperature change and preserve long-term options, serving as a bridge to a longer term climate goalTarget setting plus regular review could serve as important anchor for medium-term policy expectations, facilitating long-term investmentsA globally-agreed interim target could serve as means of integrating across a fragmented international policy regimeUseful additional analysis:
Implications of different metrics for an interim target: what medium-term conditions would position us best for the second half of the century?Costs and political feasibility of different interim targetsImplications of interim targets for shorter-term actions


![[PPT]12 Guideposts of Auditions - Administrationpebblebrookhigh.typepad.com/files/12-guideposts-of... · Web view12 Guideposts of Auditions Michael Shurtleff Side # 1 A: Hey mom.](https://static.documents.pub/doc/80x56/5adec9427f8b9a9a768eac1a/ppt12-guideposts-of-auditions-administr-view12-guideposts-of-auditions-michael.jpg)


