22
LIFE09 ENV/FI/575 AB SOILS 1/22 Ramboll Finland Oy FI reg.no. 0101197-5, Domicile Espoo Intermediate Report of Materials 2

LIFE09 ENV/FI/575 ABSOILS
1/22
Ramboll Finland Oy
FI reg.no. 0101197-5, Domicile Espoo
Intermediate Report of Materials 2
LIFE09 ENV/FI/575 ABSOILS – INTERMEDIATE REPORT OF MATERIALS
2/22
Table of Contents
1. Introduction ........................................................................................... 3
2. Methods .................................................................................................. 3
3. Materials................................................................................................. 5
4. Stabilisation Results .............................................................................. 12
4.1 Arcada stabilisation test results.................................................. 12
4.2 Dog Park test results ................................................................ 15
4.3 Jätkäsaari test results .............................................................. 18
4.4 Länsisalmi test results .............................................................. 19
5. Conclusion ............................................................................................. 22
LIFE09 ENV/FI/575 ABSOILS – INTERMEDIATE REPORT OF MATERIALS
3/22
1. Introduction
This intermediate material report represents the results of three pilot sites ensured to be built during 2011–2012 and the results of one possible pilot which is not after all built with stabilised abandoned soils.
The first pilot site is Arcada 2 where a light weight structure is made by stabilising abandoned soil material. The construction work on the site started in the beginning of 2011 and was finished 2011. The material testing was continuous as the sources for the abandoned soils changes.
The second pilot site is in Helsinki in Jätkäsaari where dredged sediments were stabilised in 2011-2012 and the stabilised sediments were then moved to a near-by site where was utilised in a park structure. Also some of the stabilised sediments were used in the cover structures of landfilling sites.
The third pilot is a dog park which is built 2012 on a flooding area. On the site the ground level is raised with abandoned soils and the new soil material and the old soil is mass stabilised. This report represents the results of the material tests conducted.
The fourth possible pilot site was in Vantaa in Länsisalmi where a new field storage area could have been constructed by using mass stabilisation of soil material. However the site has utilised some other materials and is no longer a Absoils site.
3.0 version of the report has some new results for Dog Park and Jätkäsaari site. New samples has been gathered from the sites and the stabilisation tests have been renewed in order to ensure the amount of binder needed in the sites.
2. Methods
The water content of a material is the ratio of the quantity of water removed from the wet material (mm) in the course of drying in an oven up to a constant mass value (md). The general drying temperature is 105 °C. The calculation is done according to formula below
%100dm
dmmmw
Loss of Ignition (LoI) describes the content of the organic matter of the material. This can be characterised by the weight loss a dried material sample (md) will suffer in the course of heating as the organic matter will be combusted and lost at a very high temperature (550 / 800 °C for at least 1 hour). The residual mass is mi. This weight loss is expressed in dry weight percentage, and called Loss of Ignition (LoI):
%100i
d
d
mmmLoI
LIFE09 ENV/FI/575 ABSOILS – INTERMEDIATE REPORT OF MATERIALS
4/22
pH is determined by mixing 10 g of dry sample with 50 g of water and letting it settle for 2-4 hours. After settling the solution is mixed again and the pH is measured with the pH instrument.
Particle Size Distribution will be determined by sieving and/or by a sedimentation tests. For example, in the (dry or wet) sieving procedure a dried sample is poured through sieves of different grades (e.g. 2, 0,063 mm …). The total quantity of fine particles (e.g. <0,063 mm) can be calculated from the difference with respect to the masses passing the grades (mostly with wet sieving). In a sedimentation test, or the Areometer test, the grain size is determined on the basis of the settling rate of the particles in a liquid (according to Stokes’ Law). The settling rate is measured by a specific gravity hydrometer, which is placed on a prefabricated solution on certain intervals. The maximum grain size in sedimentation test is 2 mm and. for some materials the sieving with 2 mm sieve is needed. If the sample contains more than 2 % of organic matter, it should be treated with hydrogen peroxide to eliminate organic matter.
Density control for Arcada samples is done by adding a determined amount of water to the sample which is then homogenised. The density of the sample is measured by filling a cylinder with known mass and volume with the sample and weighting the total system. The density of the sample is calculated by dividing the mass of the sample inside the cylinder with the volume of the cylinder.
Preparation of the aggregate specimens. The preparation of the specimens begins with calculation of the amounts of binders mixed with the aggregate (clay, dredged sediment ect.). Usually several different binder amount is tested especially in unconfined compression strength test to determine the most suitable binder mixture for the construction. The aggregate and the binders are mixed in laboratory mixer for 2 minutes. After mixing the mixture is compacted in to a cylinders having uniform diameter (42…50 mm) and the cylinders are put in to plastic bags to prevent the drying of the specimens. For the first two days the specimens are kept in room temperature after which the specimens are put in refrigerator (+8 oC) to stabilise. The specimens can also be thermally treated in which the specimens are stored in thermally insulated in +30oC temperature. Usually the stabilisation time is 28…90 days for normally treated specimens and 3…14 days for thermally treated specimens, but the stabilisation method and time is determined separately for every material. The target of thermal treatment is to find out the potential maximum unconfined compressive strength of the material, but usually it is not recommended to use the values in designing the actual structures. Before testing the unconfined compressive strength the specimen is cut so that the height of the specimen is twice the diameter of the specimen.
Unconfined Compressive Strength, UCS, is a standard test where a cylindrical test piece is subjected to a steadily increasing axial load until failure occurs. The axial load is the only force or stress applied. The rate of the load is 1 - 2 mm/min depending on the type of material tested. If any noticeable failure does not occur, the maximum value of the compression strength is taken when the deformation (change of height) is 15 %. Usually, the test will be made on test pieces after 28-90 days stabilisation. The Figure 1 below shows the test in progress.

LIFE09 ENV/FI/575 ABSOILS – INTERMEDIATE REPORT OF MATERIALS
5/22
Figure 1 Unconfined compressive test in progress. Ramboll Finland Oy.
3. Materials
In all material tests the water content and loss of ignition were studied. In addition in some of the material tests also the density and the soil class were studied. The results of Arcada 2 materials tests are represented on Table 1.
Table 1. Arcada 2 materials
Sample
Water content w [%]
Loss of ignition LOI [%]
Particle size
distribution
Density of the delivered sample in container / homogenized sample
[kg/m3] Korpitie 1/1 31,4 2,8 - 1450 / 1880 Korpitie 1/2 32,6 2,8 - 1370 / - Korpitie 1/3 33,1 4,4 - 1380 / -
Koivukylä 31,1 4,8 - 1500 / 1820
Korpitie 15,5 - Cl 1200 / 1740 Piloting site/basin 3 67,1 - clSi 1600 / -
Korpitie alue 4/1 1,5m 62,9 - Cl - / 1600
Korpitie alue 4/2 1,5m 32,9 - Cl - / 1820
LIFE09 ENV/FI/575 ABSOILS – INTERMEDIATE REPORT OF MATERIALS
6/22
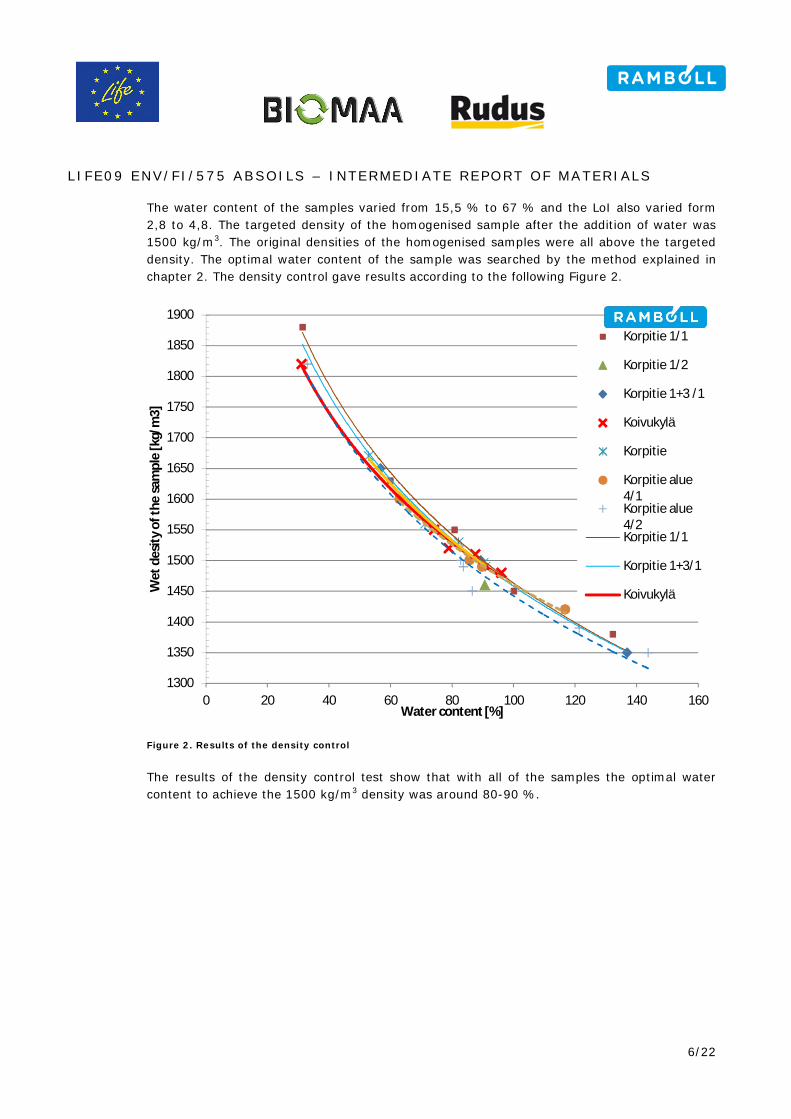
The water content of the samples varied from 15,5 % to 67 % and the LoI also varied form 2,8 to 4,8. The targeted density of the homogenised sample after the addition of water was 1500 kg/m3. The original densities of the homogenised samples were all above the targeted density. The optimal water content of the sample was searched by the method explained in chapter 2. The density control gave results according to the following Figure 2.
Figure 2. Results of the density control
The results of the density control test show that with all of the samples the optimal water content to achieve the 1500 kg/m3 density was around 80-90 %.
1300
1350
1400
1450
1500
1550
1600
1650
1700
1750
1800
1850
1900
0 20 40 60 80 100 120 140 160
Wet
des
ity o
f the
sam
ple
[kg/
m3]
Water content [%]
Korpitie 1/1
Korpitie 1/2
Korpitie 1+3 /1
Koivukylä
Korpitie
Korpitie alue4/1Korpitie alue4/2Korpitie 1/1
Korpitie 1+3/1
Koivukylä

LIFE09 ENV/FI/575 ABSOILS – INTERMEDIATE REPORT OF MATERIALS
7/22
The properties of the first samples of the dog park clay are presented on the table below.
Table 2. Dog park firs samples 2011
Sample Water content
w [%] Density m [kg/m3]
Loss of ignition LoI [%]
Visual evaluation of soil class
0-1 m 88,8 1460 9,6 organic clay 1-2 m 111 1400 5,9 organic clay 2-3 m 103 1440 3,6 organic clay
The water content of the samples was around 100 % and the densities varied from 1400 to 1460 kg/m3. The LOI value was higher in the ground surface but decreased towards the deeper layers.
Second samples were taken from the dog park later about a year after the first samples (2012). The properties of the second samples are presented on the table below.
Table 3. Dog park second samples 2012
Sample Water content
w [%] Density m [kg/m3]
Loss of ignition LoI [%]
Visual evaluation of soil class
0-1 m 77,0 1540 4,2 osrganic clay
1-2 m 93,5 1480 3,6 organic clay
2-3 m 42,7 1800 1,7 clay
n. 3.8 m 30,3 1960 0,9 silt
The water contents of the samples were lower than of the first samples and also the LoI was significantly lower. The densities of the second samples were higher than of the first samples.

LIFE09 ENV/FI/575 ABSOILS – INTERMEDIATE REPORT OF MATERIALS
8/22
The properties of the Jätkäsaari sediments 2011 are presented on the table below.
Table 4. Jätkäsaari materials 2011
Sample Water content
w [%] Density m [kg/m3]
Loss of ignition LOI [%] pH
1 / 2-5 m 103 1450 3,8 8,1 1 / 5-8 m 89,1 1510 3,5 8,1 2 / 2.5-4.5 m 106 1440 3,8 8,0 2 / 7-9 m 82,7 1530 3,1 8,3 3 / 2-4 m 121 1410 3,9 8,0 3 / 5-7 m 73,0 1570 2,7 8,3 3 / 8-10 m 65,4 1610 2,6 8,3 4 / 1-2 m 119 1410 4,2 8,0 4 / 2.5-3.5 m 131 1370 4,5 8,0 5 / 2-3 m 111 1420 4,1 7,9 5 / 4.5-5.5 m 86,3 1510 3,6 8,2 5 / 7-8 m 111 1400 4,6 8,3
The water content of the samples varied form 65 % to 131 % and was on average about 100 %. The density of the samples varied between 1370 and 1610 kg/m3. The lowest LOI (2,6) that the driest sample and the higher LOIs (4,5…4,6) had the wetter samples. The pH of the samples was around 8. The samples that are bolded were used in stabilisation tests.
New samples from the Jätkäsaari stabilization basins were taken before stabilization in order to find out the suitable binder amount needed. The sampling points are presented in Figure 3.
Figure 3. Jätkäsaari sampling points 2012 (black circles)

LIFE09 ENV/FI/575 ABSOILS – INTERMEDIATE REPORT OF MATERIALS
9/22
The properties of the new Jätkäsaari sediments 2012 are presented on the
Table 5.
Table 5. Jätkäsaari materials 2012
Sample Water content Loss of ignition Depth [m] [%] LOI[ % ]
1
0,5 89,5 3,5 1,5 84,2 3,4 2,5 83,3 3,2 3,5 77,2 3,2
2 81,1 3,4 3 71,2 3,2 4 79,7 2,9 5 69,2 3,2 6 54,1 2,9 7 80,4 3,1
8
0,5 79,8 3,0 1,5 65,9 2,9 2,5 70,9 2,9 3,5 67,7 2,9
9 58,0 3,0
10
0,5 87,7 3,3 1,5 86,7 3,5 2,5 73,0 3,3 3,5 82,2 3,5
11 65,9 3,4 12 73,4 3,2 13 66,1 3,4 14 91,2 3,7
15
0,5 96,2 4,1 1,5 81,4 3,8 2,5 82,7 3,4 3,5 66,8 3,6
16
0,5 104 4,0 1,5 99,1 3,7 2,5 112 4,2 3,5 108 3,9
17 91,3 3,9 18 85,4 3,8
19 0,5 28,8 1,6 1,5 32,2 1,5 2,5 55,7 3,1
20 26,1 1,3 21 159 8,7 22 111 4,9

LIFE09 ENV/FI/575 ABSOILS – INTERMEDIATE REPORT OF MATERIALS
10/22
The water contents of the samples varied from 70 to 90 % from sampling point 1–15 with few samples over and under those variation limits. The sampling point 16, 21 and 22 had over 100 % water contents and the sampling points 19 and 20 had really low water contents 20–56 %. The LOI level was around 3 % with most of the samples only a few samples of lower or higher LOI. The samples from sampling point 19 and 20 had the lowest LOIS and the sampling point 21 had the highest LOI which is consistent with the water contents. All of the samples were clays except for the two last samples which included organic matter as well.
The results of Länsisalmi material tests are shown in the Table 6.
Table 6. Sample materials from Länsisalmi
Sample Water content
w [%] Loss of Ignition
LOI [%] Sample 1 Sample 2 Sample 1 Sample 2 P8, 2.5-3.5 m / 1st batch 47,4 1 56,2 1 2,9 4,2 P8, 2.5-3.5 m / 2nd batch 44,5 2 61,5 2,8 3,7 P8, 5.5-6.5 m / 1st batch 49 62,7 3 3,2 3,8 P8, 5.5-6.5 m / 2nd batch 62,4 3 3,3 P18, 4-5 m / 1st batch 75,8 4 -
The samples used in the stabilisation studies are marked in the table with numbers. The number 1 (P8 2.5-3.5m / 1st batch) samples were mixed together. The number 3 (P8 5.5-6.5m) 1st batch sample was mixed with 2nd batch. The samples 2 and 4 were used alone in the stabilisation tests. All of the materials were silt/clay with water content between 44 and 76 % and loss of ignition between 2,8 and 4,2 %. The number 1 samples are named in the results as P8 / "top layer" (mixture Cl+Si), the number 2 samples are named as "coarse top layer", the number 3 samples are named as P8 / 5.5-6.5 m and the number 4 samples as P18 / 4-5 m.

LIFE09 ENV/FI/575 ABSOILS – INTERMEDIATE REPORT OF MATERIALS
11/22
The binders used in the stabilisation tests of the samples are represented on Table 7.
Table 7. Binders used in the stabilisation tests
Abbreviation Binder type Producer
Cem Portland cement (CEM II/A-M(S-LL) 42,5 N) Finnsement Oy CemPlus Portland cement (CEM II/B-M(S-LL) 42,5N) Finnsement Oy KC / KC 3:7 Mixture of CaO and Portland cement on
ratio 3:7 Nordkalk Oyj
GTC Mixture of gypsum, hydrated lime and Portland cement
Nordkalk Oyj
FAHana Dry fly ash from Hanasaari Power plant Helsingin Energia SRPHana Sulphur removal product from Hanasaari
Power plant Helsingin Energia
FA Dry fly ash from Inkoo Power Plant Fortum Power and Heat Inkoo wet ash (25%/1w)
Wet fly ash (moisture one week before use to 25 % water content) from Inkoo Power Plant
Fortum Power and Heat
gyp. Gypsum from the production of phosphoric acid
Yara Suomi Oy

LIFE09 ENV/FI/575 ABSOILS – INTERMEDIATE REPORT OF MATERIALS
12/22
4. Stabilisation Results
4.1 Arcada stabilisation test results
2011
The stabilisation potential of the Arcada materials was studied first with one binder. Only cement was used as a binder in this case because of the tight schedule of the work. The effect of the wet density to the compressive strength was studied with Korpitie samples 1+3 mixed in 1:1 proportion and with Cem 100 kg/m3 of binder. The results can be seen in the Figure 1.
Figure 4. The effect of the wet density to the compressive strength with Cem 100 kg/m3 used as a binder.
In the figure it can be seen that when the wet density increases also the compressive strength increases. This is logical as the water content decreases when the density of the soil increases (see Figure 2).
For the stabilisation tests of different kinds of soils the density of 1500 kg/m3 was chosen for the stabilisation test, except the piloting site sample which was mixed in the piloting site with the water and delivered to the laboratory in that density. The density of the Piloting site sample was 1600 kg/m3. The results of the Arcada 2 stabilisation tests are represented on
0
100
200
300
400
500
600
700
800
1350 kg/m3 1500 kg/m3 1650 kg/m3
28 d
Com
pres
sive
stre
ngth
[kPa
]
Wet density of the soil

LIFE09 ENV/FI/575 ABSOILS – INTERMEDIATE REPORT OF MATERIALS
13/22
Table 8.

LIFE09 ENV/FI/575 ABSOILS – INTERMEDIATE REPORT OF MATERIALS
14/22
Table 8. The results of stabilisation test with Arcada 2 materials.
Sample Used Binder
Binder Amount [kg/m3]
Compressive strenght [kPa] 7vrk 28 vrk
Koivukylä Cem 100 < 10 1) < 10 1) Korpitie Cem 100 101 127 Piloting site/basin 3 Cem 100 322 428
Korpitie alue 4/1 1,5m Cem 100 583 747
Korpitie alue 4/2 1,5m Cem 100 502 662 1) No strength development
The compressive strength of different samples varied a lot. The first sample didn’t stabilise at all and wasn’t used in the stabilisation. The best compressive strength result was 747 kPa. These results show how important it is to run the stabilisation test for each soil material separately, because the variation of the results, even if the density and the water contents of the materials are approximately the same.
The stabilisation tests were made also using fly ash and sulphur removal products with the Korpitie sample mixture used in the first studies. The results of the testing are shown in Figure 5.
Figure 5. Arcada stabilisation tests with by products.
0
50
100
150
200
250
80 40+150 50+75 50+150 60+100 40+150 50+75 50+150 60+100 50+150 50+150
Cem Cem + FAHana Cem + (FAHana + SRPHana 1:1) Cem +(FAHana
+SRPHana
1:2)
Cem +(FAHana
+SRPHana
2:1)
Com
pres
sive
stre
ngth
[kPa
]
7 d 28 d 90 d

LIFE09 ENV/FI/575 ABSOILS – INTERMEDIATE REPORT OF MATERIALS
15/22
The figure shows that good results were achieved with by-products. It can be seen that it is beneficial to use sulphur removal product in the stabilisation which improves specially the long term strength development. No differences can be noted when the proportion of fly ash and sulphur removal product is altered.
4.2 Dog Park test results
2011
The targeted compressive strength for the Dog park material was around 60-80 kPa. The Dog park stabilisation tests were done first with a mixture of samples from layers 0-2m and only some binder mixture samples were done with the separate layer samples 0-1 m, 1-2m and 2-3m. The reason for the small scale testing was that there was no information about the quality of the additional soil, brought on site for filling. The separate layer stabilisation tests were done in order to find out if the layers had any differences in the strength development properties. The results of the stabilisation test of the mixture sample are represented in Figure 6.
Figure 6. Stabilisation test results of sample mixture from 0m to 2m.
On the basis of the figure the targeted strength can be achieved with the tested binders. The amount of cement needed for the stabilization would be about 70-80 kg/m3. With KC the needed binder amount is 70 kg/m3. Fly ash increases the compressive strength of the cement but the cement amount must be over 60 kg/m3. The mixture of FA and SRP gives similar compressive strengths as Cem+FAHana. Both of the fly ashes worked similarly. The utilization of the wet ash and mixture of wet ash and SRP decresed the compressive strengths. Fly as mixed with KC doesn’t increase the compressive strength but the use of SRP

LIFE09 ENV/FI/575 ABSOILS – INTERMEDIATE REPORT OF MATERIALS
16/22
could be beneficial. The utilization of gypsum with KC gives great results and even a smaller amount of KC could work with gypsum. This would be beneficial as the total amount of binder would decrease, bringing financial benefit for the stabilization. The mixture of KC+FAHana+SRPHana gave poor compressive strength results compared with the total amount of the binders. Also GTC gave poor results.
These results give some idea about which mixtures work the better. However the results might change after the results of the 90 days compressive strengths as some of the binders tend to have slow strength development properties. For example gypsum and sulphur removal product usually increases the compressive strength after 28 days and even after one year.
On the Figure 7 are represented the results of all of the layers separately to find out the common differences between the layers according to the strength development and needed binder amount.
Figure 7. Stabilisation test results of different soil layers.
The results in Figure 7 show that the top layer of the soil has lower compressive strengths than the layers below it. The top layers had also higher LoI which might affect the compressive strength result. The layer 2-3m has the best compressive strengths and the lowest LoI, which means that there a lower amount of binders are needed compared with the upper layers. Gypsum is beneficial when it is used in small amounts.
0
100
200
300
400
500
600
80 60+100 80+100 60+50 60+30 80 50+100 80 50+100 80 50+100
Cem Cem+FAHana
KC 3:7+SRPHana
KC 3:7+gyp.
Cem Cem+FAHana
Cem Cem+FAHana
Cem Cem+FAHana
Mixture 0-2 m (Density 1420 kg/m3) 0-1 m 1-2 m 2-3 m
First samples
28 d
com
pres
sive
stre
ngth
[kPa
]
28 d 90 d
LIFE09 ENV/FI/575 ABSOILS – INTERMEDIATE REPORT OF MATERIALS
17/22
2012
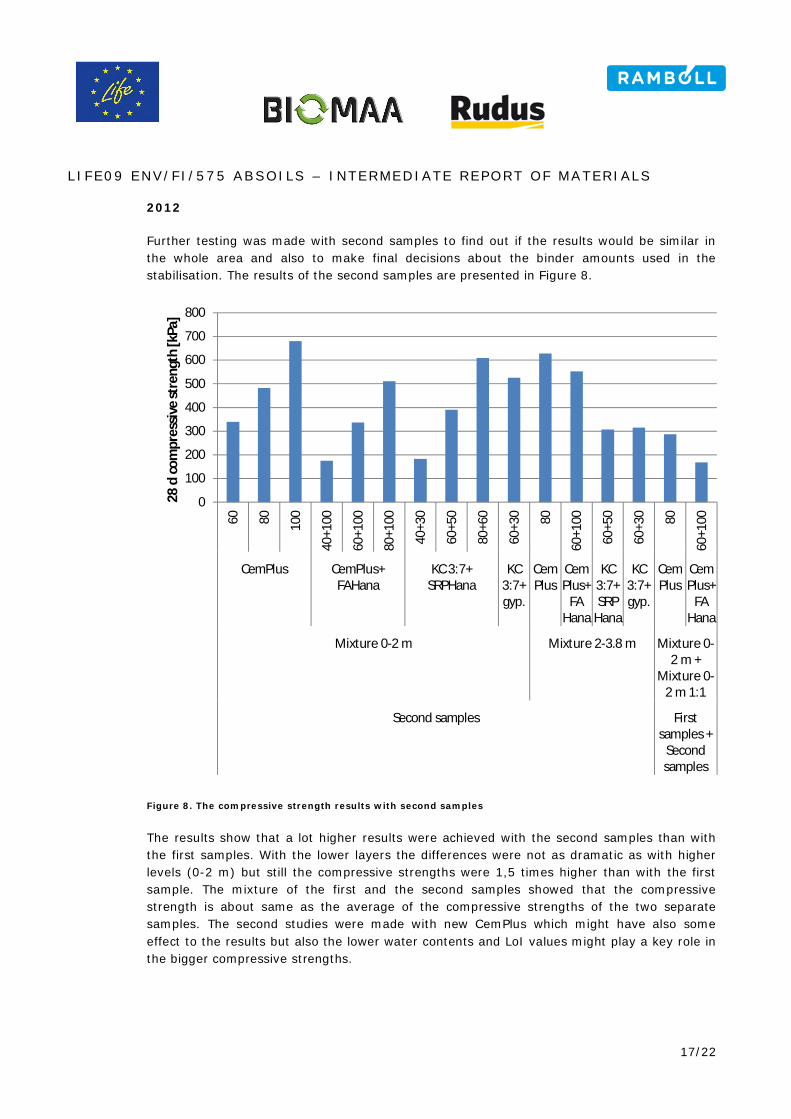
Further testing was made with second samples to find out if the results would be similar in the whole area and also to make final decisions about the binder amounts used in the stabilisation. The results of the second samples are presented in Figure 8.
Figure 8. The compressive strength results with second samples
The results show that a lot higher results were achieved with the second samples than with the first samples. With the lower layers the differences were not as dramatic as with higher levels (0-2 m) but still the compressive strengths were 1,5 times higher than with the first sample. The mixture of the first and the second samples showed that the compressive strength is about same as the average of the compressive strengths of the two separate samples. The second studies were made with new CemPlus which might have also some effect to the results but also the lower water contents and LoI values might play a key role in the bigger compressive strengths.
0
100
200
300
400
500
600
700
800
60 80 100
40+1
00
60+1
00
80+1
00
40+3
0
60+5
0
80+6
0
60+3
0 80
60+1
00
60+5
0
60+3
0 80
60+1
00
CemPlus CemPlus+FAHana
KC 3:7+SRPHana
KC3:7+gyp.
CemPlus
CemPlus+
FAHana
KC3:7+SRP
Hana
KC3:7+gyp.
CemPlus
CemPlus+
FAHana
Mixture 0-2 m Mixture 2-3.8 m Mixture 0-2 m +
Mixture 0-2 m 1:1
Second samples Firstsamples +
Secondsamples
28 d
com
pres
sive
stre
ngth
[kPa
]
LIFE09 ENV/FI/575 ABSOILS – INTERMEDIATE REPORT OF MATERIALS
18/22
4.3 Jätkäsaari test results
2011
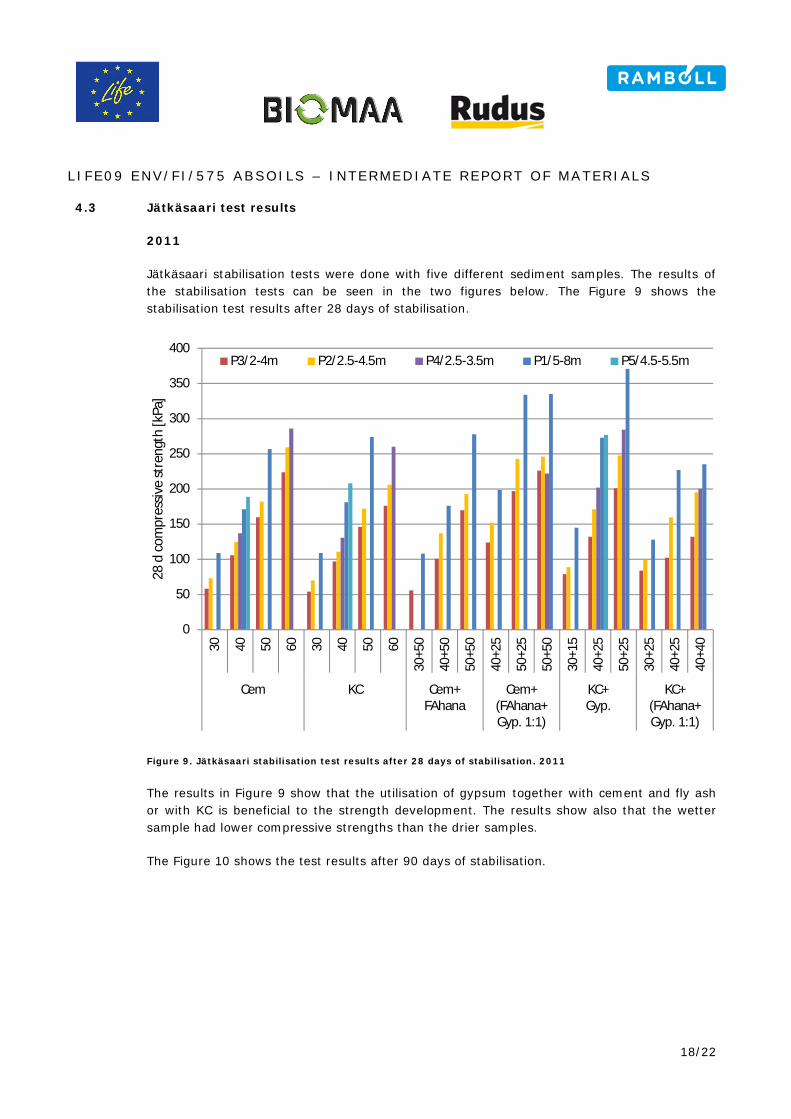
Jätkäsaari stabilisation tests were done with five different sediment samples. The results of the stabilisation tests can be seen in the two figures below. The Figure 9 shows the stabilisation test results after 28 days of stabilisation.
Figure 9. Jätkäsaari stabilisation test results after 28 days of stabilisation. 2011
The results in Figure 9 show that the utilisation of gypsum together with cement and fly ash or with KC is beneficial to the strength development. The results show also that the wetter sample had lower compressive strengths than the drier samples.
The Figure 10 shows the test results after 90 days of stabilisation.
0
50
100
150
200
250
300
350
400
30 40 50 60 30 40 50 60
30+5
0
40+5
0
50+5
0
40+2
5
50+2
5
50+5
0
30+1
5
40+2
5
50+2
5
30+2
5
40+2
5
40+4
0Cem KC Cem+
FAhanaCem+
(FAhana+Gyp. 1:1)
KC+Gyp.
KC+(FAhana+Gyp. 1:1)
28 d
com
pres
sive
stre
ngth
[kPa
]
P3/2-4m P2/2.5-4.5m P4/2.5-3.5m P1/5-8m P5/4.5-5.5m

LIFE09 ENV/FI/575 ABSOILS – INTERMEDIATE REPORT OF MATERIALS
19/22
Figure 10. Jätkäsaari stabilisation test results after 90 days of stabilisation. 2011
The results in Figure 10 show that significant strength development occurs after 28 days of stabilisation. The best binder options are according to these results was Cem+FAhana+Gyp and KC+Gyp. mixtures which give the best compressive strengths with low binder amounts. Also 6 month samples are made from these materials which show how much the strength will increase in the longer run. At least 10 kg/m3 of cement could be replaced by using gypsum or fly ash gypsum mixture and hopefully the 6 month results will reveal if even less cement could be utilised in the project.
2012
The stabilisation tests were renewed for the new samples. The stabilisation tests were done with only Portland cement (CemPlus) and for all points. The points with separate samples from different layers were homogenised so that the different layers were mixed together. The curing time of the samples was 28 days. The results are presented in Figure 11 and 12.
0
100
200
300
400
500
60030 40 50 60 30 40 50 60
30+5
0
40+5
0
50+5
0
40+2
5
50+2
5
50+5
0
30+1
5
40+2
5
50+2
5
30+2
5
40+2
5
40+4
0
Cem KC Cem+FAhana
Cem+(FAhana+Gyp. 1:1)
KC+Gyp. KC+(FAhana+Gyp. 1:1)
90 d
com
pres
sive
stre
ngth
[kPa
]
P3/2-4m P2/2.5-4.5m P4/2.5-3.5m P1/5-8m P5/4.5-5.5m

LIFE09 ENV/FI/575 ABSOILS – INTERMEDIATE REPORT OF MATERIALS
20/22
Figure 11. The stabilisation test results of Jätkäsaari 2012 samples 1–12
Figure 12. The stabilisation test results of Jätkäsaari 2012 samples 13–22
The results show that all of the samples had good strength development properties, even the high LOI content samples. The targeted compressive strength level was about 150 kPa and the needed binder amount to achieve that is about 40–50 kg/m3.
0
100
200
300
400
500
600
point 1 point 2 point 3 point 4 point 5 point 6 point 7 point 8 point 9 point 10 point 11 point 12
Com
pres
sive
stre
ngth
[kPa
]
40 kg/m3 60 kg/m3 80 kg/m3
0
100
200
300
400
500
600
700
point 13 point 14 point 15 point 16 point 17 point 18 point 19 point 20 point 21 point 22
Com
pres
sive
stre
ngth
[kPa
]
40 kg/m3 60 kg/m3 80 kg/m3
LIFE09 ENV/FI/575 ABSOILS – INTERMEDIATE REPORT OF MATERIALS
21/22
4.4 Länsisalmi test results
2011
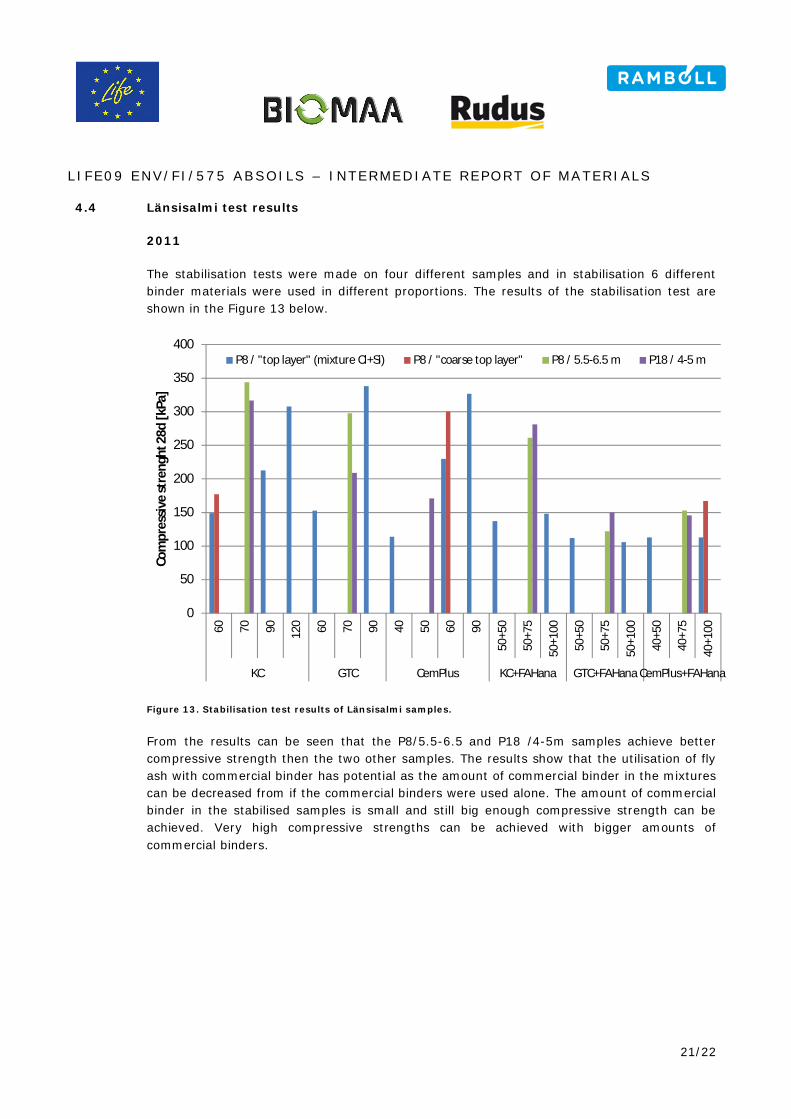
The stabilisation tests were made on four different samples and in stabilisation 6 different binder materials were used in different proportions. The results of the stabilisation test are shown in the Figure 13 below.
Figure 13. Stabilisation test results of Länsisalmi samples.
From the results can be seen that the P8/5.5-6.5 and P18 /4-5m samples achieve better compressive strength then the two other samples. The results show that the utilisation of fly ash with commercial binder has potential as the amount of commercial binder in the mixtures can be decreased from if the commercial binders were used alone. The amount of commercial binder in the stabilised samples is small and still big enough compressive strength can be achieved. Very high compressive strengths can be achieved with bigger amounts of commercial binders.
0
50
100
150
200
250
300
350
400
60 70 90 120 60 70 90 40 50 60 90
50+5
0
50+7
5
50+1
00
50+5
0
50+7
5
50+1
00
40+5
0
40+7
5
40+1
00
KC GTC CemPlus KC+FAHana GTC+FAHana CemPlus+FAHana
Com
pres
sive
stre
nght
28d
[kPa
]
P8 / "top layer" (mixture Cl+Si) P8 / "coarse top layer" P8 / 5.5-6.5 m P18 / 4-5 m

LIFE09 ENV/FI/575 ABSOILS – INTERMEDIATE REPORT OF MATERIALS
22/22
5. Conclusion
The testing for the piloting has begun and good result have been achieved. In Arcada 2 and dog park pilot applications in total about 55 000m3 of abandoned soils are utilised instead of deposition to landfills. The stabilisation tests show that the utilisation of industrial by-products can be technically possible on all pilots.
In Arcada the best binder option by using by-products would be to use the mixture of cement, fly ash and sulphur removal product. In Dog Park and Jätkäsaari the gypsum showed the greatest potential of the by-products for stabilisation use together with KC. In Länsisalmi more stabilisation tests with 90 days compressive strengths are required in order to determine the best binder options. However at this point Länsisalmi will be made with other methods than by utilising the abandoned soils. The suitable binder amounts vary according to the sites.
The problems with the environmental permits have led to the utilisation of cement in stabilisations in Arcada and in Jätkäsaari, but hopefully new permits will allow the use of other products in Jätkäsaari.


