Number 2, Volume VII, July 2012 Jagelčák: Intermodal Road-Rail-Sea Load Distribution Diagram of Forty-Foot Container 51 INTERMODAL ROAD-RAIL-SEA LOAD DISTRIBUTION DIAGRAM OF FORTY-FOOT CONTAINER Juraj Jagelčák 1 Summary: This paper shows intermodal load distribution diagram of maritime container loaded on intermodal wagon and container chassis. Technical characteristics of container are compared with technical characteristics of the wagon and container chassis. Intermodal road – rail - sea load distribution diagram meets conditions of relevant transport modes specific to Europe. Key words: intermodal transport, load distribution diagram, cargo stowage, maritime container INTRODUCTION Construction of load distribution diagrams requires to fulfil not only the technical characteristics of maritime containers, wagons and vehicles but also various requirements defines by legislative measures, guidelines and standards. The paper focus is 40’ general purpose container defined according to the standard ISO 830 sec. 4.2.1.1 (1) as “general cargo container that is totally enclosed and weather-proof, having a rigid roof, rigid side walls, rigid end walls and a floor, having at least one of its end walls equipped with doors and intended to be suitable for the transport of cargo of the greatest possible variety”. Cargo center of gravity is important to know when loading containers. The standard ISO 830 in sec. 8.1.3 defines eccentricity of centre of gravity as follows: “longitudinal and/or lateral horizontal differences between the centre of gravity of any container (empty or loaded, with or without fittings and appliances) and the geometric centre of the diagonals of the centres of the four bottom corner fittings” (1). The container payload - P is defined according to the 5.3.3 of ISO 830 as „maximum permitted mass of payload, including such cargo securement arrangements and/or dunnage as are not associated with the container in its normal operating condition.“ (1) 1. GROSS MASS, PAYLOADS AND LOAD DISTRIBUTION IN GENERAL PURPOSE FORTY FOOT CONTAINERS Field analysis of maritime containers in intermodal terminals in Slovakia, Czech Republic and Sweden was performed to study load securing possibilities within maritime containers [cf. (4), (5), (6)]. 233 different models of forty foot general purpose maritime containers (types 42G0, 42G1, 45G0, 45G1) of different owners have been analysed. Detailed statistics of tare and payload of analysed containers are given in tables and figures below. 1 Ing. Juraj Jagelčák, PhD., University of Žilina, Faculty of Operation and Economics of Transport and Communications, Department of Road and Urban Transport, Univerzitná 8215/1, 010 26 Žilina; E-mail: [email protected]
Transcript
Number 2, Volume VII, July 2012
Jagelčák: Intermodal Road-Rail-Sea Load Distribution Diagram of Forty-Foot Container 51
INTERMODAL ROAD-RAIL-SEA LOAD DISTRIBUTION
DIAGRAM OF FORTY-FOOT CONTAINER
Juraj Jagelčák1
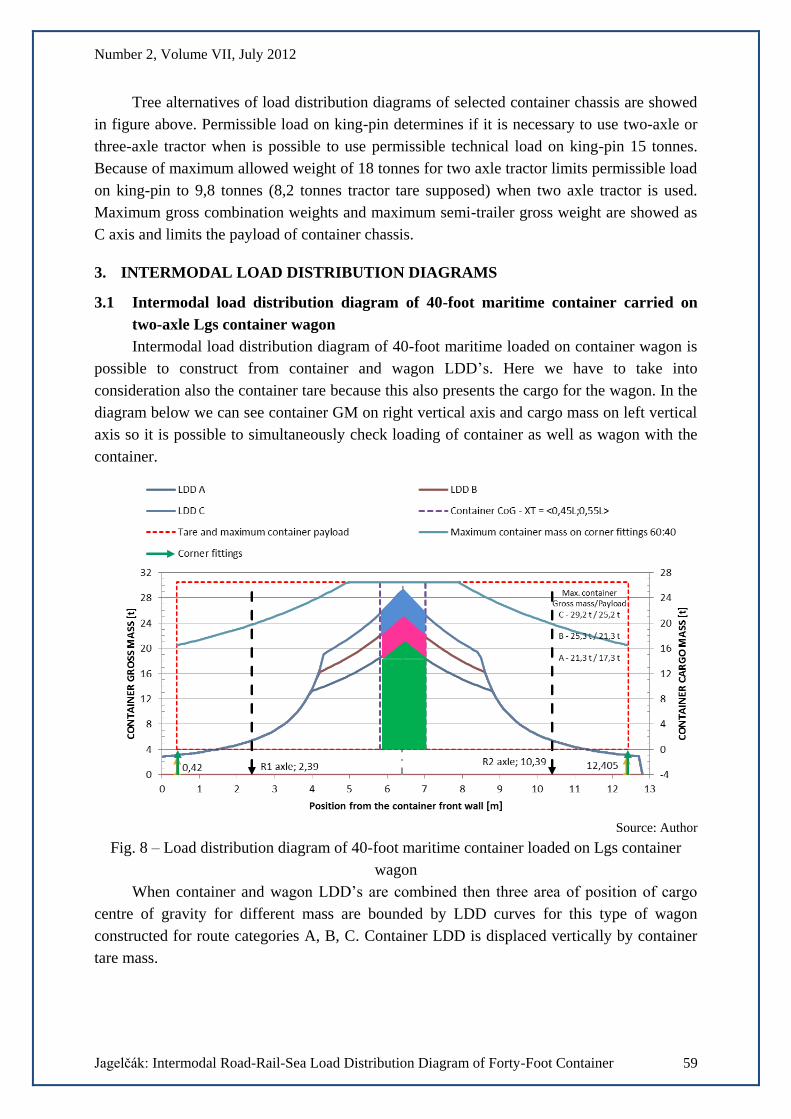
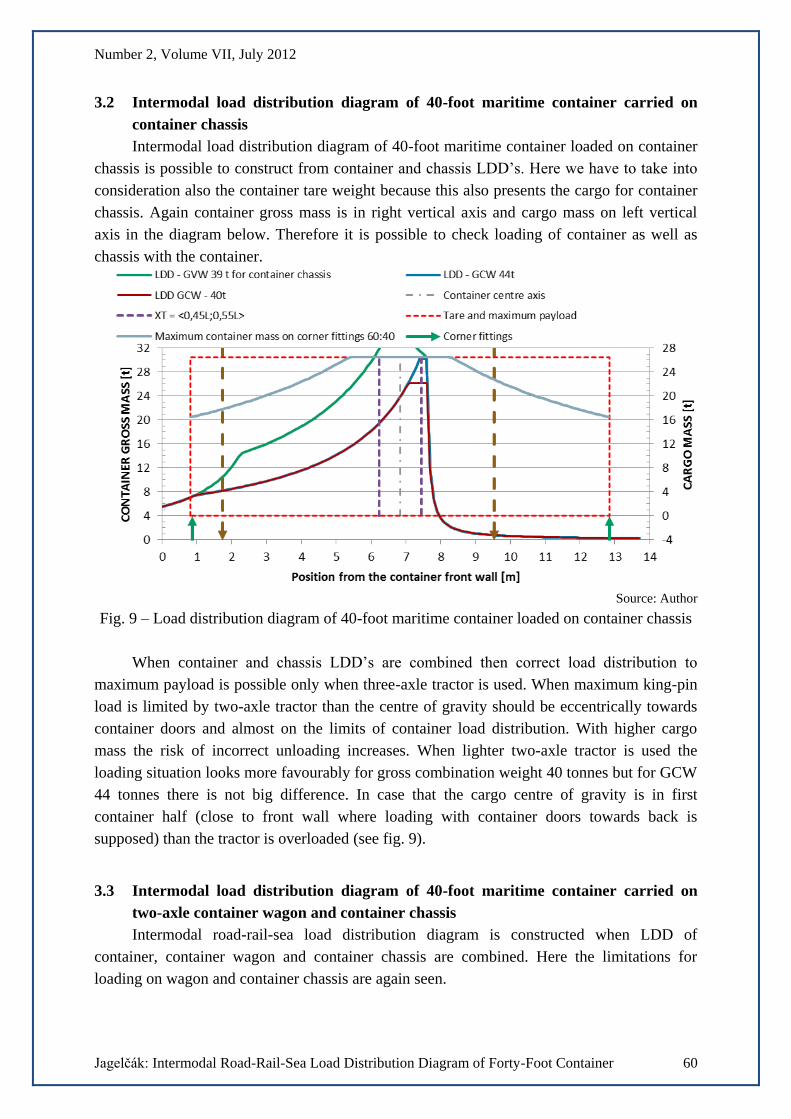
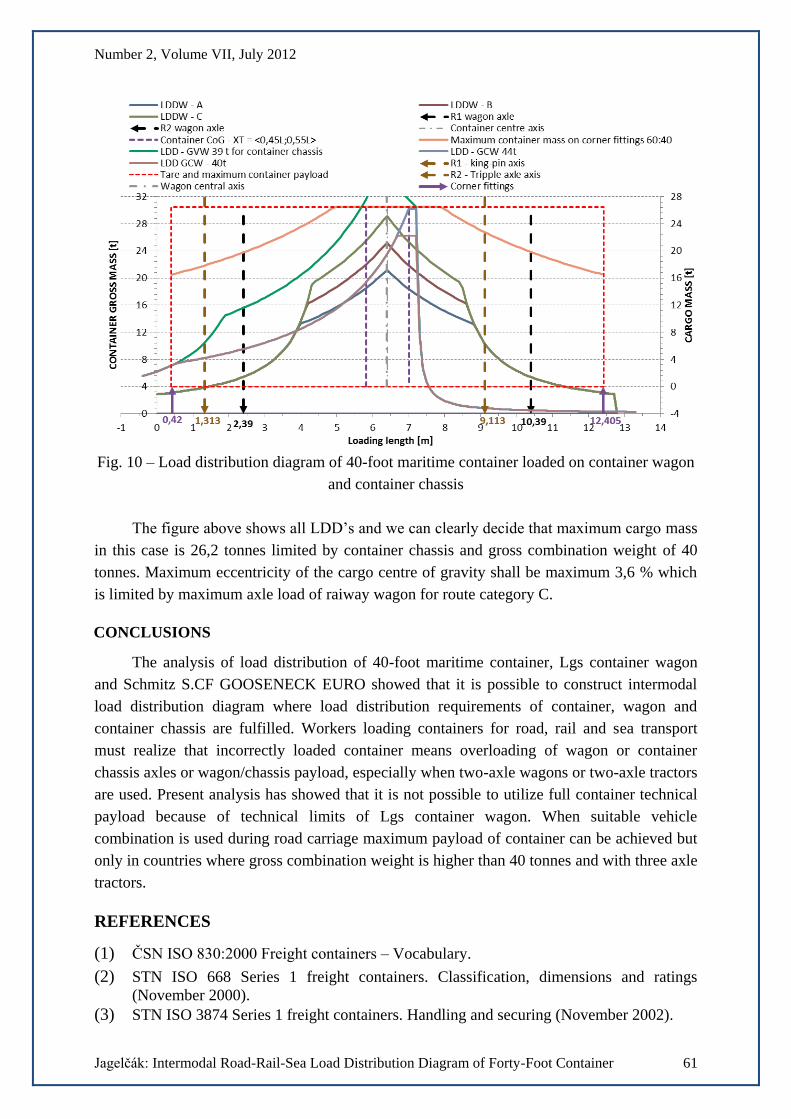
Summary: This paper shows intermodal load distribution diagram of maritime container
loaded on intermodal wagon and container chassis. Technical characteristics of
container are compared with technical characteristics of the wagon and container
chassis. Intermodal road – rail - sea load distribution diagram meets conditions of
relevant transport modes specific to Europe.
Key words: intermodal transport, load distribution diagram, cargo stowage, maritime
container
INTRODUCTION
Construction of load distribution diagrams requires to fulfil not only the technical
characteristics of maritime containers, wagons and vehicles but also various requirements
defines by legislative measures, guidelines and standards. The paper focus is 40’ general
purpose container defined according to the standard ISO 830 sec. 4.2.1.1 (1) as “general
cargo container that is totally enclosed and weather-proof, having a rigid roof, rigid side
walls, rigid end walls and a floor, having at least one of its end walls equipped with doors
and intended to be suitable for the transport of cargo of the greatest possible variety”.
Cargo center of gravity is important to know when loading containers. The standard
ISO 830 in sec. 8.1.3 defines eccentricity of centre of gravity as follows: “longitudinal and/or
lateral horizontal differences between the centre of gravity of any container (empty or loaded,
with or without fittings and appliances) and the geometric centre of the diagonals of the
centres of the four bottom corner fittings” (1).
The container payload - P is defined according to the 5.3.3 of ISO 830 as „maximum
permitted mass of payload, including such cargo securement arrangements and/or dunnage
as are not associated with the container in its normal operating condition.“ (1)
1. GROSS MASS, PAYLOADS AND LOAD DISTRIBUTION IN GENERAL
PURPOSE FORTY FOOT CONTAINERS
Field analysis of maritime containers in intermodal terminals in Slovakia, Czech
Republic and Sweden was performed to study load securing possibilities within maritime
containers [cf. (4), (5), (6)].
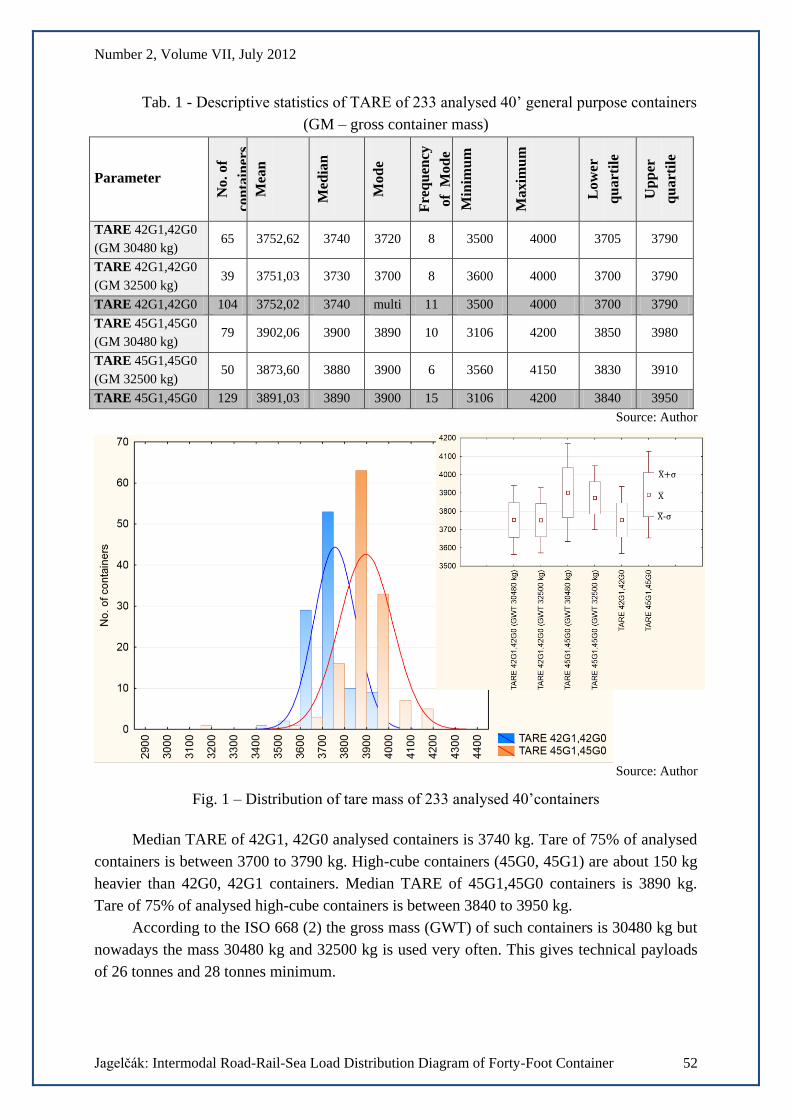
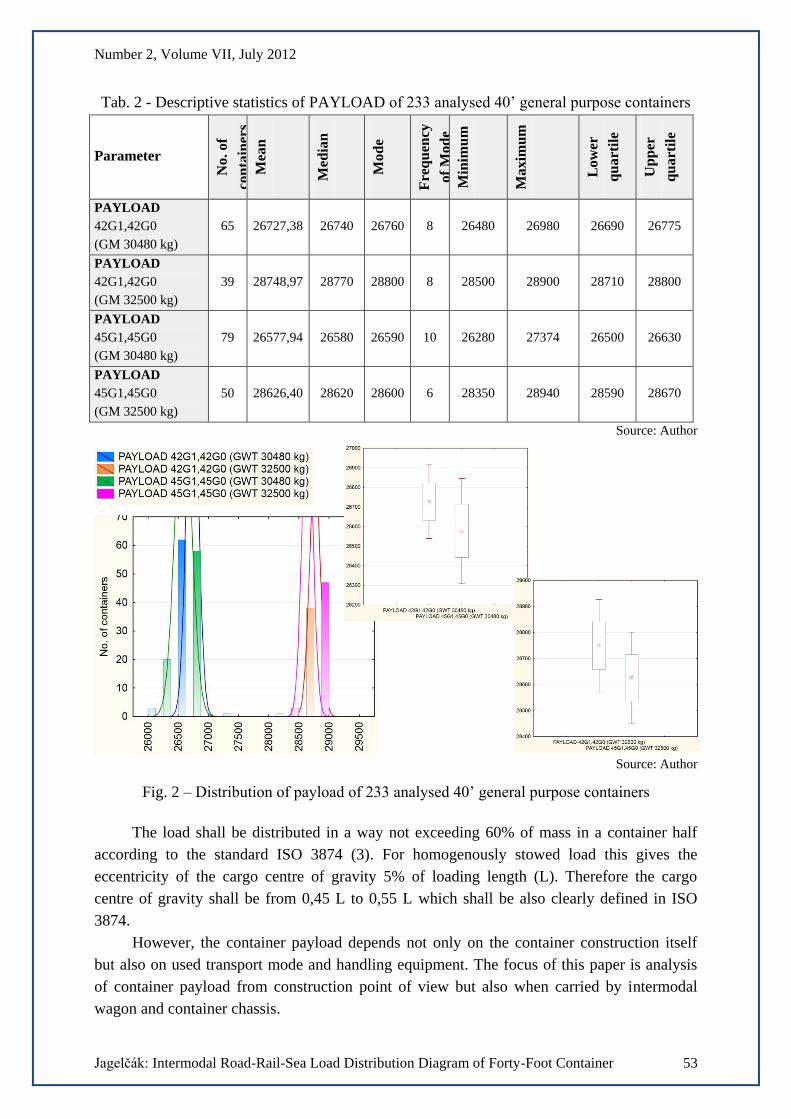
233 different models of forty foot general purpose maritime containers (types 42G0,
42G1, 45G0, 45G1) of different owners have been analysed. Detailed statistics of tare and
payload of analysed containers are given in tables and figures below.
1 Ing. Juraj Jagelčák, PhD., University of Žilina, Faculty of Operation and Economics of Transport and
Communications, Department of Road and Urban Transport, Univerzitná 8215/1, 010 26 Žilina;