23
Intermodulation distortion(IMD) & PureSignal™ BY NI0Z Copyright Mark Abraham 2017
Intermodulation
distortion(IMD) &
PureSignal™BY NI0Z
Copyright Mark Abraham 2017
Purpose
Break down IMD distortion into high-level laymen's terms
Understand IMD correlation to the noisefloor
Understand what IMD looks like on a pandadpter and waterfall display
Review IMD significance to the bands welfare
Briefly review PureSignal™
Provide example showing PureSignal™ in action
2
What is IMD Intermodulation distortion(IMD) is the amplitude modulation of signals containing
two or more different frequencies, caused by nonlinearities in a system.
Intermodulation is caused by non-linear behavior of the collective signal processing (physical equipment or even algorithms) being used.
Intermodulation is also rarely desirable in radio, as it creates unwanted spurious emissions, often in the form of sidebands. For radio transmissions this increases the occupied bandwidth, leading to adjacent channel interference, which can reduce audio clarity or increase spectrum usage.
IMD is only distinct from harmonic distortion in that the stimulus signal is different. The same nonlinear system will produce both THD (with a solitary sine wave input) and IMD (with more complex tones).
IMD is also distinct from intentional modulation (such as a frequency mixer in superheterodyne receivers) where signals to be modulated are presented to an intentional nonlinear element (multiplied).
3
Source – excerpts from https://en.m.wikipedia.org/wiki/Intermodulation
Intermodulation distortion in audio is usually specified as the root mean square (RMS) value of the various sum-and-difference signals as
a percentage of the original signal's RMS voltage, although it may be specified in terms of individual component strengths, in decibels,
as is common with RF work.
Relevance of Noisefloors
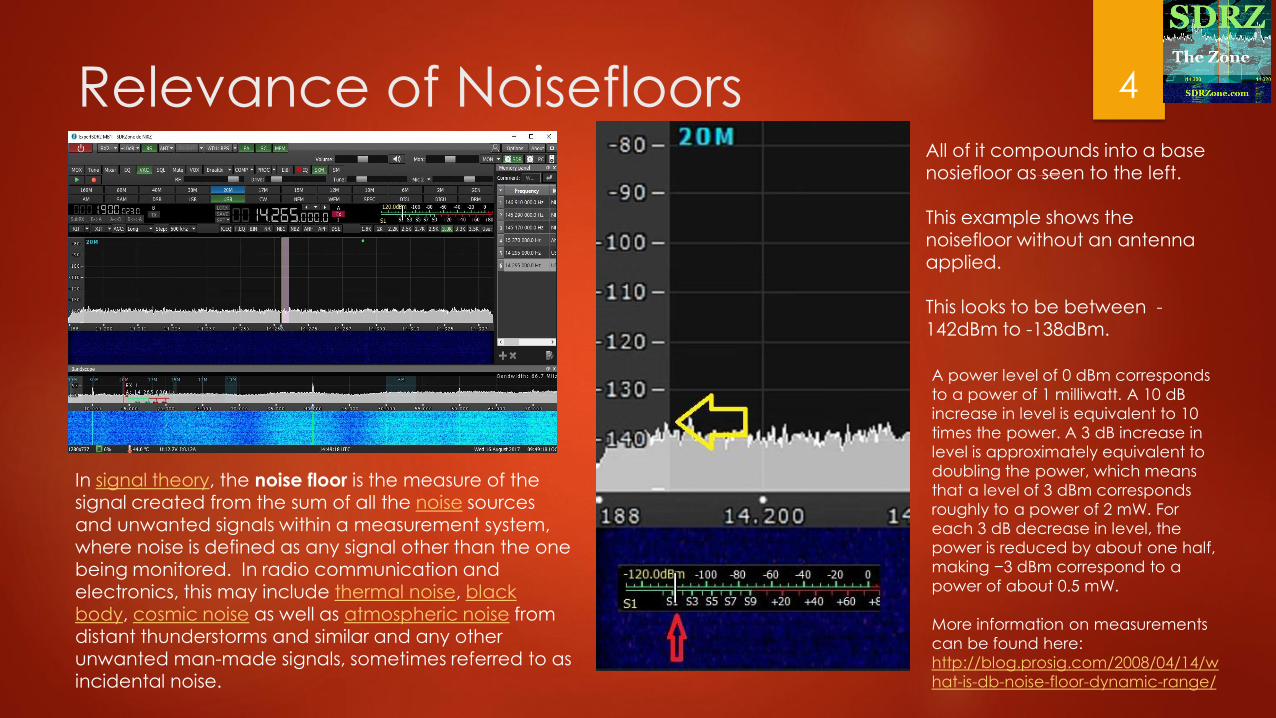
A power level of 0 dBm corresponds
to a power of 1 milliwatt. A 10 dB
increase in level is equivalent to 10
times the power. A 3 dB increase in
level is approximately equivalent to
doubling the power, which means
that a level of 3 dBm corresponds
roughly to a power of 2 mW. For
each 3 dB decrease in level, the
power is reduced by about one half,
making −3 dBm correspond to a
power of about 0.5 mW.
More information on measurements
can be found here:
http://blog.prosig.com/2008/04/14/w
hat-is-db-noise-floor-dynamic-range/
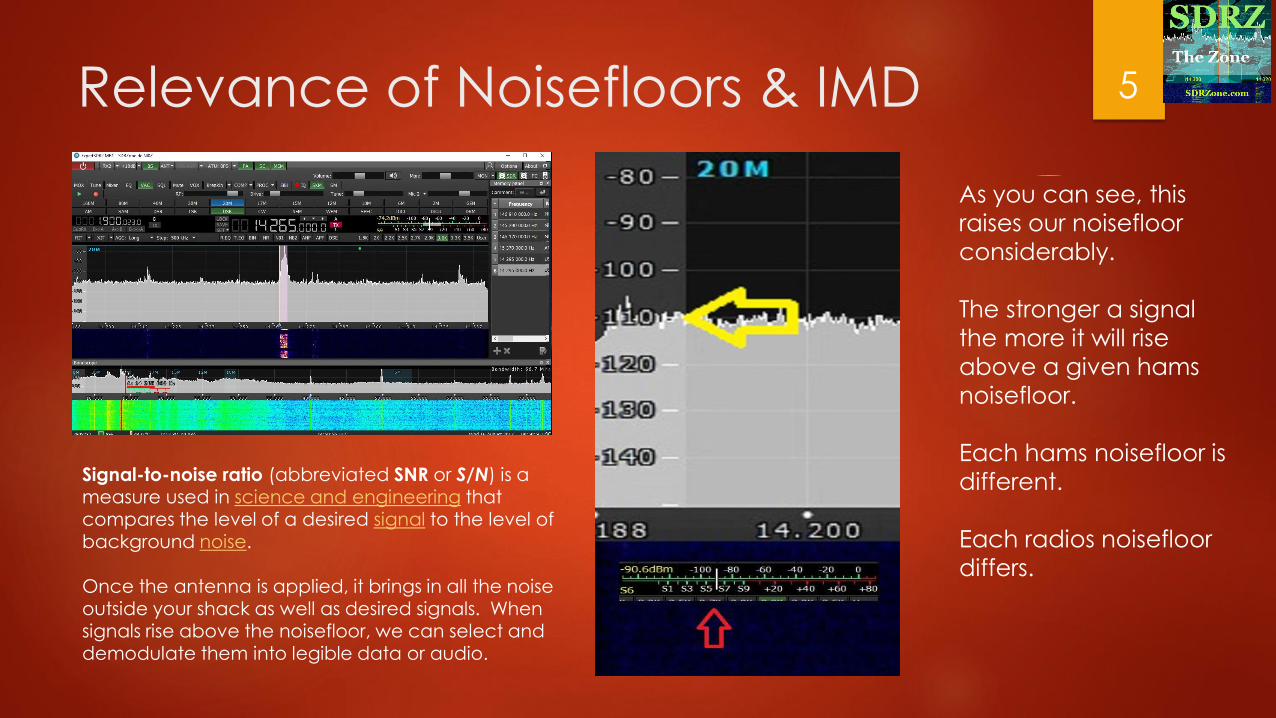
All of it compounds into a base nosiefloor as seen to the left.
This example shows the noisefloor without an antenna applied.
This looks to be between -142dBm to -138dBm.
4
In signal theory, the noise floor is the measure of the signal created from the sum of all the noise sources and unwanted signals within a measurement system, where noise is defined as any signal other than the one being monitored. In radio communication and
electronics, this may include thermal noise, black body, cosmic noise as well as atmospheric noise from distant thunderstorms and similar and any other unwanted man-made signals, sometimes referred to as incidental noise.
Relevance of Noisefloors & IMD
Signal-to-noise ratio (abbreviated SNR or S/N) is a measure used in science and engineering that compares the level of a desired signal to the level of background noise.
Once the antenna is applied, it brings in all the noise outside your shack as well as desired signals. When signals rise above the noisefloor, we can select and demodulate them into legible data or audio.
As you can see, this
raises our noisefloor
considerably.
The stronger a signal
the more it will rise
above a given hams
noisefloor.
Each hams noisefloor is
different.
Each radios noisefloor
differs.
5
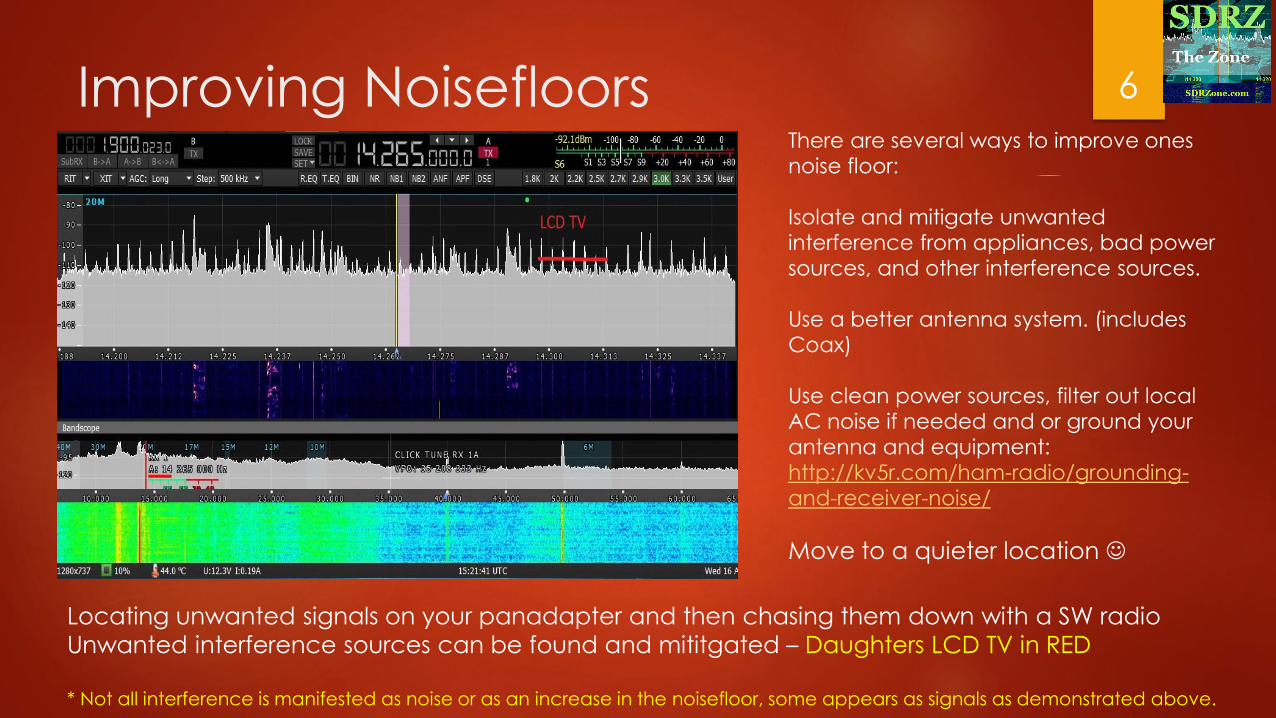
Improving NoisefloorsThere are several ways to improve ones
noise floor:
Isolate and mitigate unwanted
interference from appliances, bad power
sources, and other interference sources.
Use a better antenna system. (includes
Coax)
Use clean power sources, filter out local
AC noise if needed and or ground your
antenna and equipment:
http://kv5r.com/ham-radio/grounding-
and-receiver-noise/
Move to a quieter location ☺
6
Locating unwanted signals on your panadapter and then chasing them down with a SW radio
Unwanted interference sources can be found and mititgated – Daughters LCD TV in RED
* Not all interference is manifested as noise or as an increase in the noisefloor, some appears as signals as demonstrated above.
IMD – Band Splatter
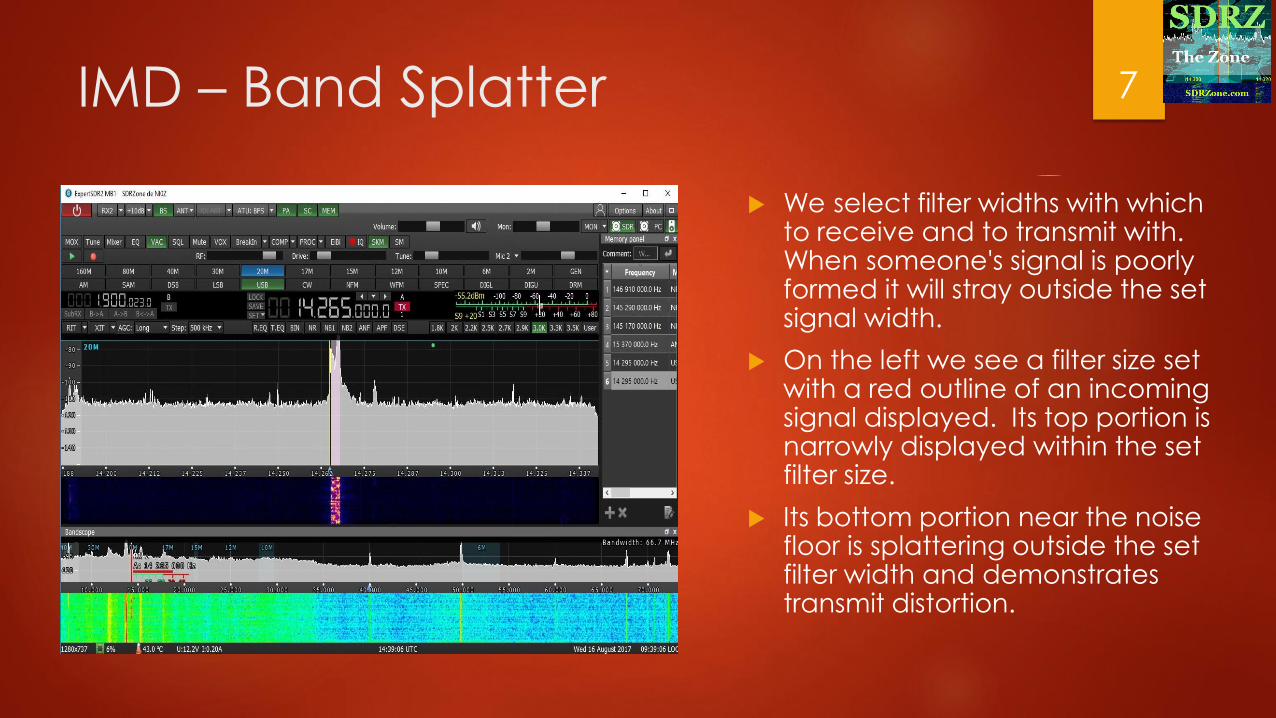
We select filter widths with which to receive and to transmit with. When someone's signal is poorly formed it will stray outside the set signal width.
On the left we see a filter size set with a red outline of an incoming signal displayed. Its top portion is narrowly displayed within the set filter size.
Its bottom portion near the noise floor is splattering outside the set filter width and demonstrates transmit distortion.
7
IMD – Band Splatter
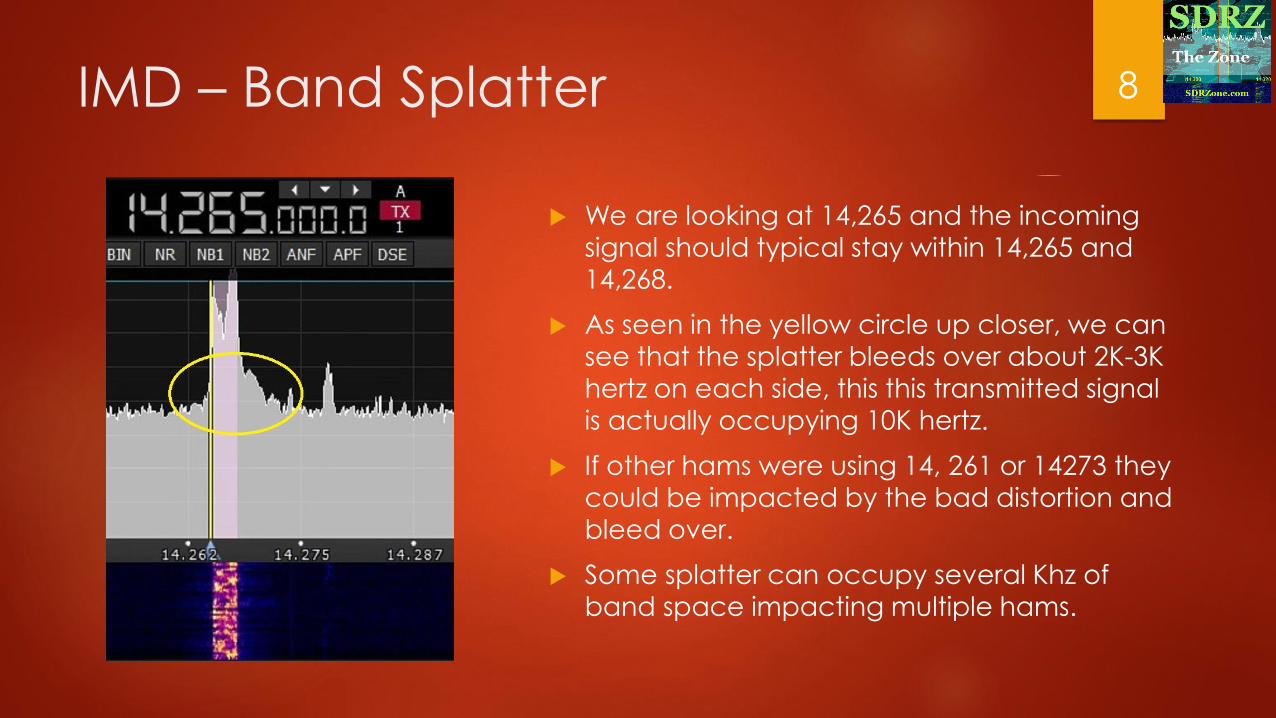
We are looking at 14,265 and the incoming
signal should typical stay within 14,265 and
14,268.
As seen in the yellow circle up closer, we can
see that the splatter bleeds over about 2K-3K hertz on each side, this this transmitted signal
is actually occupying 10K hertz.
If other hams were using 14, 261 or 14273 they
could be impacted by the bad distortion and
bleed over.
Some splatter can occupy several Khz of band space impacting multiple hams.
8
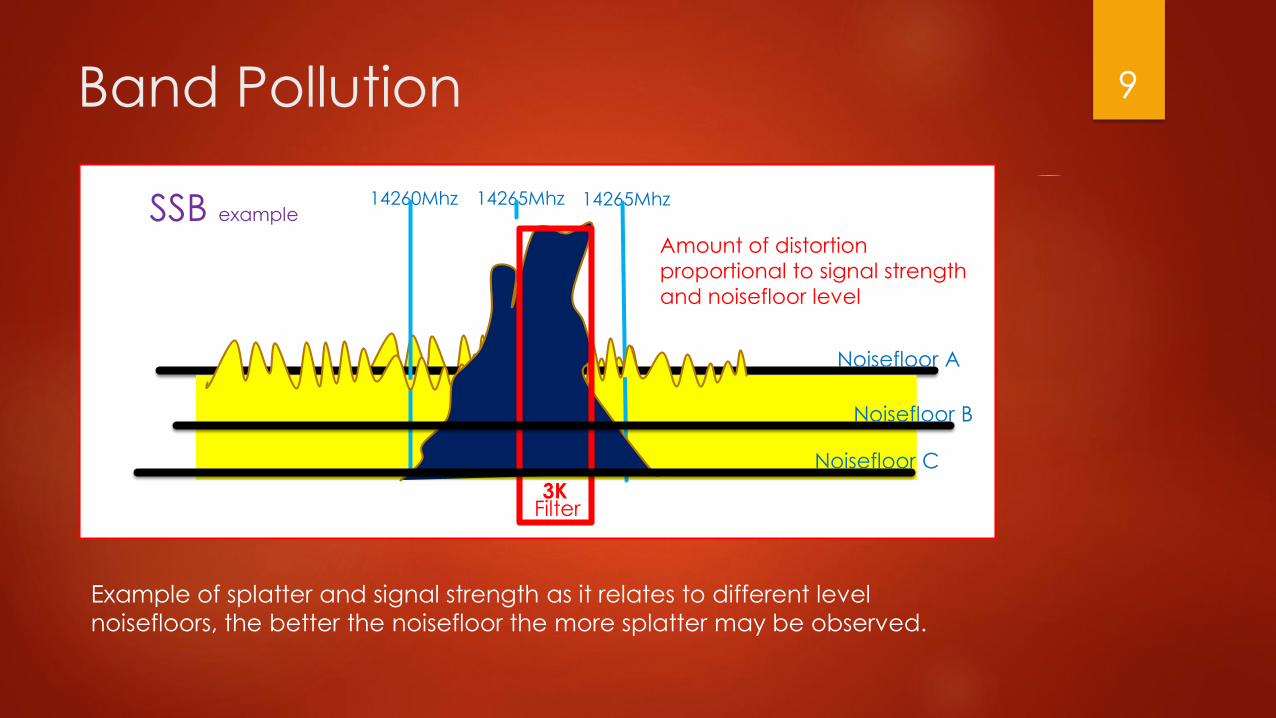
Band Pollution 9
3K
Noisefloor A
14265Mhz 14265Mhz14260Mhz
Filter
Noisefloor B
Noisefloor C
SSB example
Amount of distortion
proportional to signal strength
and noisefloor level
Example of splatter and signal strength as it relates to different level
noisefloors, the better the noisefloor the more splatter may be observed.
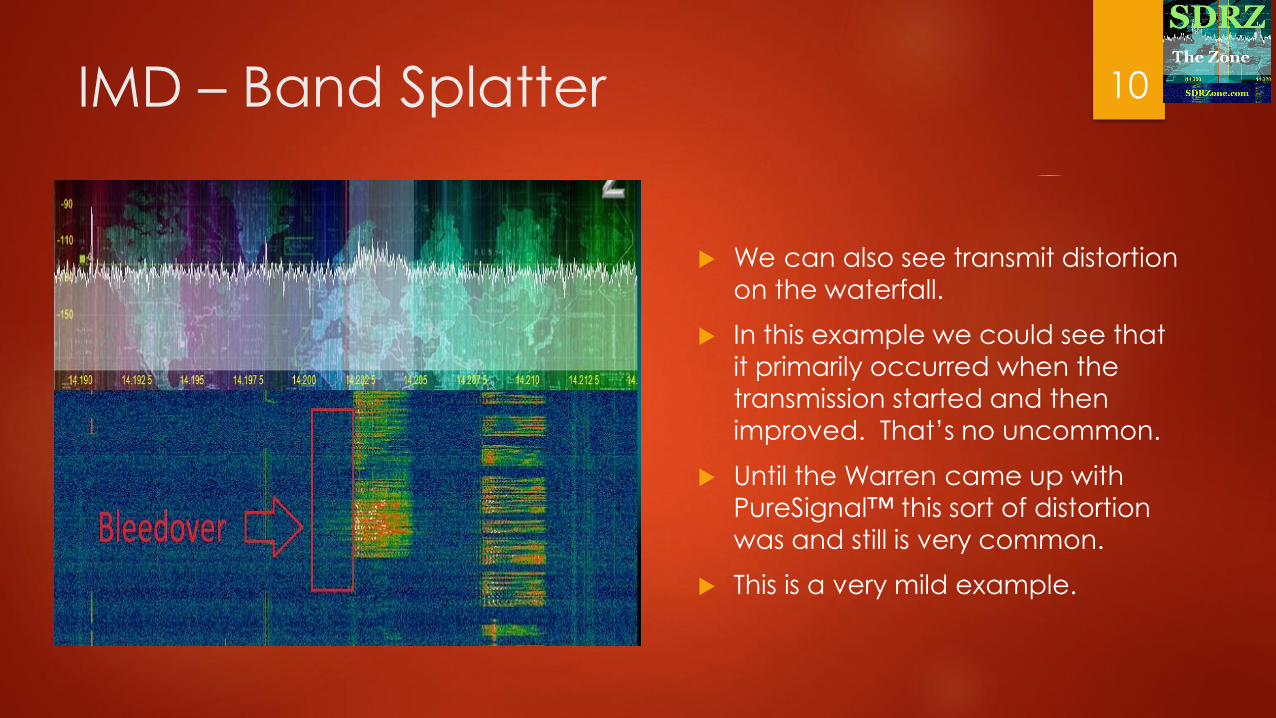
IMD – Band Splatter
We can also see transmit distortion
on the waterfall.
In this example we could see that
it primarily occurred when the
transmission started and then
improved. That’s no uncommon.
Until the Warren came up with
PureSignal™ this sort of distortion
was and still is very common.
This is a very mild example.
10
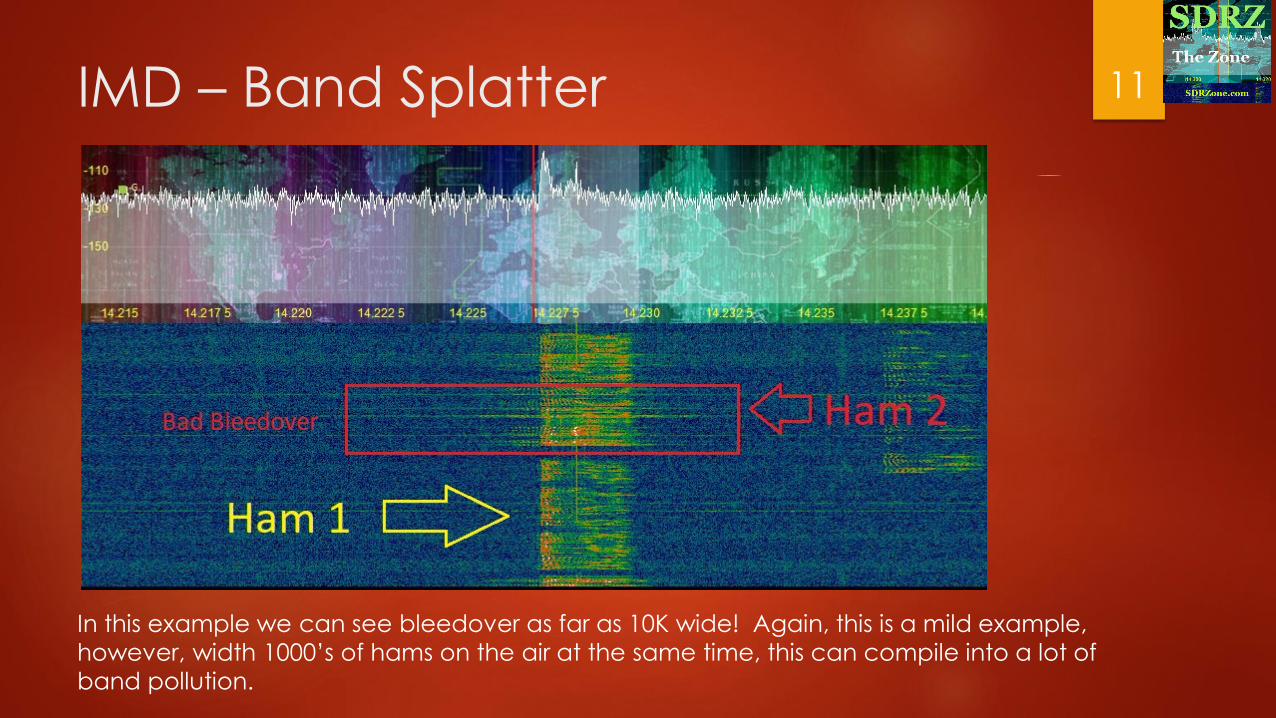
IMD – Band Splatter
In this example we can see bleedover as far as 10K wide! Again, this is a mild example,
however, width 1000’s of hams on the air at the same time, this can compile into a lot of
band pollution.
11
IMD – Band Splatter
Today there are not many radio manufacturers that address transmit distortion and this sadly impacts the overall band welfare and state of band pollution.
Figuratively speaking, it impacts ever ham out there by making it more difficult to copy desirable signals.
It would be very beneficial to the past time for manufactures to start putting more effort into producing cleaner signals for both the transceivers and the amps.
These changes need to take place in both the hardware and software of the radios to effectively start cleaning them up.
In an ideal world, it would be awesome if all electronics manufactures had to pay attention to the noise and interference their products produced, of course this is very unlikely.
In astronomy though, they have been effective in getting local government's to implement some levels of light pollution control. Hawaii’s Big Island for example values lowering light pollution to better enable the telescopes at Mauna Kea Observatories to have better viewing conditions.
http://www2.ifa.hawaii.edu/newsletters/article.cfm?a=301&n=1
12
What can we/you do?
We can continue our awareness and work to reduce band
pollution.
We can lobby radio and amp manufactures to care and understand we value improved distortion control.
We can put our money where our beliefs are at and buy radios that
have improved IMD Distortion control.
It should be noted that a poorly calibrated mic and or audio chain can also contribute to transmit distortion. If you do not have
PureSignal™ you can still make some impact by cleaning up your
transmitted audio.
13
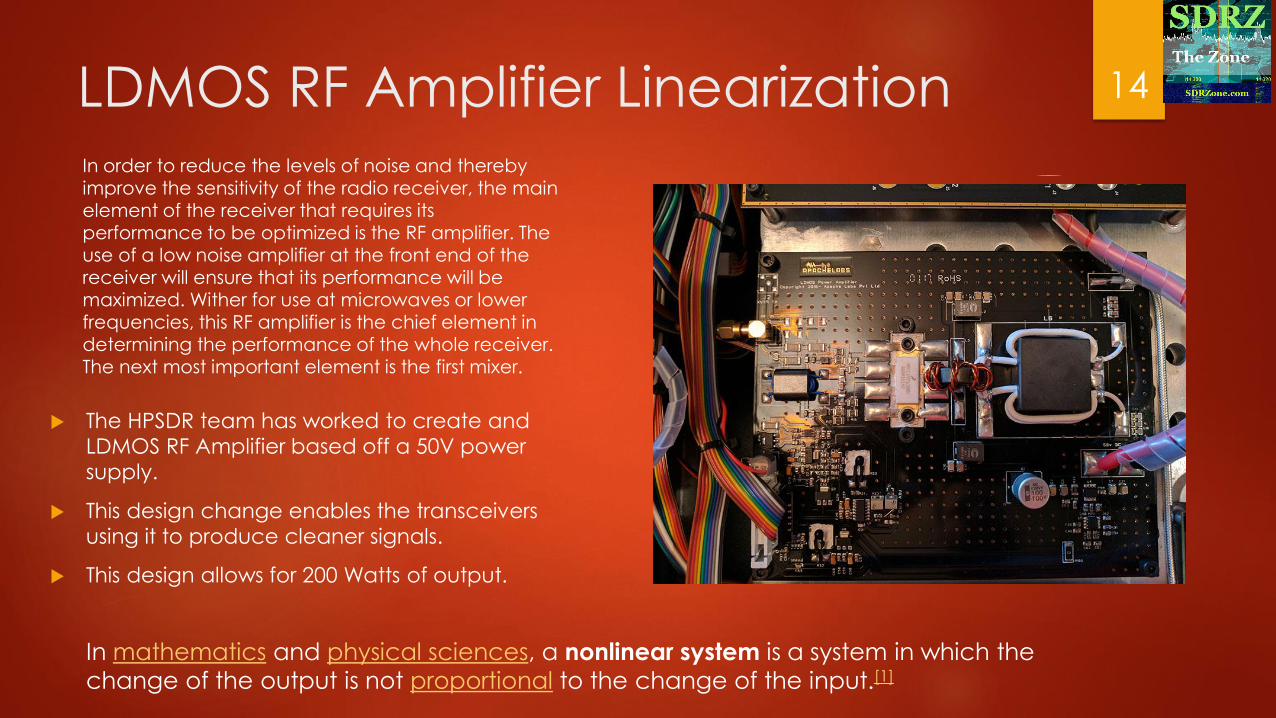
LDMOS RF Amplifier Linearization
The HPSDR team has worked to create and
LDMOS RF Amplifier based off a 50V power
supply.
This design change enables the transceivers
using it to produce cleaner signals.
This design allows for 200 Watts of output.
14
In order to reduce the levels of noise and thereby improve the sensitivity of the radio receiver, the main element of the receiver that requires its performance to be optimized is the RF amplifier. The use of a low noise amplifier at the front end of the receiver will ensure that its performance will be maximized. Wither for use at microwaves or lower
frequencies, this RF amplifier is the chief element in determining the performance of the whole receiver. The next most important element is the first mixer.
In mathematics and physical sciences, a nonlinear system is a system in which the
change of the output is not proportional to the change of the input.[1]
PureSignal™
You can learn more about the details for PureSignal™ using the
following LINK: http://flarc.net/eme-info/PDF/N1JEZ-2.pdf
By deliberately creating distortion on the amplifier input signal we
can compare it in the output in near real-time and correct for it. By
correcting for the known distortion inserted in the input we also
correct for the unknow distortion in the output.
A feedback loop must be created for this where part of the output
signal is fed back into the input.
Apache-labs has added this capability and loop in its newest
models and it can also be added to its older models as well manually after market.
15
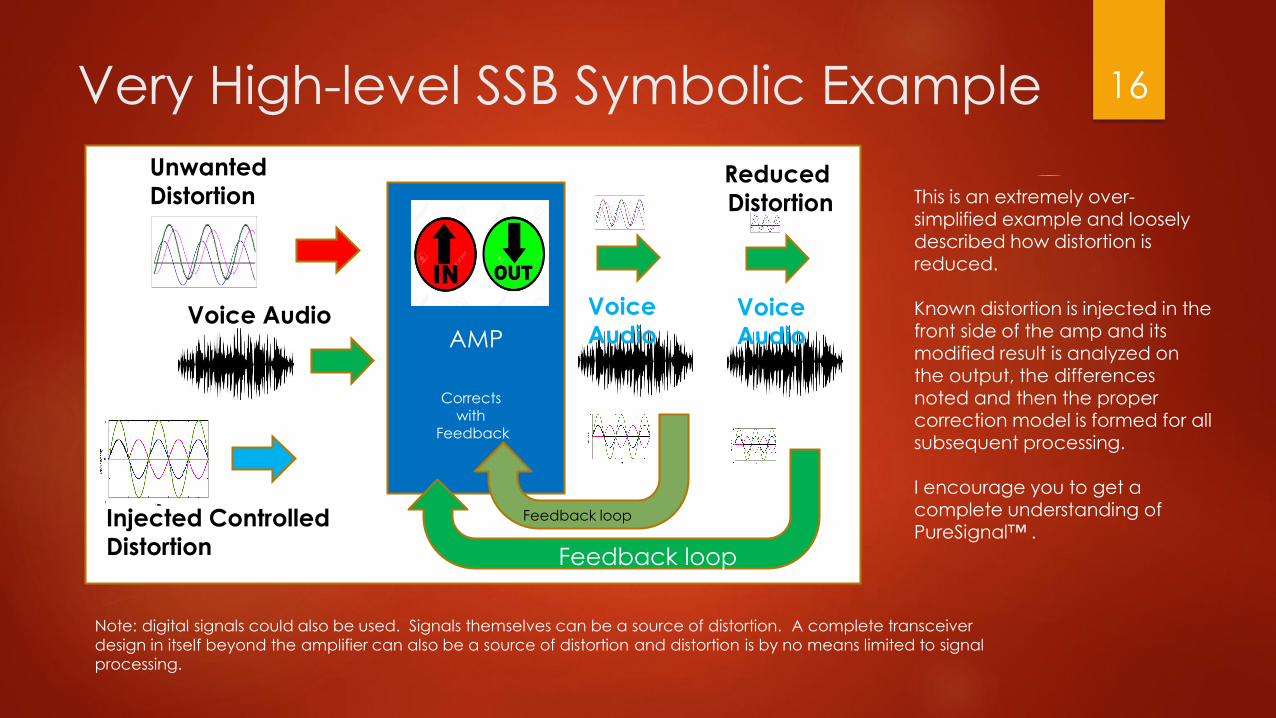
Very High-level SSB Symbolic Example 16
AMPVoice Audio
Unwanted
Distortion
Injected Controlled
Distortion
Voice
AudioVoice
Audio
Reduced
Distortion
Feedback loop
Feedback loop
Corrects with
Feedback
Note: digital signals could also be used. Signals themselves can be a source of distortion. A complete transceiver
design in itself beyond the amplifier can also be a source of distortion and distortion is by no means limited to signal
processing.
This is an extremely over-
simplified example and loosely described how distortion is reduced.
Known distortion is injected in the front side of the amp and its modified result is analyzed on
the output, the differences noted and then the proper correction model is formed for all subsequent processing.
I encourage you to get a complete understanding of PureSignal™ .
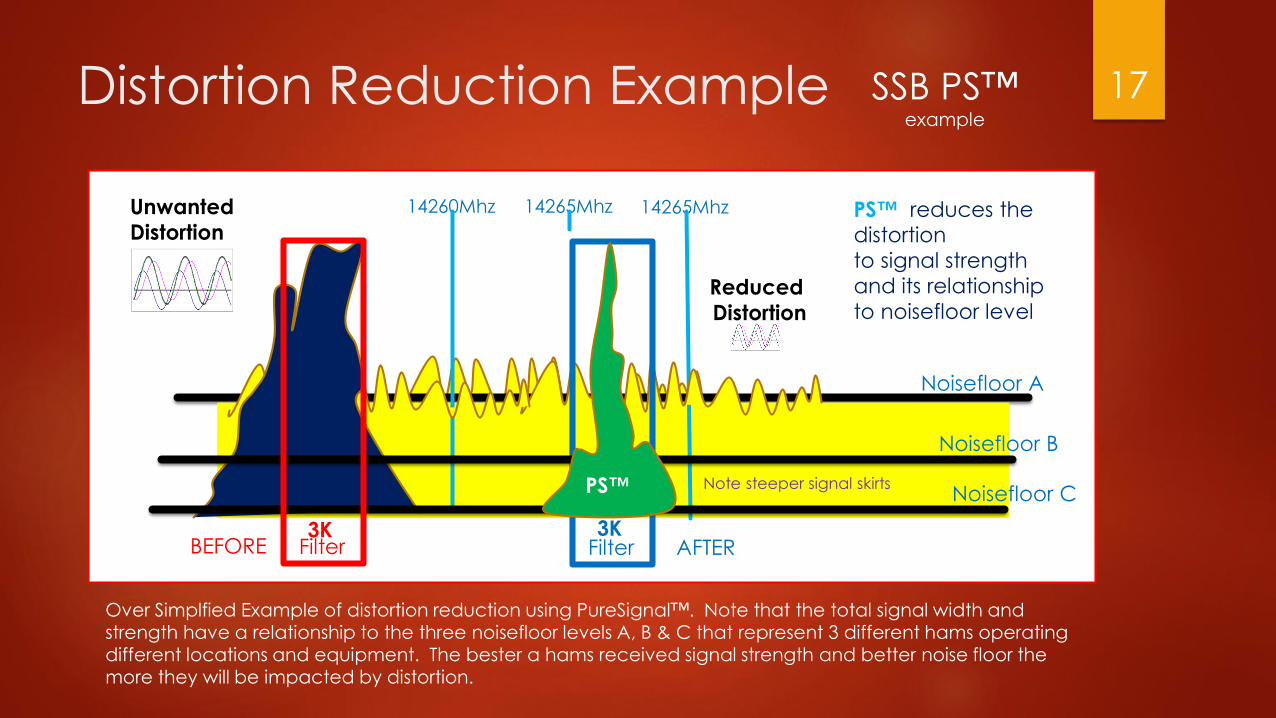
Distortion Reduction Example 17SSB PS™example
3K
Noisefloor A
14265Mhz 14265Mhz14260Mhz
Filter
Noisefloor B
Noisefloor C
PS™ reduces the distortion
to signal strength
and its relationship
to noisefloor level
Filter3K
PS™
BEFORE AFTER
Note steeper signal skirts
Unwanted
Distortion
Reduced
Distortion
Over Simplfied Example of distortion reduction using PureSignal™. Note that the total signal width and strength have a relationship to the three noisefloor levels A, B & C that represent 3 different hams operating different locations and equipment. The bester a hams received signal strength and better noise floor the more they will be impacted by distortion.
PureSignal™
PureSignal™ is trademarked by Warren Pratt NR0V
You can learn more about the details for PureSignal™ using the following LINK: http://flarc.net/eme-info/PDF/N1JEZ-2.pdf
By deliberately creating distortion on the amplifier input signal we can compare it in the output in near real-time and correct for it. By correcting for the known distortion inserted in the input we also correct for the unknown distortion in the output.
A feedback loop must be created for this where part of the output signal is fed back into the input.
Apache-labs has added this capability and loop in its newest models and it can also be added to its older models as well manually after market.
18
PureSignal™ In Action
PureSignal™ example using an Anan 8000 DLE.
To conduct the experiment I needed a distant receiver with
panadapter and waterfall view which would work for my test case.
K1RA has a receiver in Virginia online via sdr.hu that seemed perfect
for the test.
The results were rather interesting. I used the 8000DLE in and out of
PureSignal™ mode and then the EE MB1 as a control monitor to
have another reference SDR to compare results with.
The next few slides present the screenshots and results. The transmit audio on the Anan was recorded so that the same transmission
could be used for both on/off modes.
19
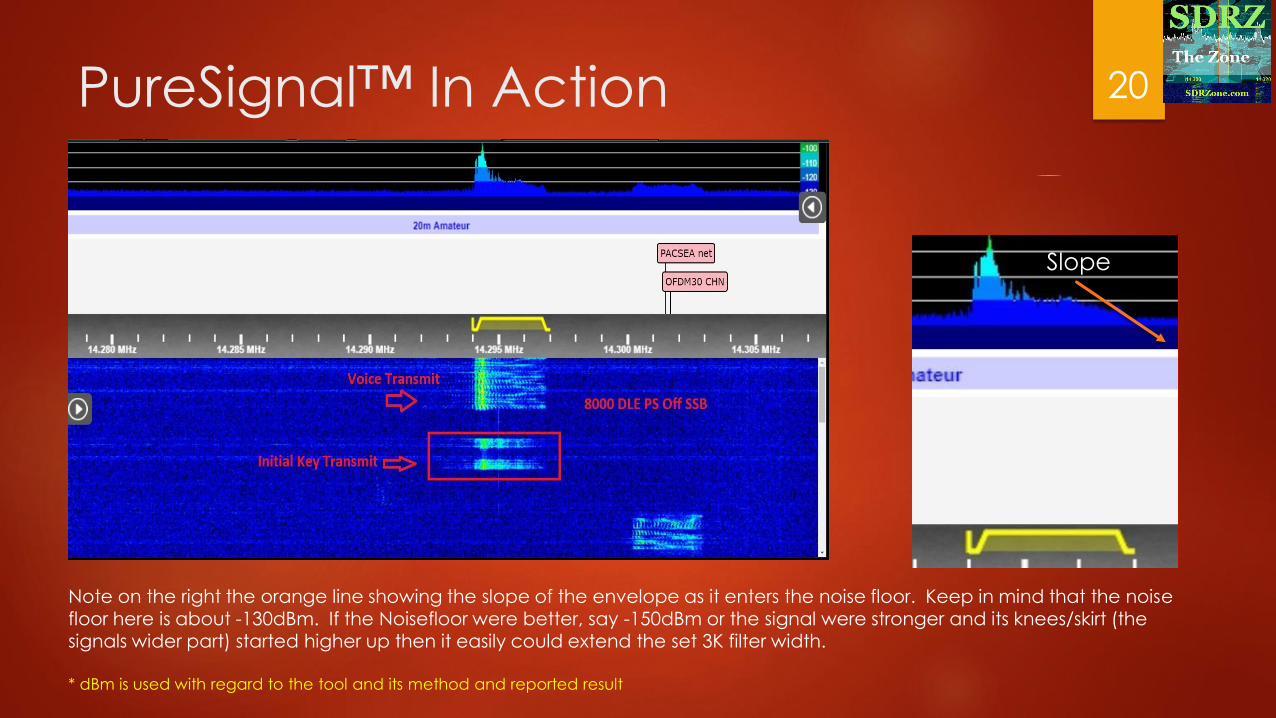
PureSignal™ In Action
Slope
Note on the right the orange line showing the slope of the envelope as it enters the noise floor. Keep in mind that the noise floor here is about -130dBm. If the Noisefloor were better, say -150dBm or the signal were stronger and its knees/skirt (the signals wider part) started higher up then it easily could extend the set 3K filter width.
* dBm is used with regard to the tool and its method and reported result
20
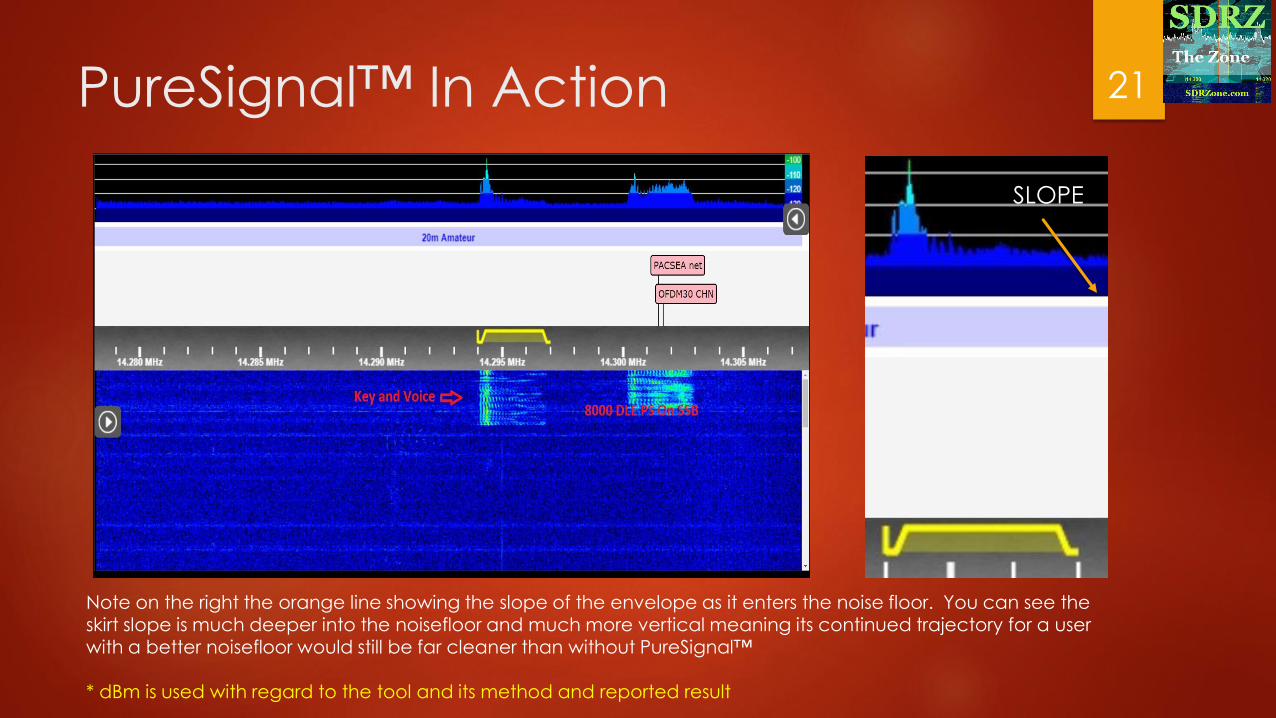
PureSignal™ In Action
SLOPE
Note on the right the orange line showing the slope of the envelope as it enters the noise floor. You can see the skirt slope is much deeper into the noisefloor and much more vertical meaning its continued trajectory for a user with a better noisefloor would still be far cleaner than without PureSignal™
* dBm is used with regard to the tool and its method and reported result
21
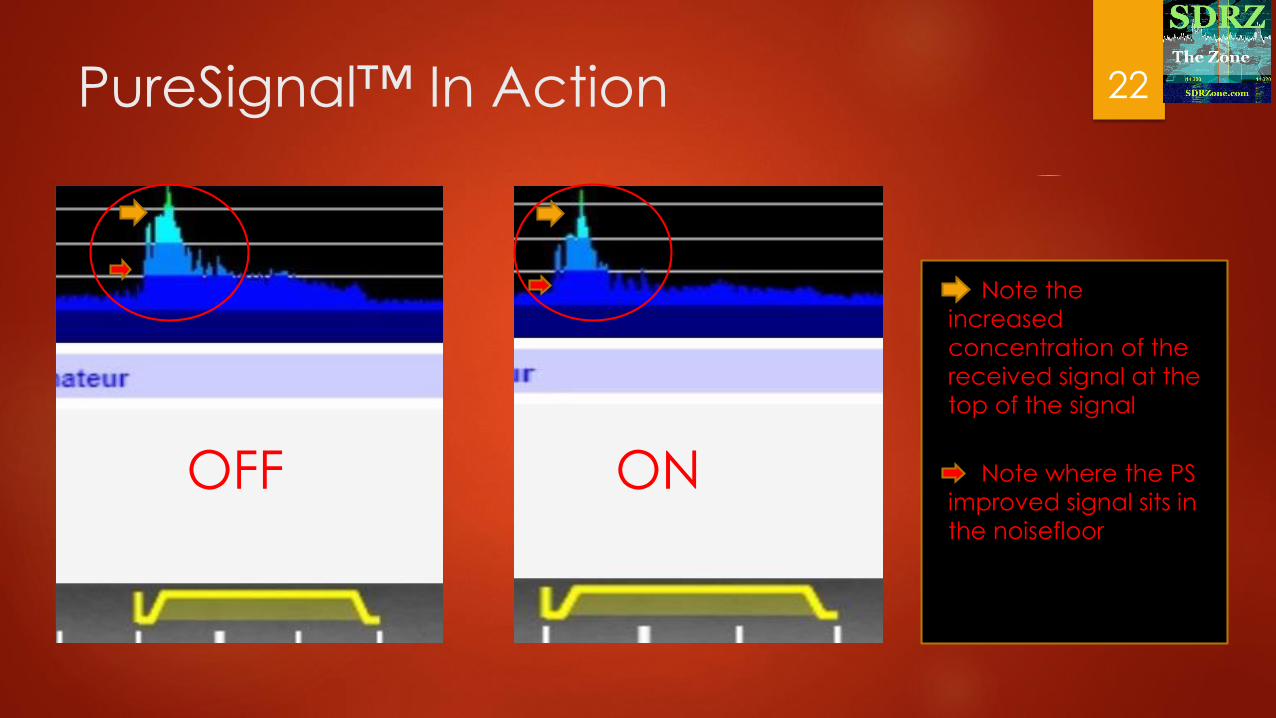
PureSignal™ In Action
OFF ON Note where the PS
improved signal sits in
the noisefloor
Note the
increased
concentration of the
received signal at the
top of the signal
22
Wrap-up
With the use of improved hardware in the amplifier state of the transceiver and NR0V’s PureSignal™ we can realize significant improvement in Transmit IMD.
Hams using cleaner transmitters are thus being better band citizens and reducing their footprint on the bands. Improved signals are received better on the distant end with grater clarity and power.
You can learn more about the details for PureSignal™ using the following LINK: http://flarc.net/eme-info/PDF/N1JEZ-2.pdf
If you own an Anan, this video can show you how to set it up on older models. LINK: https://youtu.be/0adHZOTqTlQ
Excellent video showing how PureSignal™ makes a difference. LINK: https://youtu.be/ztTHCb4MUv8
23


