One of the more critical requirements for the success of a lunar landing mission is for a successful launch of the Lunar Module (IM) from the surface into the proper orbit for rendezvous. An accurate alinement of the IM inertial measurement unit (MU) is a necessity to meet the requirement. Several methods exist by which this alinement can be accomplished, but the primary method (and the most accurate) uses the alinement optical telescope (ACT). The AOT was manufactured by Kollsman Instruments Corporation under subcontract to the AC Electronics Division of AC Spark Plug Company, the prime contractor to NASA for the Apollo Guidance and Navigation System.
This report describes the test procedures and significant rdsults of an evaluation of the anticipated ACT optical performance during the prelaunch lunar surface IMU alinement. The work was performed under Apollo funding (914-50-30-01) by authorization of Engineering and Development Task EG2T36.
The author wishes to gratefully acknowledge the aid and participation of the following persons. Without their assistance these tests would have been much more difficult.
Astronauts Russell L. Schweikart, William A. Anders, Edwin E. Aldrin, Neil A. Armstrong, Clifton C. Williams (deceased), Eugene A. Cernan, Frank Borman, Charles Conrad, and James A. McDivitt and MSC pilots Neil R. Anderson and Joel M. Rosenzsweig contributed many hours of participation in night tests at remote sites and made numerous helpful comments on the AOT performance.
TEST ARTICLE DESCRIPTION
The Alinement Optical Telescope (AOT)
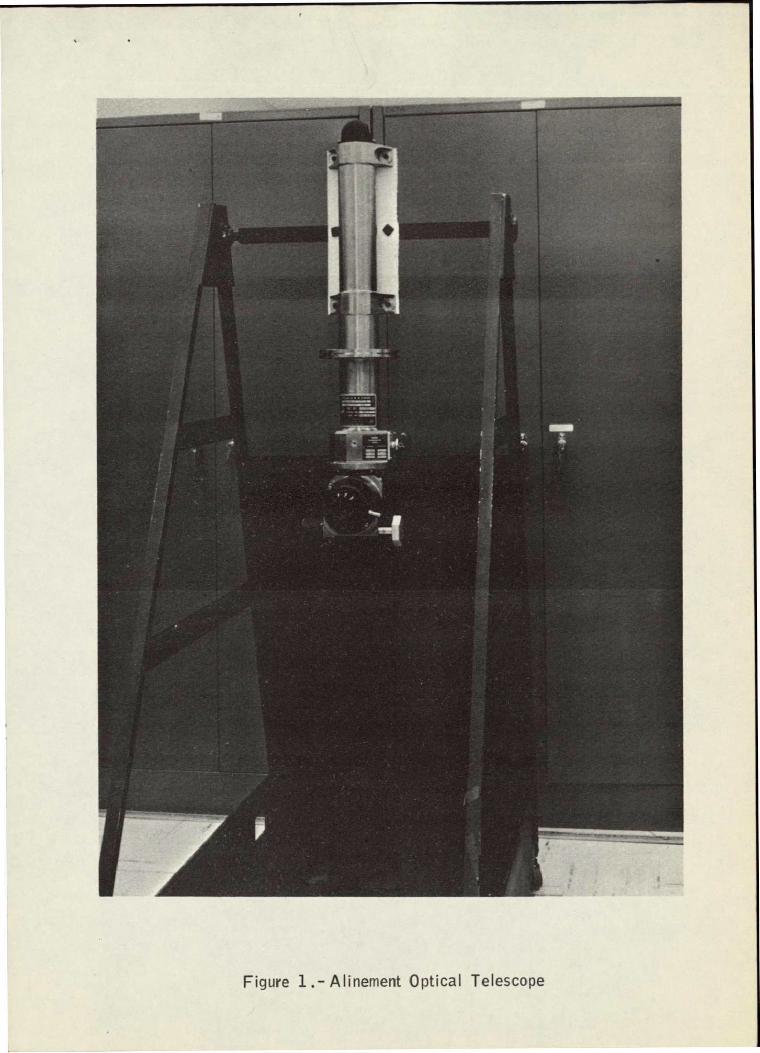
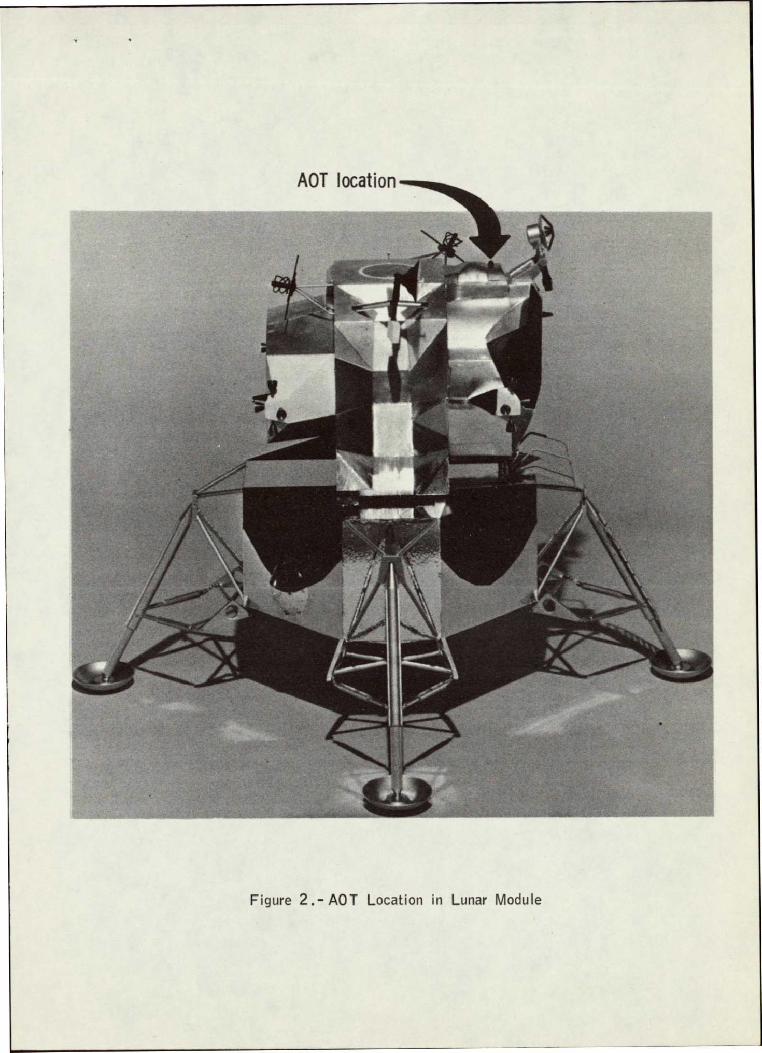
The AOT is a unity power, 650. field of view, 60 percent transmission optical device mounted to the IM navigation base. It is the primary means by which inertial alinement of the IM 241 is obtained, during flight and on the lunar surface. Figure 1 illustrates the appearance of the AOT and Figure 2 shows its location with respect to the IM structure.
The AOT is essentially a periscope type of device with a fixed line-ofsight deviation 450 above the horizontal, and full azimuthal freedom with detent stops at 600 intervals. In the present configuration} the prism at the top of the AOT (Figure 3) is covered by a hemispherical cap with an opening allowing the unobstructed use of only the three forward detent positions (O, 6o right,.600 left). In the 1800 or "closed" position the prism is rotated under the cap for dust protection.
In operational use on the lunar surface, the AOT is used to sight a-650
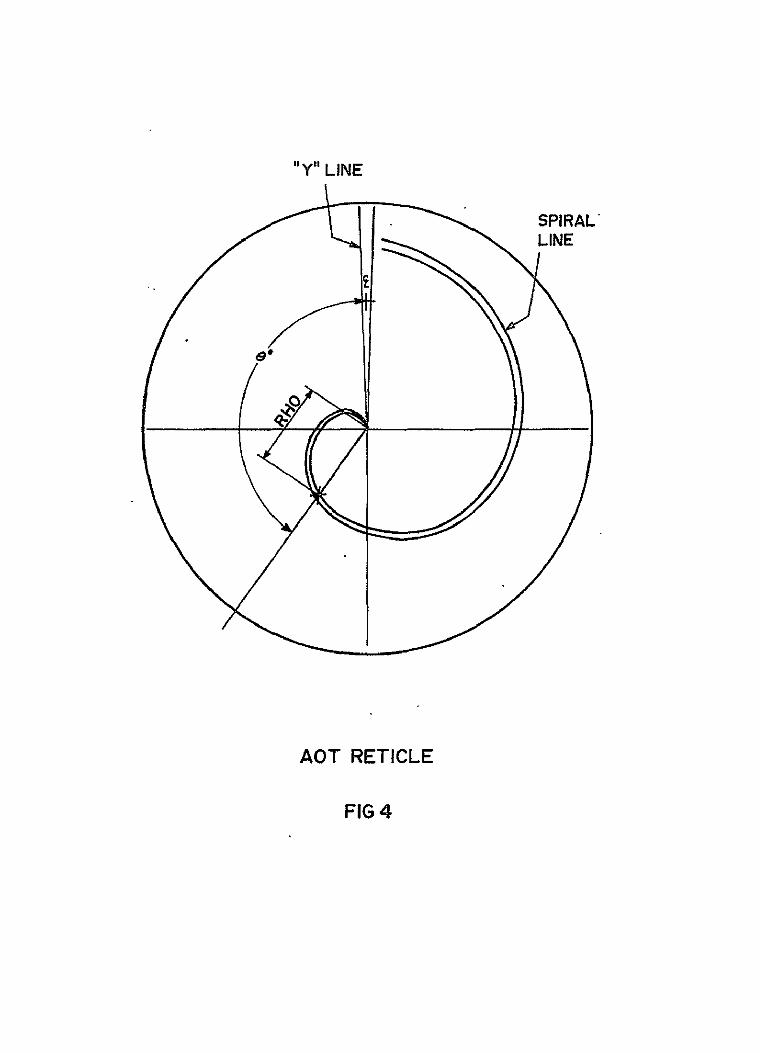
sector of the sky. The astronaut identifies the starfield, selects two navigational stars, and performs sighting marks using a movable reticle (Figure 4). The reticle settings for each star are entered into the LM Guidance Computer (LGC) which then performs the platform alinement. Inflight alinements require centering each of two selected stars in the field of view by moving the vehicle, and then allowing the vehicle to rotate within the limits of the attitude hold deadband. Whenever the star crosses the X or Y line of the reticle, the astronaut depresses the proper MARK button to enter the time into the computer. The LGC uses the mark times and the star coordinates to calculate the inertial lines-of-sight to the two stars, and alines the IU accordingly.
Operational ACT Lighting Environment
The AOT is used to perform IM IMU alinements at the following times:
a. Immediately following separation from the Command/Service Module (CSM).
b. Immediately preceding the TM powered descent.
c. Immediately following IM landing.
d. Preceding IM ascent from the lunar surface.
e. Immediately following EM orbital injection prior to IM-CSM rendezvous.
1Configuration of the AOT has since been changed as a result of these tests.
2
Configurations a, b, and e are inflight alinements and offer the capability of vehicle orientatinn to ensure favorable lighting conditions for star sightings. Configurations c and d are performed on the lunar surface with an essentially fixed sun-vehicle geometry. The more demanding lunar surface configurations were selected for evaluation.
Present mission plans call for a sun elevation at landing of 60 to 200. With a nominal lunar stay time of 26 hours, this corresponds to a range of possible sun elevations of 60 to 330, during which alinements must be performed. There is no constraint on sun azimuth relative to the vehicle on landing, but it is reasonable to assume that the sun will be behind the IM in a nominal landing.
Effects of Lighting Environment on ACT Performance
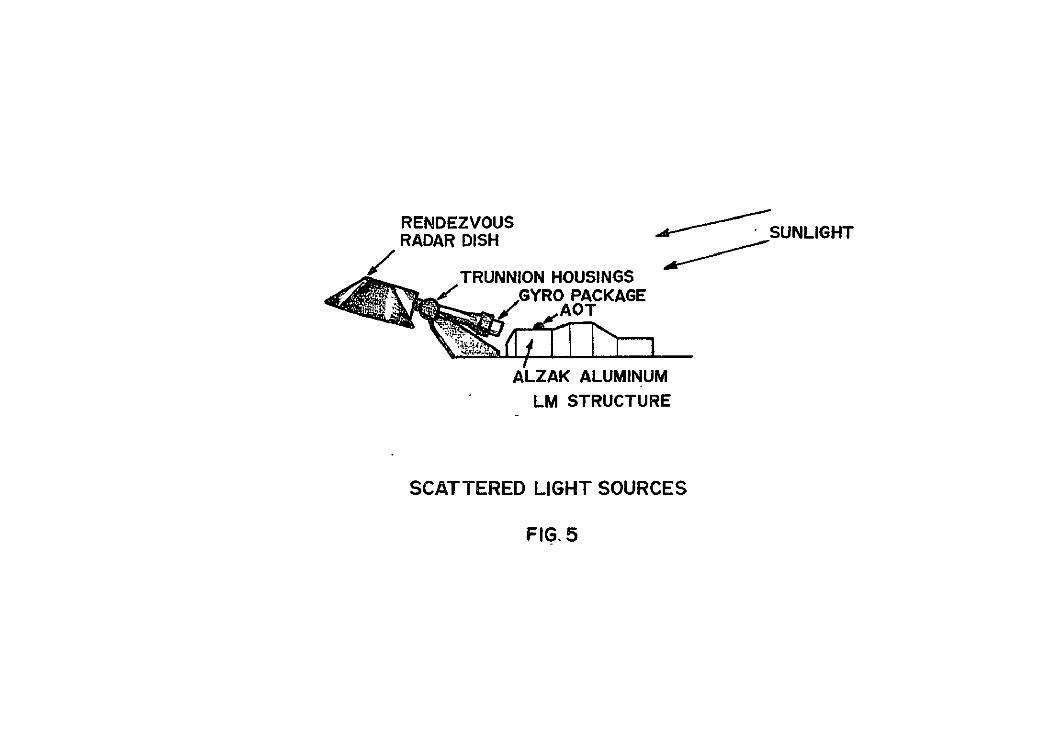
In the present spacecraft configuration, the ACT entrance prism is illuminated by several sources of scattered light. These sources are identified in Figure 5. The primary source of light is the rendezvous-radar assembly which is painted black except for the gyro package which is flat white. The effect of the scattered light is to illuminate the ACT entrance prism, which results in scattered light entering the exit pupil of the ACT eyepiece. To the astronaut this scattered light will cause a background luminance which will affect his dark adaptation and reduce his capability to visually detect stars in the AOT field of view.
TEST PROGRAM
Simulator Description
The scattered lighting effects on the ACT are not amenable to analytical techniques because of the large number and indefinite quality of the variables associated with the problem. For this reason it was felt that a simulation of the lighting environment and scattering sources was required. A simulator for this purpose was fabricated, using actual spacecraft materials where possible'on all exterior surfaces. This simulator included the Alzak aluminum surfaces immediately surrounding the AOT and a mockup of the entire rendezvous radar assembly in the position shown in Figure 5. A 10 kilowatt spotlight was used to flood the simulated spacecraft surfaces with light approximating sunlight in intensity. The entire simulator is shown in Figure 6.
Unshielded ACT Tests
Test Procedures. - The first series of tests were performed with the AOT unshielded to obtain data on present configuration performance. Later tests were run to evaluate the merits of several shielding configurations with regard to improving ACT performance for constellation
3
recognition. The test procedure utilized was the same for all configurations and is described below.
a. The simulator was set up to the desired lighting geometry (Figure 7). The elevation and azimuth of the 10 K light with respect to the simulator was measured.
b. The solar incident flux was set by measuring the luminance of a flat Magnesium Oxide sample held near the A0T and normal to the line of sight to the light. The light was adjusted until a flux of approximately 12,400 lumens/ft was obtained. This flux corresponds to the illuminance of sunlight.
c. The luminance of the sky was measured with the light off. This quantity was defined as B and is in units of foot-lamberts.s
d. The light was next turned on and the air path brightness measured from inside the simulator, through the opening in which the ACT is normally installed. This quantity was defined as B and is in units of foot-lamberts.
a
e. The ACT was installed and the brightness of the exit pupil measured. This quantity is equivalent to the field brightness seen by the observer and was defined as B in units of foot-lamberts.
e
f. A flat Magnesium Oxide target was placed against the prism and its luminance measured. This luminace is numerically equivalent to the illuminance entering the ACT prism from the various scattering sources and was defined as F in units of lumens/ft2 .
p
g. The light was turned off and the center of the field of view determined through visual observations and the use of star charts. A clock was zeroed at this time so that the field of view center for later observations could be calculated from the elapsed time.
h. The observer entered the simulator and was allowed to dark adapt for 10 minutes.
i. The observer proceeded to count the stars visible to him in each quadrant of the field of view and entered the number and time into the data book.
Data Reduction. - The following procedure was used to reduce the data obtained from all configurations:
a. Using the data reduction computer program described in Appendix B, a curve showing star magnitude versus cumulative number of stars was obtained. For each number of stars counted, the dimmest magnitude seen could be determined.
4
b. This magnitude was plotted versus the exit pupil brightness B e For trained observers the threshold magnitude versus B curve should e match the theoretical curve predictedby the Tiffany daa as explained in Appendix D.
Co The effects of air path and sky brightness were removed by application of the formula:
B0 Be - (T (Ba + B))
Where: B = field brightness due solely to AOT internal scattering
B a measured exit pupil brightnesse
T = transmission of AOT = o.6o
B = measured air path brightnessa
B = measured sky brightnessS
B is the brightness that would be observed if the observations could Be made in a vacuum. Therefore, to obtain meaningful data on AOT performance, the quantities Ba and Bs should be minimized as much as possi ble. This was done by performing the tests at high altitude observing sites, where the extremely low humidity and dust free air combined with the low sky background luminance to allow reasonably good photometric measurements.
Test Results. - A total of sixty (60) data runs as described above was made at Kitt Peak National Observatory near Tucson, Arizona, and at High Altitude Observatory at Climax, Colorado. The average threshold magnitude, with trained observers and in the presence of atmospheric scattering effects, was found to be +2.84, with a low of +2.72 in the front detent and a high of +3.08 in the right detent. These magnitudes were seen at average exit pupil luminances of .065 foot-lamberts (front detent) and .056 foot-lamberts (right detent). Subtracting out the average air path and sky background luminances to obtain Bo as described earlier, yields a luminance of .033 foot-lambers in the forward detent position. This value is the typical field of view luminance that would be seen in a vacuum environment on the lunar surface. Theoretical predictions of observer performance with the AOT at this background level (Appendix D) yield a threshold magnitude of +3.4. This represents a "best case" situation in which the observer is highly trained, is adequately dark-adapted, and uses peripheral vision to acquire the dimmer stars. It is highly unlikely that all of these conditions will be met in the operational use of the AOT on the lunar surface. It is, therefore, necessary to subtract approximately 1.0 magnitude from this value, thus
5
yielding +2.4 magnitude as that visible through the unshielded AOT under operational conditions. Table I summarizes the abov& results.
Conclusions. - Constellation identification requirements (Appendix A) indicate that the +2.4 magnitude capability is unacceptably low. Confirmation of this was obtained from Astronauts Schweickart and Anders (Reference 2) and our own observers, who were unable to identify the starfields observed even at the +3.4 magnitude level observed. It was concluded that some type of scattered light shielding would have to be developed and implemented to allow operational use of the AOT on the lunar surface. The remainder of this report presents the history and results of this shielding development effort.
DEVELOPMENT AND TESTING OF AOT SHIELDING
AOT Prism Illuminance Limits. - Laboratory tests indicated that an illuminance of no more than one lumen/foot can be tolerated at the AOT objective prism if stars as dim as +4.0 magnitude are to be detected. Table I ind~cates that the unshielded AOT prism illuminance is about 100 lumens/foot . Therefore, the shielding must attenuate the illuminance by two orders of magnitude. The following paragraphs describe the various shielding techniques which were evaluated and the test results for each.
Black Gyro Package. - The rendezvous radar antenna's gyro package was found to be the primary contributor of the scattered light that reaches the AOT prism. It is the only portion of the radar assembly that has a white finish (Z-92 paint) and contributes approximately 90% of the 100 lumens/foot2 discussed above. Tests were run to determine how much of this 90 lumens/foot2 could be reduced by painting this package flat black (with the 3-M Black Velvet paint) as shown in Figure 8.
Tests indicated that the prism illuminance contribution of the gyro package could only b reduced by one order of magnitude yielding approximately 9 lumens/foot in addition to the residual 10 lumens/foot2 from the rest of the rendezvous radar assembly. In addition, the thermal control of the gyro package would be adversely affected by the black coating. Thus, the black gyro package did not appear to be a feasible solution.
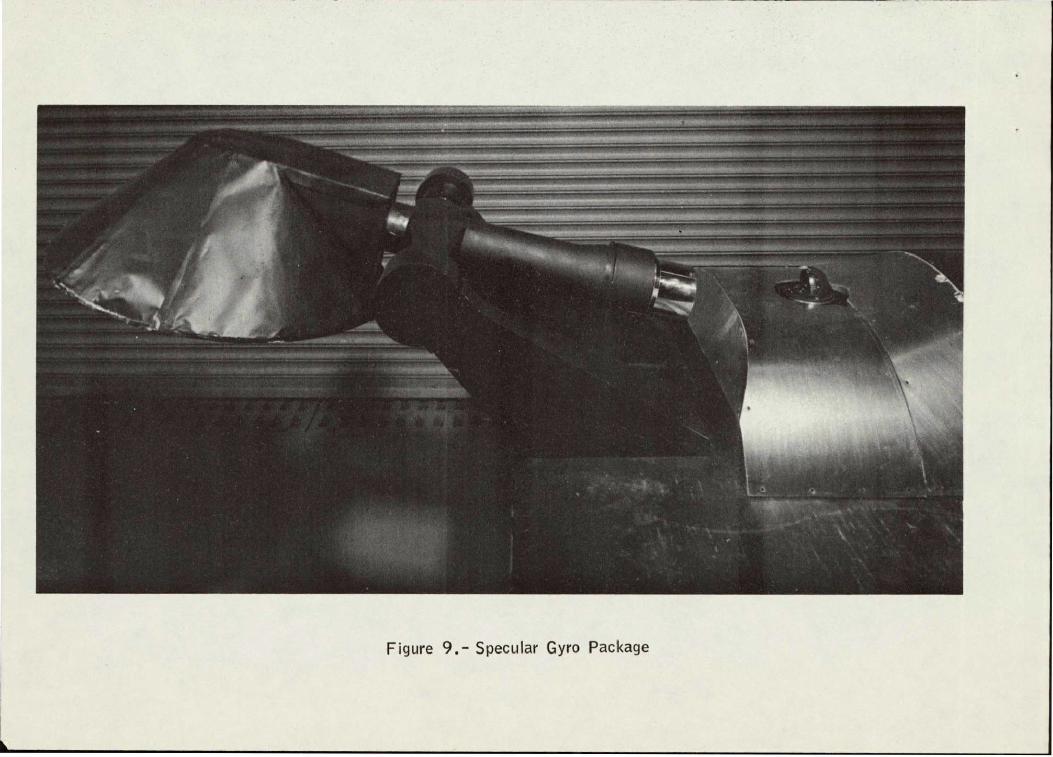
Specular-finish G-ro Package. - The white paint on the gyro package is a nearly perfect diffusing surface. It was reasoned that much of the light reflected from it to the AOT prism could be eliminated if a specular surface were used instead. This specular surface also would have less impact upon the thermal control problem than did the black finish. Figure 9 shows this configuration. Tests were run in this configuration, but no significant reduction in prism illumination was obtained. This was traced to an indirect reflection of light from the flat base of the gyro package impinging on the Alzak material immediately in front ot the AOT. An attempt was made to eliminate this by the addition of a specular mirror
6
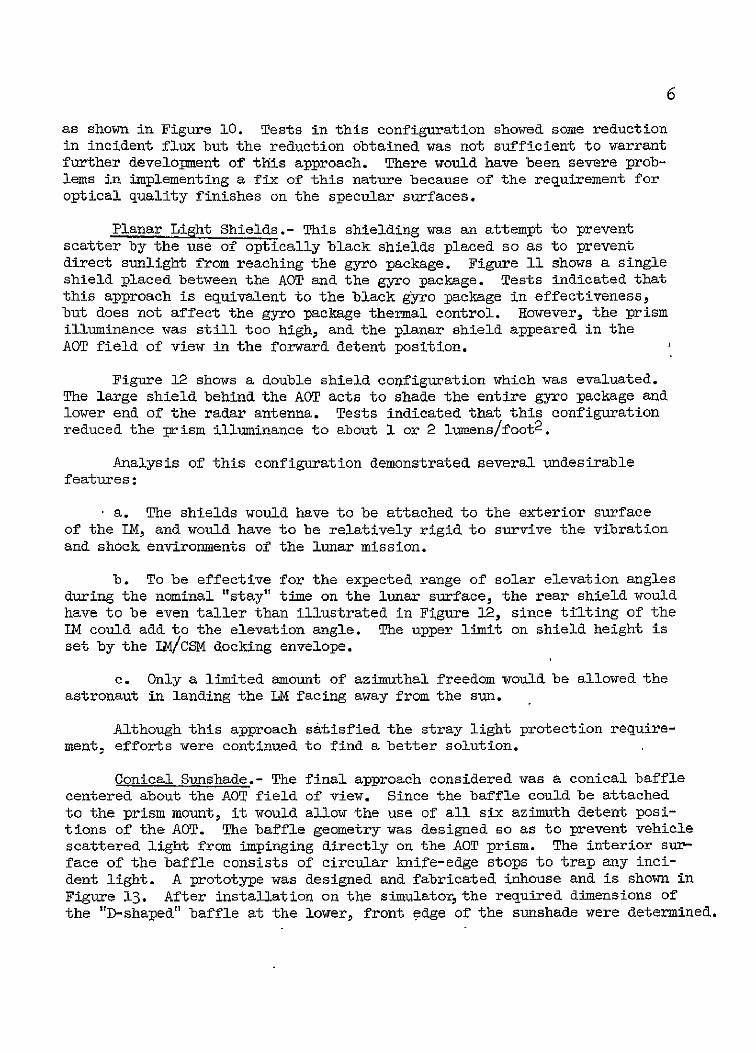
as shown in Figure 10. Tests in this configuration showed some reduction in incident flux but the reduction obtained was not sufficient to warrant further develolment of this approach. There would have been severe problems in implementing a fix of this nature because of the requirement for optical quality finishes on the specular surfaces.
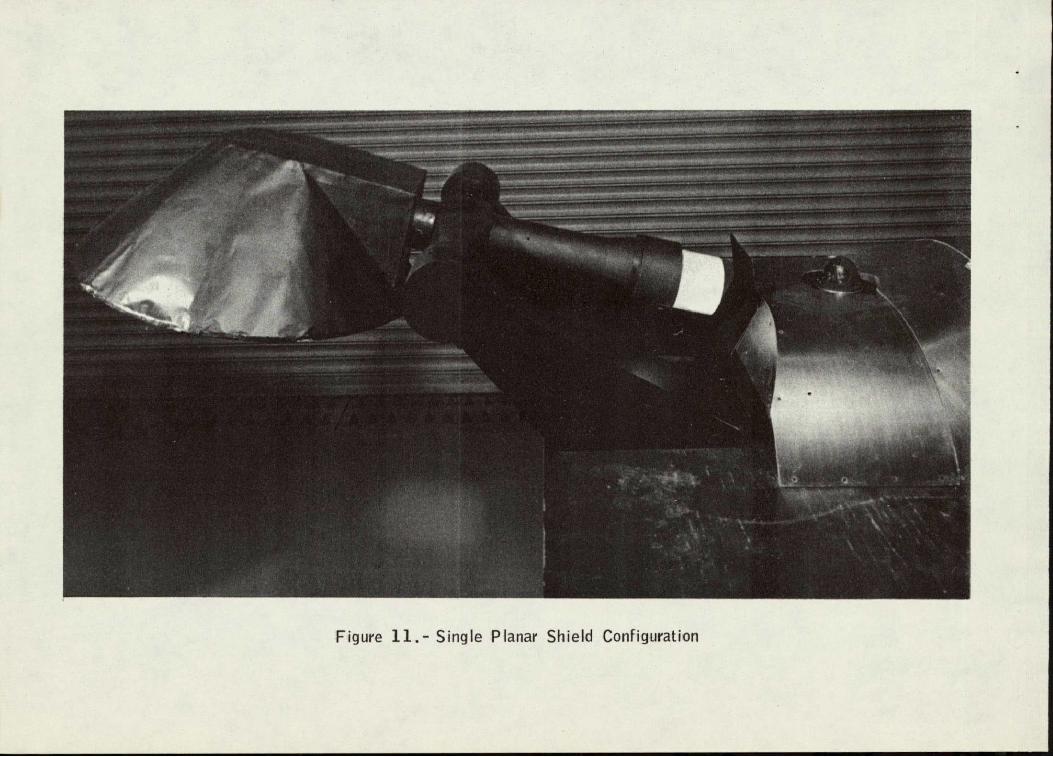
Planar Light Shields.- This shielding was an attempt to prevent scatter by the use of optically black shields placed so as to prevent direct sunlight from reaching the gyro package. Figure 11 shows a single shield placed between the AOT and the gyro package. Tests indicated that this approach is equivalent to the black gyro package in effectiveness, but does not affect the gyro package thermal control. However, the prism illuminance was still too high, and the planar shield appeared in the AOT field of view in the forward detent position.
Figure 12 shows a double shield configuration which was evaluated. The large shield behind the AOT acts to shade the entire gyro package and lower end of the radar antenna. Tests indicated that this configuration reduced the prism illuminance to about 1 or 2 lumens/foot2 .
Analysis of this configuration demonstrated several undesirable features:
. a. The shields would have to be attached to the exterior surface of the TM, and would have to be relatively rigid to survive the vibration and shock environments of the lunar mission.
b. To be effective for the expected range of solar elevation angles during the nominal "stay" time on the lunar surface, the rear shield would have to be even taller than illustrated in Figure 12, since tilting of the IM could add to the elevation angle. The upper limit on shield height is set by the IJiCSM docking envelope.
c. Only a limited amount of azimuthal freedom would be allowed the astronaut in landing the LM facing away from the sun.
Although this approach satisfied the stray light protection requirement, efforts were continued to find a better solution.
Conical Sunshade.- The final approach considered was a conical baffle centered about the AOT field of view. Since the baffle could be attached to the prism mount, it would allow the use of all six azimuth detent positions of the AOT. The baffle geometry was designed so as to prevent vehicle scattered light from impinging directly on the AOT prism. The interior surface of the baffle consists of circular knife-edge stops to trap any incident light. A prototype was designed and fabricated inhouse and is shown in Figure 13. After installation on the simulator, the required dimensions of the "D-shaped" baffle at the lower, front edge of the sunshade were determined.
7
This baffle prevents light reflected by the rendezvous radar assembly from ° directly illuminating the prism, and also cuts off approximately 6 from
the bottom of the ACT field of view. The radar antenna, therefore, cannot be seen by the astronaut. (This latter function was previously done by the radar fence shield shown in Figure 3.) Unfortunately. the field of view restriction is present in all detent positions with the conical sunshade configuration.
This prototype was extensively tested at Kitt Peak, at Climax, Colorado, and in Houston. The results of these tests showed an increase in star magnitude capability to about +3,8. The illuminance on the prism was reduced to about 5 lumens/foot2 representing an attenuation factor of 20 over the unshielded configuration.
During the simulator tests, the sunshade prototype was observed to graze the IM thermal skin when passing through the rear detent positions. To obtain the necessary clearahce, a flat-bottomed cone was designed, with the knife-edge stops having a similar outline.
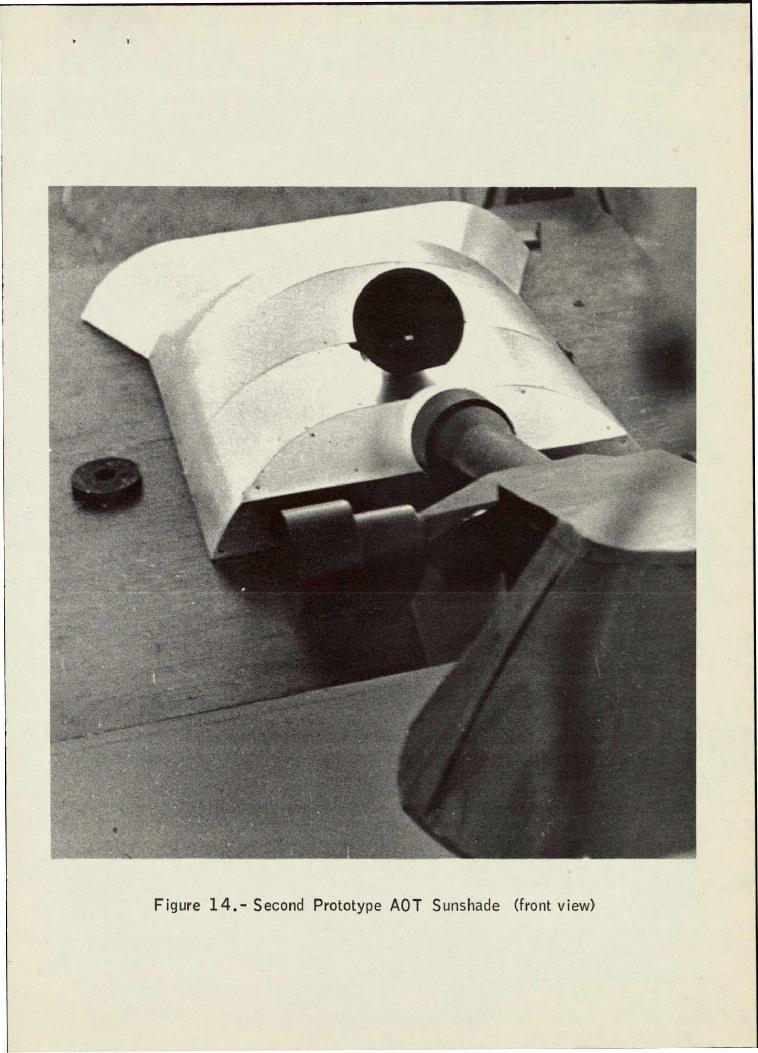
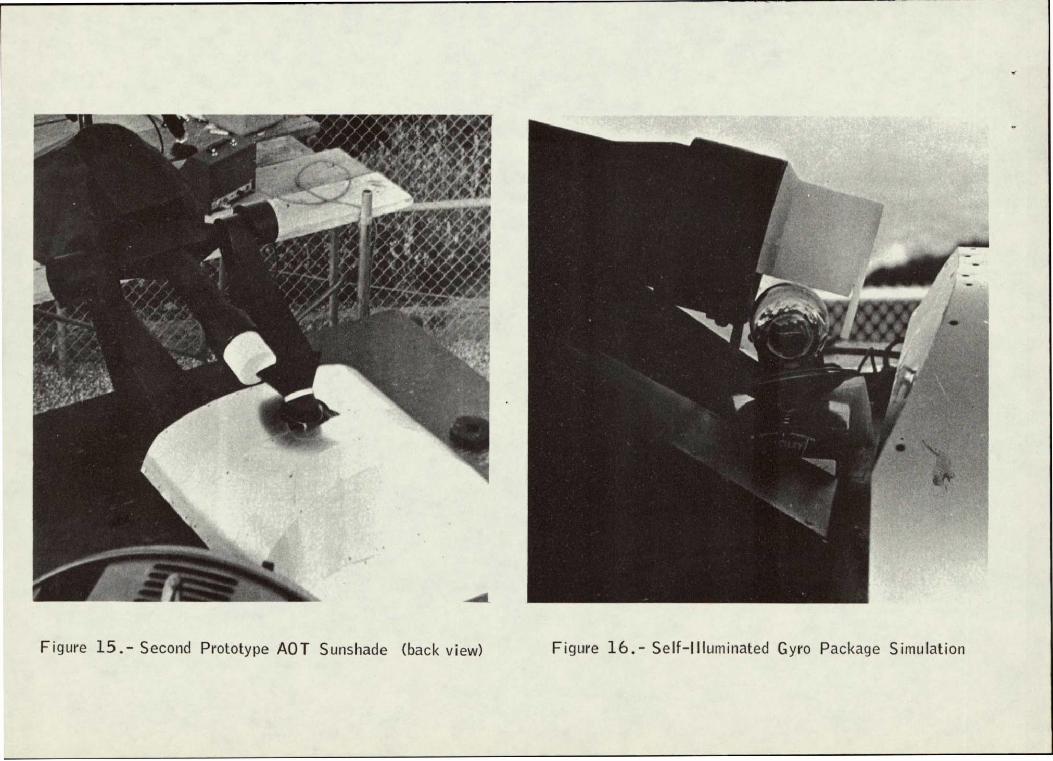
With this design change, a second prototype was fabricated as shown in Figure 14. Three-piece construction was used, with each piece being machined from aluminum blocks. After bead-honing the surfaces, the sunshade was black-anodized to produce a low reflectance coating. After assembly with the simulator, the length of the spacing sleeve (the shiny metal collar in Figure 15) was adjusted to locate the inner edges of the baffles just outside of the field of view.
Field tests with the second prototype showed a reduction in prism illuminance to less than one lumen/foot 2 . Observers were able to see stars as dim as +4.2 magnitude, but the field of view was still relatively bright to the eye. The photometric measurements indicated this was due to the air path luminance rather than to stray light effects. In one test with the prototype sunshade the entire radar antenna assembly was removed from the simulator without producing a measurable change in the-exit pupil luminance. The air path luminance, due to the scattering by the air in the beam of the spotlight had become the limiting factor in the star sighting tests.
In order to more closely simulate the ACT performance in the absence of air, the simulator was modified by substitution of a self-illuminated gyro-package. As discussed earlier, the white gyro package accounted for about 90 percent of the prism illumination in the unshielded configuration. By using a frosted plexiglas cylinder and a 300 watt light bulb as shown in Figure 16, the air path luminance from the spotlight could be eliminated, with only slight loss of fidelity of the lighting simulation. Calibration of the self-illuminated gyro package was made by comparison of the unshielded prism illumination levels with those measured using the spotlight.
In this configuration, the exit pupil luminances were less than the 0.0001 foot-lambert measurement capability of the photometer. Threshold
8
star magnitudes observed were approitmately +4.5.
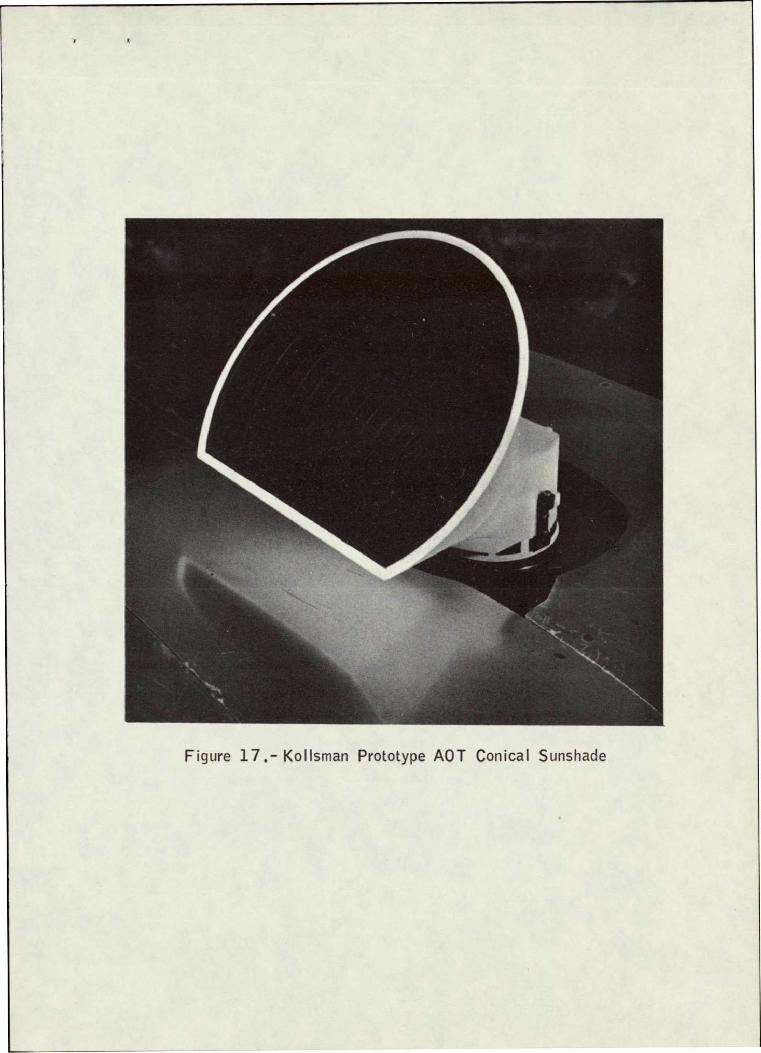
Since all performance requirements for the AOT shield had been achieved with the conical sunshade, design and fabrication of a flighttype prototype was initiated by the AOT subcontractor, Kollsman Ihstruments Corporation. A third prototype sunshade, which incorporated design changes in the method of attachment to the prism mount, and an increased physical clearance with the IM thermal skin, was also fabricated inhouse. A mandatory design requirement for the flight configuration was a maximum weight increase of eight ounces to the IM weight.
The Kollsman prototype sunshade (Figure 17) was delivered and tested at Kitt Peak in late February 1968, For demonstration of the acceptability of the sunshade, three dim stars were selected for observation. The stars were-Iota Orionis (M. = +2.76), Upsilon Orionis (mv-= +4.63), and 49 Orionis (M= +4.81). Using'the self-illuminated gyro package to eliminate the air path luminance, Astronauts Aldrin and Armstrong both saw the'two brighter, stars easily and the +4.81 star with some difficulty. In addition, the astronauts counted the stars visible ig the Pleiades star cluster, resulting in a threshold magnitude of +4.8.
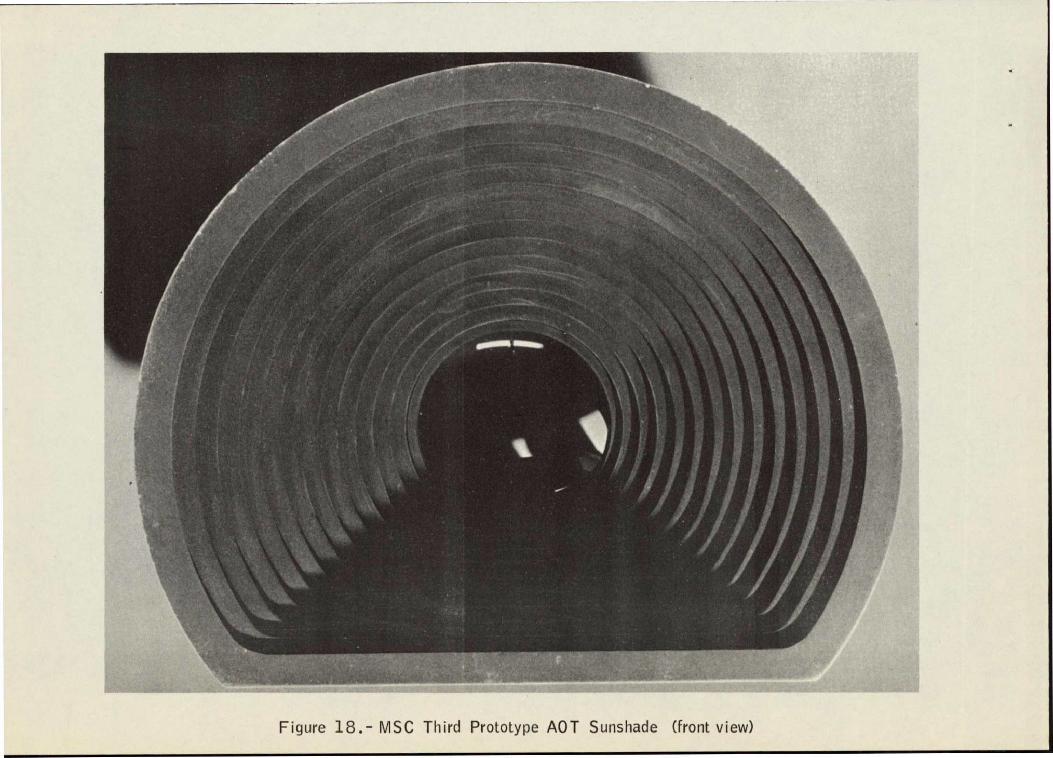
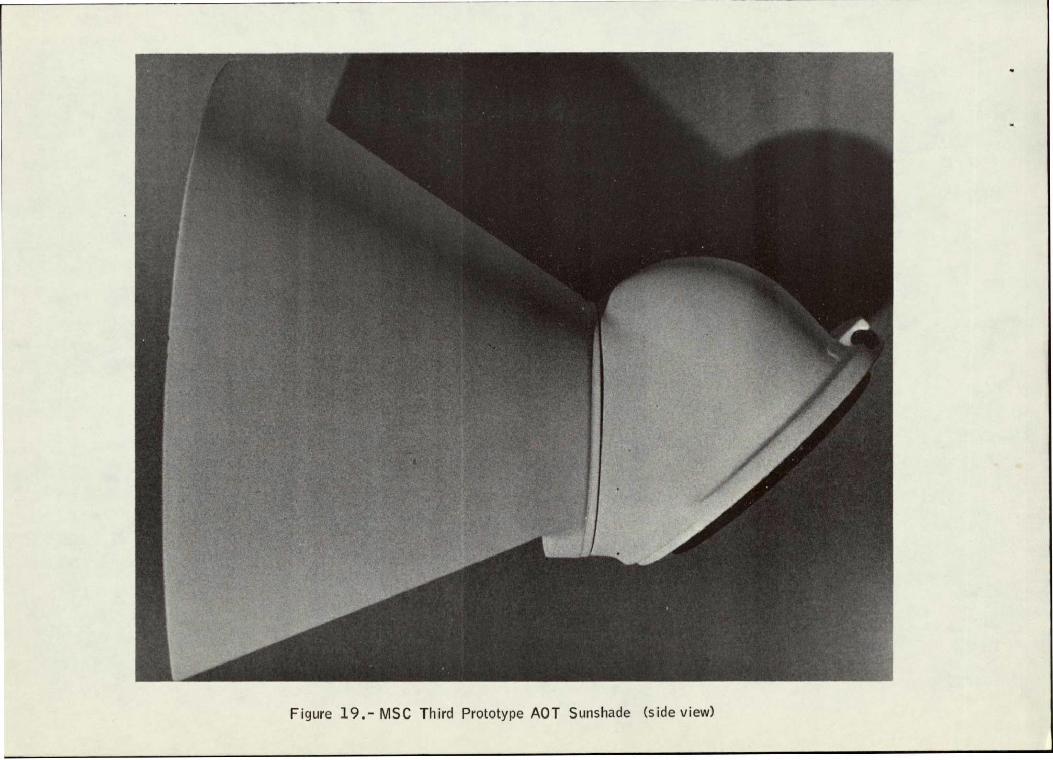
The third MSC prototype was completed as a fabrication feasibility item,(Figure 18 and 19). Although its performance was not evaluated, the design dud fabrication of this prototype contributed significantly to the success of the contractor's efforts to achieve a practical, low-weight design for the conical sunshade.
Additional Tests and Studies
Sun-interference.- Just prior to the last field test, it was decided to measure the minimum acceptable separation angle between the center of the AOT field of view and the spn. These tests were performed using a cadmium sulphide photodetector mounted inside the conical sunshade at the location of the objective prism.
2-Using a maximum allowable illuminance of 1.0 lumen/foot , the minimum separation angle between the center of the AOT field and the sun was- found to be 700. These tests are discussed in more detail in Appendix E.
Helmet Effects.- At the suggestion of Dr. Maxime Faget, Director of Engineering and Development, a qualitative determination was made of the effects ofthe astronaut helmet upon the visibility of stars with the AOT.
- Crew Systems Division provided a production prototype helmet. Astronauts Schweickart, Anders, Aldrin, and Armstrong participated in the tests5 which were performed in November 1967 at Kitt Peak.
The test procedures and results are discussed in Appendix F.
9
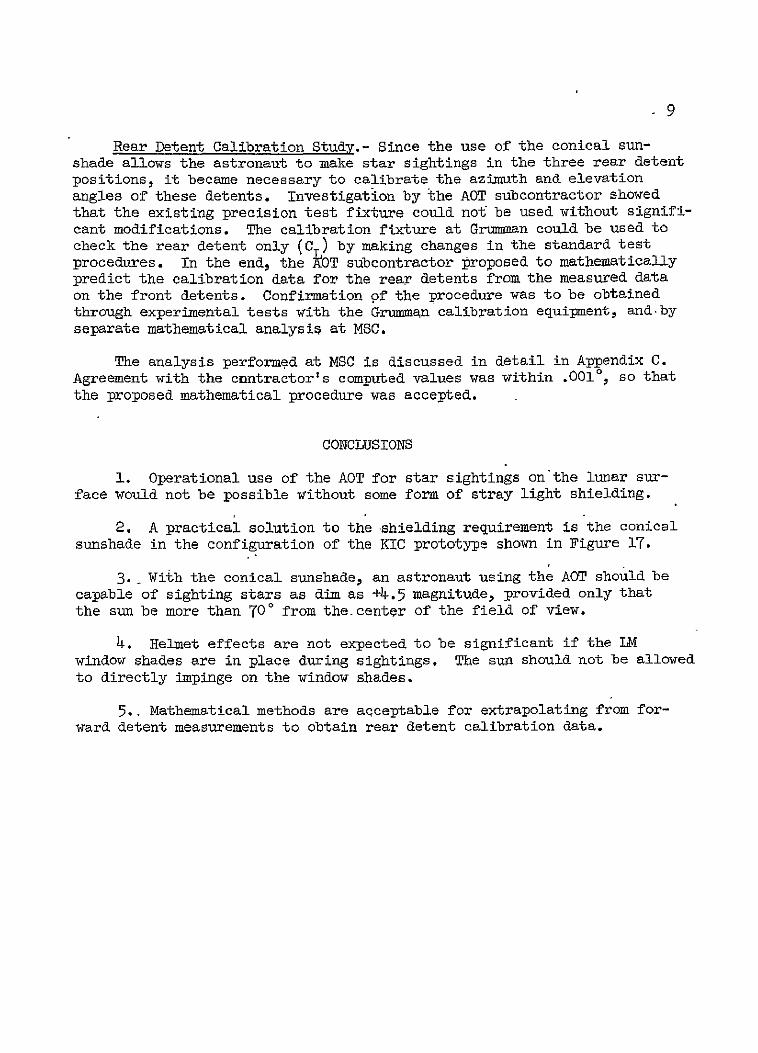
Rear Detent Calibration Study.- Since the use of the conical sunshade allows the astronaut to make star sightings in the three rear detent positions, it became necessary to calibrate the azimuth and elevation angles of these detents. Investigation by the ACT subcontractor showed that the existing precision test fixture could not be used without significant modifications. The calibration fixture at Grunnan could be used to check the rear detent only (C ) by making changes in the standard test procedures. In the end, the i0T subcontractor proposed to mathematically predict the calibration data for the rear detents from the measured data on the front detents. Confirmation 9f the procedure was to be obtained through experimental tests with the Grumman calibration equipment, and-by separate mathematical analysis at MSC.
The analysis performed at MsC is discussed in detail in Appendix C. Agreement with the cnntractor's computed values was within .0010, so that the proposed mathematical procedure was accepted.
CONCLUSIONS
1. Operational use of the ACT for star sightings on the lunar surface would not be possible without some form of stray light shielding.
2. A practical solution to the shielding requirement is the conical sunshade in the configuration of the KIC prototype shown in Figure 17.
3.- With the conical sunshade, an astronaut using the AOT should be capable of sighting stars as dim as +4.5 magnitude, provided only that the sun be more than 70 from the.center of the field of view.
4. Helmet effects are not expected to be significant if the LM window shades are in place during sightings. The sun should not be allowed to directly impinge on the window shades.
5.. Mathematical methods are acceptable for extrapolating from forward detent measurements to obtain rear detent calibration data.
10
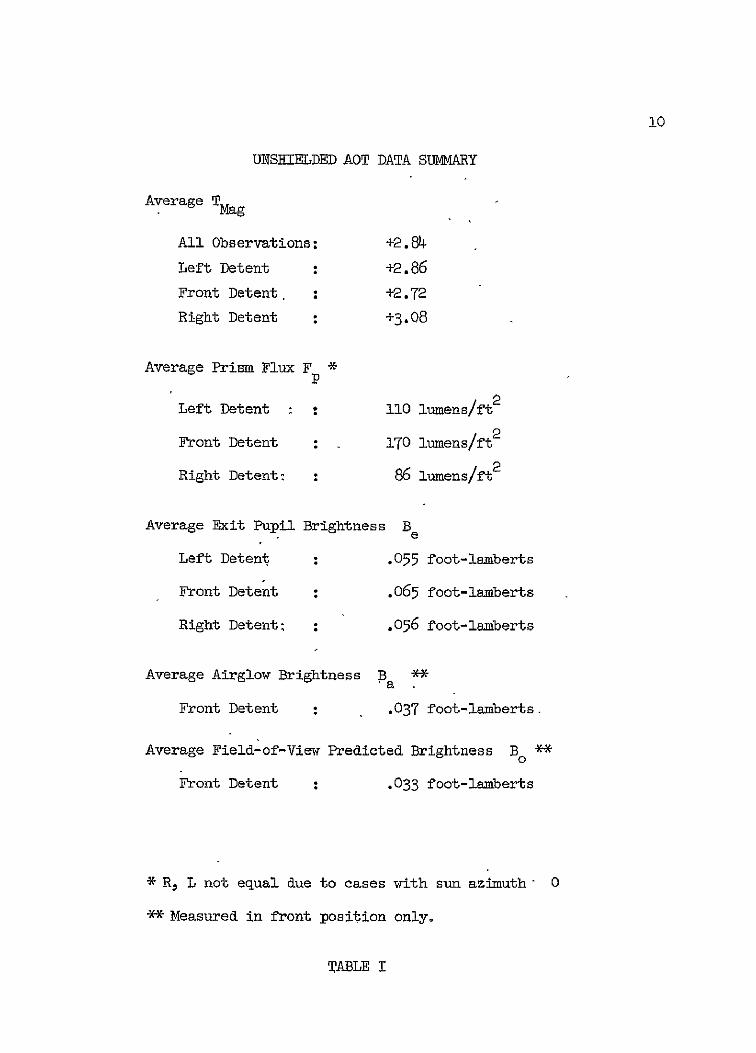
UNSHIELDED AOT DATA SUMMARY
Average TMag
All Observations: +2.84
Left Detent +2.86
Front Detent, +2.72
Right Detent : +3.08
Average Prism Flux F *
p
110 lumens/ft2 Left Detent
170 lumens/ft2
Front Detent :
Right Detent2 : 86 lumens/ft2
Average Exit Pupil Brightness B e
Left Detent : .055 foot-lamberts
Front Detent .065 foot-lamberts
Right Detent; : .056 foot-lamberts
Average Airglow Brightness B *,a
Front Detent : .037 foot-lamberts.
Average Field-of-View Predicted Brightness Bo -
Front Detent : .033 foot-lamberts
* R, L not equal due to cases with sun azimuth- 0
*- Measured in front position only.
TABLE I
Figure 1.- Alinement Optical Telescope
AOT location
Figure 2.-AOT Location in Lunar Module
RADAR FENCE SHIELD
V PRISM SHIELD
(FIXED TO OUTER TUBE)
OUTER TUBE
(ROATES PRISM)
PRESENT AOT CONFIGURATION
FIG.3
"Y" LINE
AOT RETICLE
FIG 4
RENDEZVOUS SUNLIGHT RADAR DISH
TRUNNION HOUSINGS~GYRO PACKAGE
ALZAK ALUMINUM LM STRUCTURE
SCATTERED LIGHT SOURCES
FIG. 5
Figure 6.-AOT Visibility Simulator
Figure 7.-AOT Simulator Operation
Figure 8.- Black Gyro Package
Figure 9.- Specular Gyro Package
Figure 10.- Specular Gyro Package and Mirror
Figure 11.- Single Planar Shield Configuration
Figure 12.- Two Planar Shield Configuration
Figure 13.- First Prototype AOT Sunshade
ie
Figure 14.- Second Prototype AOT Sunshade (front view)
Figure 18.- MSC Third Prototype AOT Sunshade (front view)
Figure 19.- MSC Third Prototype AOT Sunshade (side view)
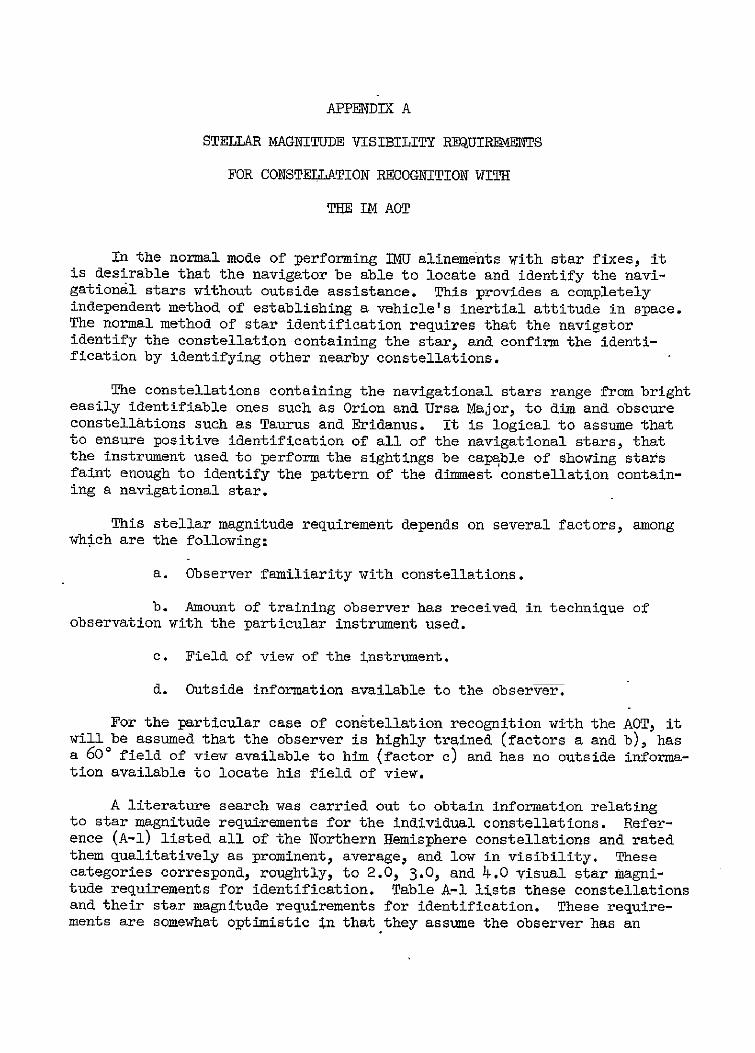
APPENDIX A
STELLAR MAGNITUDE VISIBILITY REQUIREMENTS
FOR CONSTELLATION RECOGNITION WITH
THE TM ACT
In the normal mode of performing IMU alinements with star fixes, it is desirable that the navigator be able to locate and identify the navigational stars without outside assistance. This provides a completely independent method of establishing a vehicle's inertial attitude in space.The normal method of star identification requires that the navigator identify the constellation containing the star, and confirm the identification by identifying other nearby constellations.
The constellations containing the navigational stars range from brighteasily identifiable ones such as Orion and Ursa Major, to din and obscure constellations such as Taurus and Eridanus. It is logical to assume that to ensure positive identification of all of the navigational stars, that the instrument used to perform the sightings be capable of showing stars faint enough to identify the pattern of the dimmest constellation containing a navigational star.
This stellar magnitude requirement depends on several factors, among which are the following:
a. Observer familiarity with constellations.
b. Amount of training observer has received in technique of observation with the particular instrument used.
c. Field of view of the instrument.
d. Outside information available to the observer.
For the particular case of constellation recognition with the AOT, it will be assumed that the observer is highly trained (factors a and b), has a 600 field of view available to him (factor c) and has no outside information available to locate his field of view.
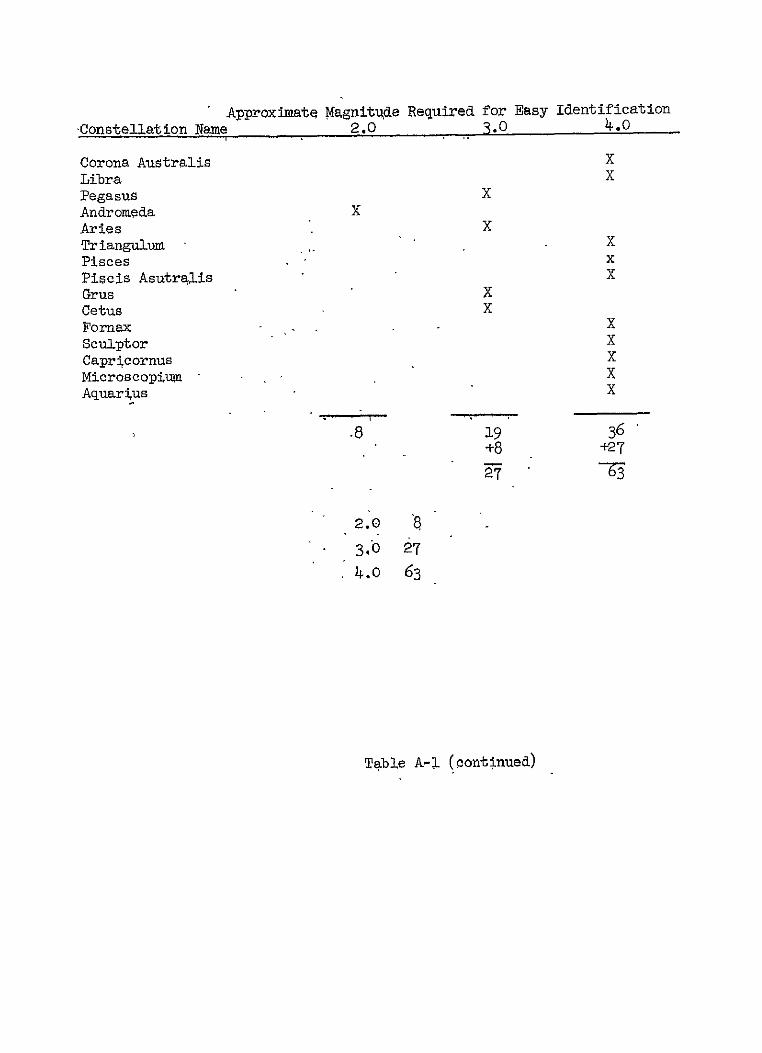
A literature search was carried out to obtain information relating to star magnitude requirements for the individual constellations. Reference (A-1) listed all of the Northern Hemisphere constellations and rated them qualitatively as prominent, average, and low in visibility. These categories correspond, roughtly, to 2.0, 3.0, and 4.0 visual star magnitude requirements for identification. Table A-1 lists these constellations and their star magnitude requirements for identification. These requirements are somewhat optimistic in that they assume the observer has an
A-2
unlimited (1800) field of view and that he can use previously identified bright stars and constellations to aid in the identification of the more difficult dim constellations.
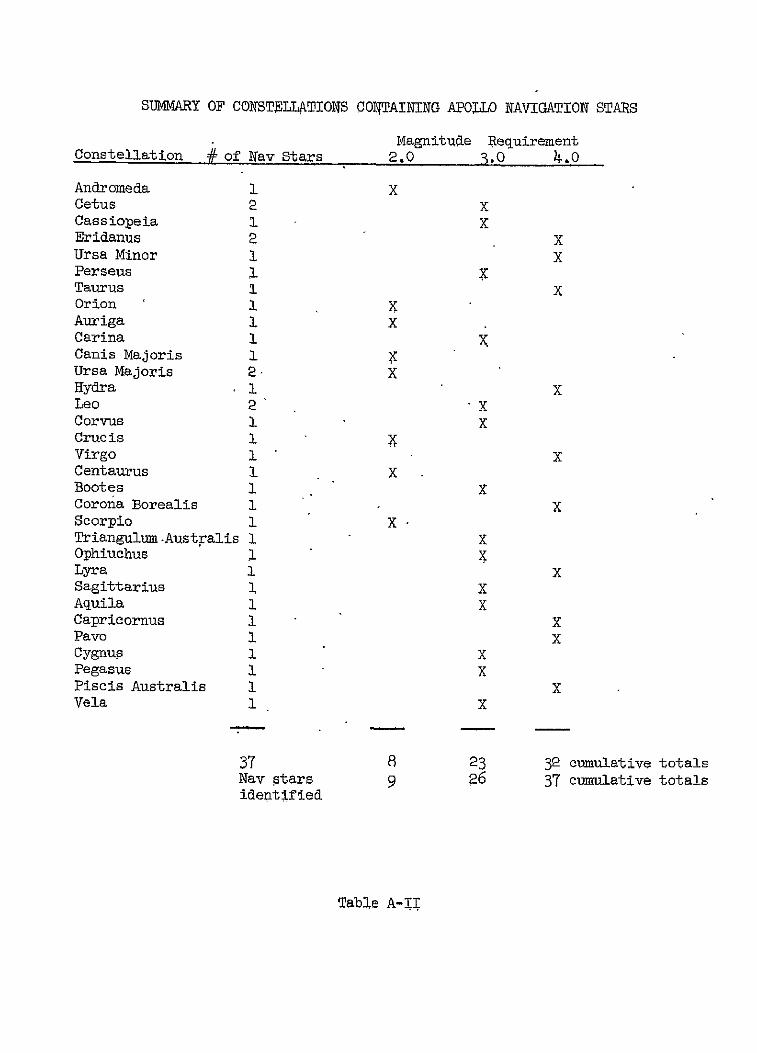
Of the 63 Northern Hemisphere constellations, a capability of seeing +2.0 magnitude stars allows 8 to be identified, +3.0 allows 27, and +40 al allows most of the remainder. Table A-II lists only those constellations containing the 37 Apollo navigational stars and gives the visual stellar magnitude requirements for their identification. Of these 32 constellations 8 may be identified with +2.0 magnitude stars visible, ?3 with +3.0 magnitude, and all 32 with +4.0 magnitude. This corresponds, in terms of navigational stars identified, to 9 stars with +2.0 magnitude, 26 with +3.0 magnitude, and all 37 with +4.0 magnitude.
Applying this data to the case of using the AOT on the lunar surface, estimates can be made of the probability of a successful navigational star identification for a given star magnitude visibility capability under the"best case" conditions specified.,
2.0 Magnitude Capability. - Based on flight crew comments and observations made with the AOT under simulated lunar surface lighting conditions, a +2.0 magnitude capability is all that may be expected under operational conditions with the present unshielded AOT configuration. Given that 3 detent positions may be used if the sun is constrained to be behind the IM, the following probabilities of success exist for performing a single navigational star acquisition and identification.
a. One Detent
= # of identifiable navstars Total i of navstars
=29 37
= .24
b. Two detents
P 2= p + P1 (1.0 - Pz1 = P + (0.24) (1.0 0.24)
= o.42
c. Three d~tents
P2 = P2+ P1 (1.o- P 2
A-3
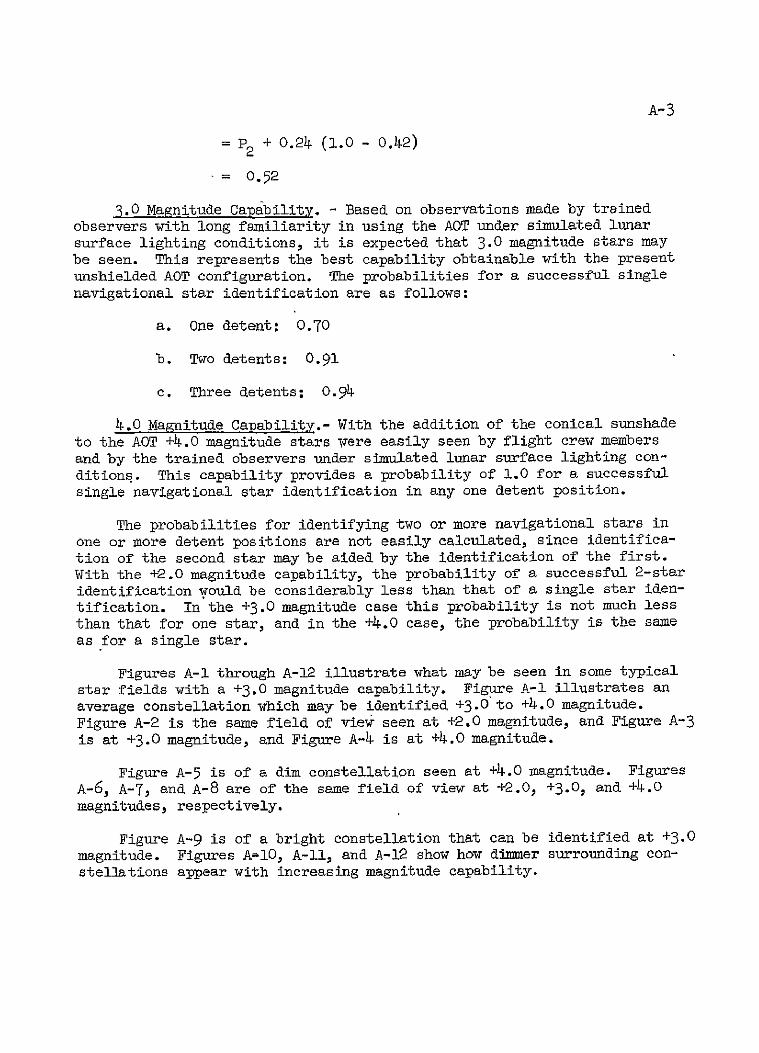
= P2 + 0.24 (1.0 - 0.42)
= 0.52
9.0 Magnitude Capability. - Based on observations made by trained observers with long familiarity in using the AOT under simulated lunar surface lighting conditions, it is expected that 3.0 magnitude stars may be seen. This represents the best capability obtainable with the present unshielded AOT configuration. The probabilities for a successful single navigational star identification are as follows:
a. One detent: 0.70
b. Two detents: 0.91
c. Three detents: 0.94
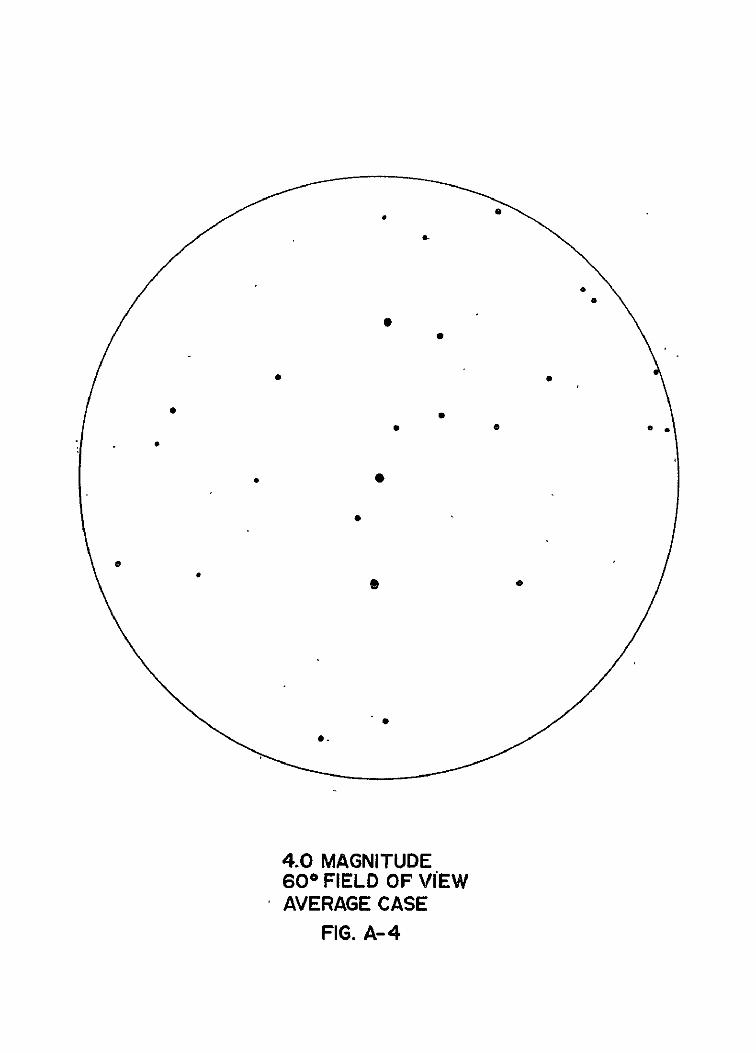
4.0 Magnitude Capability.- With the addition of the conical sunshade to the AOT +4.0 magnitude stars were easily seen by flight crew members and by the trained observers under simulated lunar surface lighting conditions. This capability provides a probability of 1.0 for a successful single navigational star identification in any one detent position.
The probabilities for identifying two or more navigational stars in one or more detent positions are not easily calculated, since identification of the second star may be aided by the identification of the first. With the +2.0 magnitude capability, the probability of a successful 2-star identification would be considerably less than that of a single star identification. In the +3.0 magnitude case this probability is not much less than that for one star, and in the +4.0 case, the probability is the same as for a single star.
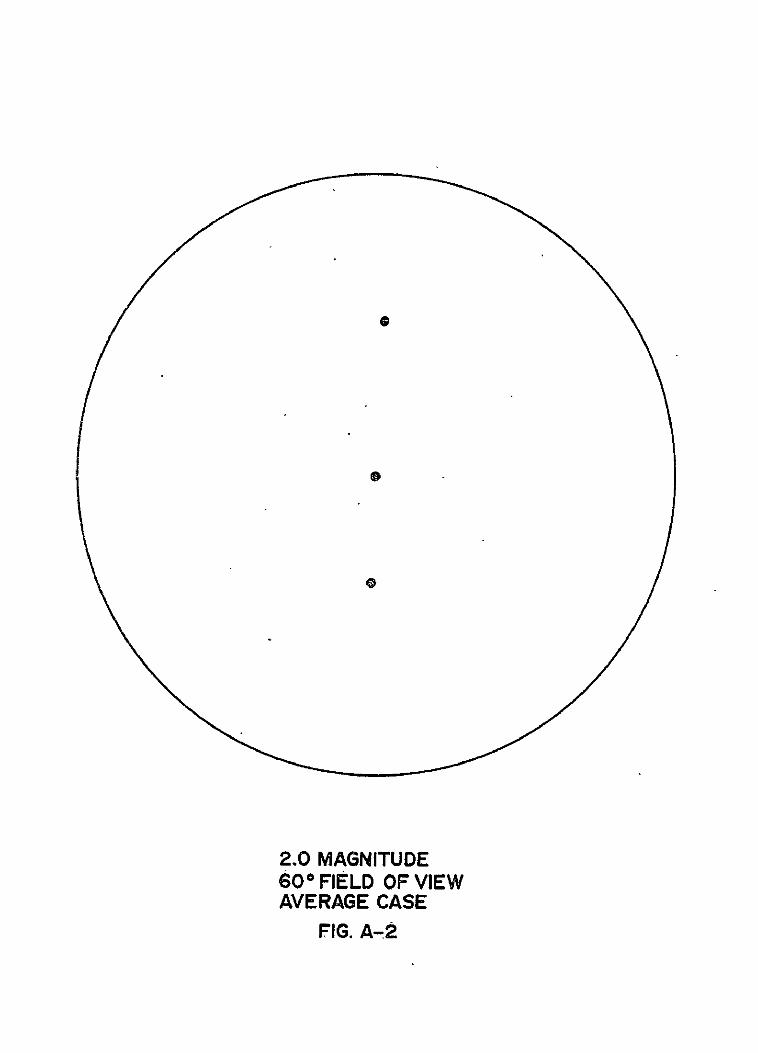
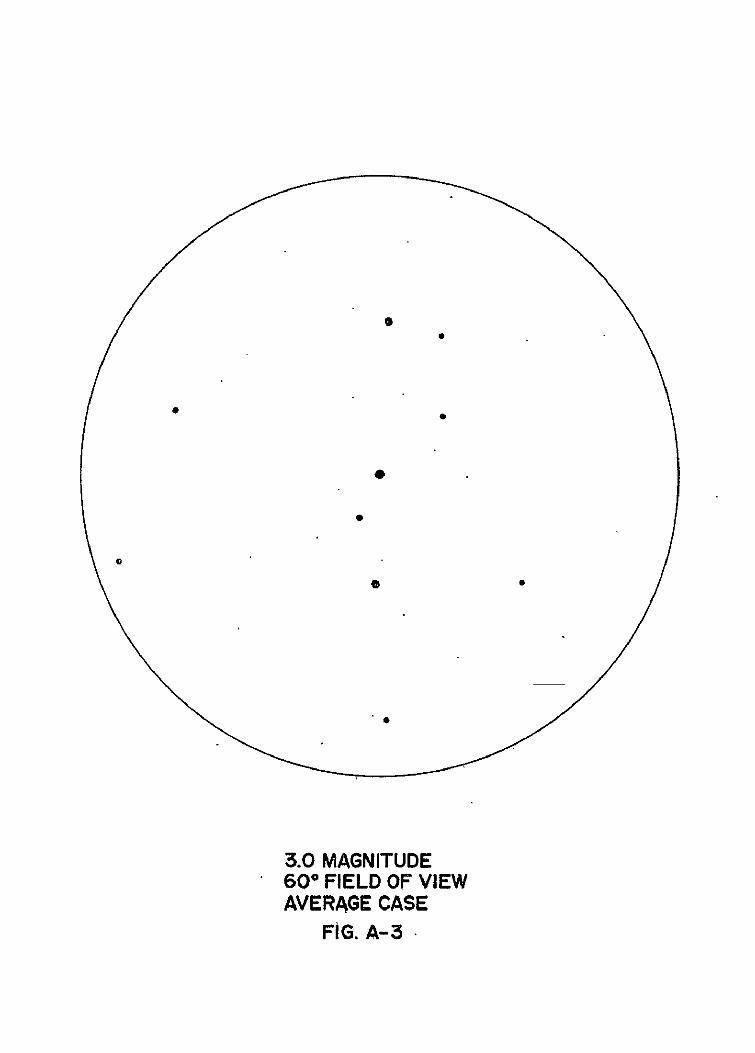
Figures A-1 through A-12 illustrate what may be seen in some typical star fields with a +3.0 magnitude capability. Figure A-1 illustrates an average constellation which may be identified +3.0 to +4.0 magnitude. Figure A-2 is the same field of view seen at +2.0 magnitude, and Figure A-3 is at +3.0 magnitude, and Figure A-4 is at +4.0 magnitude.
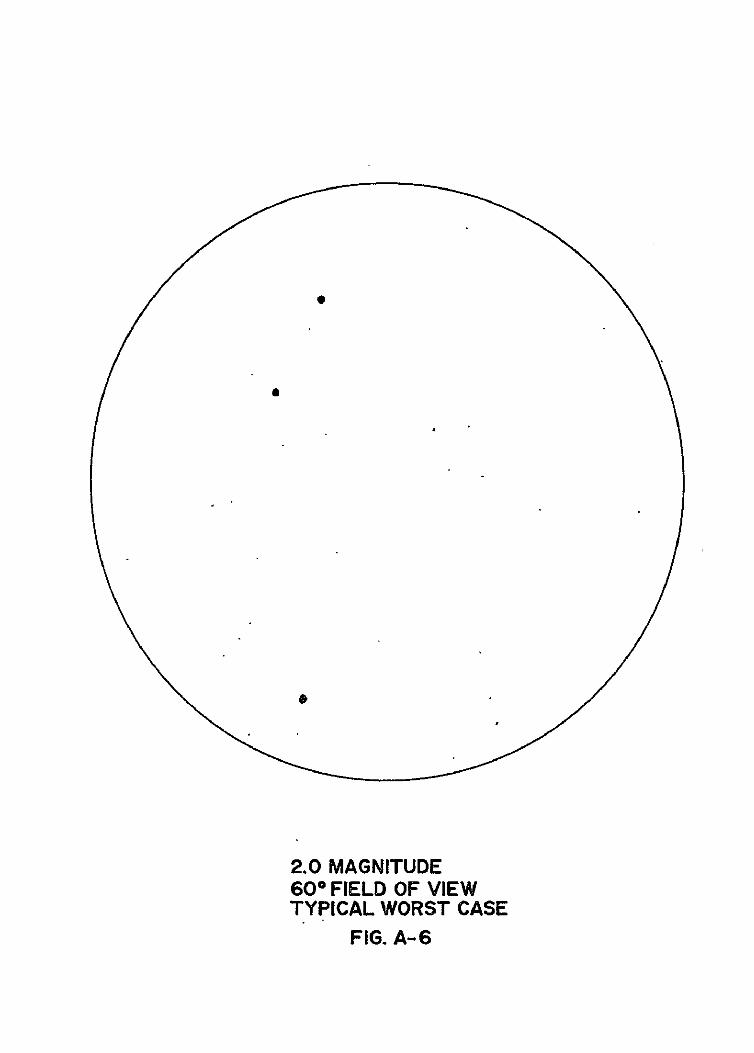
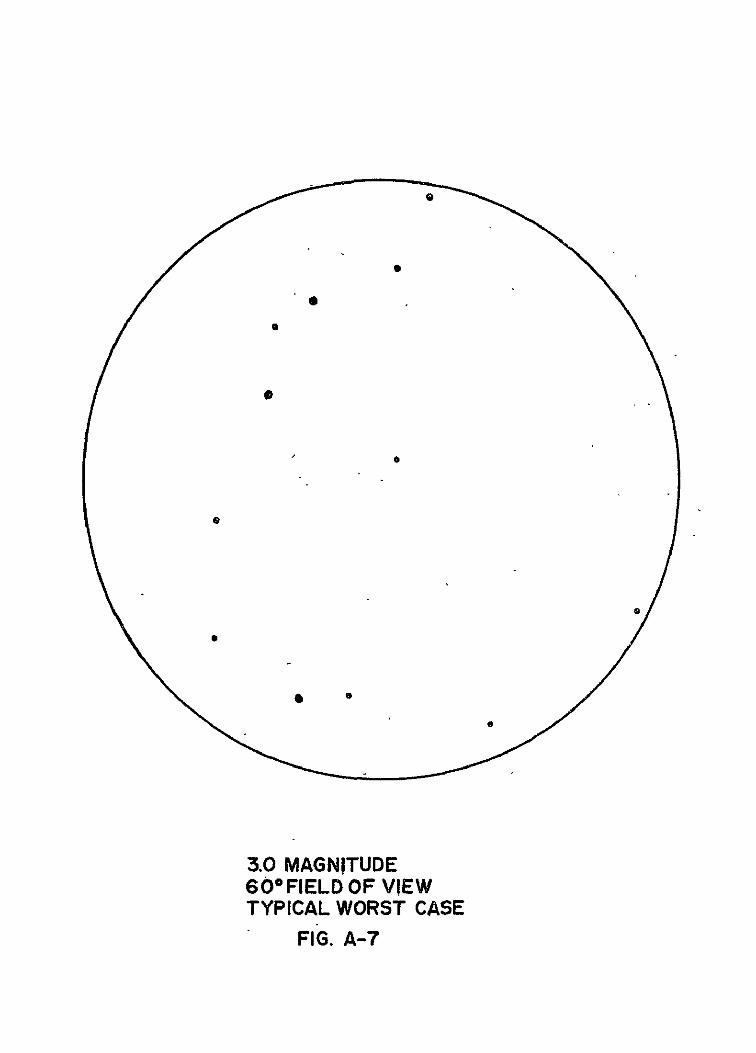
Figure A-5 is of a dim constellation seen at +4.0 magnitude. Figures A-6, A-7, and A-8 are of the same field of view at +2.0, +3.0, and +4.0 magnitudes, respectively.
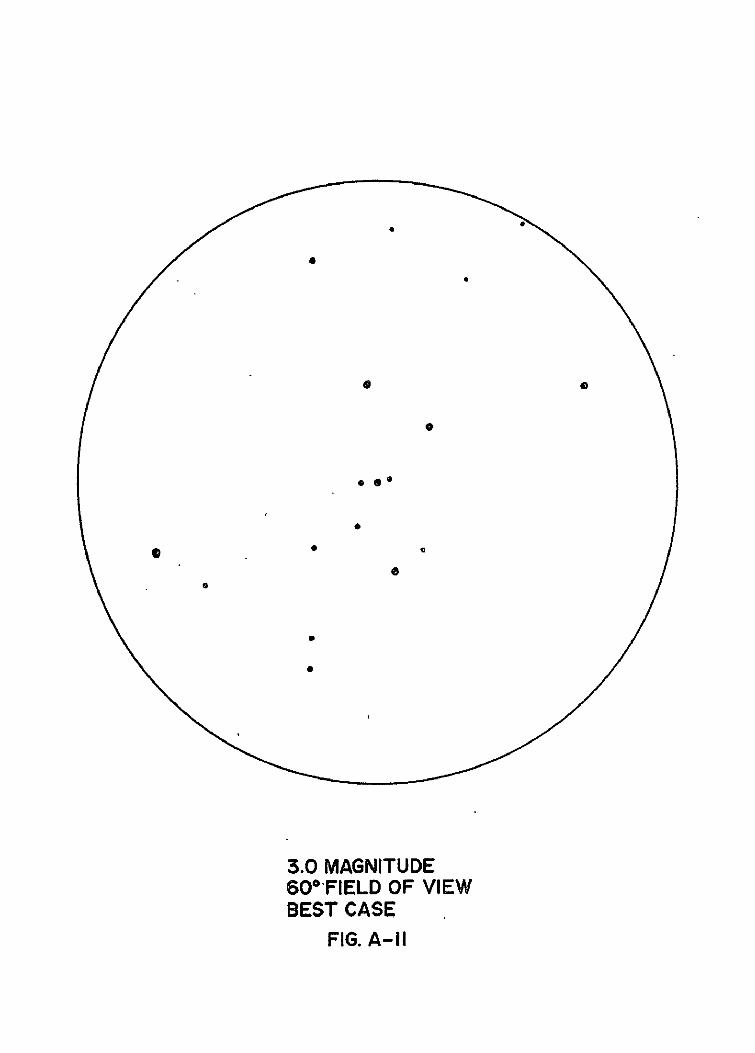
Figure A-9 is of a bright constellation that can be identified at +3.0 magnitude. Figures A-10, A-11, and A-12 show how dimmer surrounding constelations appear with increasing magnitude capability.
SUMMARY OF NORTHERN CONSTELLATIONS
Approximate Magnitude Required for Easy Identification
Constellation Name
Ursa Major Ursa Minor Cassioeia Cepheus Lacerta Draco Camelopardalus Lynx Canes Venaceti Orion Canis Major Canis Minor Monoceros Argo Navis Pyxis Antlia Gemini Auruga Perseus Taurus Eridanus Lepus Coluiba Caelm Bootes Corona Borealis Virgo Leo Leo Minor Sextans Coma Berenices Cancer Hydra Corvus Crater Centaurus Lyra Cygnus Aquila Delphinius Equleeus Sagitta Vulpecula Hercules Ophinuchus Serpens Scorpio Sagittarius
2.0- 3.0 4.0
X X
X X X X X X X
X X
X X
X X X
X X
X X X
X X
X X
X X
X X X X X X
X X
X X
X X
X X X X
X X
X X X
Table A-l
Approximate Magnitude Required for Easy Identification Constellation Name 2.0 3.0 4.0
XCorona Australis XLibra
Pegasus X Andromeda X Aries X
XTriangulum xPisces
Piscis Asutralis X
Grus X Cetus X
XFornax XSculptor XCapricornus
Microscopium x Aquarius x
.8 19 36 +8 +27
2.0 8
3 .b 27
4.0 63
Table A-l (continued)
SUMMARY OF CONSTELLATIONS COJTAINING APOLLO NAVIGATION STARS
Magnitude 1equirementConstellation ot Nay Stars 2.0 S.0 4.0
Andromeda I X Cetus 2 x Cassiopeia 1 X Eridanus 2 X Ursa Minor 1 X Perseus I Z Taurus 1 X Orion 1 Auriga 1 x Carina 1 x Canis Majoris 1 Ursa Majoris 2 X Hydra 1 X Leo 2 "X Corus 1 X Crucis 1 X Virgo 1 X Centaurus 1 X Bootes 1 X Corona Borealis 1 X Scorpio 1 X Triangulum Australis 1 X Ophiuchus I x Lyra 1 X Sagittarius 1 X Aquila 1 X Capricornus 1 X Pavo 1 X Cygnus 1 X Pegasus I X Piscis Australis 1 X Vela 1 X
4.0 MAGNITUDE 600 FIELD OF VIEW( I.D. CHART) AVERAGE CASE (URSA MAJOR),
FIG, A-I
0
2.0 MAGNITUDE 600 FIELD OF VIEW AVERAGE CASE
FIG. A-2
3.0 MAGNITUDE 60* FIELD OF VIEW AVERAGE CASE
FIG. A-3
4.0 MAGNITUDE
600 FIELD OF VIEW AVERAGE CASE
FIG. A-4
, ...d'URSA"..°
-. MAJOR
ALKAID I 'N
/ A BOOTES'\ 23
TYALIDTAS
4 APOLLO NAVIGATIONAL STAR
4. 0 MAGNITUDE °60 FIELD OF VIEW CI. D.CHART)
TYPICAL WORST CASE FIG. A-5
0
2.0 MAGNITUDE 600 FIELD OF VIEW TYPICAL WORST CASE
FIG. A-6
3.0 MAGNITUDE 600 FIELD OF VIEW TYPICAL WORST CASE
FIG. A-7
Q0
4,.0 MAGNITUDE 60 ° FIELD OF VIEW TYPICAL WORST CASE
FIG. A-8
"-TAURU ,
I / I II/
_./ORION
ALDEBARAkN
.
I" I
/SIRTU CANIS
\MAJOR • .
-o
--.
RIGEL
4.0 MAGNITUDE 600 FIELD OF VIEW BEST CASE (ORION)
FIG. A-9
4.0 MAGNITUDE 600 FIELD OF VIEW BEST CASE
FIG. A-10
3.0 MAGNITUDE 60°-FIELD OF VIEW BEST CASE
FIG. A-11
4.0 MAGNITUDE
600. FIELD OF VIEW BEST CASE
FIG. A-12
APPENDIX B
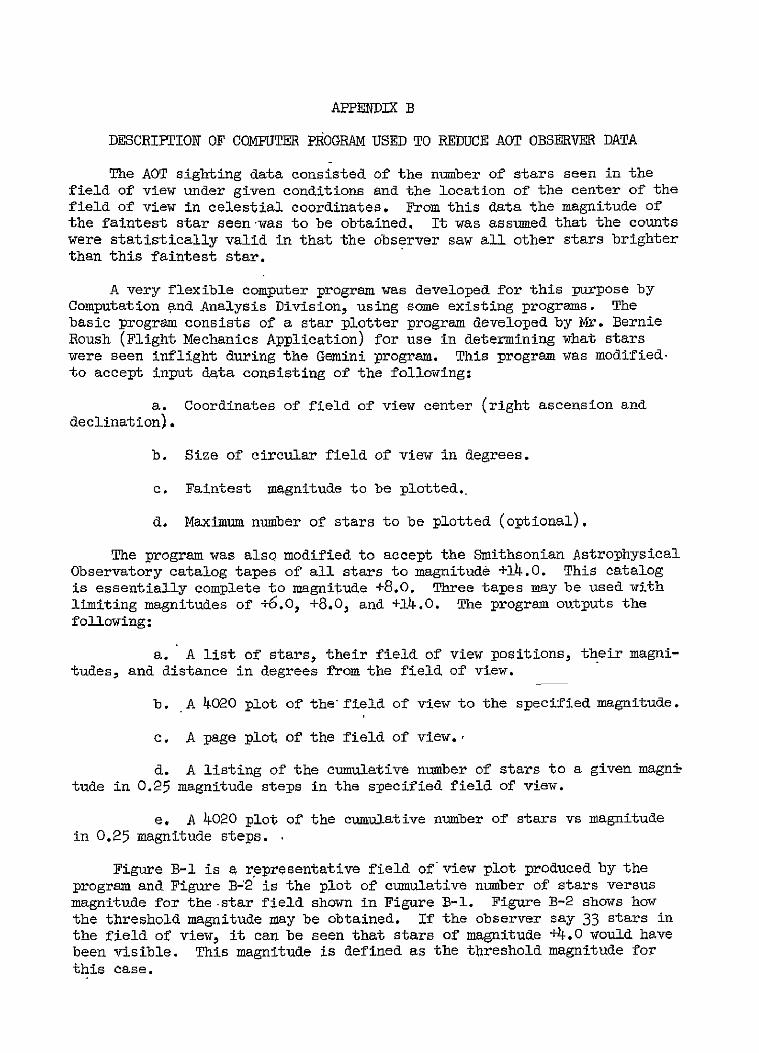
DESCRIPfTION OF COMPUTER PROGRAM USED TO REDUCE AOT OBSERVER DATA
The AOT sighting data consisted of the number of stars seen in the field of view under given conditions and the location of the center of the field of view in celestial coordinates. From this data the magnitude of the faintest star seen was to be obtained. It was assumed that the counts were statistically valid in that the observer saw all other stars brighter than this faintest star.
A very flexible computer program was developed for this purpose by Computation and Analysis Division, using some existing programs. The basic program consists of a star plotter program developed by Mr. Bernie Roush (Flight Mechanics Application) for use in determining what stars were seen inflight during the Gemini program. This program was modifiedto accept input data consisting of the following:
a. Coordinates of field of view center (right ascension and declination).
b. Size of circular field of view in degrees.
c. Faintest magnitude to be plotted..
d. Maximum number of stars to be plotted (optional).
The program was also modified to accept the Smithsonian Astrophysical Observatory catalog tapes of all stars to magnitude +14.0. This catalog is essentially complete to magnitude +8.0. Three tapes may be used with limiting magnitudes of +6.0, +8.0. and +14.0. The program outputs the following:
a. A list of stars, their field of view positions, their magnitudes, and distance in degrees from the field of view.
b. A 4020 plot of the field of view to the specified magnitude.
c. A page plot of the field of view.,
d. A listing of the cumulative number of stars to a given magni tude in 0.25 magnitude steps in the specified field of view.
e. A 4020 plot of the cumulative number of stars vs magnitude in 0.25 magnitude steps.
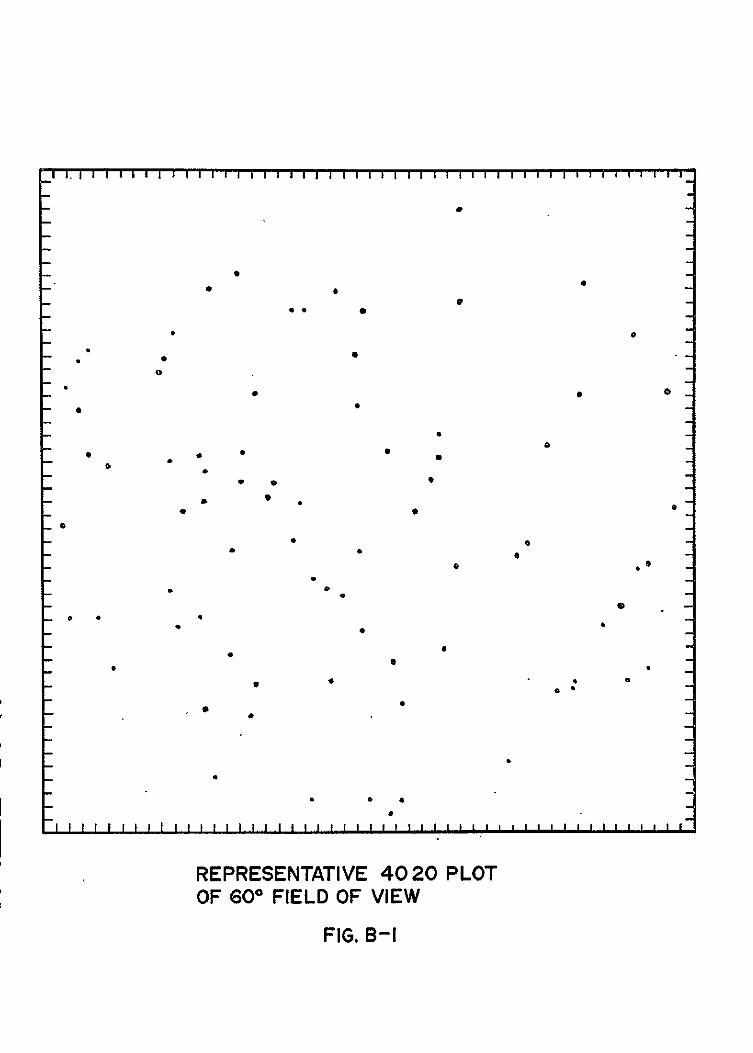
Figure B-1 is a representative field of view plot produced by the program and Figure B-2 is the plot of cumulative number of stars versus magnitude for the -star field shown in Figure B-1. Figure B-2 shows how the threshold magnitude may be obtained. If the observer say 33 stars in the field of view, it can be seen that stars of magnitude +4.0 would have been visible. This magnitude is defined as the threshold magnitude for this case.
0*0
*m C
00
0 S
I I [ I II J I I J I I I I
REREENATV OF69FEL FVE
FI .
I I I I
4*2
-
Si I I I
PO
i i I I I
80 _
70
60
50-- - _ _ - _ _ _
40-----_ __
30 ---- _
4020 -_
10 _
2 -1 0 +1 +2 STAR MAGNITUDE
+3 +4 *5
CUMULATIVE
FIGURE B-I
NO, OF STARS VS. STAR MAGNITUDE PLOT
FIG. B-2
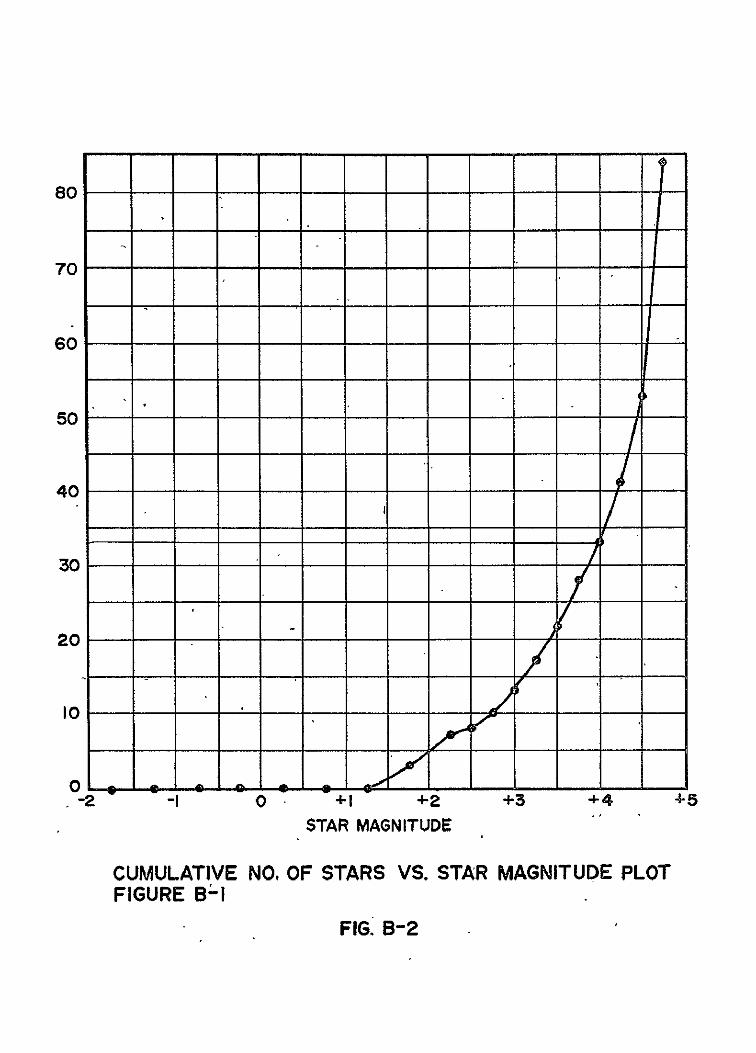
APPENDIX C
AOT REAR DETENT CALIBRATION ANALYSIS
A result of tmplementing the AOT conical sunshade is the removal of the restriction of using only the forward detent positions. It was desired to verify Kollsman Instruments Corporation calculations for rear detent line of sight locations by developing a computer program to calculate these locations for direct comparison. It was also desired to determine the errors in rear detent location resulting from uncertainties in the locations of the calibrated front three'detents. The following analysis was performed and a computer program written to implement the analysis..
Definition of Known Variables
a. Elevation and azimuth angles Gn and O of the forward 3 detents in navigational base coordinates.
b. 30 arc second uncertainty in the location of the forward 3 detent positions.
Calibration Analysis - Figure C-1 defines the coordinate system X, Y, and Z used to represent the reference frame of the navigational base. The forward 3 detents are defined as unit vectors in this coordinate systems:
Left Detent: A
L_ = dC0 A eL L+5Wel-+-SL4 can K (i)
Front Detent: A
Right Detent: A
-, 2,3, and , , ,are the elevation and azimuth calibration
angles of the tp F, andA unit vectors. Figure C-2 defines three new vectors A ^ A as follows:
A B3,and C,4 AA- -F+L4 ()
/3z F-rR(5) -1 - .4 (6)c= gBl (6
C-2
AA A The unit vectors L. F, and R define a cone whose apex is located at the
Aorigin of coordinate system X, Y, and Z and whose axis is the vector C. A, C is also perpendicular to the plane containing the end points of unit
AA A A vectors L. F, and R. The vector C is now defined as lying along C and p is of magnitude just sufficient to touch the plane defined by the end
AA Apoints of vectors L, F, and R. The angle -J is defined as the half angle
of the cone and is determined from the equation:
and
e:&X-TiF fC/ 'RJ= d
A
We now define c., c., and c as the components of C as obtained from3 A Eqain()hnq 3Equation (6). Then c{, c 3 ctare the components of Cpt
1= c Cos.CL (9)
= % cos (10)
o = c Cost 1 (11)
The coordinates of the center of the circle defined by the cone and the A A A
plane containing the end points of L, F, and R are then c e c .
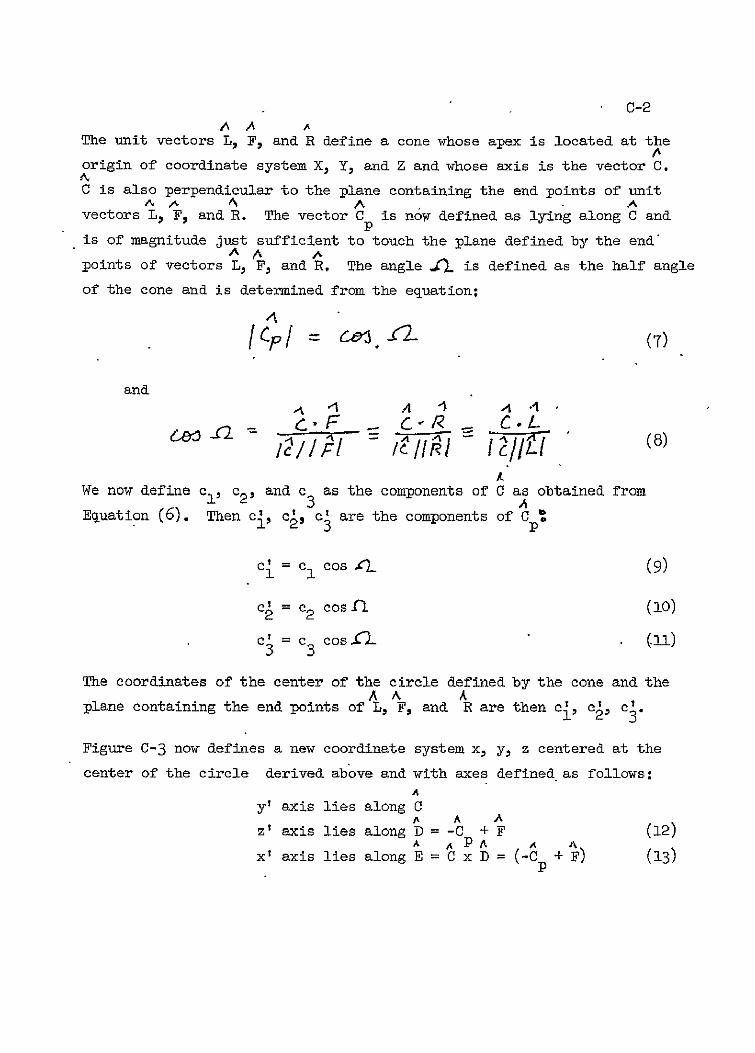
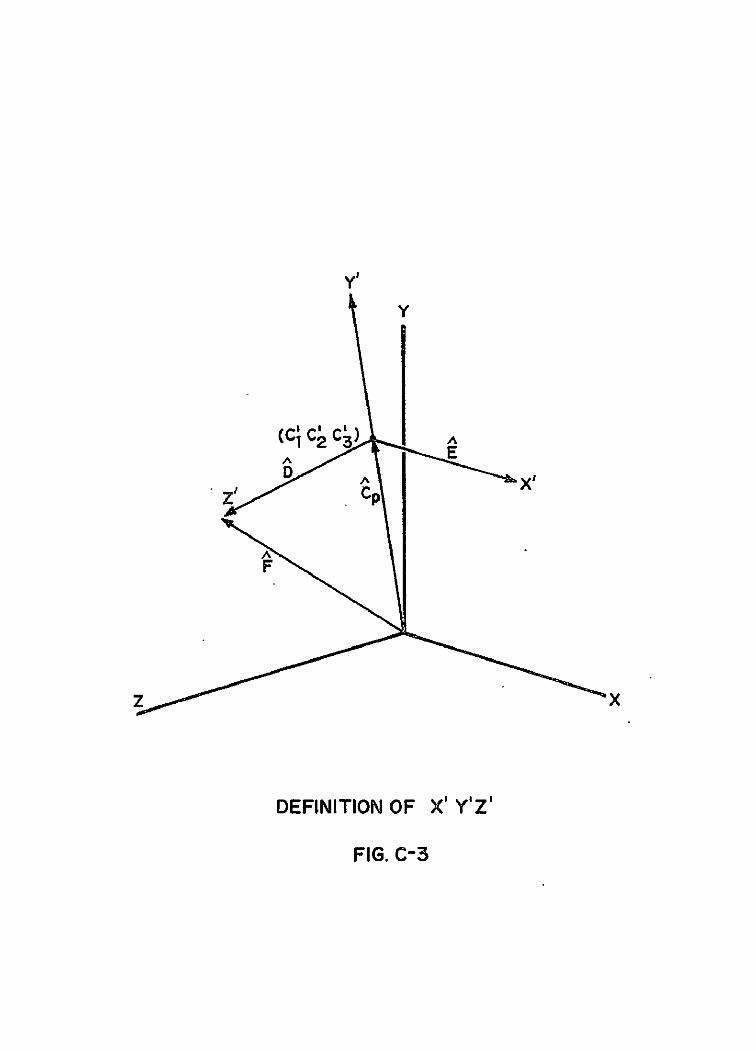
Figure C-3 now defines a new coordinate system x, y. z centered at the
center of the circle derived above and with axes defined as follows: A
y' axis lies along C A A A
z' axis lies along D = -C + F (12) A AaPA A i
x' axis lies along ES C x DB (-C + F) (13)
C-3
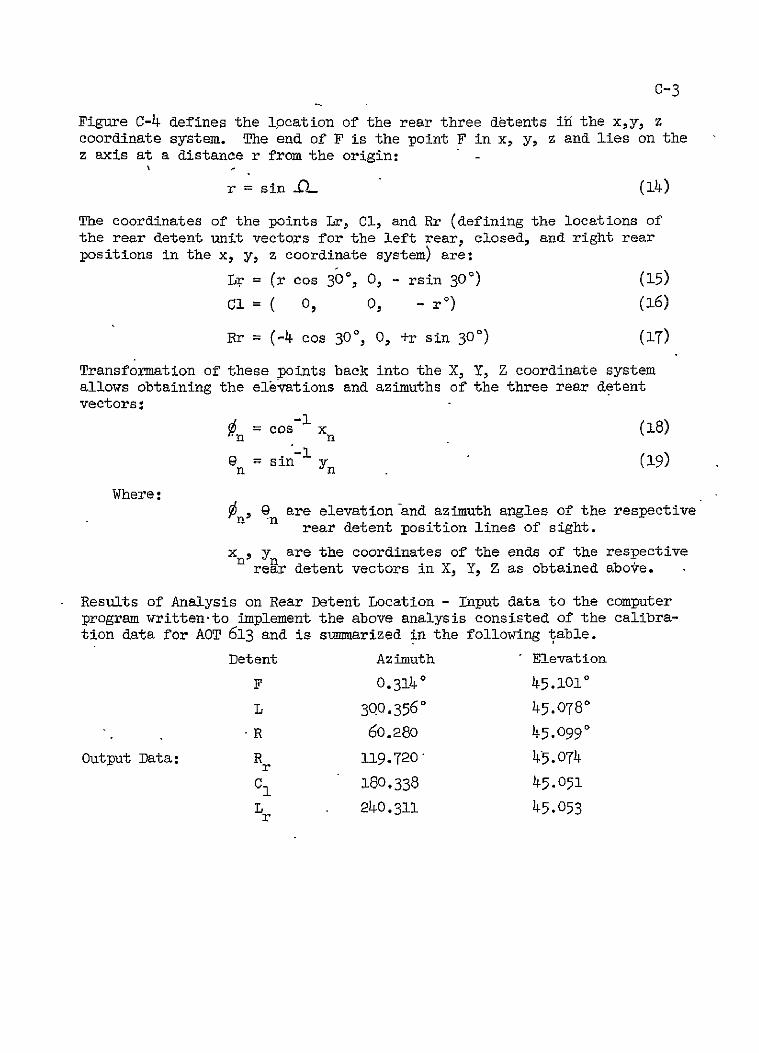
Figure C-4 defines the lpocation of the rear three detents in the x,y, z coordinate system. The end of F is the point F in x, y, z and lies on the z axis at a distance r from the origin:
r = sin _t- (i4)
The coordinates of the points Lr, Cl, and Rr (defining the locations of the rear detent unit vectors for the left rear, closed, and right rear positions in the x, y, z coordinate system) are:
Lr = (r Cos 300, O, - rsin 300) (15)
C1( 0, O, -r °) (16)
Rr = (-4 Cos 300, 0, +r sin 300) (17)
Transformation of these points back into the X, Y, Z coordinate system allows obtaining the elevations and azimuths of the three rear detent vectors:
on Cos Zn (18)
9n = sin yn (19)
Where: Wn n are elevation and azimuth angles of the respective rear detent position lines of sight.
xrn yn are the coordinates of the ends of the respective rear detent vectors in X, Y, Z as obtained above.
Results of Analysis on Rear Detent Location - Input data to the computer program written-to implement the above analysis consisted of the calibration data for ACT 613 and is summarized in the following table.
Detent Azimuth Elevation
F 0.3140 45.3-010
L 3Q0.3560 45.0780 ° R 60.280 45.099
Output Data: R 119.720' 45.074r
Cl 180.338 45.051
Lr 240.311 45.053
c-4
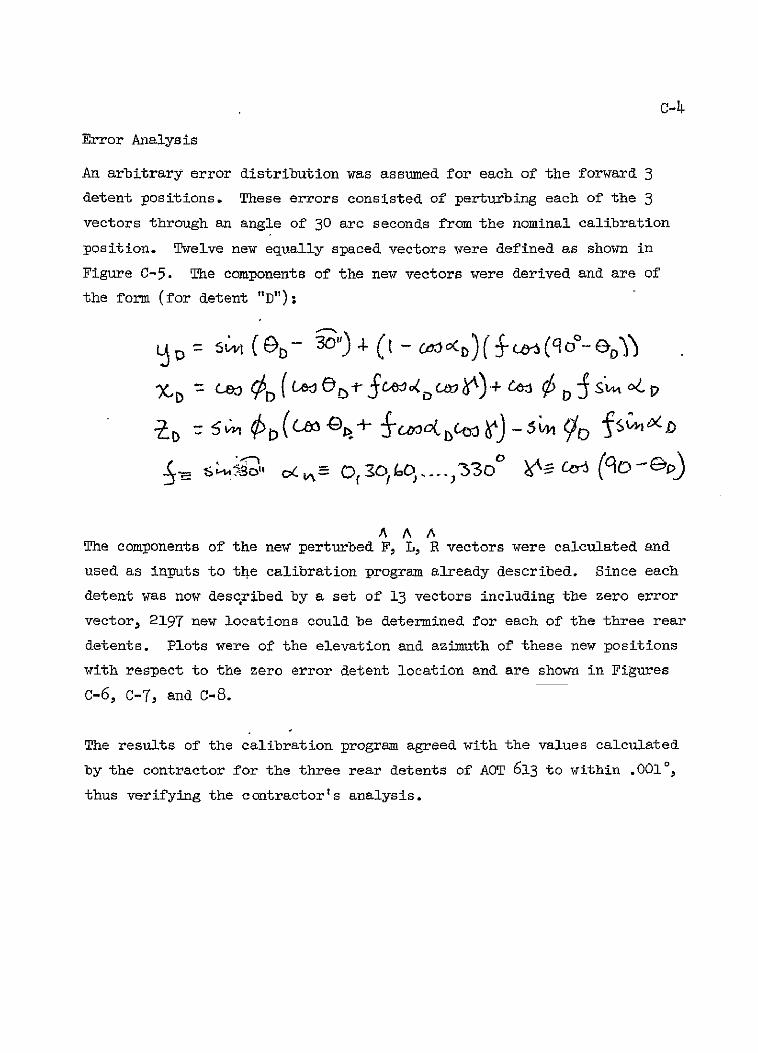
Error Analysis
An arbitrary error distribution was assumed for each of the forward 3 detent positions. These errors consisted of perturbing each of the 3
vectors through an angle of 30 arc seconds from the nominal calibration
position. Twelve new equally spaced vectors were defined as shown in
Figure C-5. The components of the new vectors were derived and are of
the form (for detent "D").
=D 5 (% 30) a-(
%-M (C,63(L &Ctfl0 bCO4WwY fsVIoco4D,+ V
A AA
The components of the new perturbed F. L, R vectors were calculated and
used as inputs to the calibration program already described. Since each
detent was now described by a set of 13 vectors including the zero error
vector, 2197 new locations could be determined for each of the three rear
detents. Plots were of the elevation and azimuth of these new positions
with respect to the zero error detent location and are shown in Figures
c-6. C-7. and c-8.
The results of the calibration program agreed with the values calculated
by the contractor for the three rear detents of A0T 613 to within .0010,
thus verifying the contractor's analysis.
Y
A R
NAV-BASE COORDINATE SYSTEM
FIG. C-I
x
A
AA AA
z
DEFINITION OF A,B,C VECTORS
FIG. C-2
y
z E
DEFINITION OF X' Y'Z'
FIG. C-3
RR CL
REAR DETENT LOCATION
FIG. C-4
VI
ERROR VECTOR DEFINITION
FIG. C-5
It -•
- ** • • O %
4 *I
4 IG S . C -
4. .
IS.0M) *1 I2 I m too It
* * * FIG. C-6
* o 00
s 0 4o0 0 : - 0
0
4
S 4 C *4l44 *10 * * 44• 00
--- , -, *. 4 50 0
i...•1 . min o
LEFT REAR DETENT POSITION UNCERTAINTY
FIG. C-7
'.'.:. . na.•. .
* - S
*e • •S*
*o I 5 • 5o .ll.
* * 9S ¢ S 0
55 S S 555 5 *o
* S4
* - -
.. lr
. *: (
°. - ~ .. *
- -041' gOOgtI + ltO .. 5 ...
-AID
* RIGHT REA D5TENT POSITIO UNCERAINT
55 G. 5C- S8 5
APPENDIX D
STAR MAGNITUDE THRESHOLDS FOR THE ALINEMENT OPTICAL TELESCOPE
Reference D-1 contains a complete discussion-of visual detection thresholds and their application to optical performance prediction. The data obtained by the Tiffany Foundation during World War II is tabulated in a very useful form in the referenced document.
The amount of illuminance which must be received from a distant source in order to afford detection with a probability of 0.50 may be called the liminal illuminance threshold, Eth. If the source is sufficiently far away that its subtended angle is below the resolution capability of the eye, then it may be called a point source. For a light-adapted observer, the resolution limit is about one minute bf arc pr less, degrading considerably as the observer becomes dark adapted. For a ciscular point source, the threshold'contrast Cth and the subtended angular diameter 9 are related by Ricco's law which states that
@2 Cth 9 = a constant
From this consideration, and from the reference, it can be shown that
8Eth = 2.1154 x l0- (C9B ) 9 F
Where Eth = illuminance threshold in lumens/ft2
C@ = constant threshold (p=0.50) at B and 9.
9 = subtended angular diameter of the circular target in minutes of arc.
B = adaptation level of the observer (assumed equal to the background luminance).
Applying the method of Reference D-1 an arbitrary small value of 9 was selected and the threshold contrast was obtained from the tabulated data at each adaptation luminance level. A slightly higher angle had to be used at some of the lower luminances because of gaps in the data. For -each set of values, the illuminance threshold was computed. Then, as a check, new angle values weire selected and the calculations repeated. Illuminance thresholds were then found to be in close agreement. Averages of the two illuminance values appear in Table D-1.
In order to increase the probability of detection from 0.50 to 0.99, a field factor of 1.91 has been recommended. A factor of 1.2 is used to cop rect the data obtained with a forced-ehoice temporal test method to represent ordinary "seeing" conditions(R6ference D-2). Transmission of the Alinement Qptical Telescope (AOT) can be accounted for by a further factor of (0.6o)- determined experimentally. In summary, the illuminance thresholds of Table I need to be multiplied by 3.82.
Reference D-1 provides an equation for converting illuminance thresholds into equivalent visual star magnitudes. Taking Eo as the illuminance from a star of zero visual magnitude, the visual magnitude equivalents of the ,corrected illuminance thresholds will be
- 2.51 (log Eo - log (3.82 Eth)
Using a value for Eo of 1.94 x 10⁻⁷ lumens/foot , the star magnitude thresholds of Table D-II have been computed. Detection probabilities of 0.99 and 0.50 have been included. Figure D-1 is a plot of these star magnitude thresholds versus log B , the adaptation luminance in footlamberts.
D-1 Hardy, A.C., "Visibility Data and the use of Optical Aids," Report E-1385, Instrumentation Laboratory, Massachusetts Institute of Technology5 Cambridge, Massachusetts. 1963
D-2 Taylor, J. H., "Use of Visual Performance Data in Visibility Prediction," Applied Optics, Volume 3, Number 5. May 1964
+7.0
+6.0
+5.0
-44.0
+3.0
LU
o +2.0
z
*< +1.0
I 0.0
0 m -1.0 u0.50 ,I " " DETECTION PROBABILITY 0,99
-2.0
-3.0
-4.0 -s-- 10 164 103 102 1j 1 10 100 1000
LOG ADAPTATION LUMINANCE (FOOT-LAMBERTS)
FIGURE .D-1 THRESHOLD STARS MAGNITUDES VERSUS LOG ADAPTATION LUMINANCE FOR AOT TRANSMISSION OF 0.60
APPENDIX E
TEST RESULTS AND DESCRIPION OF PROCEDURE USED
TO ESTABLISH SOLAR AZDT1JTH CONSTRAINTS ON
THE AOT SUNSHADE MODIFICATION
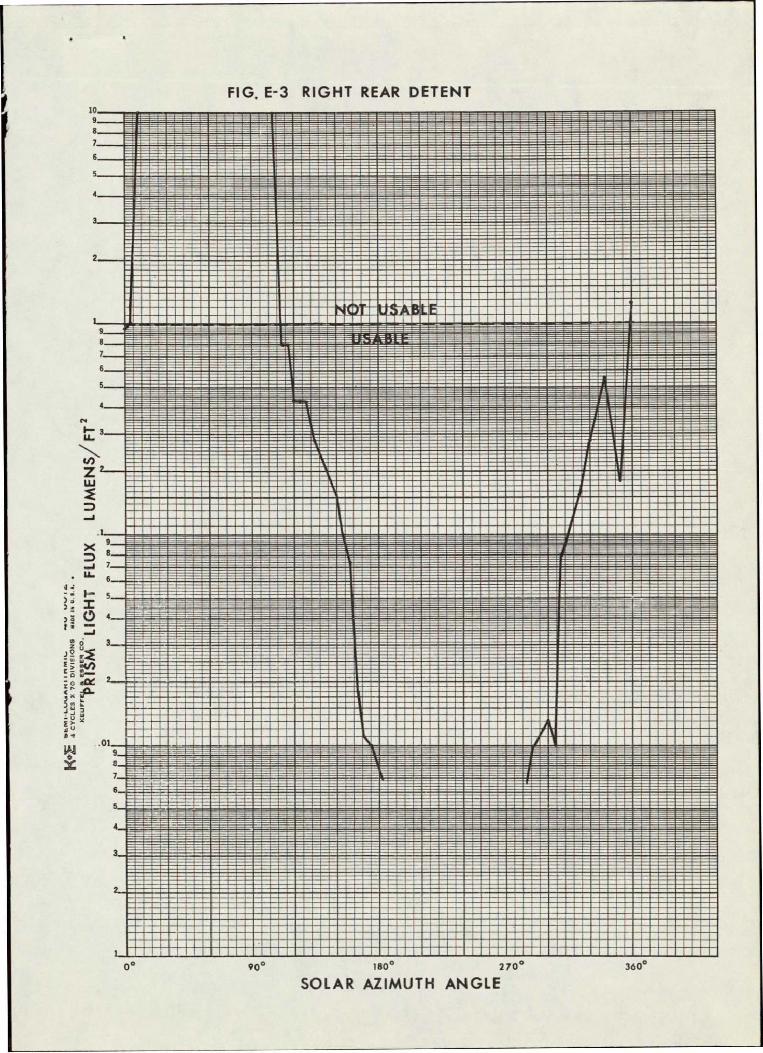
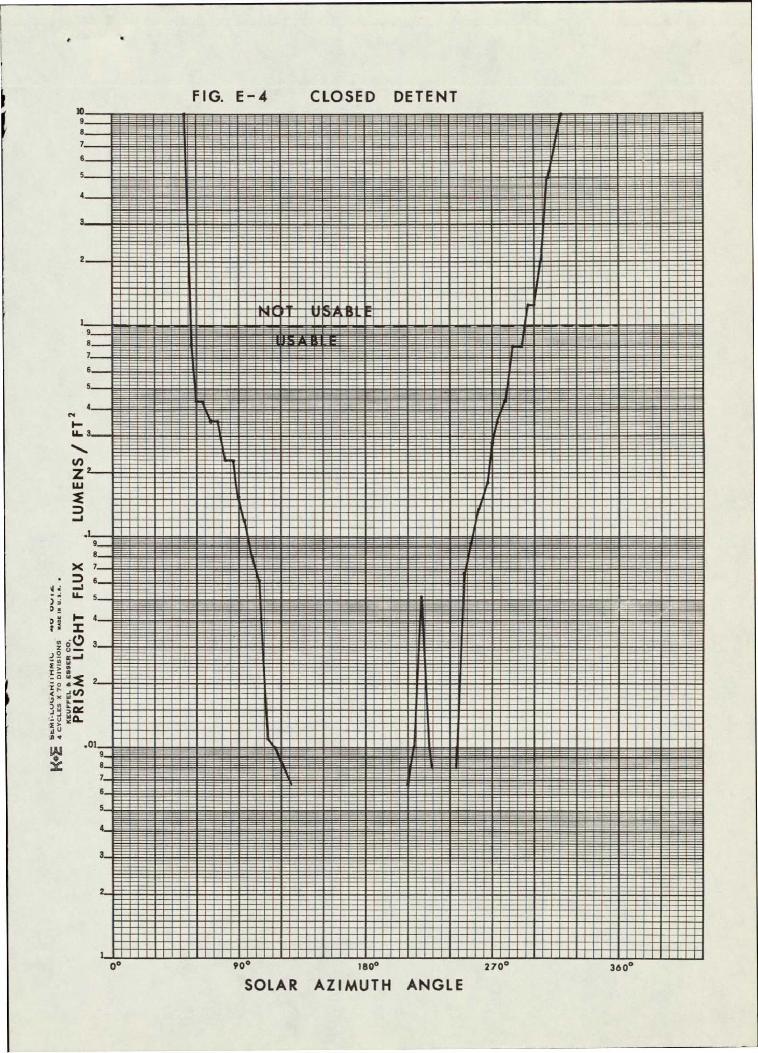
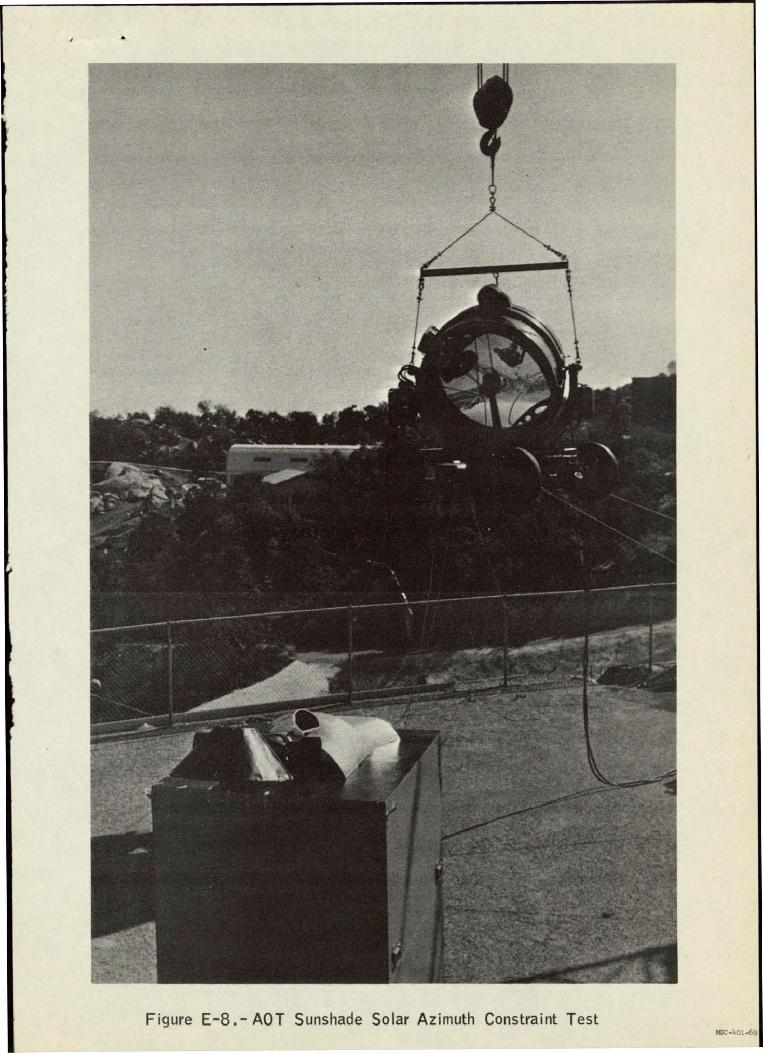
A series of measurements vere made to establish the solar azimuth constraint for the ACT sunshade. These consisted of placing the solar simulator at an elevation of 250 and measuring the incident light on the prism at 50 intervals in azimuth. A Cadmium Sulfide cell calibrated from .01 to 10 foot-candles was used to obtain the illuminance levels at each detent. This cell was located inside the Kollsman Instrument Co. prototype sunshade at the location of the ACT prism. Figures E-1 through E-6 are graphs of the incident light flux on the AOT prism as a function of solar azimuth (00 corresponds to 180' from the forward detent line of sight, increasing counterclockwise viewed from above.) Figure E-7 summarizes the acceptable solar azimuths for each detent, based on a cutoff value of illuminance equal to one lumen/foot2 . Figure E-8 shows the test setup used to obtain this data. It should be noted that a 60" carbon arc light was used for these tests instead of the OKW tungsten lamp used for all other ACT tests, because of its better collimation.
The results of these tests indicate that the sun azimuth constraint on the ACT can be relaxed from the previous requirement of having the sun 900 or more from the normal to the objective prism. A minimum separation angle of 70 0 measured from the center of the ACT field of view in any detent is considered acceptable.
FIG. E-1 FRONT DETENT
. . . .. .
L6
3.
ga 4
I I
a I0 270 itO
SOLAR AZIMUTH ANGLE
FIG. E-2 RIGHT DETENT
ts
S...
IN
SOLAR AZIMUTH ANGLE
FIG. E-3 RIGHT REAR DETENT
L4
L.
. . . . . .. ...l z
060o 16 09 270* 360"
SOLAR AZIMUTH ANGLE
FIG. E-4 CLOSED DETENT
uj
44
'4
54
tI
1
0 too loop 2700 36e0
SOLAR AZIMUTH ANGLE
FIG. E-5 LE'FT REAR DETENT
I.
4-
Lu
1609S. 270* 360C
SOLAR AZIMUTH ANGLE
FIG. E-6 LEFT DETENT
6
48
'
tr.LLA.
u
90to 1o 270' 360
SOLAR AZIMUTH ANGLE
USEABLE NOT USEABLE
F lfllml-~ I F
z uJ
I.-in
a
Rninif-
CL *LR I liIIlllll
I
II I I
I
II.~* ii
Mm
*
a
3
emIC
*
RR
'itLR
do 1000
SUN
1800 2000
AZIMUTH ANGLE
300 360
FIG. E-7 ALLOWABLE SUN AZIMUTHS FOR KIC SUNSHADE
SUN ELEY 250
ACT DETENTS
Figure E-8.- AOT Sunshade Solar Azimuth Constraint Test
APPENDIX F
HELMET EFFECTS ON AOT VISUAL PERFORMANCE
A production prototype -helmet supplied by Crew Systems Division was used in these tests during November 1967 at Kitt Peak National Observatory, Tucson, Arizona. Using the AOT simulator equipped with the second MSC prototype conical sunshade, the test subjects were first asked to observe the starfield without the helmet. Then, with the helmet in place, each subject was asked to comment upon any degredation in visibility. No diminishment of visibility was observed.
Next, a two-cell flashlight was switched on to light the darkended interior of the simulator. The flashlight was aimed randomly about the cockpit and at times pointed directly at the observerts face, on the opposite side from the eye looking through the instrument. These actions were described by the observers as no more than minor distractions and did not significantly affect the visibility of stars.
There were limitations to the test conditions which prevented quantitative measurements of visual effects. There was no attempt to standardize the distracting influence of the flashlight between observers. Since the anti-reflection coating had not been applied to the interior of the helmet used, the transmission and reflection characteristics of a flight helmet were not truly represented. And, the lack of a spacesuit on which to mount the helmet gave the observers more head freedom than would be available in a pressurized condition.
The lack of noticeable degredation due to the helmet may be explained by the relatively small change in transmission. Transmission of the helmet (without the interior anti-reflection coating) was at least 80 percent. The AOT transmission was 60 percent, so that the net transmission was about 48 percent. The change in star magnitude capability for such a transmission change (using the methods described in Appendix D) would be approximately 0.2 magnitude, which would be unnoticed unless a large
number of trials had been made.
Absence of an effect from the interior lighting test is more difficult to explain. First, since the anti-reflection coating on the inner surface was not present, there may have been less of a tendency for the light to be "channelled" by internal reflections across the portion of the helmet between the eye and the AOT eyepiece. In addition, it was obvious that the observers could press closer to the eyepiece with the unsupported helmet than would have been possible in a pressurized suit. Thus, more shadowing of the observing eye could be obtained in the test than may be possible in actual operations. A third factor to be considered is that the air path luminance was dominant during these tests, so that the observer's adaptation level was about 0.01 foot-lambers. The flash
2
light would have had to be fairly close to the helmet, and incideit upon the observing eye, to significantly affect the observer's adaptation level under the test conditions.
Since the IM windows have been provided with shades to allow darkening the cabin, the illumination around the AOT eyepiece is not expected to exceed the levels used in these tests (provided the IM is facing away from the sun). Thus, the effects of the helmet on star sightings with the AOT are not expected to be significant.