INTERNATIONAL COOPERATION 93-02 REPORT ASPOLABORATORIET Development of ROCK-CAD model for Aspo Hard Rock Laboratory Site Pauli Saksa, Juha Lindh, Eero Heikkinen Fintact Ky, Helsinki, Finland December 1993 Supported by TVO, Finland SVENSK KARNBRANSLEHANTERING AB SWEDISH NUCLEAR FUEL AND WASTE MANAGEMENT CO BOX 5864 S-102 40 STOCKHOLM TEL. +46-8-665 28 00 TELEX 13108 SKB TELEFAX +46-8-661 57 19 9505040278 950424 PDR WASTE WM-1I PDR
Transcript
INTERNATIONAL COOPERATION 93-02 REPORT
ASPOLABORATORIET
Development of ROCK-CAD model for Aspo Hard Rock Laboratory Site
Pauli Saksa, Juha Lindh, Eero Heikkinen
Fintact Ky, Helsinki, Finland
December 1993
Supported by TVO, Finland
SVENSK KARNBRANSLEHANTERING AB SWEDISH NUCLEAR FUEL AND WASTE MANAGEMENT CO
DEVELOPMENT OF ROCK-CAD MODEL FOR ASPO HARD ROCK LABORATORY SITE
Pauli Saksa, Juha Lindh, Eero Heikkinen
Fintact Ky, Helsinki, Finland
December 1993
Supported by TVO, Finland
This document concerns a study which was conducted within an Aspb HRL joint project. The conclusions and viewpoints expressed are those of the author(s) and do not necessarily coincide with those of the client(s). The supporting organization has reviewed the document according to their documentation procedure.
ii
FOREWORD
The scientific investigations within SKB's programme are part of the work to support the design and construction of a deep repository and to identify and investigate a suitable site for such a repository.
In 1986 a balanced appraisal of the available facts, requirements and assessments led to the proposal to construct an underground research laboratory at the Aspb island.
Field work for the Aspb Hard Rock Laboratory was initiated in the fall of 1986. The excavation of the facility started 1990. In conjunction with the excavation work several investigations have been carried out.
The Asp6 Hard Rock Laboratory - HRL - provides an opportunity for research, technical development and demonstration. Methods for investigation of rock for the deep repository for spent fuel are tested. The laboratory also provides an opportunity for practical testing of different aspects of the design of the deep repository. Large scale field studies of the interaction between engineered barriers and the surrounding rock can be conducted before the deep repository is built.
Several international organizations are participating in joint research projects at the Aspb HRL. The international experts enhance the scientific quality of the work at Asp6.
This International Cooperation Report has been produced as a part of a joint project of SKB and TVO.
iii
ABSTRACT
Conceptualized geometrical rock model of the Aspb site was created with computer aided geological modelling system named as ROCK-CADTM. The model describes the structural and lithological interpretations made during pre-investigation phase. Modelling as a whole comprises three-dimensional geometrical volume data, borehole data set, planned rock rooms and geographical auxiliary reference data.
Report explains the composition of the CAD-model in detail. A set of plots was created and explained to familiarize the rock conditions of the Asp6 site. Conceptual model and modelling work related matters are discussed.
iv
TABLE OF CONTENTS
FOREWORD ................................................. ii
ABSTRACT ................................................ iii
TABLE OF CONTENTS ........................................ iv
SUMMARY ................................................... v
Three-dimensional (3-D) modelling of the Asp6 Hard Rock Laboratory (HRL) site was conducted at FINTACT during 1992 93. The extent of the work that has taken place covers the build-up of basic structural, fracture zone rock model of the site together with related basic borehole data. The work was made with ROCK-CADTM named geological 3-D rock modelling package. ROCK-CAD is based on Computervision's Medusa 12 2-D/ Drafting and 3-D Modeler CAD-modules. The developed ROCK-CAD application software is a shell around Medusa 3-D that provides the tools needed to model complex geological properties and geometries. Modelling system is project-type work procedure and object oriented. Classification and definition criteria used conforms with the ones documented earlier at Asp6 site studies.
The 3-D rock model development has been limited to the basic extent at this stage. This means that main geological and conceptual modelling work results have been studied and gathered into ROCK-CAD database. The main emphasis has been in inclusion of previously conceptualized rock fracture and hydraulic zone structures. Borehole data concerning structures and fracturing was used to verify geometrical interpretations and to illustrate the intersection locations of the fracture zone structures in the boreholes. Mainly boreholes KBH02, KAS02, KAS05 and KASI6 has been considered. A new classification method for RQD-data was developed and discussed. It is specifically applicable to larger, site scale geometrical modelling purposes.
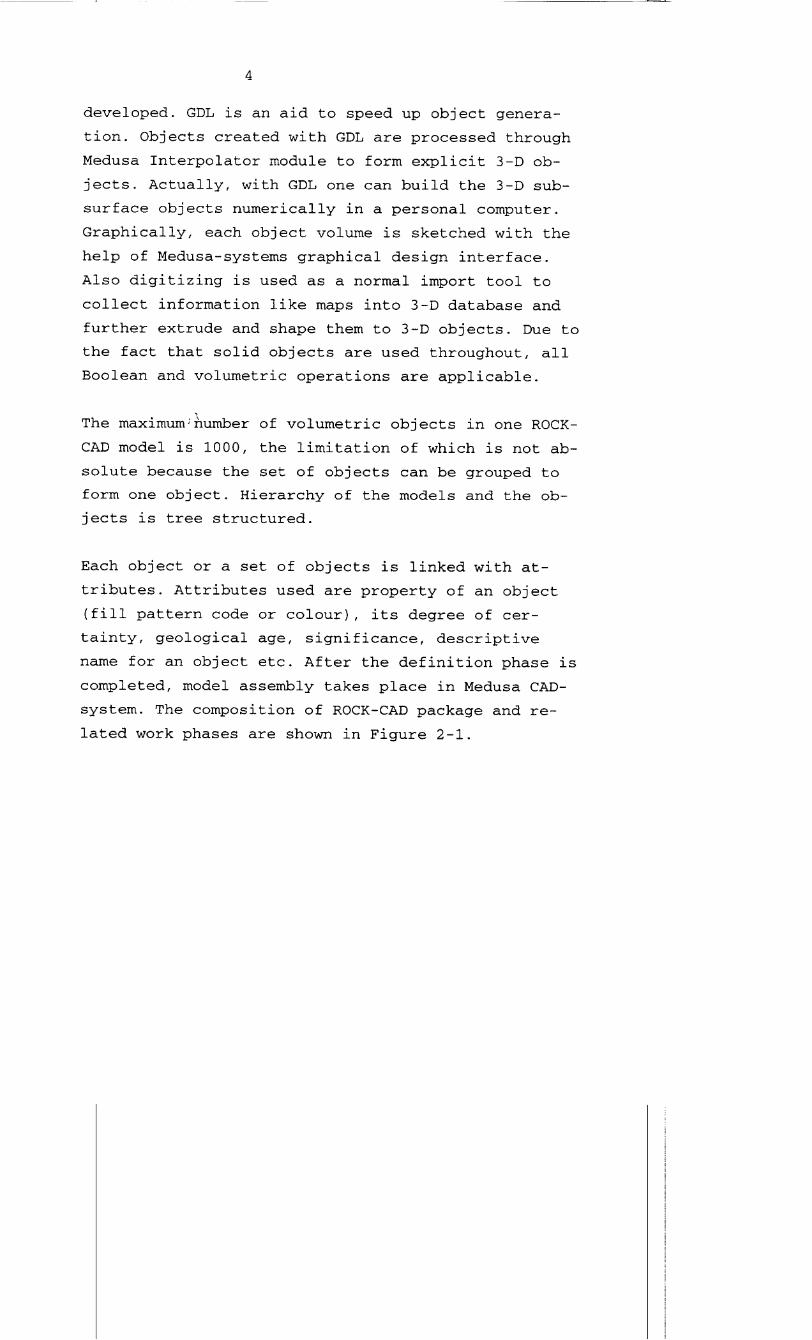
CAD-model composition is explained and documented in detail to familiarize how the system is configured and works. Definitions, coordinate systems, accuracy and resolution factors are discussed.
Report contains basic set of figures which present 3-D modelling information collected. There is a set of general maps and cross-sections covering the whole model or local excerpts of it. Borehole focused, local model cuts to allow closer comparison are shown. Graphics is either vector or raster type in form. Pictures are discussed and some notes concerning fracture zone classification and geometry is presented.
Keywords: nculear waste disposal, Asp6 hard rock laboratory, ROCK-CAD, conceptual rock modelling, geological modelling
1
1. INTRODUCTION
Three-dimensional modelling (3-D) of the Asp5 Hard
Rock Laboratory (HRL) site was conducted at FINTACT
company during 1992 - 93. The work was commissioned
by Teollisuuden Voima Oy (TVO) in Finland. It is a
part of the joint project between TVO and SKB agreed
in 1992. During this starting phase the scope of the
work consisted of the development and compilation of
structural model of Asp6 HRL site.
The extent of the work that has taken place covers
the build-up of basic structural, fracture zone rock
model of the site together with related basic bore
hole data. Results and benefits from the modelling
exercise are realized through maps, cross-sections
and illustrative 3-D cuts and views produced. Espe
cially from TVO's viewpoint it is important for those
participating into the HRL project to get a simpli
fied but still realistic 3-D description of the rock
structures and properties deduced from interpreta
tions and earth conceptualizations. Hence, this
deeper understanding may help to make more qualified
analysis of the experiments and numerical simulations
to be conducted in the future.
The main uses of the results presented in this report
are:
"* to construct a 3-D database of the Asp6 site,
"* to gain more detailed knowledge of the interpreta
tions and modelling work conducted at Aspb site,
0 to familiarize the interpreted rock conditions to
Finnish participants of the project,
• to familiarize the interpreted rock conditions to
other interested Aspb HRL project participants,
* to indicate possibilities of the ROCK-CAD system in
the future.
2
The work was made with ROCK-CADTM named geological 3
D rock modelling package described more in detail in
Chapter 2. ROCK-CAD software is a property of TVO and
is a registered trademark of FINTACT company.
3
2. DESCRIPTION OF ROCK-CAD SYSTEM IN BRIEF
ROCK-CADTM is a new and complete subsurface geologi
cal modelling system based on CAD-type approach. The
nucleus of ROCK-CAD is Computervision's Medusa 12
2-D/Drafting and 3-D Modeler CAD-modules. The devel
oped ROCK-CAD application software is a shell around
Medusa 3-D that gives all the tools needed to suc
cessfully model complex geological properties and ge
ometry (Saksa 1992). Application software is mainly
coded with FORTRAN-77 and Medusa Bacis 1 languages.
The software is now running in a UNIX-based Sun
Sparcstation workstation.
After decision to model a site, a new work project
and the volume that will be modelled (and illustrated
later) is set. Typically, model volume is rectangular
in shape. The system is configured so that the one
and same volume can contain several different types
of subsurface models. The basic system handles litho
- GRAPHICAL DESIGN (Interactive and semi-interactive modes)
SOUDS CREATION
ASSEMBLY MODELLING
LOG MODELS
SURFACE & TERRAIN MODELLER
WORK PROCEDURES:Make Project, - Construct - Collect and o Visualize, P Documentate, Select Type of Database Interpret 3-D Analyze, Plan Transfer for Modelling Subsurface Objects and Interpret Analysis
DATABASE FOR OBJECT PARAMETERS
BOREHOLE DATA: - Geological and other classified profiles, - Geophysical and geotechnical logs
FILL PATTERNS AND COLOUR TABLES
U,
6
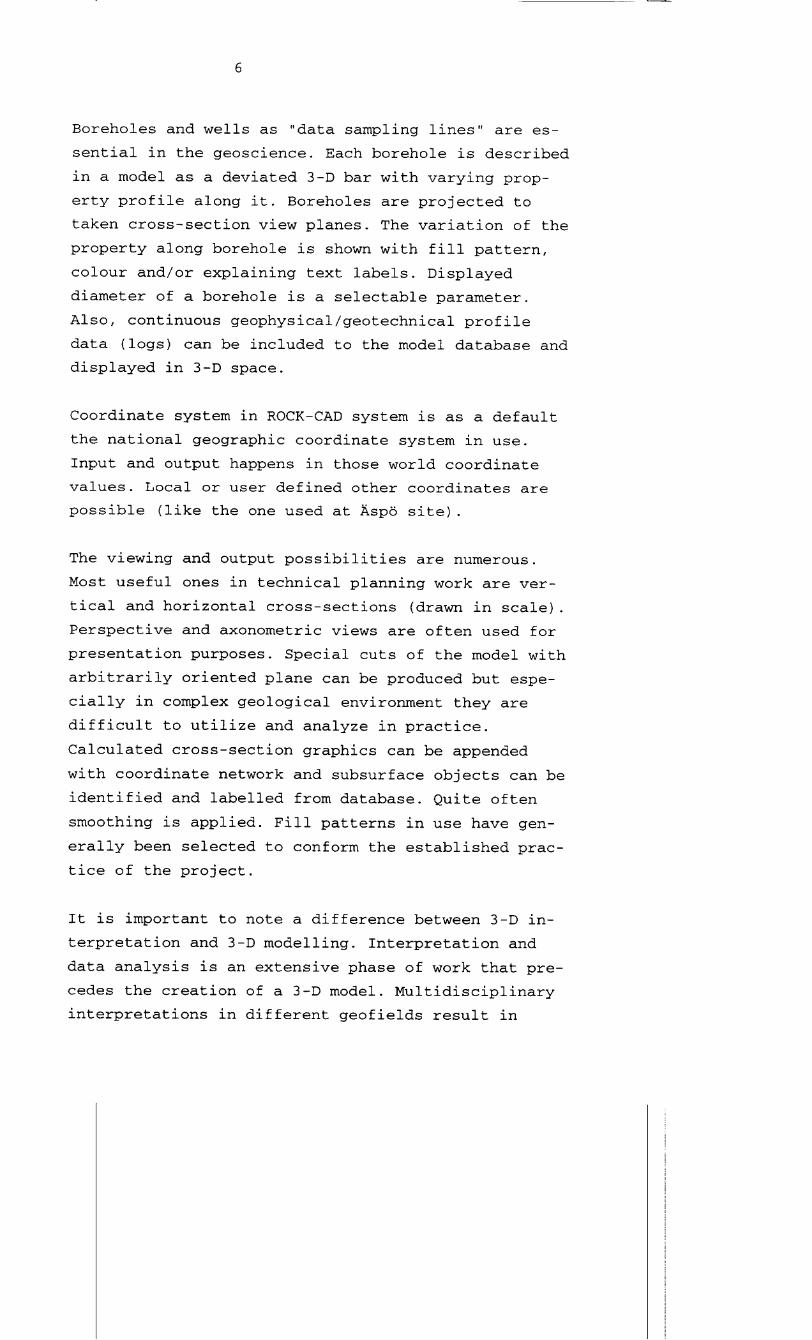
Boreholes and wells as "data sampling lines" are es
sential in the geoscience. Each borehole is described
in a model as a deviated 3-D bar with varying prop
erty profile along it. Boreholes are projected to
taken cross-section view planes. The variation of the
property along borehole is shown with fill pattern,
colour and/or explaining text labels. Displayed
diameter of a borehole is a selectable parameter.
Also, continuous geophysical/geotechnical profile
data (logs) can be included to the model database and
displayed in 3-D space.
Coordinate system in ROCK-CAD system is as a default
the national geographic coordinate system in use.
Input and output happens in those world coordinate
values. Local or user defined other coordinates are
possible (like the one used at Asp6 site).
The viewing and output possibilities are numerous.
Most useful ones in technical planning work are ver
tical and horizontal cross-sections (drawn in scale).
Perspective and axonometric views are often used for
presentation purposes. Special cuts of the model with
arbitrarily oriented plane can be produced but espe
cially in complex geological environment they are
difficult to utilize and analyze in practice.
Calculated cross-section graphics can be appended
with coordinate network and subsurface objects can be
identified and labelled from database. Quite often
smoothing is applied. Fill patterns in use have gen
erally been selected to conform the established prac
tice of the project.
It is important to note a difference between 3-D in
terpretation and 3-D modelling. Interpretation and
data analysis is an extensive phase of work that pre
cedes the creation of a 3-D model. Multidisciplinary
interpretations in different geofields result in
7
lithological and structural indications, estimations
and concepts differing in their detail and accuracy.
These interpretations are transferred to 3-D mod
elling. Further study of earth structures can be con
ducted with 3-D views from modelling system by expert
discussions and judgment. This often leads itera
tively back to interpretation and 3-D model revisions
(Saksa 1992).
The use of 3-D modelling techniques requires neces
sarily classification and definition criteria to be
determined and documented. Classification principles
can be sometimes difficult to set: for example, cut
off type criteria for the detection of a fracture
zone. Conceptualization of the rock structures takes
place through such a definition-limited data sorting.
Established and unchanging nomenclature of the rock
structures within the modelling work team is desir
able to be achieved. Definitions for the fracture
zones and structures in general or rock types and
their names serve as examples.
The use of ROCK-CAD system during different stages of
investigations is depicted in Table 2-1. The mod
elling system has been in operation for TVO's prelim
inary site studies for nuclear waste since 1989
(Saksa 1992).
8
Table 2-1. ROCK-CAD functions during an investigation program.
Phase of investigation ROCK-CAD use
project Reconnaissance and standard * Tentative conceptualization investigations ° Creation of tentative
studies / verification Finishing and verifying * Visualization for decision investigations purposes
0 Design of underground rock caverns
* Documentation of the state-of-the-art rock volume knowledge
9
3. MODELLING WORK AND GEOLOGICAL MATERIAL
3.1. GENERAL
The 3-D rock model development has been limited to
the basic extent at this stage. This means that main
geological and conceptual modelling work results have
been studied and gathered into ROCK-CAD database. The
most comprehensive piece of the study material used
has been the site geology interpretation report
(Wikberg et al. 1991). Also a list of the investiga
tions carried out has been utilized (Stanfors et al.
1991). As a supplement the interpretation work car
ried out by another study group of geology has been
evaluated briefly (Palmqvist et al. 1992).
Drawings and other material concerning the planned
rock rooms and geographical coordinate systems ap
plied at the site were kindly provided by Vattenfall
Energisystem AB (Widing 1992).
Borehole data including (x,y,z)-deviation profiles
and a subset of geology and fracturing data profiles
has been provided by SKB from GEOTAB database
(Ohlsson 1992). This was transferred into ROCK-CAD
borehole database. Some geophysical logging data was
initially also intended to be collected as reference
material. Data in different formats was easily trans
ferred to ROCK-CAD format files.
Geographical background material and pictures were
provided by SKB's technical CAD-consultant Sydkraft
Konsult as DXF-format files (Markstr6m 1992).
10
3.2. LIST OF GEOLOGICAL MATERIAL INCLUDED INTO THE MODEL
3.2.1. Adopted AsP6 Rock Model Data
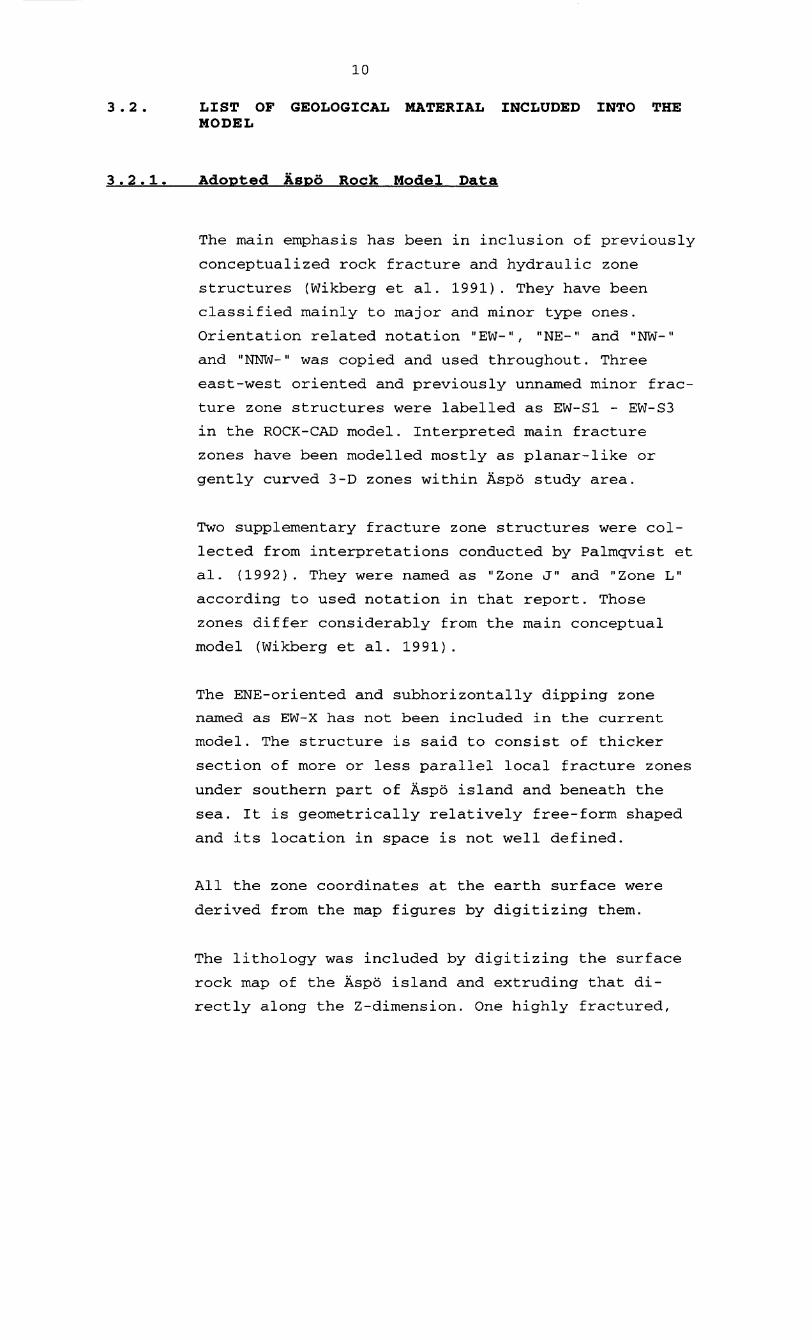
The main emphasis has been in inclusion of previously
conceptualized rock fracture and hydraulic zone
structures (Wikberg et al. 1991). They have been
classified mainly to major and minor type ones.
Orientation related notation "EW-", "NE-" and "NW-"
and "NNW-" was copied and used throughout. Three
east-west oriented and previously unnamed minor frac
ture zone structures were labelled as EW-SI - EW-S3
in the ROCK-CAD model. Interpreted main fracture
zones have been modelled mostly as planar-like or
gently curved 3-D zones within Asp6 study area.
Two supplementary fracture zone structures were col
lected from interpretations conducted by Palmqvist et
al. (1992). They were named as "Zone J" and "Zone L"
according to used notation in that report. Those
zones differ considerably from the main conceptual
model (Wikberg et al. 1991).
The ENE-oriented and subhorizontally dipping zone
named as EW-X has not been included in the current
model. The structure is said to consist of thicker
section of more or less parallel local fracture zones
under southern part of Asp6 island and beneath the
sea. It is geometrically relatively free-form shaped
and its location in space is not well defined.
All the zone coordinates at the earth surface were
derived from the map figures by digitizing them.
The lithology was included by digitizing the surface
rock map of the Asp6 island and extruding that di
rectly along the Z-dimension. One highly fractured,
11
fine-grained granite inclusion which forms a part of
the fracture zone EW-5 and hydraulic zone EW-5W was
collected into model (also called as Zone K fine
grained granite) (Palmqvist et al. 1992).
For each fracture zone structure the line point coor
dinates were first collected into a file. Then every
structure was recorded into its own GDL model file.
GDL coded, high-level syntax files are input to Rocky
converter program. Rocky produces a Medusa
Interpolator format file. This file in turn can be
run further as a macro file from Interpolator utility
program within Medusa system to produce binary coded
3-D object model files.
Fracture and hydraulic zones describing geometrical
parts (objects) are discussed further in Chapter 3.3
section "Model structure".
3.2.2. Borehole Data
Borehole data serves as its best in verifying
geometrical interpretations and in illustration the
intersection locations of the structures in the
boreholes. Fracturing and geophysical logging data
can be used to compare conceptual modelling
interpretations with the actual measurement results.
Hence, following data shown in Table 3-1 was
collected from the selected set of the Asp6 core
drilled boreholes.
12
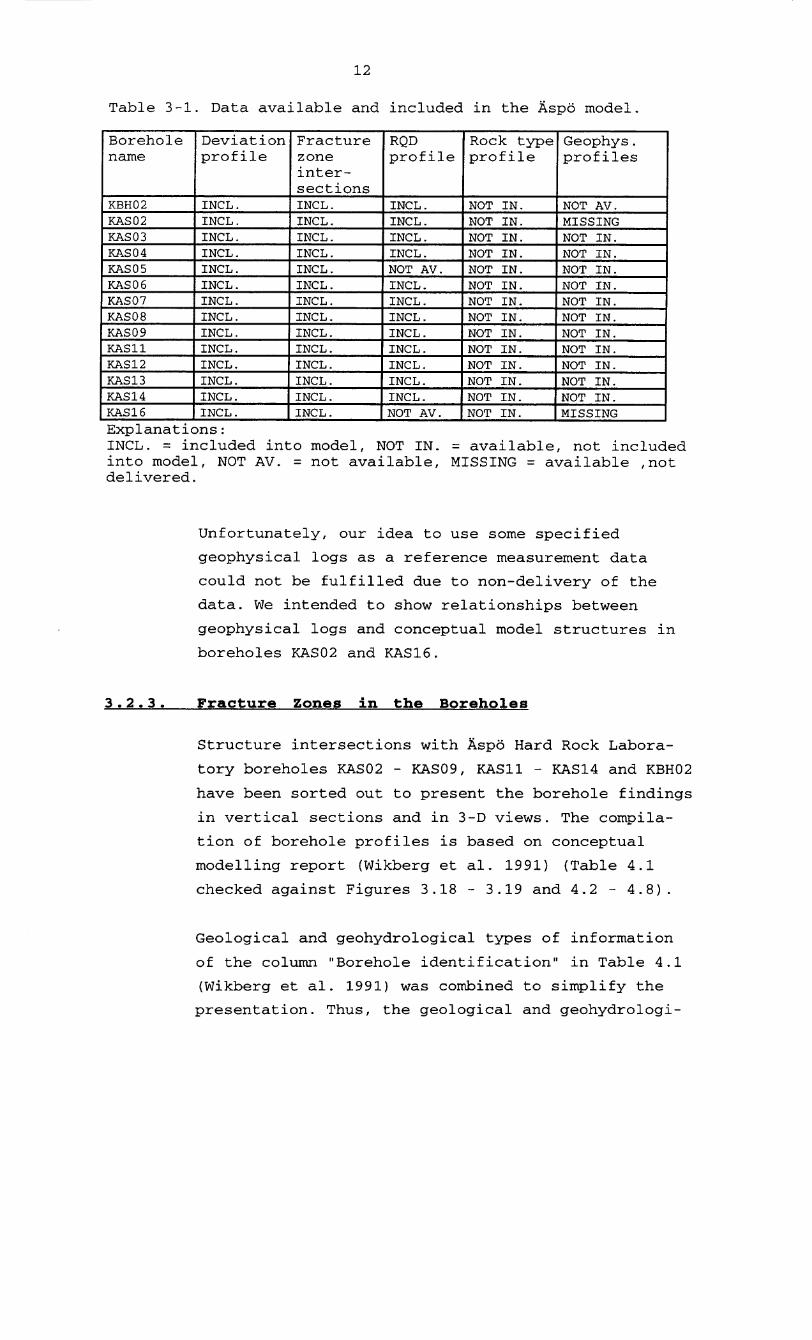
Table 3-I. Data available and included in the Asp6 model.
Borehole Deviation Fracture RQD Rock type Geophys. name profile zone profile profile profiles
intersections
KBH02 INCL. INCL. INCL. NOT IN. NOT AV. KAS02 INCL. INCL. INCL. NOT IN. MISSING KAS03 INCL. INCL. INCL. NOT IN. NOT IN. KAS04 INCL. INCL. INCL. NOT IN. NOT IN. KAS05 INCL. INCL. NOT AV. NOT IN. NOT IN. KAS06 INCL. INCL. INCL. NOT IN. NOT IN. KAS07 INCL. INCL. INCL. NOT IN. NOT IN. KAS08 INCL. INCL. INCL. NOT IN. NOT IN. KAS09 INCL. INCL. INCL. NOT IN. NOT IN. KASII INCL. INCL. INCL. NOT IN. NOT IN. KAS12 INCL. INCL. INCL. NOT IN. NOT IN. KAS13 INCL. INCL. INCL. NOT IN. NOT IN. KAS14 INCL. INCL. INCL. NOT IN. NOT IN. KAS16 INCL. INCL. NOT AV. NOT IN. MISSING Explanations:INCL. = included into model,into model, NOT AV. = not ava delivered.
NOT IN. = available, not included ilable, MISSING = available ,not
Unfortunately, our idea to use some specified
geophysical logs as a reference measurement data
could not be fulfilled due to non-delivery of the
data. We intended to show relationships between
geophysical logs and conceptual model structures in
boreholes KAS02 and KASI6.
3.2.3. Fracture Zones in the Boreholes
Structure intersections with Asp6 Hard Rock Labora
tory boreholes KAS02 - KAS09, KASII - KAS14 and KBH02
have been sorted out to present the borehole findings
in vertical sections and in 3-D views. The compila
tion of borehole profiles is based on conceptual
modelling report (Wikberg et al. 1991) (Table 4.1
checked against Figures 3.18 - 3.19 and 4.2 - 4.8).
Geological and geohydrological types of information
of the column "Borehole identification" in Table 4.1
(Wikberg et al. 1991) was combined to simplify the
presentation. Thus, the geological and geohydrologi-
13
cal sections shown for any borehole have always the
outermost edges given. However, structures EW-I and
EW-IW, and EW-5 and EW-5W, respectively, were handled
separately due to their varying dipping angles. If
the geological finding was given only to one discrete
depth value instead of an interval, 10 meters has
been used as a minimum thickness of a structure
(edges around ±5 m of the given depth).
In the following a short description or comment is
given for each borehole and structure included in the
model (see also Table 3-2 later in this chapter).
Note, that a gently dipping fracture zone structure
EW-X is not in ROCK-CAD model at this moment.
- Borehole KAS02 intersects the zonees EW-5 (EW-5W),
EW-X and NE-I. Zone NE-I is not shown in Figure 4.6
(Wikberg et al. 1991) and it could not be checked.
- Borehole KAS03 penetrates the structure EW-IW.
- Borehole KAS04 penetrates the structures EW-I, EW
1W, EW-5, NE-2 and zone L. Intersection of the struc
ture NNW-2 is uncertain.
- Borehole KAS05 penetrates the structures EW-5 and
EW-X. Intersection of the structure NNW-2 is uncer
tain.
- Borehole KAS06 penetrates the structures EW-3, EW
5, NNW-1W and NNW-2W. Zone EW-X is shown in Figure
4.4, but no geological identification is referenced
in Table 4.1 (Wikberg et al. 1991).
- Borehole KAS07 penetrates the structures EW-3, EW
5, NE-l and NNW-1W.
- Borehole KAS08 cuts the zones NE-I, NE-2 and NNW
2W.
14
- Borehole KAS09 penetrates the structures EW-5, EW5
W, EW-X and NE-I.
- Borehole KASIl penetrates the structures EW-5, NE-I
and EW-X. Major zone NE-I is not shown in Figure 4.6,
though listed in Table 4.1 (Wikberg et al. 1991).
- Borehole KAS12 penetrates the structures EW-I and
NE-2. There is a discrepancy between the surface lo
cation of EW-l and listed finding of it in the bore
hole. Borehole KAS12 is located outside the conceptu
alized zone, see Fig. 4-3 later in this report.
However, EW-I is a thick and complex zone when it is
difficult to define where it begins and ends.
- Borehole KAS13 penetrates the structures NE-2, NNW
1 and NNW-2. Location of hydraulic structure NNW-IW
in the borehole is uncertain.
- Borehole KAS14 penetrates the structures EW-5, EW
5W, EW-X and NE-I (last one is not shown in Figure
4.6, but is listed in Table 4.1).
- Borehole KAS16 penetrates the structure NNW-2W. It
is not shown in any figure, but is referenced in
Table 4.1, (Wikberg et al. 1991).
- Borehole KBH02 penetrates the structures EW-7 (same
intersection also for zone J), NE-4 (and NE-4B), NE-3
and NE-I. Major structure NE-I is defined in the
borehole section 600 - 760 m.
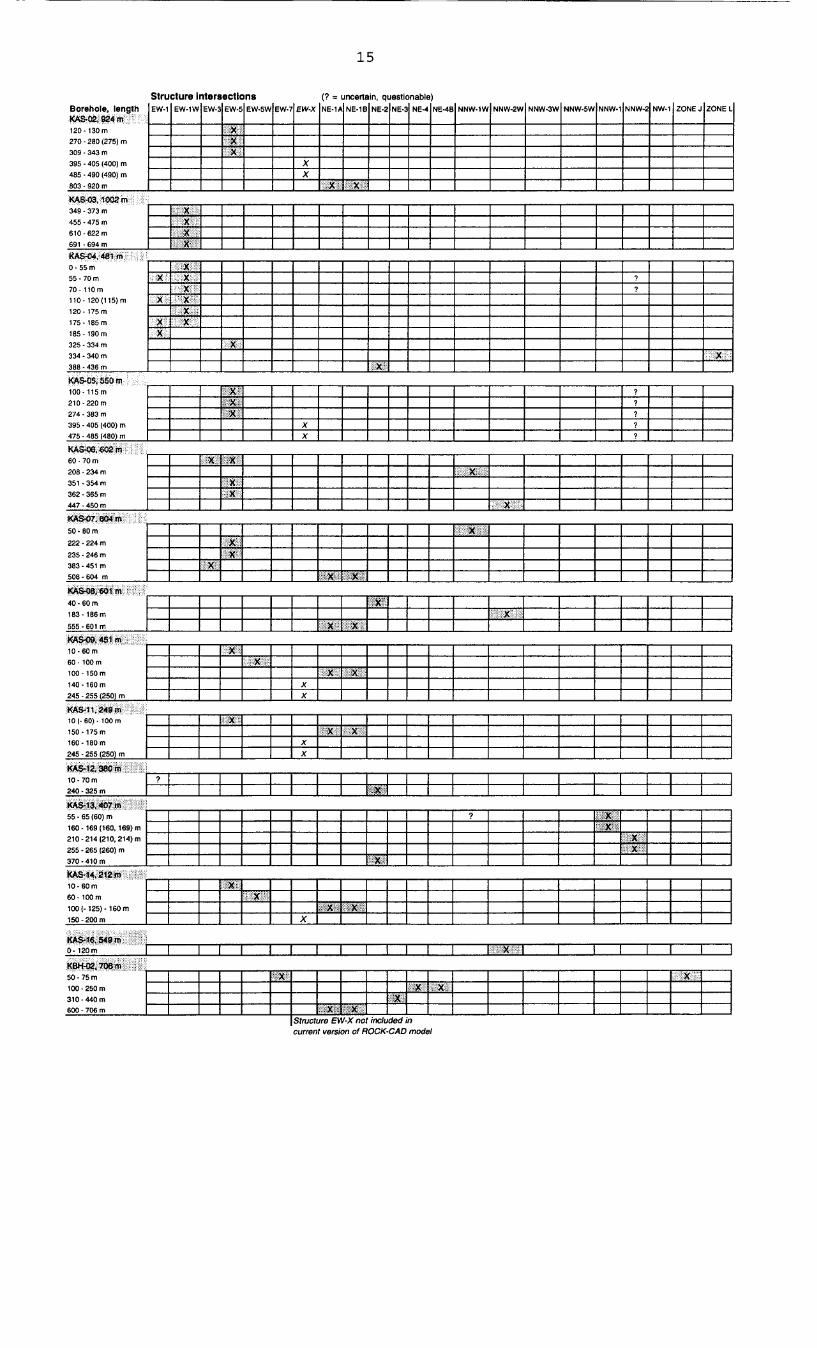
Table 3-2. (next page) Structure intersections in boreholes, as they were included in the Asp6 HRL ROCK-CAD model. Borehole values in brackets ( ) describe locations where sections of hydraulical and geological indications for the structures differ significantly (exists between the extreme values) or only one discrete depth for structure is given (after expanded range exact depth value).
15
Structure Intersections I EW-1 I EW-1 WIEW-3I EW-51 EW.55A!EW-7 I EW-X
(? = uncertain, questionable)
I NE-1AI NE-IBI NE-2INE-31 NE-41NE-41
t X
NNW.1WI NNW-2W1 NNW-3W1 NNW-5WINNW-11NNW-2j NW-1I ZONE J IZONE L
K'AS-03, 1002 mn 349- 373 mx 455 -475 mx 610 -622 m x 691 - 694 m I KAS-04, 481 m, 0- 55 m x 55- 70 m X x 70-110rm x ? 110- 120 (115) m X x 120 175 m X 175- 185 m X X 185-- 190 Mrn 325- 334 _m
334 -340 m - -
388- 436 m -# #X_ _
KAS.05.850 m 100- 115 m ? 210- 220 m ? 274 -383im 395 - 405 (400) m X 475 - 485 (480) m iI I x
KAS-06, 502 t.i
208- 234 m
351- 354 n
362- 365 m 447- 450 rn II 1+ x KAS-07. 604 m 50- 80 M
222- 224 m
235- 246m r 383- 451 m x I 508- 604 mn
KAS-OB, 601 mo 40 - 60m x 183- 186 m X 555 - 601 m
KAS-09,451 m 10- 60 m 60- loom
100- 150 Mn 140 - 160 m X 245 - 255 (250)X
KAS-1 1 249 rn 10 (- 80).- 100 m
150-175 m n x 160 - 180 m x 245 - 255 (5)mx
KAS- 1, 80 m 10 - 70 m 240- 325 m
KAS-13,407m 55- 65 (60) m ? :
160 - 169 (160, 169) m i
210 -214 (210, 214) m LI IL x L I 255 - 265 (260) m
370 - 410 m !:i•
KAS- 44,212mn 10-60mn 6lO. 0m lx•i•ii 100 (- 125)- -160m X ) 150- 200 m x
0-12O n I I I I II I I I I I I I I I
KBI-f-2, 706 m 50- 75 m X x 100 - 250 mi 310- 440 m iXIJ HV1• 80O - 706 mn
Structure EW-X not included in current version of ROCK-CAD model
Borehole, length KAS-OZ k4 no 120 - 130 m
270 - 280 (275) m 309 - 343 rn
395 - 405 (4 0 0
) m
485- 490 (490) m
xx
16
3.2.4. Rock Quality Designation (ROD) Values
Numerical RQD profiles of boreholes KAS02 - KAS09,
- rock object files designed with Medusa graphical
interface (sheet definitions),
- database of object parameters (called PARAMS),
- borehole files: deviation and property profiles,
- supplementary picture files of reference geography,
- rock room files designed with Medusa's graphical
interface.
Coordinate systems and accuracy considerations
Work is done in the local Asp6 coordinate system,
where X axis points northwards (horizontal, close to
the north), Y points eastwards (horizontal) and posi
tive Z axis (vertical) points upwards. In the study
area exists also another local coordinate system
called OKG. There is a small difference between Asp6
and OKG systems (see Figure 3-2) but this is negligi
ble when compared to the tolerance and the absolute
accuracy of the modelling input data (original maps,
interpretation accuracy etc.).
Asp6 coordinate system is rotated counterclockwise in
respect to national coordinate grid (abbreviated as
RAK) (SKB 1992). Location of Aspb coordinate system
origo in RAK-system X,Y,Z values is not known to us.
All ROCK-CAD coordinate information is according to
Asp6 system.
Accuracy of actual coordinate values in the model is
difficult to determine. Some errors come from digi
tizing the input data maps. Some smoothing of real
geographical features come from attached DXF-files.
Comparison with Wikberg et al. (1991) maps indicate 0
- 5 m differences between similar type geographical
23
maps and 0 - 15 m differences when concerning mod
elled fracture zone positions. Differences 10 - 15 m
was found between some N-S oriented structures NNW-5W
and NNW-3W probably originating from our digitizing
work which utilized copied, inaccurate (large scale)
report pages.
The planned access tunnel part could be positioned
with accuracy of about 0.1 m. The spiral part is more
tentative in location, especially its bearing in re
spect to the access tunnel part.
Internal Medusa CAD-system modelling tolerance was
preset to value of 1 m for all the modelled 3-D rock
objects. Received borehole x,y,z-deviation and pro
file data files have relative accuracy of centimeters
at the highest. Absolute accuracy is probably within
a few metres.
The resolution in vector graphics plots is limited by
physical pen location accuracy and line thickness
used. Line thickness 0.2 mm means 0.2 m and 2 m accu
racy in the scales 1:1000 and 1:10000, respectively.
In raster graphics plots the screen pixel resolution
limits the detectable details of the model objects.
View area 1000 m . 1000 m on the screen (- 1000 • 1000
pixels) gives 1 m resolution for each pixel. Visibil
ity of the details less than 1 m in actual size is
varying case by case and depends on the z-buffering
scheme of the system and on the treatment of inter
fering voxels (volumetric pixels).
The accuracy of interpretations is discussed in chap
ter 4.2. However, generally the internal accuracy of
the model geometry data is in normal case much better
than the accuracy of the deduced interpretations.
7 Origo XSPO coordinates Y=:1000
X=5500
XSP6 system difference Lo OKG system dX=0.6-1.9 m dY=0.1-0.2 m
, MAGNETIC NORTH
Al .7
NU
x
s5?6 13
RAK y
ASP6 system NationaL GeporaohI~ie
Y
Origo of RAK coordinates Coordinate
X=?2 System (RAK) Y=?
Figure 3-2. Coordinate systems in the vicinity of the
Oskarshamn nuclear facilities.
24
25
Modelled rock volume and local origin
Internal ROCK-CAD local origin of the modelled volume
is at Aspb coordinate system point: X = 5500 m, Y =
1000 m and Z = 0 m. Origin is at lower, southwest
corner of modelled rock volume. This setting is in
visible to the user in practice and can not been seen
from produced plots and prints.
Modelled rock volume is defined by rectangle dimen
sions: X = 3000 m, Y = 2000 m and Z = 1000 m. This is
the bounded total volume of the solid model assembly
and presented in Figure 3-2. All rock objects are
clipped against this area and volume if they cross
the boundaries. If the rock model has to be extended
later areally or by volume, ROCK-CAD local origin and
dimensions have to be changed. However, all the
modelled objects are re-usable in a normal manner.
Model structure
The model structure is hierarchical and consists of
several assemblies and subassemblies. It contains
logical assemblies of geographical, engineered rock
rooms, fracture zones, hydraulic zones and rock units
objects. Borehole 3-D assemblies consist of property
profiles and measurement data profiles. The assem
blies are documented into the following table sheets
3-3 - 3-6.
Numeric input means a GDL file. Certainty degree cod
ing is 0 = certain, 1 = probable and 2 = possible.
The dip values are in gons, 1009 equals vertical and
0g horizontal dip. Dip values greater than 1009 refer
to southward dipping objects when viewed from the
west.
26
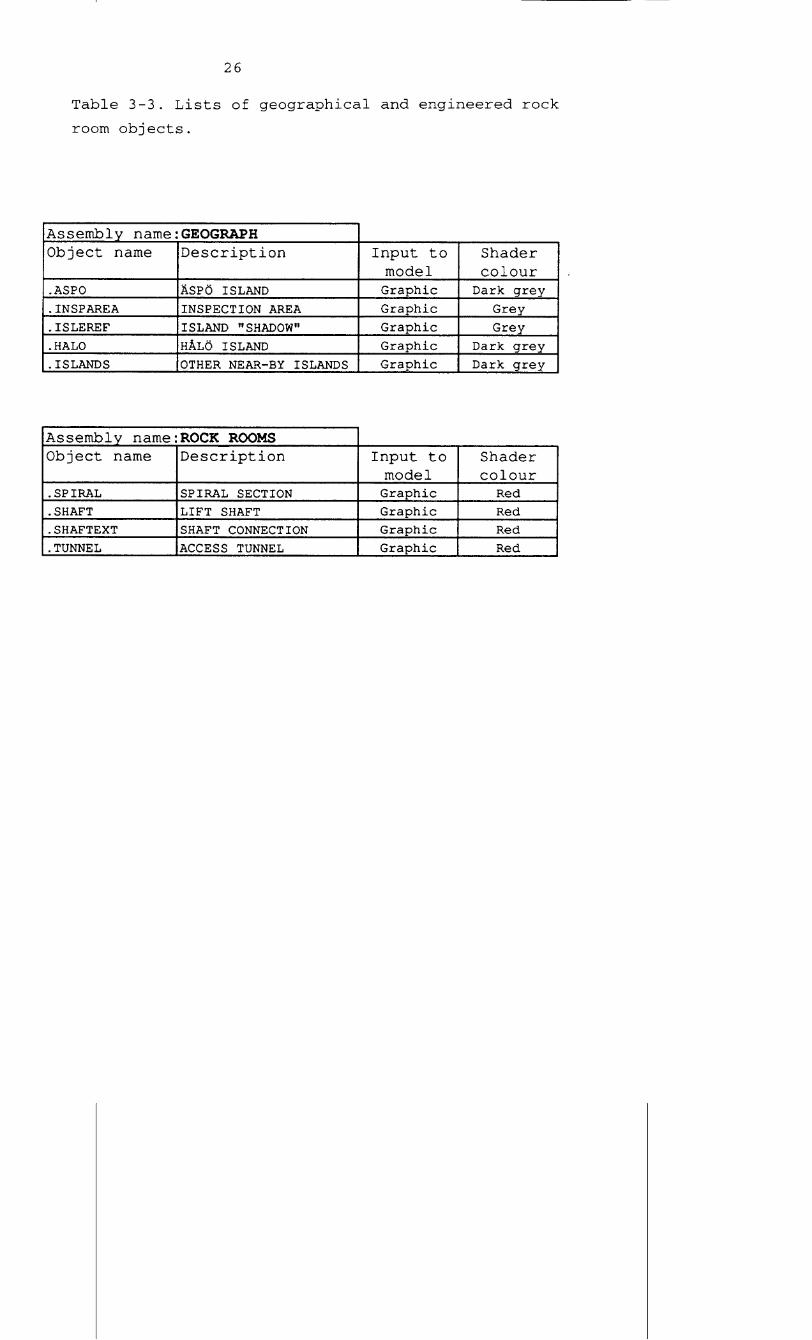
Table 3-3. Lists of geographical and engineered rock
room objects.
Assembly name:GEOGRAPH Object name Description Input to Shader
model colour
.ASPO ASPO ISLAND Graphic Dark grey
.INSPAREA INSPECTION AREA Graphic Grey
.ISLEREF ISLAND "SHADOW" Graphic Grey
.HALO HALO ISLAND Graphic Dark grey
.ISLANDS OTHER NEAR-BY ISLANDS Graphic Dark grey
Assembly name:ROCK ROOMS Object name Description Input to Shader
model colour .SPIRAL SPIRAL SECTION Graphic Red .SHAFT LIFT SHAFT Graphic Red .SHAFTEXT SHAFT CONNECTION Graphic Red .TUNNEL ACCESS TUNNEL Graphic Red
Assembly name:FRAC ZONES Object name Description Input to "Certainty Character Dip in Depth (z) Shader
model degree" gons range colour .EW-I Zone EW-I Numeric 0 Major 89 0, -1000 Brown .EW-3 Zone EW-3 Numeric 0 Major 105 0, -600 Brown .EW-5 Zone EW-5 Numeric 2 Major 28 0, -500 Brown .EW-7 Zone EW-7 Numeric 1 Major 128 0, -500 Brown .EW-SI Zone EW-SI Numeric 2 Minor 119 0, -150 Green .EW-S2 Zone EW-S2 Numeric 0 Minor 100 0, -200 Green .EW-S3 Zone EW-S3 Numeric 0 Major 100 0, -500 Brown .NE-1A Zone NE-IA Numeric 0 Major 80 0, -1000 Brown .NE-1B Zone NE-lB Numeric 0 Major 76 0, -1000 Brown .NE-2 Zone NE-2 Numeric 0 Major 86 0, -1000 Brown .NE-3 Zone NE-3 Numeric 0 Major 78 0, -1000 Brown .NE-4 Zone NE-4 Numeric 0 Major 128 0, -400 Brown .NE-4B Zone NE-4B Numeric 0 Major 128 0, -1000 Brown .NNW-I Zone NNW-1 Numeric 2 Minor 100 0, -300 Green .NNW-2 Zone NNW-2 Numeric 1 Minor 100 0, -600 Green .ZONE L Zone L (BERGAB) Numeric 1 Minor 89 0, -300 Green .ZONE J Zone J (BERGAB) Numeric 2 Minor 33 0, -300 1reen
Assembly name:HYDR ZONES Object name Description Input to "Certainty Character Dip in Depth (z) Shader
model degree" gons range colour .NNW-IW Hydraulic zone NNW-1W Numeric 0 Minor 100 0, -400 Blue .NNW-2W Hydraulic zone NNW-2W Numeric 0 Minor 100 0, -500 Blue .NNW-3W Hydraulic zone NNW-3W Numeric 0 Minor 90 0, -200 Blue .NNW-5W Hydraulic zone NNW-5W Numeric 0 Minor 100 0, -1000 Blue .NW-1 Hydraulic zone NW-I Numeric 0 Minor 167 0, -900 Blue .EW-lW -Hydraulic zone EW-1 Numeric 0 Major 67 0, -500 Blue .EW-5W Hydraulic zone EW-5 Numeric 2 Minor 41 0, -500 Blue
0 U-.
(D 0
t.'
Assembly name:ROCK UNITSObject name Description Input to "Certainty Character Dip in Depth (z) Shader
model degree" _gons range colour .GREENSTONE Greenstone Graphic 0 Lithological 100 0, -50 Green .MYLONITE Mylonite Graphic 0 Lithological 100 0, -50 Grey .FG-GRANITE Fine-grained granite Graphic 0 Lithological 100 0, -50 Violet .METAVOL Metavolcanite Graphic 0 Lithological 100 0, -50 Yellow .MG-GRANITE Medium-grained granite Graphic 0 Lithological 100 0, -50 Red .FG-ZONE K Zone K assoc. granite Numeric 0 Lithological 33 0, -300 Violet .ASPO Granite, granodiorite Graphic 0 Lithological 100 0,-10 Dark grey
(D
0
rt
31)
0
h
0
Q
0 0
o
0
(t
0 t-. CD
Lx) co
29
Table 3-6. Lists of borehole submodels and borehole
measurement objects.
BOREHOLE MODELS(Sub) model Description Input to Shader name model colour(s) m.kas02.rak Structures in KAS02 Numeric Table 3-7
m.kas05.rak Structures in KAS05 Numeric Table 3-7
m.kasl6.rak Structures in KAS16 Numeric Table 3-7
m.kbh02.rak Structures in KBH02 Numeric Table 3-7
m.kas02.hyd RQD bar in KAS02 Numeric Table 3-8
BOREHOLE MEASUREMENT MODELS Object(model) Description Input to Shader name model colour(s) m.kas02.rqd RQD profile as surface Numeric Green&Blue
model
30
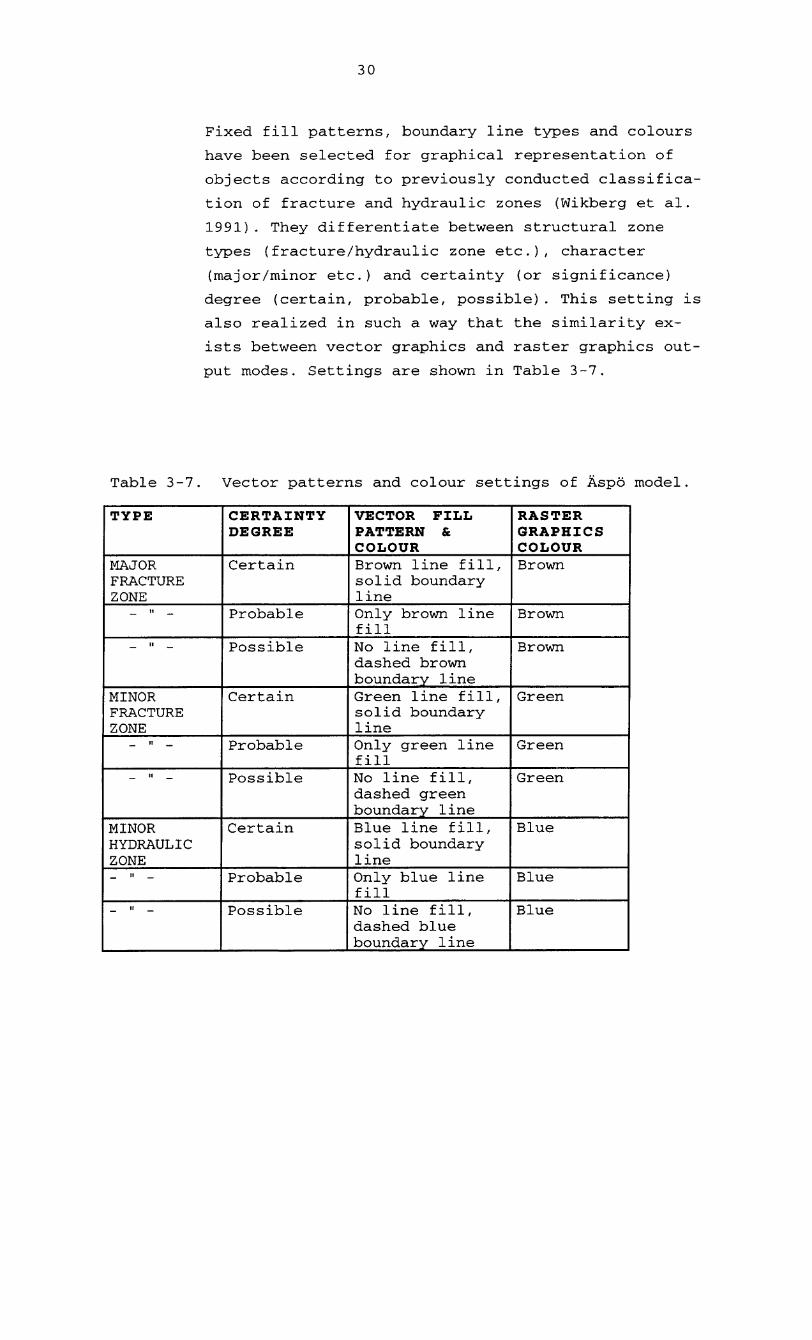
Fixed fill patterns, boundary line types and colours
have been selected for graphical representation of
objects according to previously conducted classifica
tion of fracture and hydraulic zones (Wikberg et al.
1991). They differentiate between structural zone
types (fracture/hydraulic zone etc.), character
(major/minor etc.) and certainty (or significance)
degree (certain, probable, possible). This setting is
also realized in such a way that the similarity ex
ists between vector graphics and raster graphics out
put modes. Settings are shown in Table 3-7.
Table 3-7 Vector patterns and colour settings of Asp6 model.
TYPE CERTAINTY VECTOR FILL RASTER DEGREE PATTERN & GRAPHICS
COLOUR COLOUR MAJOR Certain Brown line fill, Brown FRACTURE solid boundary ZONE line
Probable Only brown line Brown fill
_... Possible No line fill, Brown dashed brown boundary line
MINOR Certain Green line fill, Green FRACTURE solid boundary ZONE line
Probable Only green line Green fill
Possible No line fill, Green dashed green boundary line
MINOR Certain Blue line fill, Blue HYDRAULIC solid boundary ZONE line
. Probable Only blue line Blue fill
Possible No line fill, Blue dashed blue boundary line
31
Interpreted fracture and hydraulic zone intersections
in the boreholes are presented with the same vector
fill patterns and colours as above in Table 3-7.
Every borehole section has the same coding as the 3-D
model object it represents. Hence, the comparison be
tween any rock structure and its borehole intersec
tion location is straightforward. If two or more ma
jor/ minor or fracture/hydraulic type of structures
intersect the borehole within the same interpreted
depth interval, the applied fill and colour pattern
is a mixture.
Classified fracturing intensity (RQD) bar profiles
(in chapter 3.2.4) for the boreholes have vector and
colour fill patterns shown in Table 3-8.
Table 3-8. Vector patterns and colour settings in Asp6 model.
RQD-class Type of fracturing: fill & colour
Class 1 Rock matrix: No fill pattern or white colour
Class 2 Fractured sections: Black line fill pattern or green colour
Class 3 Highly fractured sections: Black dense line fill pattern or black colour
32
4. RESULTS
The results of the conducted work is best understood
and evaluated with produced plots of the model. This
report contains the basic set of figures which pre
sent the 3-D modelling information collected. There
is a set of general maps and cross-sections covering
whole model or local excerpt of it. Borehole related
local model cuts allow closer and more detailed com
parisons to be made.
The graphics is either vector or raster type in form.
Vector graphics is a combination of picture elements
like lines, polygons, texts etc.. Raster graphics is
a picture of calculated pixel values (bit maps).
These two different output forms are separated in the
following picture list.
4.1. LIST OF THE PLOTS
Vector graphics plots:
4-1. Legend for vector graphics pictures 4-2 - 4-13.
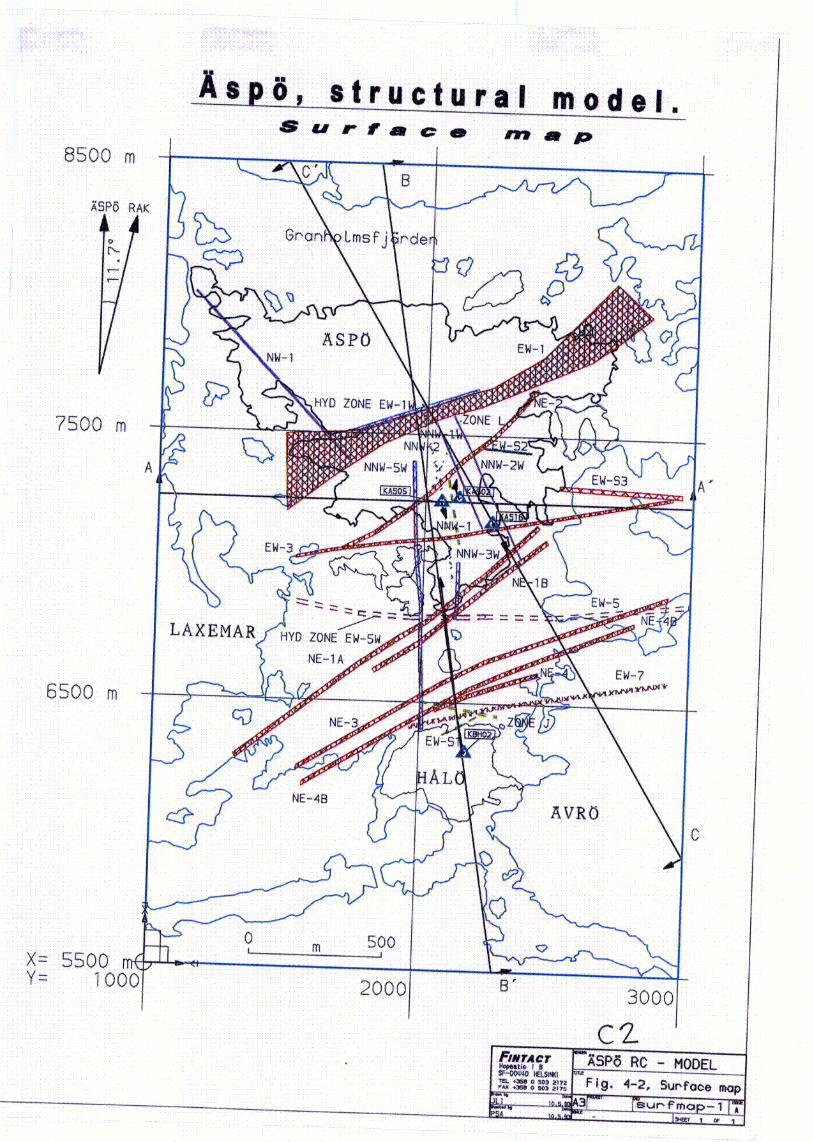
4-2. Structural model surface map presenting the
whole modelled surface area (originally in scale
1:10000, reduced here).
4-3. Excerpt of structural model surface map present
ing local view into modelled area. Planned rock rooms
are projected onto map as outline.
4-4. Structural model vertical cross-section along
line A-A' at X = 7250, in scale 1:10000. Boreholes
KAS02 and KAS05 are projected onto the cross-section.
33
4-5. Structural model vertical cross-section along
line B-B' (borehole KBH02), in scale 1:10000.
Boreholes KBH02 and KAS05 projected onto the cross
section.
4-6. A set of horizontal section slices. Sectioning
at levels 0 m, -500 m and -1000 m. View direction
from the south, angle 150 from horizontal.
4-7. Perspective view of the structural model with a
vertical cut along the line C-C'. Boreholes KAS02,
KAS04 and KAS16 are projected to the cross-section
plane. Structure intersection bars are shown for each
borehole. Thin borehole outline for KAS02 means that
it is projected from further distance (> 20 m).
Borehole diameter (bar width) is exaggerated to 30 m
in the world coordinate scale.
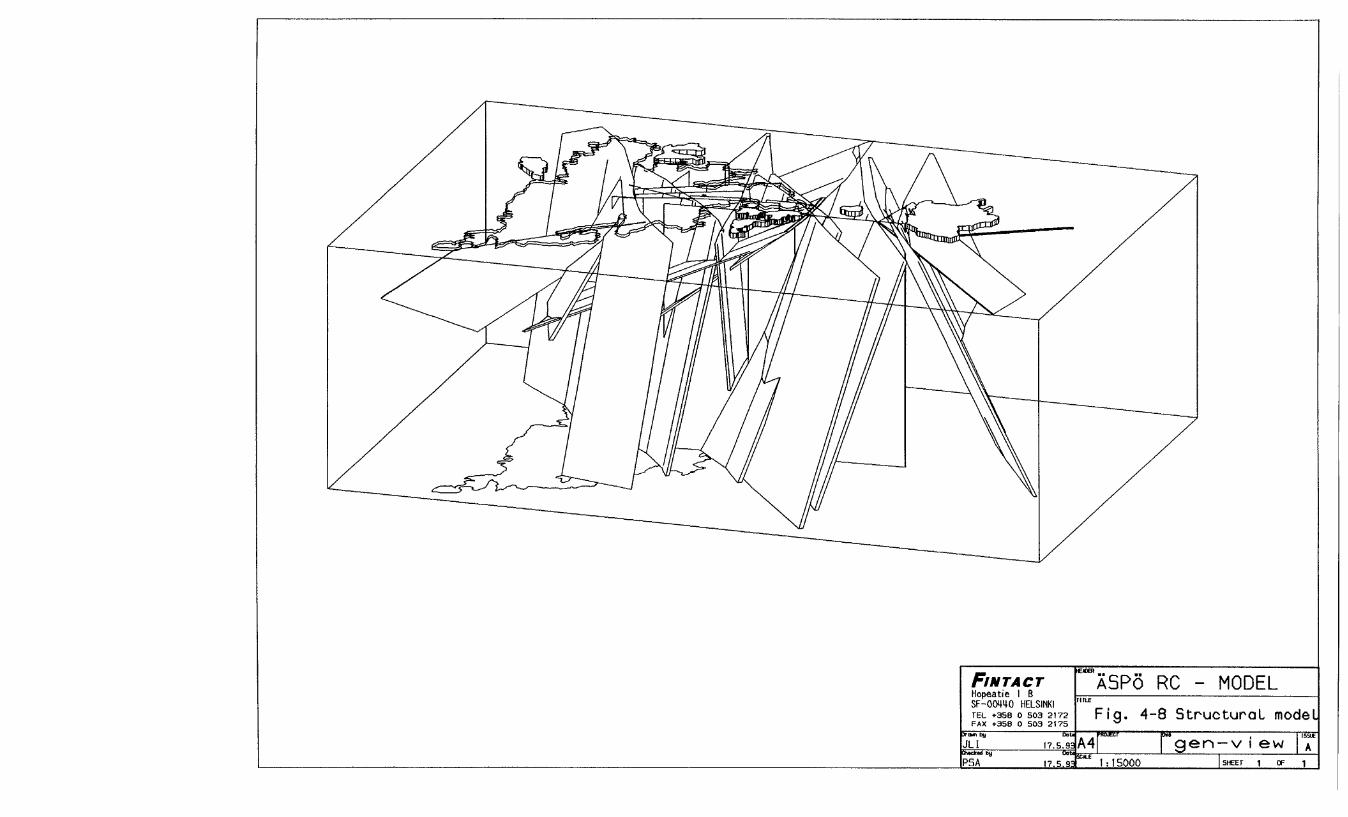
4-8. General perspective view of the structural model
assembly.
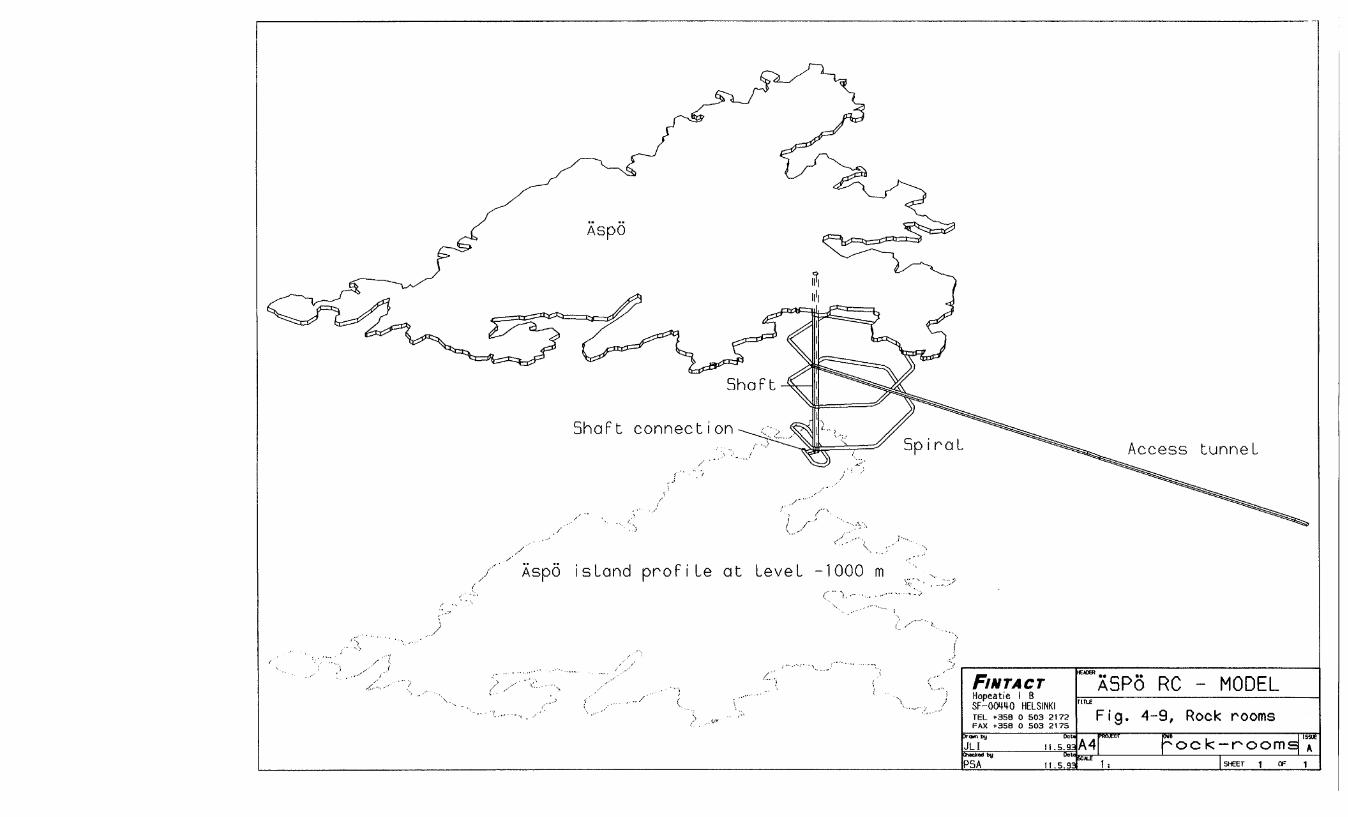
4-9. General perspective view of the assembly of the
planned rock room objects. View direction is from the
southwest.
4-10. Vertical, local cross-section along the bore
hole KBH02 in scale 1:4000. Bars in KBH02 present
identified structure intersections and fracturing in
tensity variations (RQD based) along the borehole.
Colouring and fill patterns are according to Tables
3-7 and 3-8. Displayed borehole diameter is 30 m in
natural scale. Borehole bars are aligned to their
ends. Arrow indicates the absolute position of the
borehole.
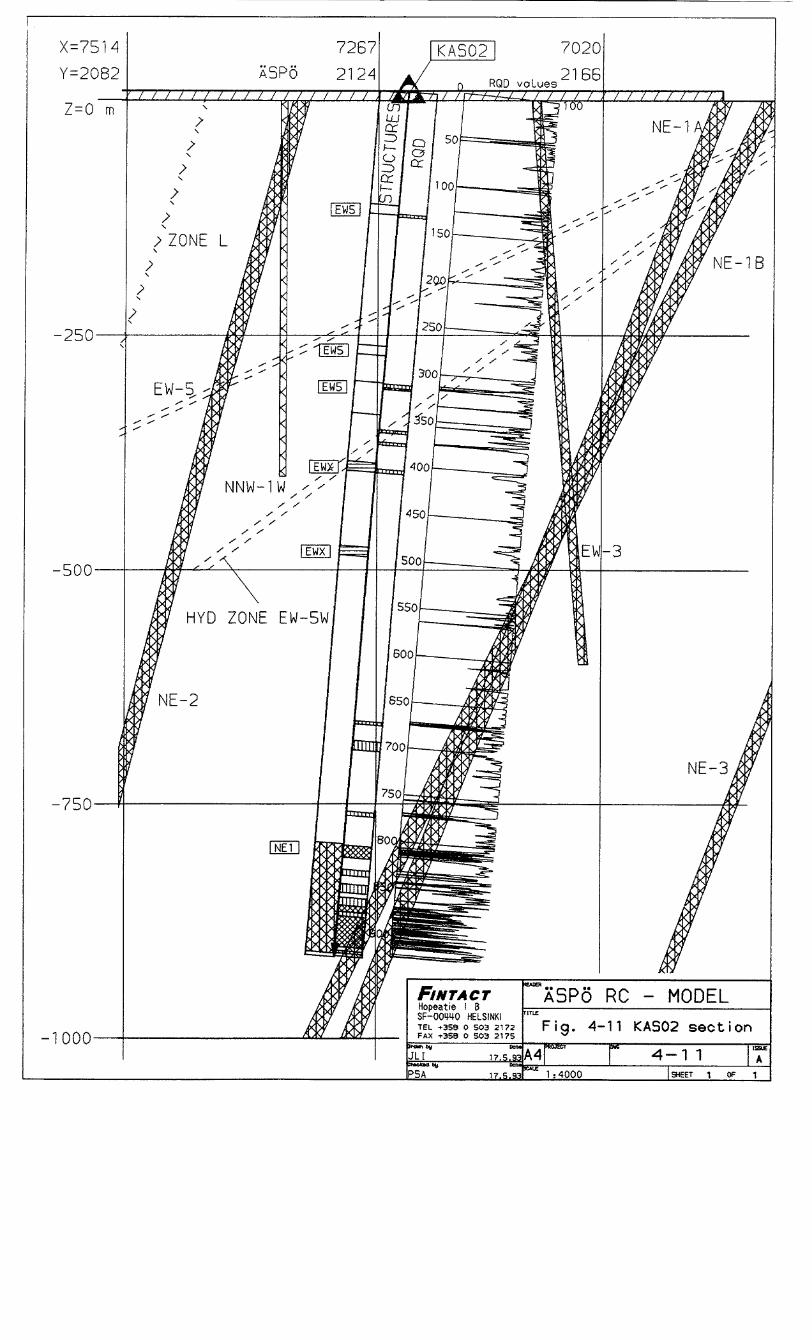
4-11. Local cross-section along KAS02 in scale
1:4000. Bars in KAS02 present identified structure
intersections and fracturing intensity variations
(RQD based) along the borehole. Original RQD mapping
34
profile marked with 50 m tick lines is also pre
sented. Other explanations are the same as in Figure
4-10.
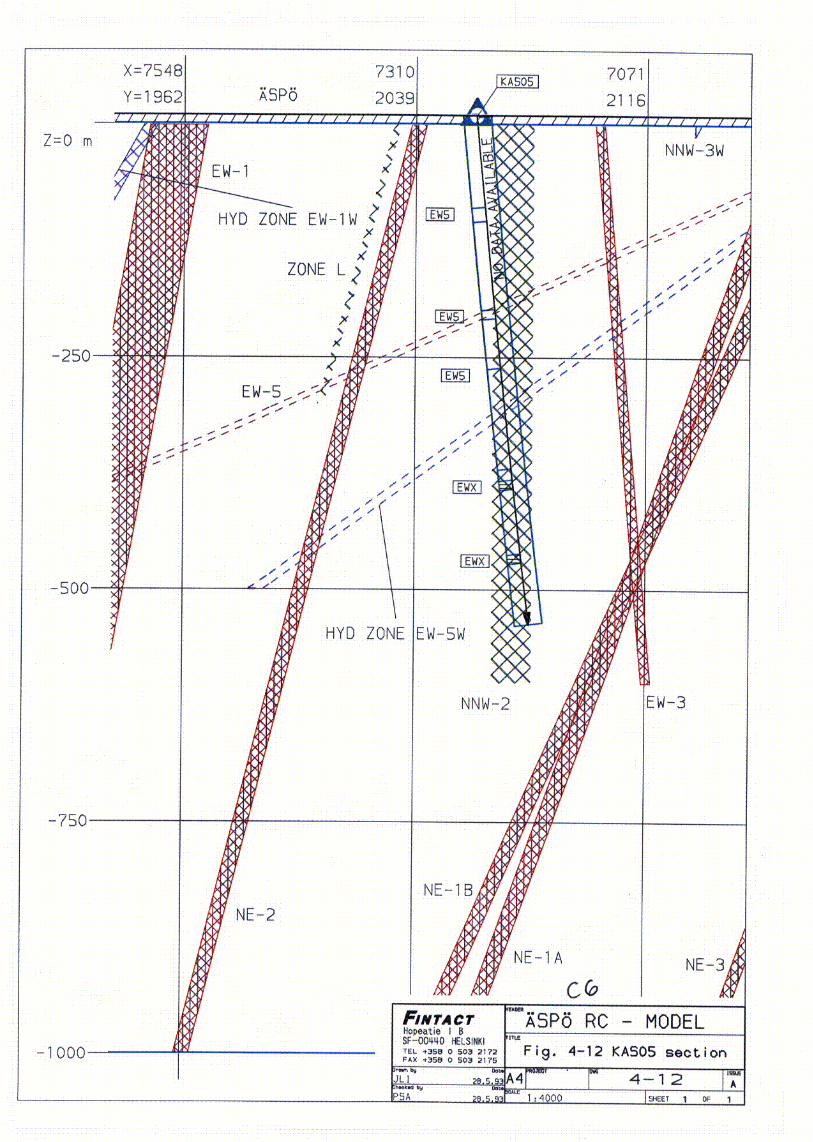
4-12. Local cross-section along KAS05 in scale
1:4000. Bars in KAS05 present identified structure
intersections and fracturing intensity variations
(RQD based) along the borehole. Display width of the
borehole is 15 m for each theme. Currently, RQD data
has not been included.
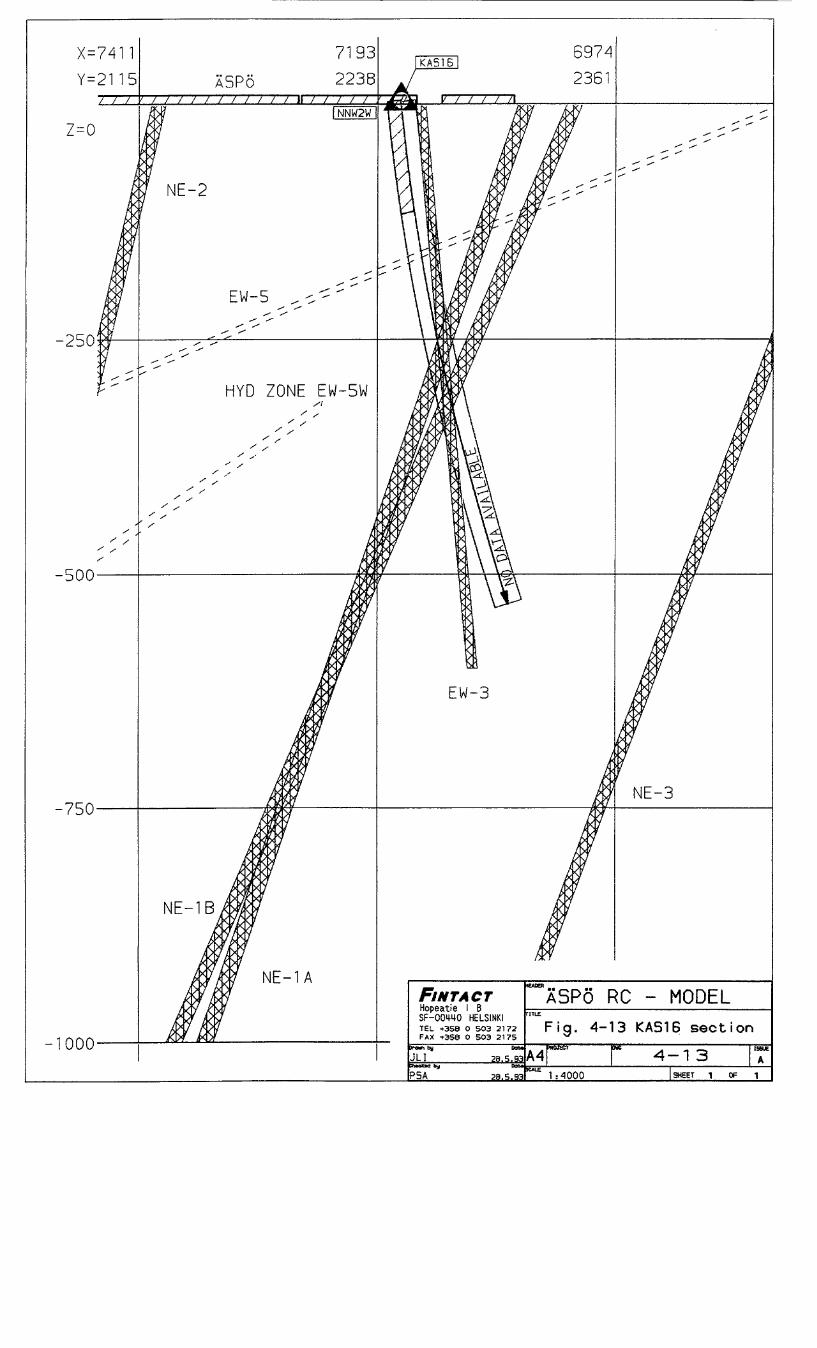
4-13. Local cross-section along KAS16 in scale
1:4000. Bars in KAS16 present identified structure
intersections. RQD bar was not determined by now and
is left blank in the figure.
Raster graphics (shaded) views:
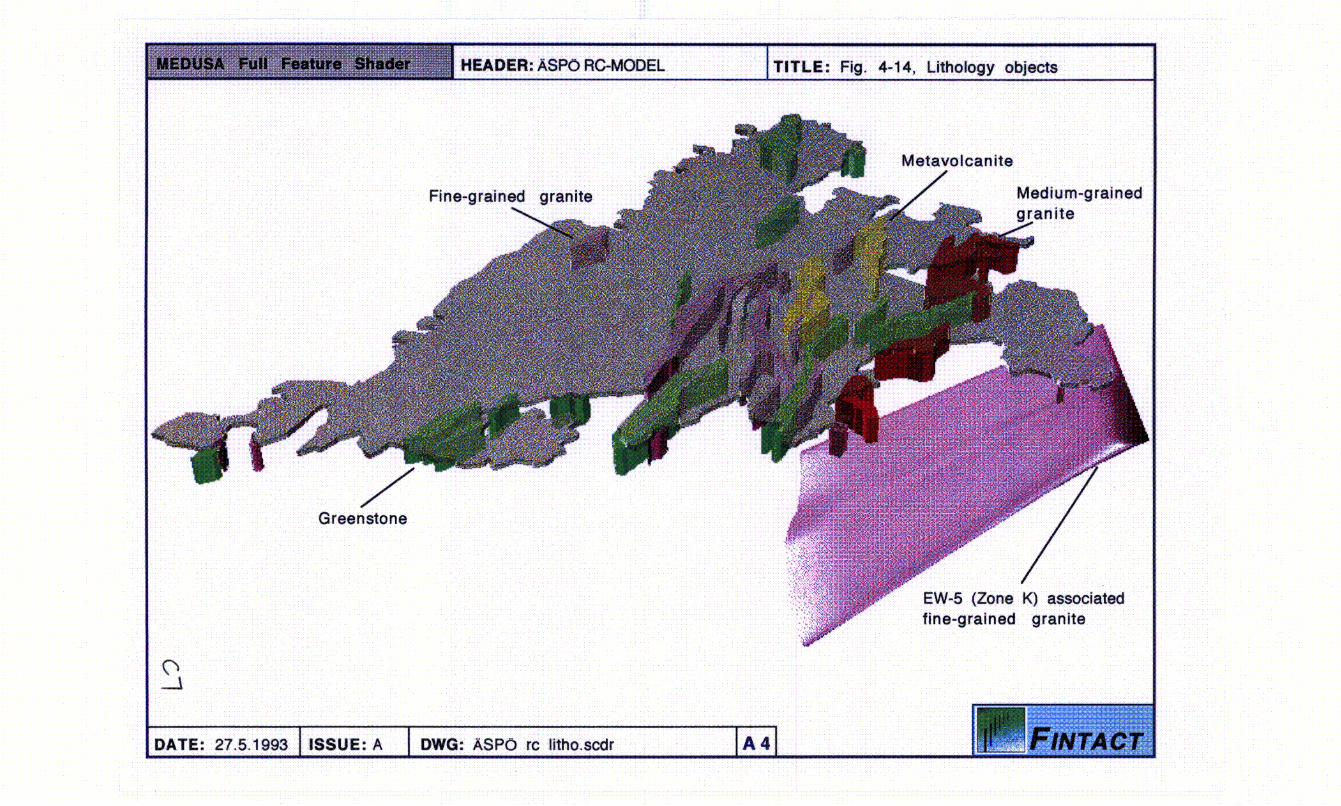
4-14. Inclined view from southwest into ROCKUNITS
lithological objects assembly. Colouring is set ac
cording to Table 3-5. Asp6 island outline represents
also the occurrence of the dominating medium-grained,
greyish red granite (so called Avr6 granite).
4-15. Structural model total assembly (all fracture
and hydraulic zones). Colour codings are set accord
ing to Table 3-4. View is from the northeast.
4-16. Structural model assembly including all frac
ture and hydraulic zones identified to "certain"
level. Colour codings are set according to Table 3-4.
Planned rock rooms like access tunnel, spiral etc.
are taken into model view and they are partly visi
ble.
4-17. Structural model subassembly showing hydraulic
zones (NW- and NNW- orienting). View direction is
from the north.
35
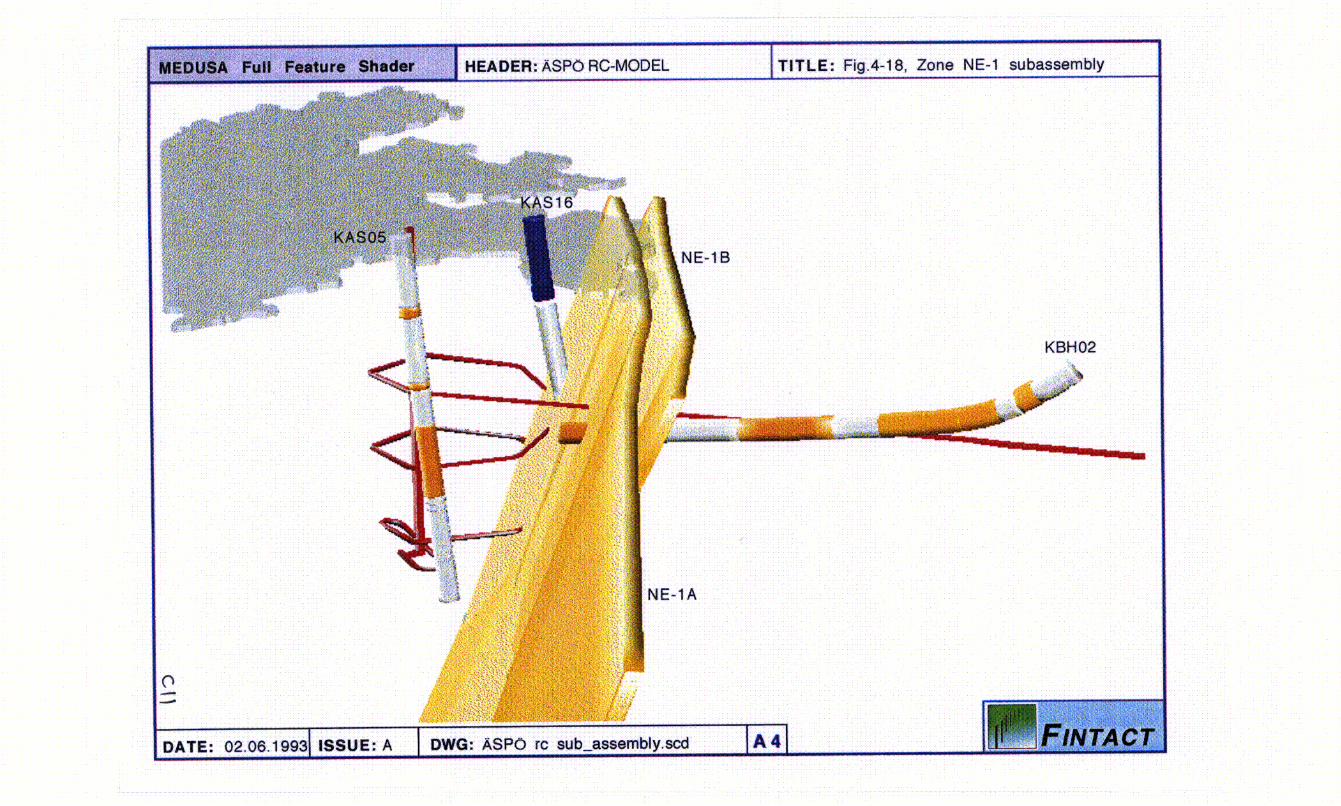
4-18. Submodel assembly containing planned rock room
objects, Asp6 island, major fracture zone NE-lA & NE
lB and borehole profiles KBH02, KAS05 and KASI6.
Coloured borehole profiles indicate structure inter
sections and follow settings in Table 3-7: major zone
is brown, hydraulic zone is blue.
4-19. Borehole KAS02 with concentric 3-D bar presen
tations of structure intersections and fracturing in