20
RMD Financial Corporation 2300 W. 29th Ave., Denver, Colorado 80205 720-436-4832 Fax 720-262-8994 www.rmdfc.net [email protected] International Airport Concession Briefing Package

RMD Financial Corporation 2300 W. 29th Ave.,
Denver, Colorado 80205
720-436-4832
Fax 720-262-8994
www.rmdfc.net
International Airport Concession
Briefing Package
Airport Briefing Package www.rmdfc.net Page 2 of 20
International Airport Concession
Briefing Package
Table of Contents
Purpose of Briefing Package . . . . . . . . . . . . . . . . . . . . . . . . . . . . . . . . . . . . . . . . . . . . . . . . . . . 3
Scope of Concession Program Analysis . . . . . . . . . . . . . . . . . . . . . . . . . . . . . . . . . . . . . . . . . . 3
Preliminary Economic Analysis – Level I . . . . . . . . . . . . . . . . . . . . . . . . . . . . . . . . . . . . . . . . . . 3
Concession Program Analysis – Food and Beverage . . . . . . . . . . . . . . . . . . . . . . . . . 5
Concession Program Analysis – Retail and Services . . . . . . . . . . . . . . . . . . . . . . . . . . 7
Concourse and Terminal Analysis – Level II. . . . . . . . . . . . . . . . . . . . . . . . . . . . . . . . . . . . . . . 6
Detailed Concession Concept Analysis . . . . . . . . . . . . . . . . . . . . . . . . . . . . . . . . . . . . 7
Diagram of Passenger Traffic Analysis . . . . . . . . . . . . . . . . . . . . . . . . . . . . . . . . . . . . . 8
Concession Location Analysis – Level III . . . . . . . . . . . . . . . . . . . . . . . . . . . . . . . . . . . . . . . . 9
Concession Development Analysis – Scenario #1. . . . . . . . . . . . . . . . . . . . . . . . . . . .9
Concession Development Analysis – Scenario #2 . . . . . . . . . . . . . . . . . . . . . . . . . . . 12
Concession Acquisition and Development Analysis – Scenario #1 . . . . . . . . . . . . . 15
Concession Acquisition and Development Analysis – Scenario #2 . . . . . . . . . . . . . 17
Corporate Profile . . . . . . . . . . . . . . . . . . . . . . . . . . . . . . . . . . . . . . . . . . . . . . . . . . . . . . . . . . . . 20
Airport Concession Proposal Development and Packaging . . . . . . . . . . . . . . . . . . 19
Acquisition of Airport Concessions . . . . . . . . . . . . . . . . . . . . . . . . . . . . . . . . . . . . . . . . 19
Marketing of Airport Concessions . . . . . . . . . . . . . . . . . . . . . . . . . . . . . . . . . . . . . . . . 19
Corporate Information . . . . . . . . . . . . . . . . . . . . . . . . . . . . . . . . . . . . . . . . . . . . . . . . . . . . . . . 20
Airport Briefing Package www.rmdfc.net Page 3 of 20
Purpose of Briefing Package
This briefing package should provide the reader with an overall perspective of the international airport concession industry. Each investor will glean a clear understanding of how political issues, security, economics, and social factors affect the international airport concession industry. Investors will come to appreciate why the political structure of a city or region is a reflection of its airport history (example JFK and others). Concession operational, investment, and management issues are addressed in this package. The process of developing or acquiring airport concessions is also outlined in this briefing package. After reviewing this briefing package, an investor will have a basic understanding of the three levels of analyses one must conduct to make a prudent investment decision.
Scope of Concession Program Analysis
RMD Financial Corporation generates concession structure analysis based upon timely & critical information from foremost industry sources. The objective of this analysis is to provide an essential three-part report for the concessionaire in evaluating any airport concession opportunity. The Level I report provides preliminary economic analysis of the top twenty international airports in North America and is the starting point for analyzing an airport's concession program. It is based upon 16 major categories critical to any concession. In Level II analysis, we provide concourse and terminal success and failure rates. The final report, Level III, analyzes location and its significance.
Primary Information Sources: Airports Council International – North America Federal Aviation Administration US Department of Transportation RMD Financial Corporation's staff and clients
Preliminary Economic Analyses – Level I
Number 1 Ranking By Category RMD has ranked each of the top twenty North American international airports below based upon 16 major analytical categories. The number one airport in each category has been identified. The number one overall international airport in North America, from the standpoint of concession management and revenue performance is Las Vegas - McCarran International Airport and the worst overall international airport is Toronto Pearson International Airport.
Passenger Count Ranking Passenger Count Ranking are determined by the Airports Council International of North America based upon the FAA's annual report of passenger enplanements and deplanements at US airports. Of the 151 airports in North America, 56.87% of 1,354,262,379 passengers travel through the top twenty airports.
Airport RMD has listed each of the top twenty North American international airports based upon their passenger traffic. RMD has included a website link to the home page of each international airport. Each website will enable you to find detailed information about each airport.
Airport Briefing Package www.rmdfc.net Page 4 of 20
Passenger Count Category #1 The FAA generates an annual report of passenger enplanements and deplanements based upon information provided to the agency by aviation managers.
Percentage Total Category #2 The passenger traffic of each international airport is compared to the total passenger traffic for the top twenty North American international airports and the percentage of traffic controlled by each airport is listed.
Total Revenues Category #3 Each international airport publish the annual revenues for each revenue source to include, retail, services, landing fees, and food and beverage revenues. Trade magazines such as World Airport Retail News publish annual detailed revenue numbers. RMD's concession structure analyses are limited to retail, services, and food and beverage revenues with an adjustment for Duty Free and General Services revenues. This adjustment allows for a comprehensive comparative analysis of all airports.
Total Net Passenger Yield Category #4 The net passenger yield for each airport reflects a computed net dollar yield for each airline passenger. Both passenger enplanements and deplanements numbers are included in the analysis. The net passenger yield numbers for retail, services, and food and beverage revenues serves as an indicator of how well each airport has structured its concession program. An airport with retail NPY of $5.50 is generating greater revenues for their concessionaires and airport authority than an airport generating an NPY of $2.50. An airport could be generating below average NPY’s and still be a poorly managed airport from the standpoint of the concessionaire.
Net Passenger Yield Less Duty Free Category #5 The net passenger yield for each airport reflects a computed net dollar yield for each airline passenger. Only five of the top twenty international airports realize significant Duty Free revenues. Hence, we have computed the impact of Duty Free Revenues on overall revenues. RMD's concession structure analyses are limited to retail, services, and food and beverage revenues with an adjustment for Duty Free revenues. This adjustment allows for a comprehensive comparative analysis of all airports.
Food and Beverage Concession Analysis Category #6 -10 Each element of food and beverage revenues is analyzed separately to determine which international airport has the most economically sound concession program. The economic soundness of an airport's concession program is not driven by the size of the airport or the passenger traffic. A concessionaire's evaluation of an airport's concession program should include an analysis of the issues outlined below, the other relevant categories in this report and a detailed study of passenger traffic.
Revenues Category #6 - Gross food and beverage revenues Net Passenger Yield Category #7 - Net Passenger Yield for food and beverage revenues Square Footage Category #8 - Leased food and beverage space at the airport

Airport Briefing Package www.rmdfc.net Page 5 of 20
Monthly Revenues Per Square Foot Category #9 - Monthly Revenues Per Square Foot for food and beverage revenues
Passenger Count to Square Foot Leased Category #10 - The relationship between passenger count and leased square footage
Retail and Services Concession Analysis Category #11 - 15 Each element of retail revenues are analyzed separately to determine which international airport has the most economically sound concession program. The economic soundness of an airport's concession program is not driven by the size of the airport or the passenger traffic. A concessionaire's evaluation of an airport's concession program should include an analysis of the issues outlined below, the other relevant categories in this report and a detailed study of passenger traffic.
Revenues Category #11 - Gross retail revenues Net Passenger Yield Category #12 - Net Passenger Yield for retail revenues Square Footage Category #13 - Leased retail space at the airport Monthly Revenues Per Square Foot Category #14 - Monthly Revenues Per Square Foot
for retail revenues Passenger Count to Square Foot Leased Category #15 - The relationship between
passenger count and leased square footage
Overall Revenues Per Square Foot Category #16 The purpose of this category is to establish a standard for all airports. The economic impact of all 16 categories is used to compute the Overall Revenues Per Square Foot analysis.
Concession Program Analysis – Food and Beverage

Airport Briefing Package www.rmdfc.net Page 6 of 20
Concession Program Analysis – Retail and Services
Concourse and Terminal Analyses – Level II
The Level II analysis provides investors with the critical details concerning the success or failure of concourse or terminal locations in international airports. Airports with more than three concourses or terminals, and less than five-million enplanements have historically been poorly performing airports. Evidences of a poorly performing airport are revealed in an airport’s passenger count to leased square footage ratio. The merchandizing and concession configuration of a concourse or terminal should be driven by the passenger profile of the airlines operating in each concourse or terminal. A high-end jewelry retailer will not be successful in a terminal controlled by a budget airline. Nationally recognized brand named concepts have a high level of success. However, they require a greater capital investment and are viewed as corporate flagships. The business life cycle, lease structure, and concession buyout policy of an airport can dramatically affect the value of a concession. Of course, location, location, location is king in the airport concession industry.

Airport Briefing Package www.rmdfc.net Page 7 of 20
Detailed Concession Concept Analyses

Airport Briefing Package www.rmdfc.net Page 8 of 20
Diagram of Passenger Traffic Analysis

Airport Briefing Package www.rmdfc.net Page 9 of 20
Concession Location Analyses – Level III
Concession Development Analysis – Scenario #1
Scenario #1 First Year Revenues $83.50 $219,998 Dev/Cost 6.73 Pay/Prd
Gross Revenues
Food 81.1% 396,000 81.1% 415,800 81.1% 436,590 81.1% 458,420 81.1% 481,340 81.1%
Beverages 18.9% 92,000 18.9% 96,600 18.9% 101,430 18.9% 106,502 18.9% 111,827 18.9%
Total 100.0% 488,000 100.0% 512,400 100.0% 538,020 100.0% 564,921 100.0% 593,167 100.0%
Cost of Goods Sold
COG Food & Beverages 24.0% 117,120 24.0% 122,976 24.0% 129,125 24.0% 135,581 24.0% 142,360 24.0%
COG Paper and Others 1.0% 4,880 1.0% 5,124 1.0% 5,380 1.0% 5,649 1.0% 5,932 1.0%
Cost of Goods Sold 25.0% $122,000 25.0% $128,100 25.0% $134,505 25.0% $141,230 25.0% $148,292 25.0%
On-Site Direct Labor
Salaries and Wages 20.0% 97,600 20.0% 102,480 20.0% 107,604 20.0% 112,984 20.0% 118,633 20.0%
Payroll Taxes 3.4% 16,592 3.4% 17,422 3.4% 18,293 3.4% 19,207 3.4% 20,168 3.4%
Employee Benefits 0.8% 3,904 0.8% 4,099 0.8% 4,304 0.8% 4,519 0.8% 4,745 0.8%
Management 7.2% 35,000 7.2% 35,000 6.8% 35,000 6.5% 35,000 6.2% 35,000 5.9%
Total 31.4% $153,096 31.4% $159,001 31.0% $165,201 30.7% $171,711 30.4% $178,546 30.1%
Direct Operating ExpensesFees/Permits/Licenses 0.1% 500 0.1% 500 0.1% 500 0.1% 500 0.1% 500 0.1%
Insurance 0.8% 4,000 0.8% 4,000 0.8% 4,000 0.7% 4,000 0.7% 4,000 0.7%
Utilities 2.7% 13,000 2.7% 13,000 2.5% 13,000 2.4% 13,000 2.3% 13,000 2.2%
Telephone 0.5% 2,400 0.5% 2,400 0.5% 2,400 0.4% 2,400 0.4% 2,400 0.4%
Repairs & Maintenance 0.4% 1,900 0.4% 1,900 0.4% 1,900 0.4% 1,900 0.3% 1,900 0.3%
Advertising & Promotion 0.5% 2,440 0.5% 2,562 0.5% 2,690 0.5% 2,825 0.5% 2,966 0.5%
Vechicle & Transportation 0.7% 3,600 0.7% 3,600 0.7% 3,600 0.7% 3,600 0.6% 3,600 0.6%
Credit Card Express 1.5% 7,320 1.5% 7,686 1.5% 8,070 1.5% 8,474 1.5% 8,898 1.5%
Outside Services 0.4% 1,800 0.4% 1,800 0.4% 1,800 0.3% 1,800 0.3% 1,800 0.3%
Others 0.0% 0.0% 0.0% 0.0% 0.0% 0.0%
Total 7.6% $36,960 7.6% $37,448 7.3% $37,960 7.1% $38,498 6.8% $39,063 6.6%
Amortizat./Depreciation 1.3% 6,286 1.3% 6,493 1.3% 6,493 1.2% 6,493 1.1% 6,493 1.1%
Rent to West Field 14% or $85,000 $85,000 17.4% $85,000 16.6% $85,000 15.8% $85,000 15.0% $85,000 14.3%
CAM to West Field $22.00 psf $10,714 2.2% $8,766 1.7% $8,766 1.6% $8,766 1.6% $8,766 1.5%
Interest Paid 2.3% $11,000 2.3% $14,300 2.8% $12,584 2.3% $11,074 2.0% $9,745 1.6%
Total Expenses 59.9% $292,342 59.9% $302,241 59.0% $307,238 57.1% $312,776 55.4% $318,848 53.8%
NET INCOME 15.1% $73,658 15.1% $82,059 16.0% $96,277 17.9% $110,915 19.6% $126,028 21.2%
Build-out & Development Cost (Net) $219,998 45.1% $219,998 42.9% $219,998 40.9% $219,998 38.9% $219,998 37.1%
Proj. FYE 2007
Cayenne's Hot Wings - Pro-Forma Model
Bush International Airport - Terminal EMay 15, 2006
PRO FORMA STATEMENT (YEAR 1 - YEAR 5)
Proj. FYE 2003 Proj. FYE 2004 Proj. FYE 2005 Proj. FYE 2006
$488,000 Revenues PSF

Airport Briefing Package www.rmdfc.net Page 10 of 20
Scenario #1 First Year Revenues $83.50 $219,998 Dev/Cost 6.73 Pay/Prd
Assumed Annual % Increase
Min. % Rent Retail Merch.
Min. % Rent Others
Min. Annual Dollars Rent % of Sales
Min. Annual Dollars Rent 487
Min. Annual Dollars Rent PSF
Min. Monthly Dollars Rent PSF
Sales Annually $488,000 100.0% $512,400 100.0% $538,020 100.0% $564,921 100.0% $593,167 100.0%
Sales Monthly $40,667 8.3% $42,700 8.3% $44,835 8.3% $47,077 8.3% $49,431 8.3%
Sales Daily $1,337 0.3% $1,404 0.3% $1,474 0.3% $1,548 0.3% $1,625 0.3%
Optng Expenses Daily $801 0.2% $828 0.2% $842 0.2% $857 0.2% $874 0.1%
Optng Profit Daily (BFIT) $536 0.1% $576 0.1% $632 0.1% $691 0.1% $752 0.1%
Annual Net Profit Before Taxes $73,658 15.1% $82,059 16.0% $96,277 17.9% $110,915 19.6% $126,028 21.2%Annual Net Profit After Taxes 30.00% $51,561 10.6% $57,441 11.2% $67,394 12.5% $77,640 13.7% $88,219 14.9%
Plus non-cash charges $6,286 1.3% $6,493 1.3% $6,493 1.2% $6,493 1.1% $6,493 1.1%
Less Debt Retirement 80.00% ($25,143) -5.2% ($28,160) -5.5% ($31,177) -5.8% ($34,194) -6.1% ($37,211) -6.3%
Net Operational Cash Flow6.70% $32,704 6.7% $35,774 7.0% $42,710 7.9% $49,939 8.8% $57,501 9.7%
Cash gain over orig. investment $32,704 6.7% $68,478 13.4% $111,188 20.7% $161,127 28.5% $218,628 36.9%
Cash gain over orig. investment % 14.87% 0.0% 31.13% 0.0% 50.54% 0.0% 73.24% 0.0% 99.38% 0.0%
Annual Revenues PSF 487 $1,002.05 0.2% $1,052.16 0.2% $1,104.76 0.2% $1,160.00 0.2% $1,218.00 0.2%
Monthly Revenues PSF $83.50 0.0% $87.68 0.0% $92.06 0.0% $96.67 0.0% $101.50 0.0%
Sales Annually $488,000 100.0% $512,400 100.0% $538,020 100.0% $564,921 100.0% $593,167 100.0%
Total cost to open (CTO) $219,998 45.1% $219,998 42.9% $219,998 40.9% $219,998 38.9% $219,998 37.1%
Less total financed, net of security deposit($175,998) -36.1% ($175,998) -34.3% ($175,998) -32.7% ($175,998) -31.2% ($175,998) -29.7%
Net cash investment $44,000 9.0% $44,000 8.6% $44,000 8.2% $44,000 7.8% $44,000 7.4%
Gross margin (after cost of sales & labor) 43.63% 43.97% 44.29% 44.60% 44.90%
Operating Income (goal is over 10%) 17.35% 18.81% 20.23% 21.59% 22.89%
Net Income before taxes (goal over 5%) 15.09% 16.01% 17.89% 19.63% 21.25%
Net cash flow before taxes 16.38% 17.28% 19.10% 20.78% 22.34%
Rent and CAM 17.42% 16.59% 15.80% 15.05% 14.33%
Total cost of labor 25.00% 25.00% 25.00% 25.00% 25.00%
Sales to cost ratio (goal is over 2.0) 2.22 2.33 2.45 2.57 2.70
Return on cash investment (NCF/CTO) 14.87% 16.26% 19.41% 22.70% 26.14%
Aver. # of Cust. Daily 206 208 211 213 217
Average Ticket Daily $6.50 $6.75 $7.00 $7.25 $7.50
Average Net Passenger Yeild $0.13 $0.14 $0.15 $0.15 $0.16
Total cost to open per sq. ft. leased $451.74 Orig. Term of Lease (Years) 7.00
Investment payback period in years 6.73 Remianing Term of Lease (Years) 7.00
Total Annual Passenger Traffic Airport Total Pass. Taffic Terminal
18.00%
0.00%
5.00%
18.00%
0.00%
0.00%
Proj. FYE 2003 Proj. FYE 2004 Proj. FYE 2005
Cayenne's Hot Wings - Pro-Forma Model
Bush International Airport - Terminal EMay 15, 2006
Financial AnalysisProj. FYE 2006 Proj. FYE 2007
5.00%
18.00%
17.42%
5.00%
18.00%
0.00%
15.80%16.59%
0.00%
15.05%
5.00%
18.00%
0.00%
14.33%
$85,000
$174.54 $174.54 $174.54 $174.54 $174.54
$85,000 $85,000 $85,000 $85,000
Proj. FYE 2004 Proj. FYE 2005
$14.54
Key Operating Ratios
$14.54 $14.54 $14.54 $14.54
35,245,846 3,700,000
$488,000 Revenues PSF
Proj. FYE 2006 Proj. FYE 2007
Concession Analysis
Proj. FYE 2003
Airport Briefing Package www.rmdfc.net Page 11 of 20
Scenario #1 Dev/Cost 6.73 Pay/Prd
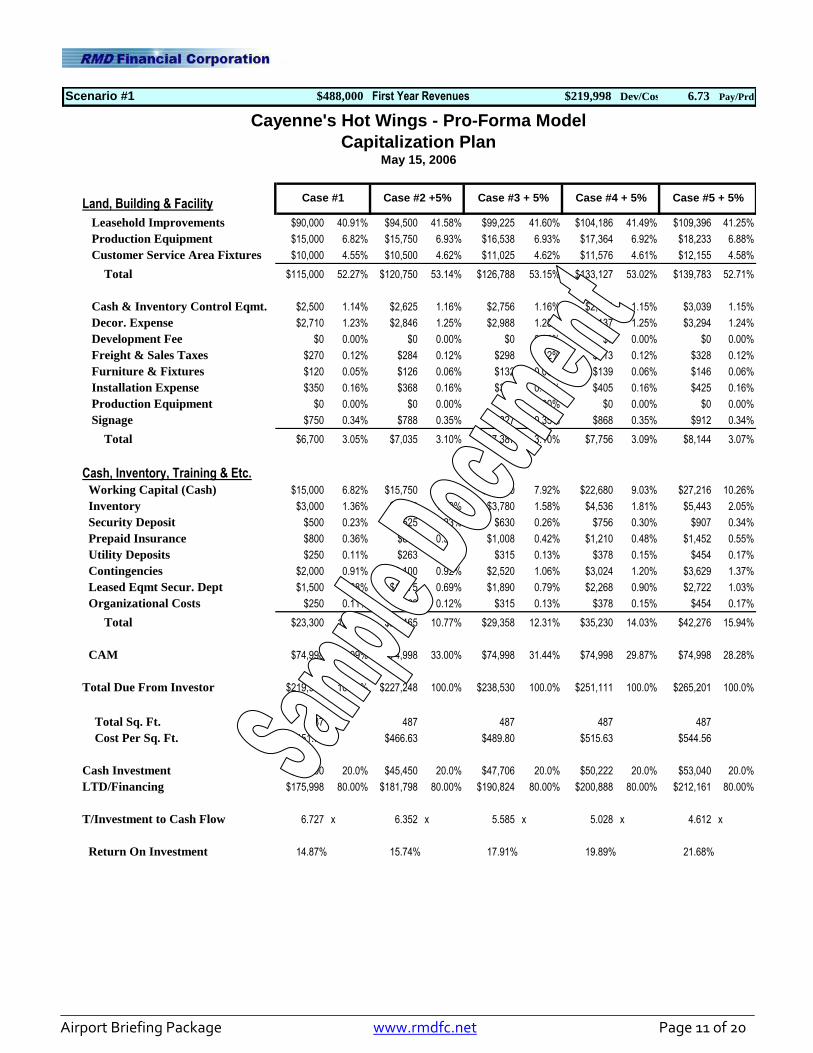
Land, Building & Facility
Leasehold Improvements $90,000 40.91% $94,500 41.58% $99,225 41.60% $104,186 41.49% $109,396 41.25%
Production Equipment $15,000 6.82% $15,750 6.93% $16,538 6.93% $17,364 6.92% $18,233 6.88%
Customer Service Area Fixtures $10,000 4.55% $10,500 4.62% $11,025 4.62% $11,576 4.61% $12,155 4.58%
Total $115,000 52.27% $120,750 53.14% $126,788 53.15% $133,127 53.02% $139,783 52.71%
Cash & Inventory Control Eqmt. $2,500 1.14% $2,625 1.16% $2,756 1.16% $2,894 1.15% $3,039 1.15%
Decor. Expense $2,710 1.23% $2,846 1.25% $2,988 1.25% $3,137 1.25% $3,294 1.24%
Development Fee $0 0.00% $0 0.00% $0 0.00% $0 0.00% $0 0.00%
Freight & Sales Taxes $270 0.12% $284 0.12% $298 0.12% $313 0.12% $328 0.12%
Furniture & Fixtures $120 0.05% $126 0.06% $132 0.06% $139 0.06% $146 0.06%
Installation Expense $350 0.16% $368 0.16% $386 0.16% $405 0.16% $425 0.16%
Production Equipment $0 0.00% $0 0.00% $0 0.00% $0 0.00% $0 0.00%
Signage $750 0.34% $788 0.35% $827 0.35% $868 0.35% $912 0.34%
Total $6,700 3.05% $7,035 3.10% $7,387 3.10% $7,756 3.09% $8,144 3.07%
Cash, Inventory, Training & Etc.
Working Capital (Cash) $15,000 6.82% $15,750 6.93% $18,900 7.92% $22,680 9.03% $27,216 10.26%
Inventory $3,000 1.36% $3,150 1.39% $3,780 1.58% $4,536 1.81% $5,443 2.05%
Security Deposit $500 0.23% $525 0.23% $630 0.26% $756 0.30% $907 0.34%
Prepaid Insurance $800 0.36% $840 0.37% $1,008 0.42% $1,210 0.48% $1,452 0.55%
Utility Deposits $250 0.11% $263 0.12% $315 0.13% $378 0.15% $454 0.17%
Contingencies $2,000 0.91% $2,100 0.92% $2,520 1.06% $3,024 1.20% $3,629 1.37%
Leased Eqmt Secur. Dept $1,500 0.68% $1,575 0.69% $1,890 0.79% $2,268 0.90% $2,722 1.03%
Organizational Costs $250 0.11% $263 0.12% $315 0.13% $378 0.15% $454 0.17%
Total $23,300 10.59% $24,465 10.77% $29,358 12.31% $35,230 14.03% $42,276 15.94%
CAM $74,998 34.09% $74,998 33.00% $74,998 31.44% $74,998 29.87% $74,998 28.28%
Total Due From Investor $219,998 100.0% $227,248 100.0% $238,530 100.0% $251,111 100.0% $265,201 100.0%
Total Sq. Ft. 487 487 487 487 487
Cost Per Sq. Ft. $451.74 $466.63 $489.80 $515.63 $544.56
Cash Investment $44,000 20.0% $45,450 20.0% $47,706 20.0% $50,222 20.0% $53,040 20.0%
LTD/Financing $175,998 80.00% $181,798 80.00% $190,824 80.00% $200,888 80.00% $212,161 80.00%
T/Investment to Cash Flow 6.727 x 6.352 x 5.585 x 5.028 x 4.612 x
Return On Investment 14.87% 15.74% 17.91% 19.89% 21.68%
$219,998$488,000 First Year Revenues
Capitalization PlanMay 15, 2006
Cayenne's Hot Wings - Pro-Forma Model
Case #4 + 5% Case #5 + 5%Case #1 Case #2 +5% Case #3 + 5%

Airport Briefing Package www.rmdfc.net Page 12 of 20
Concession Development Analysis – Scenario #2
Scenario #2 First Year Revenues $68.45 $219,998 Dev/Cost (6.80) Pay/Prd
Gross Revenues
Food 77.0% 308,000 77.0% 323,400 77.0% 339,570 77.0% 356,549 77.0% 374,376 77.0%
Beverages 23.0% 92,000 23.0% 96,600 23.0% 101,430 23.0% 106,502 23.0% 111,827 23.0%
Total 100.0% 400,000 100.0% 420,000 100.0% 441,000 100.0% 463,050 100.0% 486,203 100.0%
Cost of Goods Sold
COG Food & Beverages 24.0% 96,000 24.0% 100,800 24.0% 105,840 24.0% 111,132 24.0% 116,689 24.0%
COG Paper and Others 1.0% 4,000 1.0% 4,200 1.0% 4,410 1.0% 4,631 1.0% 4,862 1.0%
Cost of Goods Sold 25.0% $100,000 25.0% $105,000 25.0% $110,250 25.0% $115,763 25.0% $121,551 25.0%
On-Site Direct Labor
Salaries and Wages 20.0% 80,000 20.0% 84,000 20.0% 88,200 20.0% 92,610 20.0% 97,241 20.0%
Payroll Taxes 3.4% 13,600 3.4% 14,280 3.4% 14,994 3.4% 15,744 3.4% 16,531 3.4%
Employee Benefits 0.8% 3,200 0.8% 3,360 0.8% 3,528 0.8% 3,704 0.8% 3,890 0.8%
Management 8.8% 35,000 8.8% 35,000 8.3% 35,000 7.9% 35,000 7.6% 35,000 7.2%
Total 33.0% $131,800 33.0% $136,640 32.5% $141,722 32.1% $147,058 31.8% $152,661 31.4%
Direct Operating ExpensesFees/Permits/Licenses 0.1% 500 0.1% 500 0.1% 500 0.1% 500 0.1% 500 0.1%
Insurance 1.0% 4,000 1.0% 4,000 1.0% 4,000 0.9% 4,000 0.9% 4,000 0.8%
Utilities 3.3% 13,000 3.3% 13,000 3.1% 13,000 2.9% 13,000 2.8% 13,000 2.7%
Telephone 0.6% 2,400 0.6% 2,400 0.6% 2,400 0.5% 2,400 0.5% 2,400 0.5%
Repairs & Maintenance 0.5% 1,900 0.5% 1,900 0.5% 1,900 0.4% 1,900 0.4% 1,900 0.4%
Advertising & Promotion 0.5% 2,000 0.5% 2,100 0.5% 2,205 0.5% 2,315 0.5% 2,431 0.5%
Vechicle & Transportation 0.9% 3,600 0.9% 3,600 0.9% 3,600 0.8% 3,600 0.8% 3,600 0.7%
Credit Card Express 1.5% 6,000 1.5% 6,300 1.5% 6,615 1.5% 6,946 1.5% 7,293 1.5%
Outside Services 0.5% 1,800 0.5% 1,800 0.4% 1,800 0.4% 1,800 0.4% 1,800 0.4%
Others 0.0% 0.0% 0.0% 0.0% 0.0% 0.0%
Total 8.8% $35,200 8.8% $35,600 8.5% $36,020 8.2% $36,461 7.9% $36,924 7.6%
Amortizat./Depreciation 1.6% 6,286 1.6% 6,493 1.5% 6,493 1.5% 6,493 1.4% 6,493 1.3%
Rent to West Field 18% or $135,000 $135,000 33.8% $135,000 32.1% $135,000 30.6% $135,000 29.2% $135,000 27.8%
CAM to West Field $22.00 psf $10,714 2.7% $8,766 2.1% $8,766 2.0% $8,766 1.9% $8,766 1.8%
Interest Paid 2.7% $11,000 2.7% $14,300 3.4% $12,584 2.9% $11,074 2.4% $9,745 2.0%
Total Expenses 79.8% $319,286 79.8% $328,033 78.1% $331,819 75.2% $336,086 72.6% $340,823 70.1%
NET INCOME -4.8% ($19,286) -4.8% ($13,033) -3.1% ($1,069) -0.2% $11,202 2.4% $23,829 4.9%
Build-out & Development Cost (Net) $219,998 55.0% $219,998 52.4% $219,998 49.9% $219,998 47.5% $219,998 45.2%
$400,000 Revenues PSF
Proj. FYE 2003 Proj. FYE 2004 Proj. FYE 2005 Proj. FYE 2006 Proj. FYE 2007
Cayenne's Hot Wings - Pro-Forma Model
Bush International Airport - Terminal EMay 15, 2006
PRO FORMA STATEMENT (YEAR 1 - YEAR 5)

Airport Briefing Package www.rmdfc.net Page 13 of 20
Scenario #2 First Year Revenues $68.45 $219,998 Dev/Cost (6.80) Pay/Prd
Assumed Annual % Increase
Min. % Rent Retail Merch.
Min. % Rent Others
Min. Annual Dollars Rent % of Sales
Min. Annual Dollars Rent 487
Min. Annual Dollars Rent PSF
Min. Monthly Dollars Rent PSF
Sales Annually $400,000 100.0% $420,000 100.0% $441,000 100.0% $463,050 100.0% $486,203 100.0%
Sales Monthly $33,333 8.3% $35,000 8.3% $36,750 8.3% $38,588 8.3% $40,517 8.3%
Sales Daily $1,096 0.3% $1,151 0.3% $1,208 0.3% $1,269 0.3% $1,332 0.3%
Optng Expenses Daily $875 0.2% $899 0.2% $909 0.2% $921 0.2% $934 0.2%
Optng Profit Daily (BFIT) $221 0.1% $252 0.1% $299 0.1% $348 0.1% $398 0.1%
Annual Net Profit Before Taxes ($19,286) -4.8% ($13,033) -3.1% ($1,069) -0.2% $11,202 2.4% $23,829 4.9%Annual Net Profit After Taxes 30.00% ($13,500) -3.4% ($9,123) -2.2% ($748) -0.2% $7,841 1.7% $16,680 3.4%
Plus non-cash charges $6,286 1.6% $6,493 1.5% $6,493 1.5% $6,493 1.4% $6,493 1.3%
Less Debt Retirement 80.00% ($25,143) -6.3% ($28,160) -6.7% ($31,177) -7.1% ($34,194) -7.4% ($37,211) -7.7%
Net Operational Cash Flow-8.09% ($32,357) -8.1% ($30,790) -7.3% ($25,432) -5.8% ($19,860) -4.3% ($14,038) -2.9%
Cash gain over orig. investment ($32,357) -8.1% ($63,147) -15.0% ($88,579) -20.1% ($108,439) -23.4% ($122,477) -25.2%
Cash gain over orig. investment % -14.71% 0.0% -28.70% 0.0% -40.26% 0.0% -49.29% 0.0% -55.67% 0.0%
Annual Revenues PSF 487 $821.36 0.2% $862.42 0.2% $905.54 0.2% $950.82 0.2% $998.36 0.2%
Monthly Revenues PSF $68.45 0.0% $71.87 0.0% $75.46 0.0% $79.24 0.0% $83.20 0.0%
Sales Annually $400,000 100.0% $420,000 100.0% $441,000 100.0% $463,050 100.0% $486,203 100.0%
Total cost to open (CTO) $219,998 55.0% $219,998 52.4% $219,998 49.9% $219,998 47.5% $219,998 45.2%
Less total financed, net of security deposit ($175,998) -44.0% ($175,998) -41.9% ($175,998) -39.9% ($175,998) -38.0% ($175,998) -36.2%
Net cash investment $44,000 11.0% $44,000 10.5% $44,000 10.0% $44,000 9.5% $44,000 9.0%
Gross margin (after cost of sales & labor) 42.05% 42.47% 42.86% 43.24% 43.60%
Operating Income (goal is over 10%) -2.07% 0.30% 2.61% 4.81% 6.91%
Net Income before taxes (goal over 5%) -4.82% -3.10% -0.24% 2.42% 4.90%
Net cash flow before taxes -3.25% -1.56% 1.23% 3.82% 6.24%
Rent and CAM 33.75% 32.14% 30.61% 29.15% 27.77%
Total cost of labor 25.00% 25.00% 25.00% 25.00% 25.00%
Sales to cost ratio (goal is over 2.0) 1.82 1.91 2.00 2.10 2.21
Return on cash investment (NCF/CTO) -14.71% -14.00% -11.56% -9.03% -6.38%
Aver. # of Cust. Daily 169 170 173 175 178
Average Ticket Daily $6.50 $6.75 $7.00 $7.25 $7.50
Average Net Passenger Yeild $0.11 $0.11 $0.12 $0.13 $0.13
Total cost to open per sq. ft. leased $451.74 Orig. Term of Lease (Years) 7.00
Investment payback period in years (6.80) Remianing Term of Lease (Years) 7.00
Total Annual Passenger Traffic Airport Total Pass. Taffic Terminal35,245,846 3,700,000
$400,000 Revenues PSF
Proj. FYE 2006 Proj. FYE 2007
Concession Analysis
Proj. FYE 2003 Proj. FYE 2004 Proj. FYE 2005
$23.10
Key Operating Ratios
$23.10 $23.10 $23.10 $23.10
$135,000
$277.21 $277.21 $277.21 $277.21 $277.21
$135,000 $135,000 $135,000 $135,000
5.00%
18.00%
0.00%
27.77%
5.00%
18.00%
33.75%
5.00%
18.00%
0.00%
30.61%32.14%
0.00%
29.15%
Proj. FYE 2003 Proj. FYE 2004 Proj. FYE 2005
Cayenne's Hot Wings - Pro-Forma Model
Bush International Airport - Terminal EMay 15, 2006
Financial AnalysisProj. FYE 2006 Proj. FYE 2007
0.00%
0.00%
18.00%
0.00%
5.00%
18.00%

Airport Briefing Package www.rmdfc.net Page 14 of 20
Scenario #2 Dev/Cost (6.80) Pay/Prd
Land, Building & Facility
Leasehold Improvements $90,000 40.91% $94,500 41.58% $99,225 41.60% $104,186 41.49% $109,396 41.25%
Production Equipment $15,000 6.82% $15,750 6.93% $16,538 6.93% $17,364 6.92% $18,233 6.88%
Customer Service Area Fixtures $10,000 4.55% $10,500 4.62% $11,025 4.62% $11,576 4.61% $12,155 4.58%
Total $115,000 52.27% $120,750 53.14% $126,788 53.15% $133,127 53.02% $139,783 52.71%
Cash & Inventory Control Eqmt. $2,500 1.14% $2,625 1.16% $2,756 1.16% $2,894 1.15% $3,039 1.15%
Decor. Expense $2,710 1.23% $2,846 1.25% $2,988 1.25% $3,137 1.25% $3,294 1.24%
Development Fee $0 0.00% $0 0.00% $0 0.00% $0 0.00% $0 0.00%
Freight & Sales Taxes $270 0.12% $284 0.12% $298 0.12% $313 0.12% $328 0.12%
Furniture & Fixtures $120 0.05% $126 0.06% $132 0.06% $139 0.06% $146 0.06%
Installation Expense $350 0.16% $368 0.16% $386 0.16% $405 0.16% $425 0.16%
Production Equipment $0 0.00% $0 0.00% $0 0.00% $0 0.00% $0 0.00%
Signage $750 0.34% $788 0.35% $827 0.35% $868 0.35% $912 0.34%
Total $6,700 3.05% $7,035 3.10% $7,387 3.10% $7,756 3.09% $8,144 3.07%
Cash, Inventory, Training & Etc.
Working Capital (Cash) $15,000 6.82% $15,750 6.93% $18,900 7.92% $22,680 9.03% $27,216 10.26%
Inventory $3,000 1.36% $3,150 1.39% $3,780 1.58% $4,536 1.81% $5,443 2.05%
Security Deposit $500 0.23% $525 0.23% $630 0.26% $756 0.30% $907 0.34%
Prepaid Insurance $800 0.36% $840 0.37% $1,008 0.42% $1,210 0.48% $1,452 0.55%
Utility Deposits $250 0.11% $263 0.12% $315 0.13% $378 0.15% $454 0.17%
Contingencies $2,000 0.91% $2,100 0.92% $2,520 1.06% $3,024 1.20% $3,629 1.37%
Leased Eqmt Secur. Dept $1,500 0.68% $1,575 0.69% $1,890 0.79% $2,268 0.90% $2,722 1.03%
Organizational Costs $250 0.11% $263 0.12% $315 0.13% $378 0.15% $454 0.17%
Total $23,300 10.59% $24,465 10.77% $29,358 12.31% $35,230 14.03% $42,276 15.94%
CAM $74,998 34.09% $74,998 33.00% $74,998 31.44% $74,998 29.87% $74,998 28.28%
Total Due From Investor $219,998 100.0% $227,248 100.0% $238,530 100.0% $251,111 100.0% $265,201 100.0%
Total Sq. Ft. 487 487 487 487 487
Cost Per Sq. Ft. $451.74 $466.63 $489.80 $515.63 $544.56
Cash Investment $44,000 20.0% $45,450 20.0% $47,706 20.0% $50,222 20.0% $53,040 20.0%
LTD/Financing $175,998 80.00% $181,798 80.00% $190,824 80.00% $200,888 80.00% $212,161 80.00%
T/Investment to Cash Flow (6.799) x (7.381) x (9.379) x (12.644) x (18.892) x
Return On Investment -14.71% -13.55% -10.66% -7.91% -5.29%
Capitalization PlanMay 15, 2006
Cayenne's Hot Wings - Pro-Forma Model
Case #4 + 5% Case #5 + 5%Case #1 Case #2 +5% Case #3 + 5%
$219,998$400,000 First Year Revenues

Airport Briefing Package www.rmdfc.net Page 15 of 20
Concession Acquisition and Development Analysis – Scenario #1
Scenario #1 $1,469,024 First Year Revenues Revenues PSF $77.27 757,000$ 3.61 Pay/Prd
Year 1 Year 2 Year 3 Year 4 Year 5 Year 6 Year 7
Gross Revenues:
Food & Non-Alcoholic Beverage 55.5% 815,443 856,215 899,026 943,977 991,176 1,080,382 1,156,009 Beverage-Alcoholic 44.5% 653,581 686,260 720,573 756,602 794,432 865,931 926,546
Others 0.0% - - - - - - -
Total 100.0% $1,469,024 $1,542,475 $1,619,599 $1,700,579 $1,785,608 $1,946,313 $2,082,555
Cost of Goods Sold
COG - Food & Non-Alc. Bev. 29.0% 236,478 248,302 260,718 273,753 287,441 313,311 335,242
COG - Beverage-Alcoholic 15.0% 98,037 102,939 108,086 113,490 119,165 129,890 138,982 COG - Others 0.0% - - - - - - -
22.8% $334,516 $351,241 $368,803 $387,244 $406,606 $443,200 $474,224
On-Site Direct Labor:
Salaries and Wages 18.5% 271,769 285,358 299,626 314,607 330,337 360,068 385,273
Payroll Taxes 3.6% 52,885 55,529 58,306 61,221 64,282 70,067 74,972
Employee Benefits 1.7% 25,652 25,653 25,654 25,655 25,656 25,657 25,658
Other Employee Benefits 0.3% 4,113 4,319 4,535 4,762 5,000 5,450 5,831
Total 24.1% $354,420 $370,859 $388,120 $406,245 $425,275 $461,242 $491,734
Direct Operating Expenses:
Fees/Permits/Licenses 0.2% 2,204 2,314 2,429 2,551 2,678 2,919 3,124
Postage, Freight & Counter Services 0.1% 1,910 2,005 2,105 2,211 2,321 2,530 2,707
Insurance 0.1% 1,462 1,535 1,612 1,692 1,777 1,937 2,072
Utilities (On-Airport) 2.4% 35,257 37,019 38,870 40,814 42,855 46,712 49,981
Telephone 0.3% 3,673 3,856 4,049 4,251 4,464 4,866 5,206
Repairs & Maintenance (On-Airport) 0.3% 4,896 4,896 4,896 4,896 4,896 4,896 4,896
Advertising & Promotion - National 1.0% 14,690 15,425 16,196 17,006 17,856 19,463 20,826
Advertising & Promotion - Local 0.0% - - - - - - -
Vechicle & Transportation 0.2% 2,938 3,085 3,239 3,401 3,571 3,893 4,165
Credit Card Express 0.8% 11,752 12,340 12,957 13,605 14,285 15,571 16,660
Bank Charges 0.1% 1,469 1,542 1,620 1,701 1,786 1,946 2,083
Supplies (On-Airport) 1.0% 13,956 14,654 15,386 16,156 16,963 18,490 19,784
Taxes (Exclusive of Income Taxes) 0.3% 4,407 4,627 4,859 5,102 5,357 5,839 6,248
Outside Services (On-Airport) 0.6% 8,227 8,638 9,070 9,523 9,999 10,899 11,662 Amortization/Depreciation (On-Airport) 0.0%
Total 7.3% $106,839 $111,936 $117,288 $122,908 $128,808 $139,960 $149,415
Amortization/Depreciation 4.9% 72,429 72,429 72,429 72,429 72,429 72,429 72,429
Concession Fees Paid to Hobby 13.3% $195,890 $205,685 $215,969 $226,768 $238,106 $259,535 $277,703
Franchise Fees Paid to Quizno's 7.0% 102,832 107,973 113,372 119,041 124,993 136,242 145,779
Interest Paid to Financial Institution 1.6% $23,625 $22,178 $20,579 $18,812 $16,859 $16,860 $16,861
Total Expenses 51.3% $753,202 $783,086 $814,385 $847,160 $881,477 $950,026 $1,008,141
NET INCOME 19.0% $278,474 $300,174 $323,039 $347,134 $372,533 $416,844 $454,410
Concession Acquisition Costs 17.0% 250,000 250,000 250,000 250,000 250,000 250,000 250,000
Concession Develop. & Buildout 34.5% 507,000 507,000 507,000 507,000 507,000 507,000 507,000
Total Concession Acqtn & Buildout 51.5% 757,000 757,000 757,000 757,000 757,000 757,000 757,000
PRO FORMA STATEMENT (YEAR 1 - YEAR 5)
Quizno's Restaurant Pro-Forma Model
Willam P. Hobby Airport - Center Concourse Unit C-14May 15, 2006
Cost of Goods Sold

Airport Briefing Package www.rmdfc.net Page 16 of 20
$1,469,024 First Year Revenues$0 Revenues PSF $77.27 $757,000 3.61 Pay/Prd
Year 1 Year 2 Year 3 Year 4 Year 5 Year 6 Year 7
Assumed Annual % Increase 5.00% 5.00% 5.00% 5.00% 5.00% 5.00%
Proposed % Rent Food & Beverage 12.00% 12.00% 12.00% 12.00% 12.00% 12.00% 12.00%
Proposed % Rent to Alcohol/Logo 15.00% 15.00% 15.00% 15.00% 15.00% 15.00% 15.00%
Proposed Total % Rent Yearly $195,890 $205,685 $215,969 $226,768 $238,106 $259,535 $277,703
Proposed Min. Dollars Rent Yearly $125,000 $128,750 $132,613 $136,591 $140,689 $144,909 $149,257
Proposed Min. Dollars Rent PSF Monthly $4.11 $4.23 $4.36 $4.49 $4.62 $4.76 $4.91
Projected Revenues PSF Monthly $48.29 $50.71 $53.24 $55.90 $58.70 $63.98 $68.46
Proposed Dollars Rent % of Sales 8.51% 8.35% 8.19% 8.03% 7.88% 7.45% 7.17%
Sales Annually $1,469,024 $1,542,475 $1,619,599 $1,700,579 $1,785,608 $1,946,313 $2,082,555Sales Monthly $122,419 $128,540 $134,967 $141,715 $148,801 $162,193 $173,546
Sales Daily $4,025 $4,226 $4,437 $4,659 $4,892 $5,332 $5,706Optng Expenses Daily $2,064 $2,145 $2,231 $2,321 $2,415 $2,603 $2,762
Optng Profit Daily (BFIT) $1,961 $2,081 $2,206 $2,338 $2,477 $2,730 $2,944
Annual Net Profit Before Taxes $278,474 $300,174 $323,039 $347,134 $372,533 $416,844 $454,410
Annual Net Profit After Taxes 30.00% $194,932 $210,122 $226,127 $242,994 $260,773 $291,791 $318,087
Plus non-cash charges $72,429 $72,429 $72,429 $72,429 $72,429 $72,429 $72,429
Less Debt Retirement 80.00% ($57,943) ($64,896) ($71,849) ($78,802) ($85,755) ($85,755) ($85,755)
Net Operational Cash Flow 14.26% $209,418 $217,654 $226,706 $236,620 $247,446 $278,464 $304,760
Cash gain over orig. investment $209,418 $427,072 $653,779 $890,399 $1,137,845 $1,416,309 $1,721,070
Cash gain over orig. investment % 27.66% 56.42% 86.36% 117.62% 150.31% 187.10% 227.35%
Annual Revenues PSF 2,535 $579.50 $608.47 $638.90 $670.84 $704.38 $767.78 $821.52
Monthly Revenues PSF $48.29 $50.71 $53.24 $55.90 $58.70 $63.98 $68.46
Net Passenger Yeild $0.16 $0.16 $0.17 $0.18 $0.19 $0.21 $0.22
Sales Annually $1,469,024 $1,542,475 $1,619,599 $1,700,579 $1,785,608 $1,946,313 $2,082,555
Total cost to open (CTO) 757,000 757,000 757,000 757,000 757,000 757,000 757,000
Less total financed, net of security deposit ($605,600) ($605,600) ($605,600) ($605,600) ($605,600) ($605,600) ($605,600)
Net cash investment $151,400 $151,400 $151,400 $151,400 $151,400 $151,400 $151,400
Gross margin (after cost of sales & labor) 53.10% 53.19% 53.26% 53.34% 53.41% 53.53% 53.62%
Operating Income (goal is over 10%) 27.56% 27.90% 28.22% 28.52% 28.81% 29.28% 29.63%
Net Income before taxes (goal over 5%) 18.96% 19.46% 19.95% 20.41% 20.86% 21.42% 21.82%
Net cash flow before taxes 23.89% 24.16% 24.42% 24.67% 24.92% 25.14% 25.30%
Rent and CAM 13.33% 13.33% 13.33% 13.33% 13.33% 13.33% 13.33%
Total cost of labor 22.77% 22.77% 22.77% 22.77% 22.77% 22.77% 22.77%
Sales to cost ratio (goal is over 2.0) 2.90 3.04 3.19 3.35 3.52 3.84 4.11
Return on cash investment (NCF/CTO) 27.66% 28.75% 29.95% 31.26% 32.69% 36.79% 40.26%
Aver. # of Cust. Daily 537 545 555 565 576 609 634
Average Ticket Daily $7.50 $7.75 $8.00 $8.25 $8.50 $8.75 $9.00
Average Sales Per Hour 168 176 185 194 204 222 238
Airport Gates and Pass. Traffic - 2004 18.00 9,393,120 Term of Lease (mos/yrs) 84.00 7.00
Center Concourse Pass.Traffic - 2004 87.60% 8,228,373 Inv. Payback (mos/yrs) 43.38 3.61
Passengers Per Sq. Ft. Leased 3,705 Total sq. ft. leased C-13 2,535
Total cost to open per sq. ft. leased $298.62 Market Share % and $ 14.40% $1,469,024
Mthly Food Revenues PSF Airport $60.42 # of Gates Per CC/Mkt 11.00 4.00
Mthly Food Revenues PSF Concession C-13 $48.29 Mthly P/Traffic CC/Mkt 62,336 22,668
Quizno's Restaurant Pro-Forma Model
Willam P. Hobby Airport - Center Concourse Unit C-14
Scenario #1
Financial Analysis
May 15, 2006
Key Operating Ratios
Concession Analysis

Airport Briefing Package www.rmdfc.net Page 17 of 20
Concession Acquisition and Development Analysis – Scenario #2
Scenario #2 $954,866 First Year Revenues Revenues PSF $50.23 757,000$ 6.87 Pay/Prd
Year 1 Year 2 Year 3 Year 4 Year 5 Year 6 Year 7
Gross Revenues:
Food & Non-Alcoholic Beverage 55.5% 530,038 577,741 623,961 667,638 721,049 785,943 840,959 Beverage-Alcoholic 44.5% 424,828 463,062 500,107 535,115 577,924 629,937 674,032
Others 0.0% - - - - - - -
Total 100.0% $954,866 $1,040,804 $1,124,068 $1,202,753 $1,298,973 $1,415,880 $1,514,992
Cost of Goods Sold
COG - Food & Non-Alc. Bev. 29.0% 153,711 167,545 180,949 193,615 209,104 227,924 243,878
COG - Beverage-Alcoholic 15.0% 63,724 69,459 75,016 80,267 86,689 94,491 101,105 COG - Others 0.0% - - - - - - -
22.8% $217,435 $237,004 $255,965 $273,882 $295,793 $322,414 $344,983
On-Site Direct Labor:
Salaries and Wages 18.5% 176,650 192,549 207,953 222,509 240,310 261,938 280,274
Payroll Taxes 3.6% 34,375 37,469 40,466 43,299 46,763 50,972 54,540
Employee Benefits 2.7% 25,652 25,653 25,654 25,655 25,656 25,657 25,658
Other Employee Benefits 0.3% 2,674 2,914 3,147 3,368 3,637 3,964 4,242
Total 25.1% $239,351 $258,585 $277,220 $294,831 $316,366 $342,531 $364,713
Direct Operating Expenses:
Fees/Permits/Licenses 0.2% 1,432 1,561 1,686 1,804 1,948 2,124 2,272
Postage, Freight & Counter Services 0.1% 1,241 1,353 1,461 1,564 1,689 1,841 1,969
Insurance 0.1% 950 1,036 1,118 1,197 1,292 1,409 1,507
Utilities (On-Airport) 2.4% 22,917 24,979 26,978 28,866 31,175 33,981 36,360
Telephone 0.3% 2,387 2,602 2,810 3,007 3,247 3,540 3,787
Repairs & Maintenance (On-Airport) 0.5% 4,896 4,896 4,896 4,896 4,896 4,896 4,896
Advertising & Promotion - National 1.0% 9,549 10,408 11,241 12,028 12,990 14,159 15,150
Advertising & Promotion - Local 0.0% - - - - - - -
Vechicle & Transportation 0.2% 1,910 2,082 2,248 2,406 2,598 2,832 3,030
Credit Card Express 0.8% 7,639 8,326 8,993 9,622 10,392 11,327 12,120
Bank Charges 0.1% 955 1,041 1,124 1,203 1,299 1,416 1,515
Supplies (On-Airport) 1.0% 9,071 9,888 10,679 11,426 12,340 13,451 14,392
Taxes (Exclusive of Income Taxes) 0.3% 2,865 3,122 3,372 3,608 3,897 4,248 4,545
Outside Services (On-Airport) 0.6% 5,347 5,828 6,295 6,735 7,274 7,929 8,484 Amortization/Depreciation (On-Airport) 0.0%
Total 7.5% $71,159 $77,123 $82,901 $88,361 $95,038 $103,151 $110,029
Amortization/Depreciation 7.6% 72,429 72,429 72,429 72,429 72,429 72,429 72,429
Concession Fees Paid to Hobby 13.3% $127,329 $138,788 $149,891 $160,384 $173,214 $188,804 $202,020
Franchise Fees Paid to Quizno's 7.0% 66,841 72,856 78,685 84,193 90,928 99,112 106,049
Interest Paid to Financial Institution 2.5% $23,625 $22,178 $20,579 $18,812 $16,859 $16,860 $16,861
Total Expenses 55.9% $533,892 $569,102 $603,020 $634,816 $673,906 $723,774 $766,052
NET INCOME 14.3% $136,698 $161,841 $186,398 $209,861 $238,346 $270,580 $297,908
Concession Acquisition Costs 26.2% 250,000 250,000 250,000 250,000 250,000 250,000 250,000
Concession Develop. & Buildout 53.1% 507,000 507,000 507,000 507,000 507,000 507,000 507,000
Total Concession Acqtn & Buildout 79.3% 757,000 757,000 757,000 757,000 757,000 757,000 757,000
PRO FORMA STATEMENT (YEAR 1 - YEAR 5)
Quizno's Restaurant Pro-Forma Model
Willam P. Hobby Airport - Center Concourse Unit C-14May 15, 2006
Cost of Goods Sold

Airport Briefing Package www.rmdfc.net Page 18 of 20
$954,866 First Year Revenues$0 Revenues PSF $50.23 $757,000 6.87 Pay/Prd
Year 1 Year 2 Year 3 Year 4 Year 5 Year 6 Year 7
Assumed Annual % Increase 5.00% 5.00% 5.00% 5.00% 5.00% 5.00%
Proposed % Rent Food & Beverage 12.00% 12.00% 12.00% 12.00% 12.00% 12.00% 12.00%
Proposed % Rent to Alcohol/Logo 15.00% 15.00% 15.00% 15.00% 15.00% 15.00% 15.00%
Proposed Total % Rent Yearly $127,329 $138,788 $149,891 $160,384 $173,214 $188,804 $202,020
Proposed Min. Dollars Rent Yearly $125,000 $128,750 $132,613 $136,591 $140,689 $144,909 $149,257
Proposed Min. Dollars Rent PSF Monthly $4.11 $4.23 $4.36 $4.49 $4.62 $4.76 $4.91
Projected Revenues PSF Monthly $31.39 $34.21 $36.95 $39.54 $42.70 $46.54 $49.80
Proposed Dollars Rent % of Sales 13.09% 12.37% 11.80% 11.36% 10.83% 10.23% 9.85%
Sales Annually $954,866 $1,040,804 $1,124,068 $1,202,753 $1,298,973 $1,415,880 $1,514,992Sales Monthly $79,572 $86,734 $93,672 $100,229 $108,248 $117,990 $126,249
Sales Daily $2,616 $2,852 $3,080 $3,295 $3,559 $3,879 $4,151Optng Expenses Daily $1,463 $1,559 $1,652 $1,739 $1,846 $1,983 $2,099
Optng Profit Daily (BFIT) $1,153 $1,292 $1,428 $1,556 $1,713 $1,896 $2,052
Annual Net Profit Before Taxes $136,698 $161,841 $186,398 $209,861 $238,346 $270,580 $297,908
Annual Net Profit After Taxes 30.00% $95,688 $113,288 $130,479 $146,903 $166,842 $189,406 $208,535
Plus non-cash charges $72,429 $72,429 $72,429 $72,429 $72,429 $72,429 $72,429
Less Debt Retirement 80.00% ($57,943) ($64,896) ($71,849) ($78,802) ($85,755) ($85,755) ($85,755)
Net Operational Cash Flow 11.54% $110,174 $120,821 $131,058 $140,529 $153,515 $176,079 $195,209
Cash gain over orig. investment $110,174 $230,995 $362,054 $502,583 $656,098 $832,177 $1,027,386
Cash gain over orig. investment % 14.55% 30.51% 47.83% 66.39% 86.67% 109.93% 135.72%
Annual Revenues PSF 2,535 $376.67 $410.57 $443.42 $474.46 $512.42 $558.53 $597.63
Monthly Revenues PSF $31.39 $34.21 $36.95 $39.54 $42.70 $46.54 $49.80
Net Passenger Yeild $0.10 $0.11 $0.12 $0.13 $0.14 $0.15 $0.16
Sales Annually $954,866 $1,040,804 $1,124,068 $1,202,753 $1,298,973 $1,415,880 $1,514,992
Total cost to open (CTO) 757,000 757,000 757,000 757,000 757,000 757,000 757,000
Less total financed, net of security deposit ($605,600) ($605,600) ($605,600) ($605,600) ($605,600) ($605,600) ($605,600)
Net cash investment $151,400 $151,400 $151,400 $151,400 $151,400 $151,400 $151,400
Gross margin (after cost of sales & labor) 52.16% 52.38% 52.57% 52.72% 52.87% 53.04% 53.16%
Operating Income (goal is over 10%) 23.79% 24.68% 25.41% 26.01% 26.65% 27.30% 27.78%
Net Income before taxes (goal over 5%) 14.32% 15.55% 16.58% 17.45% 18.35% 19.11% 19.66%
Net cash flow before taxes 21.90% 22.51% 23.03% 23.47% 23.92% 24.23% 24.44%
Rent and CAM 13.33% 13.33% 13.33% 13.33% 13.33% 13.33% 13.33%
Total cost of labor 22.77% 22.77% 22.77% 22.77% 22.77% 22.77% 22.77%
Sales to cost ratio (goal is over 2.0) 1.88 2.05 2.22 2.37 2.56 2.79 2.99
Return on cash investment (NCF/CTO) 14.55% 15.96% 17.31% 18.56% 20.28% 23.26% 25.79%
Aver. # of Cust. Daily 349 368 385 399 419 443 461
Average Ticket Daily $7.50 $7.75 $8.00 $8.25 $8.50 $8.75 $9.00
Average Sales Per Hour 109 119 128 137 148 162 173
Airport Gates and Pass. Traffic - 2004 18.00 9,393,120 Term of Lease (mos/yrs) 84.00 7.00
Center Concourse Pass.Traffic - 2004 87.60% 8,228,373 Inv. Payback (mos/yrs) 82.45 6.87
Passengers Per Sq. Ft. Leased 3,705 Total sq. ft. leased C-13 2,535
Total cost to open per sq. ft. leased $298.62 Market Share % and $ 9.36% $954,866
Mthly Food Revenues PSF Airport $60.42 # of Gates Per CC/Mkt 11.00 4.00
Mthly Food Revenues PSF Concession C-13 $31.39 Mthly P/Traffic CC/Mkt 62,336 22,668
Financial Analysis
May 15, 2006
Key Operating Ratios
Concession Analysis
Quizno's Restaurant Pro-Forma Model
Willam P. Hobby Airport - Center Concourse Unit C-14
Scenario #2
Airport Briefing Package www.rmdfc.net Page 19 of 20
Corporate Profile
RMD Financial Corporation is a Colorado based consulting firm. We are both innovative and contemporary in our approach to business, financial and communications consulting. Since 1989, RMD's clients have received a broad range of business, financial, communications, and management consulting services and related products. Our clients benefit from the management and analyses expertise that RMD's management team provides.
Airport Concession Proposal Development and Packaging
RMD Financial Corporation’s airport concession proposal development and packaging services includes an in depth Concession Program Analysis of each airport, creation and implementation of a twelve to eighteen month Airport Concession Rollout Strategy, and the design of an airport specific Décor and Menu Plan. The most critical stage in the concession development (new concession) process is the selection of each airport and concourse based upon the customer profile of each firm. For example, you would not want to develop a Mont Blanc store in a Southwest Airlines terminal. Simply stated, the key to success as an international airport concessionaire is research and preparation. Each new airport concession investor must fully understand the economic and financial dynamics of each airport’s concession program. The quality and scope of an airport’s concession program can determine the success or failure of a concession concept. Many airport concession managers lease too much concession space considering the passenger traffic history of their airport. The process of securing a new airport concession could take from one to four months.
Acquisition of Airport Concessions
There are only two ways to become an airport concessionaire, by either acquiring (buyout) an existing concession or becoming the selected vendor in an open Request for Proposals Process. Both the buyout and RFP process require the approval of each airport’s property office. RMD’s concession buyout (acquisition) service includes an in depth Concession Program Analysis of selected airports. In fact, we are the only firm ranking the top 20 US airports based upon the performance of their concession programs. The process of acquiring an airport concession could take from four to 8 months.
Marketing of Airport Concessions
Airport concessionaires decide to sell their concession for a range of reasons, retirement, divorce, death, termination of a partnership, failure of a concession concept and others. RMD is the industry leader in marketing of airport concessions. With 35 concession locations, in 16 major airports, we set the standard for the buyout and resell of airport concessions. We have the resources and experience to determine the market value of each principal’s ownership interest in business assets and lease rights in their international airport concession(s). The market value of each concession depends upon whether it is retail, service or food concept, the term of the lease and several other factors. A concession which is designated a Disadvantage Business Enterprise (dbe) location has a lower value compared to a non-designated location. The process of selling an airport concession is complex and could take from four to 8 months.

Airport Briefing Package www.rmdfc.net Page 20 of 20
Corporate Information
RMD Financial Corporation Contact: Richard Daniel Street Address: 2300 W. 29th Ave.
Denver, Colorado 80205 Phone #: 720-436-4832 Fax #: 720-262-8994 Email Address: [email protected]
Richard Daniel, President


