. NATIONAL CENTER Series 2 l??(’)p~fl~opw : For HEALTH STATISTICS Number 33 P/j6LtCAT10mS BRANCH EDITORIAL LIB@RY VITAL and HEALTH STATISTICS DATA EVALUATION AND METHODS RESEARCH International Comparisons of Medical Care Utilization A Feasibility Study A study to test the feasibility of applying epidemiological methods based tan scientific sampling survey techniques to cross-national research on medical care utilization, U.S. DEPARTMENT OF HEALTH, EDUCATION, AND WELFARE Public Health Service Health Services and Mental Health Administration Washington, D.C. June 1969
Transcript
.
NATIONAL CENTER Series 2
l??(’)p~fl~opw :For HEALTH STATISTICS Number 33
P/j6LtCAT10mSBRANCHEDITORIALLIB@RY
VITAL and HEALTH STATISTICS
DATA EVALUATION AND METHODS RESEARCH
International Comparisons
of Medical Care Utilization
A Feasibility Study
A study to test the feasibility of applying epidemiological
methods based tan scientific sampling survey techniques to
cross-national research on medical care utilization,
U.S. DEPARTMENT OF HEALTH, EDUCATION, AND WELFARE
Public Health Service
Health Services and Mental Health Administration
Washington, D.C. June 1969
Public Health Service Publication No. 1000-Series 2-No. 3:
For sale by the Superintendent of Documents, U.S. Government Printing Office
Washington, D. C., 20402 - Price 70 cents
NATIONAL CENTER FOR HEALTH STATISTICS ~
THEODORE D. WOOLSEY, Direczfo7
PHILIP S. LAWRENCE, SC.D., Associate Director
OSWALD K. SAGEN, PH.D.,, Assistant Director for Health Statistics Development
WALT R. SIMMONS, M.A., Assistant Director for Research and Scientific Development
ALICE M. WATERHOUSE, M. D., Medical Consultant
JAMES E. KELLY, D. D. S., Dental Advisor
EDWARD E. MINTY, Executive O//icer
MA RGERY R. CUNNINGHAM, h-z/ormation O//icer
Public Hea Ith Service Publication No. 1000-Series 2 =No. 33
Library of Congress Catalog card Number 74600474
PREFACE
This report describes an international feasi-bilityy study of medical care utilization, undertakenjointly by research teams in the United States,Yugoslavia, and the United Kingdom from 1964to 1966. The groups involved were representativesof the Federal Institute of Public Health, Bel-grade, Yugoslavia; the Medical Care ResearchUnit, University of Manchester, Manchester, andthe Institute of Community Studies, London, Eng-land; the Department of Community Medicine,University of Vermont, Burlington, the Depart-ment of Medical Care and Hospitals, The JohnsHopkins University, Baltimore, and the NationalCenter for Health Statistics, Public Health Serv-ice, U.S. Department of Health, Education, andWelfare, Washington, D.C., United States.
The committee participants were: from theFederal :nstitute of Public Health, Herbert Kraus,M. D., Cedomir Vukmanovi~, M.D., M.P. H.,Dragana Andjelkovi<, M.D., M. P. H., PetarMacukanovi&, M. D., and Mileva Pirocanad,Ph.D. (consultant); from the University of Man-chester, Robert F, L. Logan, M. D., M. R. C. P.,R. J. C. Pearson, M. B., M.P. H., Joyce Pear-son, B,SC., John Beresford, B.SC., and JohnButler, M.A.; from the Institute of CommunityStudies, Ann Cartwright, Ph.D. (consultant); fromthe University of Vermont, John H. Mabry, Ph. D.,and Thomas C. Gibson, M. B., M. R.C.P. (corisult-ant); from The Johns Hopkins University, Kerr L.White, M.D., Alan Ross, Ph. D., and George A.Silver, M.D., M.P.H. (consultant); from the Na-tional Center for Health Statistics, O. K. Sagen,Ph. D., Margaret West, B.A., Eleanor L. Madigan,and Charles F. Cannell, Ph.D. (consultant to the
NationalResearch
Center for Health Statistics, SurveyCenter, University of Michigan, Ann
Arbor); and from the World Health Organization,R. F. Bridgman, M.D. (participant observer).
Direct financial support for the study wasreceived from the following sources:
Liverpool Regional Hospitals Board
Milbank Memorial Fund
Nuffield Provincial Hospitals Trust
United States Department of Health, Educa-tion, and Welfare, Public Health Service-Health Services and Mental Health Adminis-trateionResearch Grant CH 00158 through theNational Center for Health Services Re-search and DevelopmentSpecial International Research Program (P.L. 480), Research Agreement NCHS-Y2through the National Center for Health Sta-tistics
World Health Organization
Additional costs of travel to conferences,consultant service, and computer work were ab-sorbed by the National Center for Health Statis-tics apart from the support provided by the re-search agreement with the Yugoslavia FederalInstitute of Public Health. Each of the collabora-tive institutions contributed substantial supportto the study by furnishing personnel, facilities,and a variety of services not financed by theexplicit grants.
General Planning and Survey Design -------------------------------------Objectives ---------------------------------------------------------
Focus of the Study -----------------------------------------------Nature of the Study -----------------------------------------------Method of Tabulation and Analysis ---------------------------------
Organization -------------------------------------------------------Study Areas -------------------------------------------------------
Appendix I. Questionnaires -------------------------------------------
Appendix II. Technical Notes on Statistical Procedures -------------------Standard Population and Standardized Rates ---------------------------Estimates of Population Totals ---------------------------------------Standard Errors of Standardized Rates --------------------------------Standard Errors of Detailed Tables -----------------------------------Treatment of Noninterviews -----------------------------------------
. . .m
1
22234455666
8889
101011
12
20
20
21
57
747474747474
v
THIS NEW REPORT from the National Centev for Health Statisticsdescribes a veseavch undertaking to test the feasibility of epidemiolog-ical methods in a scientific sample suvvey to &roduce datu on medicalcare utilization from which valid comparisons could be made betweenthvee diffevent countries having different customs, systems of medicalcare, and demographic churactevistics. This study uxm conducted jointlyby veseavch teams in the United Kingdom, the United States of Amev-ica, and Yugoslavia Identical procedures were used to simultaneouslycollect medical care utilization &tu on thvee carefilly defined popula-tions, one community in each countvy. Utilization of services fromdoctovs, dentists, nurses, and other pvoviders of care was the depend-ent variable, which was studied in velation to independent t.uria blessuch as demographic factors, selected measures of pevceived mov-bidity, the extent and accessibility of medical cave personnel and facil-ities, and the peoplers attitudes toward medical care. Structuredhousehold interviews were conducted in a probability sample in eacharea of approximately 300 households, comprising about 1,000 persons.The repovt describes the conduct of the study, gives the findings andconclusions togethev with summavy ta~les incovpovating standa~dizedvates.
In spite of substantial differences in ways of life, organization of healthservices, and vepovted morbidity and disability, people in the thveestudy aveas appear to consult doctovs in much the same way, whilepattevns of hospitul utilization vavy substantially. Also, the amount ofconsultation fov curative sevvices is appa~ently unvelated to the supplyof doctors in the thvee areas.
The research findings exhibit reassuring intevnal consistency. The in-dependent validations done for cem!uin parts of the interview informa-tion indicate satisfactory consistency between the interview datu and
othev souvces. The study concludes that epidemiolo~”c methods em-ploying household interviews ave feasible in international and regionalstudies of medical cave utilization.
SYMBOLS
Data not available ------------------------ ---
Category not applicable ------------------- . . .
Quantity zero ---------------------------- -
Quantity more than O but less than 0.05---- 0.0
Figure does not meet standards ofreliability or precision ------------------ *
INTERNATIONAL COMPARISONS OF
MEDICAL CARE UTILIZATION.
A FEASIBILITY STUDY
Kerr L. White, M.D., and Jane H. Murnaghan, B.A. 1
INTRODUCTION
Although the levels of economic developmentand scientific progress may be similar in a num-ber of countries, it does not necessarily followthat their medical care systems are also similar,because the pattern of medical care in any onecountry is ultimately determined by its uniquecombination of political, social, and culturalforces. The study and comparison of medicalcare systems under differing circumstances canbe of great value to the administrators, planners,and investigators of health services.
Comparison cannot be attempted, however,until the systems in the respective countries orregions have been defined in terms of an accept-able yardstick or common frame of reference.One approach to this problem is to measure anddefine the utilization pattern of a medical caresystem. The utilization pattern is not only deter-mined by the extent of need to prevent or cureillness$ but is also influenced by economic, social,educational, and cultural factors, as wdll as bythe methods of payment, the organization, andthe attitudes of the purveyors of medical care.
The traditional measurement of utilizationhas centered on the records of health services
lDr. White is Professor of Medical Care and Hospitals and
Mrs. Murntighanie Assistant in Medical Care and Hospitals at
The Johns Hopkins University, School of Hygiene and PublicHeu’lth, Baltimore, Maryland.
facilities, such as hospitals and clinics; how-ever, these records do not reflect the entirerange of medical services utilized by a definedpopulation. A household survey must be under-taken in order to obtain relatively complete esti-mates for large general populations. Areas whichshould be surveyed are physician visits, whichare not recorded in all countries; information onthe level of “morbidity, complaints or conditionsfor which medical care is sought, deferred, ornot utilized at all; and the attitudes and satisfac-tions associated with medical care.
Studies of medical care utilization at thenational level had been conducted in several coun-tries in the 1950~s, w!lile active interest in re-search in this subject at the international levelwas stimulated by the World Health Organization.By 1963 medical care investigators in severalcountries were seriously considering an under-taking that would allow international comparison,The interest and ideas, as well as preliminaryfinancial commitments, were formally exchangedat a meeting in Belgrade, Yugoslavia, in April1964. Concrete plans were made for a feasibilitystudy to prepare the way for future research ofdifferential utilization of medical care facilities.
This report describes the main features ofthe feasibility study that resulted from the Bel-grade meeting. It is the work of a group known asthe Committee for the International CollaborativeStudy of Medical Care Utilization, representing20 senior investigators and eight institutions in
1
three participating countries—the United King-dom, Yugoslavia, and the United States. The in-vestigation was a unique experience in intensescientific collaboration between representativesof a variety of disciplines in several differentcountries. Apart from the specific contributions,the study paid intangible dividends in the intel-lectual stimulation, understanding of national andcultural differences, and the remarkable espvitde corps that developed within the committee.
The prime objective of the study was to as-certain whether valid, reliable, and comparabledata on the use of doctors’ and nurses’ servicesand on hospitalization among a defined populationduring a given period of time could be collectedsimultaneously in several settings by standard-ized epidemiological procedures. In addition, asa corollary to this objective, certain importantfactors affecting utilization were selected andinvestigated as independent variables of utiliza-tion. The principal variables chosen for thispurpose were demographic characteristics, se-lected measures of perceived morbidity, theextent and accessibility of medical care personneland facilities, and the population’s attitudes andsatisfactions with the care received.
The compromises and decisions involved indefining the objectives of the study and the plan-ning and organization for achieving those objec-tives are described in the following section.
The principal method employed to measurethe utilization of medical care services was thehousehold interview administered to a probabilitysample of about 300 households, or approximately1,000 individuals, in each of three small areas inNorthwest England, Serbia, Yugoslavia, and Ver-mont in the United States. The sampling designsand other aspects of the field work are summa-rized in the section titled “Field Work. ”
The specific information collected in the studyand the summary tables showing sample fre-quencies and standardized rates with their stand-ard errors are discussed under “Survey Results”followed by the conclusions. Twenty-three de-tailed tables, including population rates and ad-ditional sample frequencies, and an appendixpresenting the questionnaires conclude the report,
On the basis of the feasibility study, thecommittee has concluded that epidemiologicalmethods employing household interviews are suit-able for arriving at useful and valid international
and regional comparisons of medical care utili-zation. Many of the variables were found to becomparable, although some require further re-finement to achieve maximum comparability be-tween the study areas. Encouraged by the successof the pilot study, the committee has revised themethods and questionnaires and expanded thescope of its activities to encompass 11 studyareas in seven countries—Argentina, Canada,Finland, Poland, the United Kingdom, the UnitedStates, and Yugoslavia.
GENERAL PLANNING AND
SURVEY DESIGN
OBJECTIVES
At the first conference held in Belgrade,April 14-20, 1964, the three countries repre -sented-– Yugoslavia, the United States, and theUnited Kingdom—agreed to undertake what wasdescribed in the minutes as “a modest programto permit methodological investigation and providepreliminary data . . . as a first step towardsplanning more ambitious studies.” The long-rangeobjective was to explore the problems in obtainingcomparable data on the utilization of medicalcare in the three countries and to examine theextent to which certain factors affecting utiliza-tion of medical care are or are not common toall three countries, and thus, eventually to exam-ine associations between these factors and themethods of organizing medical care.
In order to achieve the objectives establishedat the first conference and to accommodate newparticipants, it was essential to come to gripswith three major issues. The fact that no onewas totally pleased or displeased with the deci-sions reached by the group suggests that a trueconsensus was achieved by the agencies, insti-tutions, and individuals who collaborated in theenterprise.
Focus of the Study
The framework that guided discussions andplanning included the following elements of themedical care process:
Need fov medical cave. —This includes “med-ical” needs as determined by physical ex-aminations, screening tests, and interviews,
2
and “social” needs as determined by laygroups and society.
Attitudes and expectations about medicalcave. —This includes the personal, familial,and cultural factors that condition the demandfor and the acceptance of medical care.
Demand for medical cave. —The actual orpotential expressed wish or request formedical care.
Utilization of medical cave.— The actual useof services whether needed or not in theeyes of the health professions, includinghospital and ambulatory care and profes-sional, paramedical, and quasi-medicalservices.
Satisfaction with medical care.
Outcome of medical cave. —End results of thequality of care.
There was great interest on the part ofcertain participants in assessing need and out-come and on the part of others in assessingattitudes and expectations. The final compromiseplaced the main emphasis on utilization withsubsidiary interest on demands, attitudes, andsatisfactions. There was little emphasis on needor on outcome. The rationale behind this deci-sion was that (1) the appraisal of utilization waslikely to be supported by the “hardest” data mostsusceptible to validation and (2) if one could notfeel reasonably confident about the comparabilityof utilization data and about the existence of truesimilarities and differences between countries,there was little basis for examining possibleexplanations for any differences observed.
Nature of the Study
Three types of studies were considered--descriptive, analytical, and hypothesis-testing.At the descriptive level the proposed study heldlittle of interest for many of the participants.Others argued that until it had been demonstratedthat reliable and comparative data could becollected, it was premature to encourage exten-sive analysis of the data or to undertake a studyin which hypothesis-testing of sociological vari-ables was a prominent consideration. At the
other end of the spectrum were those who believedthat the testing of hypotheses was the best methodto advance the field and insure rigor in themethods used, and that a cross-national studyafforded an unusual opportunity to examine certainhypotheses of great interest to social scientists,particularly attitudinal and familial determinantsof medical care utilization.
In the end, the major emphasis was placedon a modified analytical study, with the statementof a number of hypotheses that were not to betested in the formal sense, but were designed tosharpen the direction and specificity of the studyand to gain experience for later full-scale studies.The following are some initial hypotheses devel-oped for this purpose.
Basic Postulate
The use and nonuse of health services in a de-fined population varies with (1) perception of thesymptom and conditions or health situation forwhich use or nonuse occurs; (2) demographiccharacteristics; (3) the accessibility of physi-cians, nurses, other health workers, and hospitaland nursing-home beds available to that popula-t ion; and (4) respondents’ selected perceptionsof, and attitudes toward, their personal physi-cians.
Hyfiothesis 1
The physician consultation rate per 1,000population per unit time of a defined populationvaries directly with the m~mber of physicians per1,000 population.
Hypothesis 2
The physician consultation rate per 1,000population per unit time of a defined populationvaries inversely with the travel time required tocontact a physician.
Hypothesis 3
The proportion of persons in a defined popu-lation not consulting a physician for “certain con-ditions” that can be alleviated through such con-sultation varies directly with the degree ofcoverage of medical and hospital insurance.
Hypothesis 4
The proportion of persons in a defined popu-lation not consulting a physician for “certain
3
conditions”sultation is
that can be alleviated through cor-related to the patients’ and families’
expectations about medical treatment.
Hypothesis 5
The physician consultation rate per 1,000population per unit time varies in a different wayin the three countries and varies directly with theamount of education received.
Finally, it was agreed that each area coulduse additional short questionnaires to gather dataof particular interest to it. In point of fact thiswas done in two areas.
Method of Tabulation and Analysis
The third area of discussion concerned theextent to which the computer was to dictate theapproach to the tabulation and analysis of thedata. Under ordinary circumstances it wouldhave been desirable to examine the raw frequencydistributions of the responses to the questiomaireitems before deciding upon the cross-tabulations.Such an approach would delay the analysis andwould run the risk that errors in the punchedcards both within and between countries wouldonly be detected late in the whole process.
An additional consideration was the extentto which the raw sample frequencies would bepublished in contrast to the population estimatesbased on expansion of data for individual cellswhich took into account both sampling fractionsand nonresponse. There were strong feelingsthat the possibilities of further cross-tabulationsas well as the precision of the data could bestbe determined if raw sampIe frequencies wereavailable. On the other hand, it was feIt thatbecause a defined population was being studied,population estimates and rates accompanied bytheir standard errors to indicate their reliabilitywere the most suitable and useful figures forpresentation, and further, that sample frequencieswould be misleading in cases like Chester,England, where the nonresponse rates proved tobe relatively high and varied in different age andsex groups. The expanded population estimatesand rates could be adjusted to allow for thesedifferences, but the expansion factors variedwidely for different age and sex groups; from 1
in 60 to 1 in 110, instead of the total 1 in 92factor. Thus sample frequencies could not read-ily be converted to population figures, and show-ing two sets of figures could be confusing. Inthis report both sample frequencies and populationestimates, together with certain standardizedrates and standard errors, are published.
A further policy decision concerned theextent to which urban-rural categories should beused in tabulating and analyzing the survey re-sults. The difficulty arose from the fact thatthe term r‘rural” did not have the same meaningfor the study populations in the United Kingdomand the United States as it did for the populationin Yugoslavia. This was due to the fact that thepopulation in the United States and the UnitedKingdom usually were not dependent on agricul-ture for their support and frequently commutedto urban areas for their livelihood. To approachcomparability, the Chittenden unit planned origi-nally to allocate one-third of each of their sam-pling units to rural farm households, ruralnonfarm households, and urban households. How-ever, the final decision was to postpone rural-urban comparisons between the three areas untilmore experience had been gained from the feasi-bility study.
It was agreed to structure the final tabulationsin forms that recognized traditional influenceson medical care utilization. Data would be pre-sented by urban, rural, and total population cate-gories, and by sex and major age breaks. Mostanalyses would be done in terms of “persons” asthe basic count. Raw sample frequencies, expandedpopulation frequencies, rates per 1,000 for theindividual area population, and rates per 1,000standardized to the Swedish midyear population of1962 would be published.
Magnetic tapes were prepared at the NationalCenter for Health Statistics where the program-ming and tabulation were completed. Tapes,printouts, and tables were made available to eachagency or institution for additional analyses.
ORGANIZATION
No formal organization was set up beyonddesignating a general chairman and at least oneindividual in each study area who would assumeprimary responsibility and devote the major part
4
of his research efforts to the project. The entireexercise was notable for its flexibility, permittingthe participants to consult each other directly inany combination dictated by the problem at hand,unhampered by a fixed chain of command orprotocol.
The study required the collaboration of ex-perts in a number of fields; represented on thecommittee were physicians, statisticians, soci-ologists, and psychologists, and they were as-sisted in the field by numerous specialists insampling and computer techniques. No one countryor group of experts possessed a monopoly ofskills or knowledge necessary for the study; theproject can be truly characterized as both inter-disciplinary and international.
Prompt and thorough communication wasachieved through eight 1-week working confer-ences and six additional visits by members of theteam, together with extensive use of conferenceminutes, memoranda, correspondence, reports,numerous cables, and 10 transatlantic telephonecalls. Special mention should be made of the useof itinerant consultants who played an extremelyimportant role in solving problems in the fieldand in insuring comparability in the interviewingand coding.
At the outset 1 year was thought to be enoughfor preparation, field work, and analysis; in theend over 2 years were required. Even so, asuperhuman effort was made by some of themembers and field workers to meet the schedule.
General planning, sampling procedures, andpreparation of the questionnaires and Interview-ers’ and Coders’ Manuals required the betterpart of a year. Field work was conducted in May,June, and July of 1965. Punchcard layouts, dummytables, and the computer program were preparedin the spring and summer of 1965. Editing, cod-ing, key punching, and verification were com-pleted by September 1965 and the cards sent tothe Nat ional Center for Health Statistics. Finaltabulations were examined at a conference inApril 1966; from these, the tables in this reporthave been prepared.
STUDY AREAS
It was agreed by the committee that theStl(cly areas for the pilot project would be limited
to regions with populations in the range of 70,000to 90,000, although it was clearly recognized thatthere is an inherent disadvantage in any smallstudy area, especially when the health servicesavailable to a defined population constitute one ofthe variables under investigation.
Smederevo, Smederevo Com-mune, Serbia (Population,83,862 in 1961)
These communities were chosen becausethey: (1) were of the appropriate size, (2) con-stituted medical catchmentz areas that were fairlywell circumscribed geographically, (3) had bothrural and urban components with one town of25,000 or more, (4) contained or were close to amedical center, and (5) were within reasonabledistance (40 miles) of the investigators’ insti-tutions in each country.
Population estimates for the noninstitution-alized residents of the three sample areas by age,sex, and urban- rural classification are given intable 6.
Chester
The Medical Research Unit of the Universityof Manchester was already committed to an in-vestigation involving household surveys for theLiverpool Regional Hospitals Board and plannedto integrate the Liverpool study with the inter-national collaborative study. Chester City com-bined with Chester Rural District was the onlyarea within the Liverpool Hospitals Board regionmeeting the agreed specifications. Chester City,with a population of 59,268 in the 1961 decennialcensus, is situated in the Cheshire plain across
~A geographicterritory, the great majority of whose popu-
Irttion obtaine its medical services within that territory
5
the River Dee from Wales and is 18 miles fromLiverpool and 38 miles from Manchester whichare both medical centers. It is surrounded bygood dairy farming country for which it acts asa market center.
The Chester Rural District surrounds thecity for three-quarters of a mile of its perimeter,the remaining one-quarter being adjacent to Walesacross the Dee. The maximum dimension’s of therural district are 12 by 10 miles. The populationin 1961 was 28,300. It is made up of 51 parishesof which three have no inhabitants and only sixhave more than 1,000 inhabitants. The district isa local administrative one within the county ofCheshire and has its own complement of adminis-trative, health, and welfare people. The area isgood farming land; however, it is becoming in-creasingly suburbanized and its population isgrowing at a faster rate than that of the city;only 6 percent of the residential accommodationis rated as being occupied by agricultural work-ers.
The city and rural districts together arecomparatively wealthy, with average individualand household incomes well above the nationalaverage and above the average in other parts ofthe Liverpool Hospitals Board region.
Chittenden
Chittenden County, with a population of 74,425,of which 20,838 was rural according to the 1960census, occupies a central location on the easternshore of Lake Champlain in the long narrow valleywith the Adirondack Mountains to the west and theGreen Mountains to the east. It is an importanteducational, agricultural, and year-round recre-ational center. Burlington is the major city in thecounty and also its medical center. Burlington isthe largest port on the eastern shore of LakeChamplain, is connected by ferry with the NewYork side of the lake, and is the meeting pointof the main north-south route along the east sideof the lake and the route across the mountains tothe east. This strategic location has addedgreatly to its industrial and commercial pros-perity.
The obvious advantage of Chittenden Countyas a study area was its accessibility to the unitfrom the University of Vermont, which is in
Burlington. The mountainous terrain, sparse dis-tribution of population in some areas, and a highnumber of seasonal residents posed special sam-pling and interviewing problems.
Smederevo
The predominately urban commune of Sme-derevo (39,793 in the 1961 census) was combinedwith its rural subregions, Saraorci and MalaKrsna (44,069), to form the study area in Yugo-slavia. Smederevo is situated on the Danube, 30miles southeast of Belgrade, the nearest medicalcenter. It is a noted historical town of touristinterest, famed for its vineyards and orchards.In contrast to the other two study areas, therural population of the Smederevo area is largelyenga~ed in farming; living conditions are mi~:eprimitive and some of the remote villages areinaccessible by vehicle during heavy rains.
The disadvantage of chosing Smederevo wasthat a certain proportion of the population obtainsmedical care at a neighboring town j,-ist ouL.?i5ethe study area, so that it is probably less self-contained in this respect than the other studyareas. The advantages were that (1) it is notatypical of the country as a whole, (2) it containsa sufficient proportion of working population toprovide an insight into utilization of medical careby that category of insured people (a point ofspecial interest to the Belgrade unit), (3) theaccessibility and distribution of health personnelwithin the study area varies considerably, per-mitting internal comparisons of the influence ofthese factors on utilization, and (4) it was closeenough to Belgrade to simplify communicationsand staff problems and to keep down expenditures,
DEVELOPMENT OF QUESTIONNAIRES
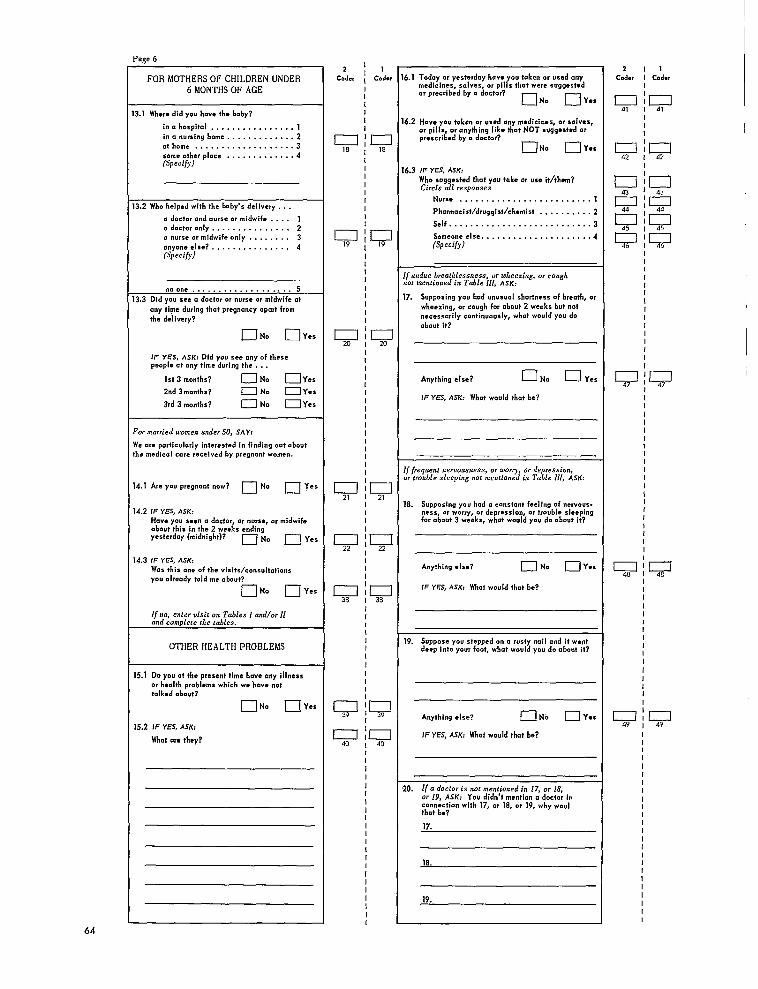
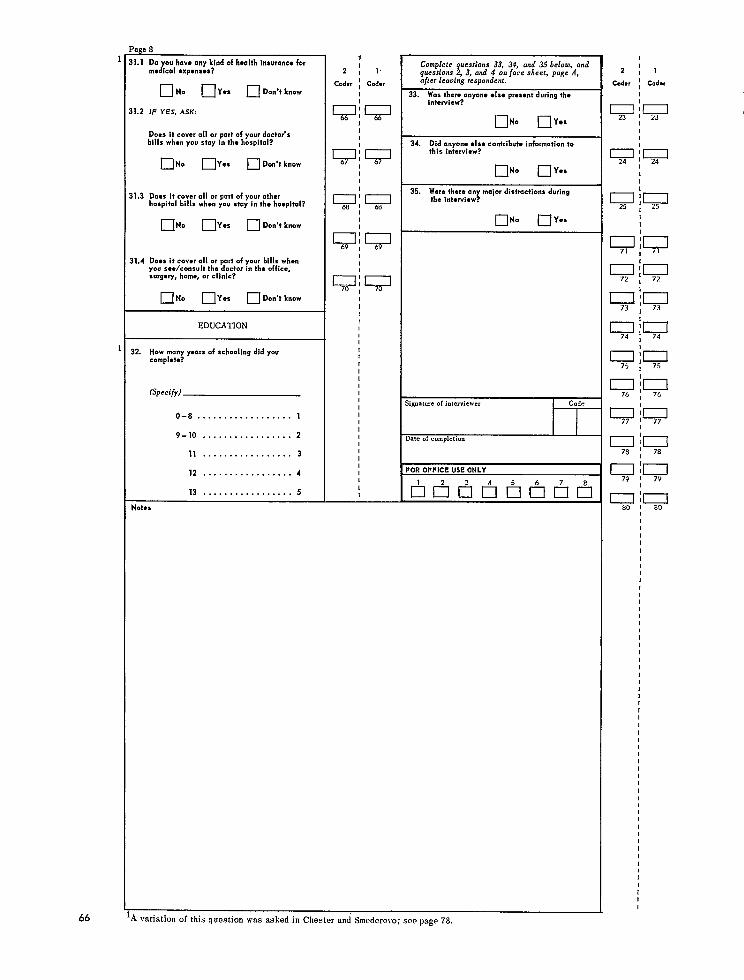
The interview questionnaires drew heavily onthe experience of the U.S. National Health Surveyand on other questionnaires developed by membersof the group. A separate but similar question-naire was constructed for children. The quest ion-naires were designed to permit two independentcoding operations on the form, except for thecoding of certain tabular material, for whichseparate code sheets were used.
6
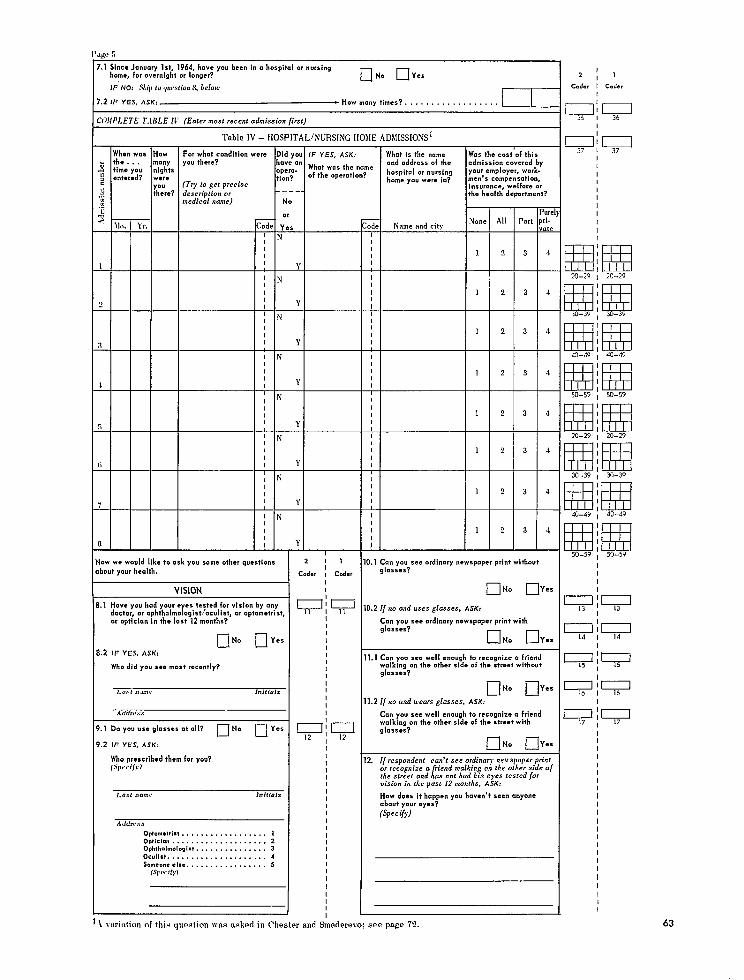
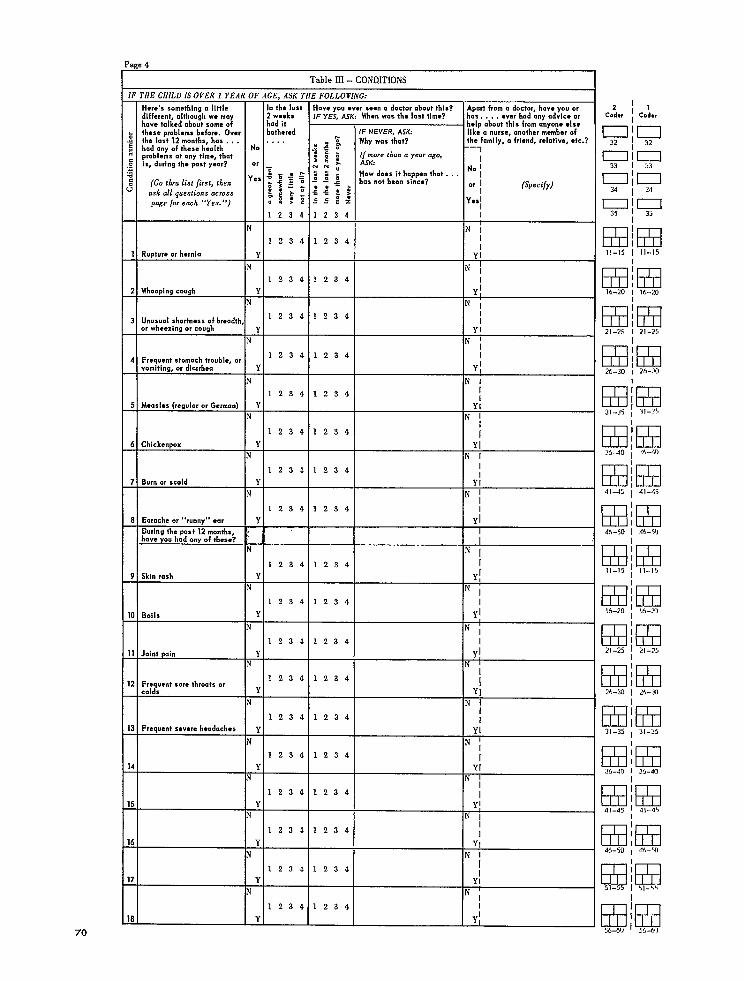
Four different approaches to the problem ofrelating utilization of medical care services tothe level of morbidity of the population wereincorporated in the questionnaires: measures ofreported general morbidity in the population;measures of more specific morbidity as reflectedby reported prevalence of certain “symptom-condition” complexes recently associated withIlgreat discomfort!l (table A); measures of rela-
t ively stable objective “indicators” of morbidity,such as reported selected visual impairments;and measures of “activity limitation” and “beddisability.”
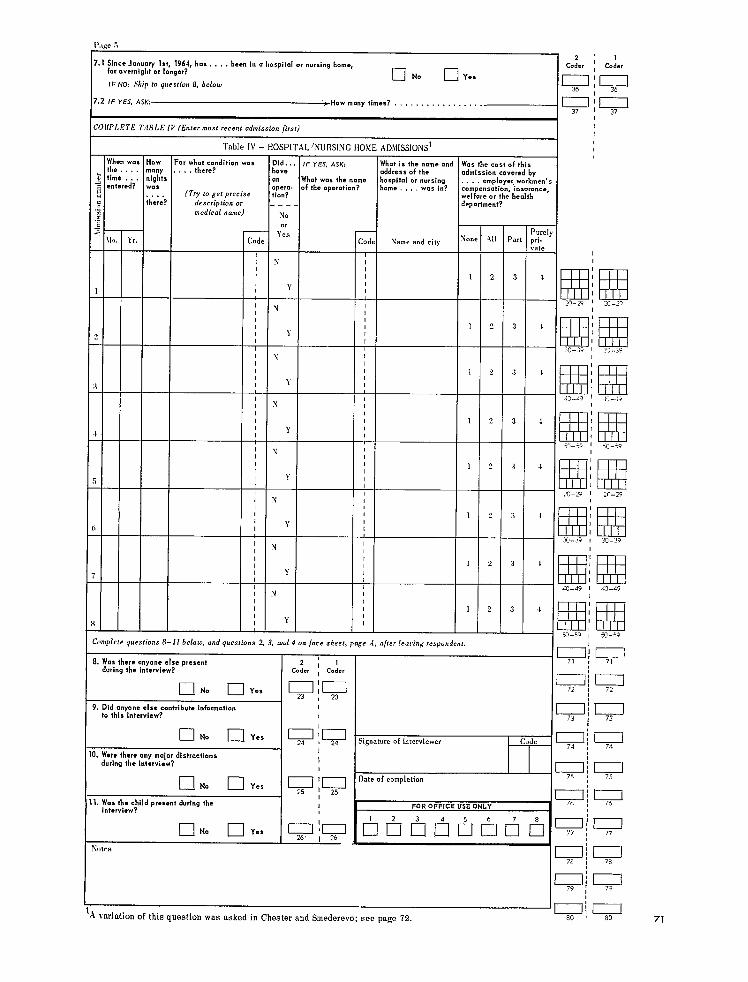
The utilization measures employed weredoctor consultations, nurse consultations, andhospital and nursing home admissions. All meas -u res were for a 2-week-recall period except thoseon general morbidity and eye examination, whichwere for a 12-month- recaU period, and hospital-ization, which was recorded for a recall periodof 16 to 18 months but tabulated for only a 12-month period. Related topics, such as the avail-ability of “personal” doctors, the patients’ atti-tudes and satisfaction with the care received, andthe use of drugs, were also investigated.
The desire to achieve comparable data fromrespondents of three different nationalities re -
quired unusually careful attention to the phrasingof questions and to the definition of terms. Thequestionnaires, together with the Interviewers’Manual and a Coderst Manual, were translatedinto Serbo-Croatian. Independenttranslations
back intoEnglishby two persons unfamiliarwith
the questionnaires,includingone unfamiliarwith
medical terminology,revealed almost complete
comparability.Two questions(Q.1.1and Q. 31.2)
had to be omitted from thefinalSerbo-Croatian
version, since the pretestingshowed that the
Yugoslav respondentsunderstood them ina dif-
ferentway than originallymeant. For thesame
reason, several categoriesof health workers
that do not exist in Yugoslavia were omitted aswell. The inadvertent omission of part of one“symptom-condition” complex probably resultedin the underreporting of one condition (diarrhea)in adults in Smederevo (table A).
Two pretests of the questionnaires in eachstudy area, with subsequent revisions, precededthe final field work.
The English version of the household folder,the adult questionnaire, and the child question-naire are reproduced in appendix I of the report.Appendix II presents technical notes on statisticalprocedures.
Table A. Selected “symptom-condition” complexes for adults and childrent
Adults Children
1.2.3.
4.
5.
6.
7.
11.12.
Rupture or herniaVaricose veinsUnusual shortness of breath, wheez-ing, or cough
Frequent stomach trouble, vomit ing,or diarrhea
Repeated attacks of backache, back-strain, lumbago, or sciatica
Repeated attacks of rheumatism, arth-ritis, or other joint pain
Frequent nervousness, worry, depres-sion, or trouble sl~eping
Skin rashBoilsHemorrhoids or rectal bleedingFrequent sore throats or coldsFrequent severe headaches
Rupture or herniai: Whooping cough3. Unusual shortness of breath, wheez-
ing, or cough4. Frequent stomach trouble, vomiting,
or diarrhea5. Measles (regular or German)6. Chickenpox
Burn or scald:: Skin rash
Boils1:: Joint pain11. Frequent sore throats or colds12. Frequent severe headaches
~See conditions listed in adult and child questionnaires, appendix I, pages 62 and70, table III.
7
FIELD WORK
SAMPLING DESIGN
Special requirements and local conditions,including the availability of census and othersampling information, “dictated the choice ofdifferent sampling designs and sampling fractionsin each of the three study areas. The one overallrequirement w“as that the samples be true prob-ability samples of approximately the same num-ber of households. In Chester, a random samplebased on the real estate tax rolls was used andthe sampling fraction was 1/92; in Smederevo,a two-stage stratified sample was drawn fromelectoral rolls and a special urban householdcensus and the sampling fractions were 1/66 forthe urban population and 1/83 for the rura~ andin Chittenden, area sampling was employed witha sampling fraction of 1/66. Residents of insti-tutions, including general hospitals, were excludedfrom the sample.
Population estimates and sampling charac-teristics are summarized in table B.
Chester
It was agreed internationally that the samplechosen would be a household sample and not asample of individuals. The best and simplestform from which such sampling may be done inthe United Kingdom is from the rating lists ofeach administrative district. A sample drawnfrom the rating lists contains not only houses,flats, and other places where people live, butalso other ratable units such as warehouses,workshops, and garages. The proportions of each
are published annually and it is possible by takinga large enough sample of ratable units to achievethe number of households required.
The international agreement at the time thesampling was drawn in Chester (in February1965) was that 200 households would be sampledin the urban area and 100 in the rural area. Ac-cording to the latest proportions published (April1964), 85.2 percent of the ratable units weredomestic units in Chester City and 89.2 percentin Chester Rural District. This meant that 234ratable units would need to be drawn to produce200 dwelling units in the city, and 111 ratableunits in the rural district to produce 100 dwellingunits. Further allowance was made in the cityfor an estimated 800 demolished ratable unitsstill on the lists by adding nine to the sample. Inthe rural district there were practically no de-molished houses on the lists, but between 200and 300 additional houses had been added sincethe 1964 count; accordingly the number of ratableunits to be sampled in the rural district was notchanged.
A systematic sample was drawn from each ofthe rating lists; the sampling ratio in the citywas every 95th unit; and the sampling ratio inthe rural district was every 90th unit. Randomnumbers were used to start the sampling in eachcase (25 and 17, respectively). At the conclusionof drawing, the sample had 243 ratable units inthe city and 107 in the rural district, The de-scription of the units showed that of these, 212in the city and 95 in the rural district should bedwelling units.
The interviewers found that 12 units in thecity and one in the rural district had been de-molished or were vacant awaiting demolition.
Table B. Noninstitutional population estimates and sample characteristics for thestxdy areas
Samplingfraction Percent-
Area Estimated Sample agepopulation size inter-
Urban Rural viewed
Chester, U. K------------------------------ 81,790 1:92 1:92 890 87Shnederevo, Bug---------------------------- 90,370 1:66 1:83 1,198 98Chittenden, U. S. A------------------------- 73,800 1:66 1:66 1,118 97
8
IThis left 200 dwelling units in the city and 94 inthe rural district at which interviews could behoped for; the total in the sample was therefore294, In addition, however, four units were vacantthroughout the time of the survey, three in thecity and one in the rural district, so that thesample denominator used in assessment of re-sults was 290 household units (table C).
Validation of the sample with the electorallists compiled in October 1964 showed that 86percent of the adults 21 years or over in thesample were on the lists at the same address.
The sampling frame used is readily acces-sible and is often chosen by the British SocialSurvey (the major household interviewing organi-zation in Britain), so that its defects have beenstudied. Each ratable unit has an equal chance ofbeing included in the sample, and there are nodifficulties introduced by different sizes of house-holds, as there would be if either of the otheravailable list sampling frames (Electoral Listsand Executive Council Lists) had been chosen.
The disadvantages are as follows. (1) It isnot a household sample but a sample of ratabletmits which may contain several households. TheSocial Survey has developed a method to dealwith this problem which was also used in thissurvey. The basic rules are that whenever aratable unit contains two households, both areinterviewed. Then the interviewer drops from thesample the next one or two ratable units on theassignment sheet that have not already beencontacted in any way (one unit when there aretwo households, and two when there are three ormore). In this survey five units were dropped forthis reason. (2) Because the ratable units includenon-domestic housing units, arrangement for get-ting the exact number of households needed is notpossible. At one point it appeared that the samplewould be too large; but when more demolishedhouses were found than expected it became clearthat in the end the sample would be tbo small.(3) The sampling method left some responsibilityin the hands of the interviewers to discover allthe people living at the ratable units; they wereinst rutted to ask at the end of the enumeration,“Now, is that everyone who lives in this (house),(bungalow with garage), (first floor flat), (etc.)?”and presumably they did so. Nevertheless this isa possible source of error, which could not bechecked.
Table C. Sampling procedure: Chester,U. K.
Item
All ratable units ------Domestic units ---------Percent domes tic -------Number needed to get
desired number of do-mestic units ----------
Correction for demol-ished units -----------
Sampling fraction ofunits -----------------
Actual number drawn----Domestic uni.ts ---------Occupiable -------------Esthnated total number
of domestic units -----Final sampling
fraction --------------
Urban
22,84319,454
85.2
234
9
1/95243212200
118,353
1/92
Rural
9,8198,759
89.2
111
1/90107
9594
28,667
1/92
1% ~ 19,454=18,3530
294~ X 8,759=8,667.
Chittenden
The Vermont unit used the area samplingmethod, along the general lines described byMonroe and Finkner. 3 The area was divided intotwo zones, town and open country. The two zoneswere subdivided geographically into equal- sized,contiguous strata. A sampling ratio of 1/66 wasapplied to both zones. The allocation of samplingunits is shown in table D.
Assignment of the town zone sampling unitsrequired the use of aerial photography, the citydirectory, and cruise counts. Of the 20 samplesegments in the open country zone, 10 requireda count unit prelisting before they could beidentified, seven could be identified from Chit-tenden County road maps, and three from aerialphotographs.
Seasonal residents were excluded throughthe use of standard U.S. Bureau of the Censusquestions at the beginning of each interview. Theother exclusions were ‘those usually living ingroup quarters (students, nursing home andcertain hospital inmates, etc.) and active mem-bers of the Armed Forces.
3Monroe, J. and Finkner, A. L.: Handbook of Area Sampling.
New York. Chilton Company-Book Division, 1959.
9
Table D. Allocation of sampling units: Chittenden, U.S.A.
Item Total TownI II
Population (l96O)-------------------------------------------Occupied dwelling units (1960)------------------------------Strata ------------------------------------------------------Sample units:
Per strata ------------------------------------------------Per zone-------------------------"-------------------------
Sample unit size --------------------------------------------
The chief problems encountered were : (1)more cruising was necessary than expecte~ (2)segment or “cluster” sampling involved an occa-sional interviewing problem in that after the firstinterview in a segment, neighbors and otherfamily members anticipated the interviewer’scoming and some interview content; and (3)interpretation of some sketch maps proved diffi-cult for inexperienced interviewers.
Smederevo
The Yugoslav group used a two-stage strati-fied sample of a relatively homogeneous popula-tion consisting of 150 urban households and150rural ones. As a basis for sampling they usedthe voting lists of the relevant area. They wereconsidered the most accurate sources of data,for the elections in the whole of Yugoslavia hadbeen held as recently as April 1965.
In the rural subregion of Smederevo, therewere no difficulties at all in finding the samplehouseholds by following the dwellings given onthevoting lists. This was done by three statisticiansand took about 1 week. Using the voting lists andconsulting the heads of the so-called localoffices(territorial administrative offices), they lookedfor the sample households ineach of the villagesin the study area. It is possible tosay, therefore,that the households from the rural subregionwere found quickly and the coverage was almost100 percent.
In the urban region, however, the team wasfaced with a number of unexpected difficulties.The voting lists were not as accurate asintherural area, and addresses of the sampled house-
74,425 55,07519,724 15,677
50 40
1326,606 5>280
Country
18,3504,047
10
1321,320
2
3.06;;
holds were often incorrect. Having no otherchoice, they decided to engage five statisticiansinstead of three and to have them and the headsof the local offices in each town quarter checkthe dwellings of the sampled households. Thechecking took about 15 days. It amounted in theend to almost a complete census of the urbanpopulation in Smederevo and demonstrated thatthe technique used in finding the sample house-holds on the basis of the voting lists is not verypracticable so that other methods of samplingshould probably be used in future studies.
INTERVIEWING
To increase comparability, women 30t050years of age withat least a high school educationand no medical or nursing experience were re-cruited as interviewers, and one of the principalinvestigators visited all three areas to observeand assist in the interviewer training. Some 10or 11 interviewers and two supervisors wereenlisted in each area. About 10 days were de-voted to instruction and practice interviewing,following, in general, the methods of the Univer-sity of Michigan Survey Research Center. Train-ing continued in varying degrees in each areaduring the course of the field work with periodicmeetings of the interviewers and supervisors todiscuss problems encountered in the field andthe errors found by the supervisors in editingthe completed questionnaires. In Yugoslavia, thewhole team spent 2 hours together every daydiscussing and evaluating the previous day’swork. The occurrence of the same questions, thesame problems, and even the same jokes in all
10
three areas makes it likely that a fair degree ofcomparability was achieved through training.
The assignments of the interviewers wererandomized to cover both urban and rural house-holds in Chittenden and Smederevo, but this wasnot practicable, although admittedly desirable,in Chester because not all interviewers had carsat their disposal and the cost of interviewingwould have placed a great strain on the limitedbudget.
Field work was conducted simultaneously inMay, June, and July of 1965. All persons 18years and over and all married persons under18 were interviewed individually. Two-thirds ofall respondents were interviewed privately. Aseparate but similar questionnaire was used forchildren, with the mother or another related,responsible adult acting as the respondent. Exceptfor children and a few persons with languagebarriers, proxy interviews were not accepted;this led to some underreporting for a smallnumber of senile, terminally ill, or mentallyincompetent persons.
Three “call-backs” for incomplete inter-views were made where necessary, and in Ver-mont and Yugoslavia available resources per-mitted additional “call-backs” in a large numberof cases. This effort explains in part the higherresponse rates in those two areas—98 percentin Yugoslavia and 97 percent in Vermont, com-pared with 87 percent in England.
As would be expected, the interviewing ofthe agricultural population in Smederevo requiredthe greatest expenditure of effort. It was oftennecessary to make repeated calls to reach theadult population before 6 a.m. or late at night,Since the working hours of the interviewers hadto be adapted to the free time of the respondents,they were of necessity extremely long, whichtends to increase the percentage of omissionsand errors in the interviews.
In an effort to maintain a high level ofquality in the field work, informal checks of theinterviewers’ work were made by the super-visors in all three areas, and in two areas,Chittenden and Smederevo, about 10 percent ofthe respondents in the samples were reinter-viewed.
Ninety-three percent of the reported hospitaladmissions in Chester and Chittenden werechecked in the local hospitals and no unreported
hospital admissions were found. Validation ofphysicians’ consultations was attempted, but phy-sicians’ medical record systems were not suf-ficiently adequate in any of the three areas topermit this study.
It was observed that in all three areas therewere, on the average, about 25 percent fewerdoctor consultations, persons consulting doctors,and “activity limitation” and “bed disabilit y“days reported for the “week before last” thanfor “last week. ” “Procedures” performed, suchas injections and X-rays, did not show as markedor consistent discrepancies between the 2 weeks.
EDITING, CODING, AND KEY PUNCHING
Comparability in the coding was increasedby having one member of the team assist in thetraining of coders in the three areas. Duplicatecoding by independent coders was done on allquestionnaires; discrepancies, usually reconciledby a supervisor, were less than 2 percent of allcoded items.
Medical coding was handled by physicians ormedical coders; it presented many problems thatwere never successfully overcome.
Between-county studies of the reliability ofmedical and nonmedical coding were attempted,but the problems of observer variations proveddifficult to resolve by mail. Occupational codingpresented the greatest problem as far as com-parability between the data from the three studyareas was concerned. One reason was the use ofseveral different classifications: the Hollingsheadscale in Chittenden and Chester, supplementedby the English Registrar General’s Classificationof Occupations in the case of Chester; and theYugoslav Short List of Occupations in Smederevo.Future plans call for the uniform use of a newtwo-digit International Labor Organization code.
The key punching of every card was verified;error rates for this operation were kept at lessthan 1 percent.
The completed cards were sent to the Na-tional Center for Health Statistics where theywere put on magnetic tape. Errors and incon-sistencies in the tapes were detected by thecomputer in Washington and corrected from in-formation obtained by airmail and cable.
11
SURVEY RESULTS
Since one of the objectives of the study wasto relate medical care utilization to the resourcesavailable, it was important to estimate the ratiosof practicing doctors, active nurses, and hospitaland nursing home beds available to the definedpopulations. These figures take into account theuse of doctors, nurses, and hospital beds withinthe areas by both residents and nonresidents ofthe areas, as well as the use of such servicesoutside the areas by residents of the areas. Thepopulation ratios in each area are shown in tableE, It is apparent that the population to doctor
ratio in Chittenden is roughly half that in theother two areas, i.e., 1:470 in contrast to 1:950in Chester and 1:1,170 in Smederevo. There arefar fewer nurses available to the population inSmederevo than in the other two areas, i.e.,1:1,030 in contrast to 1:140 in each of the othertwo areas. The same relationship holds for hospi-tal beds, i.e.,’ 1:150 in Smederevo, comparedwith 1:80 in”Chester and 1:90 in Chittenden.
Measurement of overall morbidity in generalpopulations is not easy, whether it be done byhousehold surveys, physical examinations,screening tests, or doctors’ records. Severalindirect measures that are internally consistentmay be as valid as one or two direct measuresthat are subject to wide observer variation. Un-certainties about “condition” frequencies in popu-lations and difficulties in coding lay responses
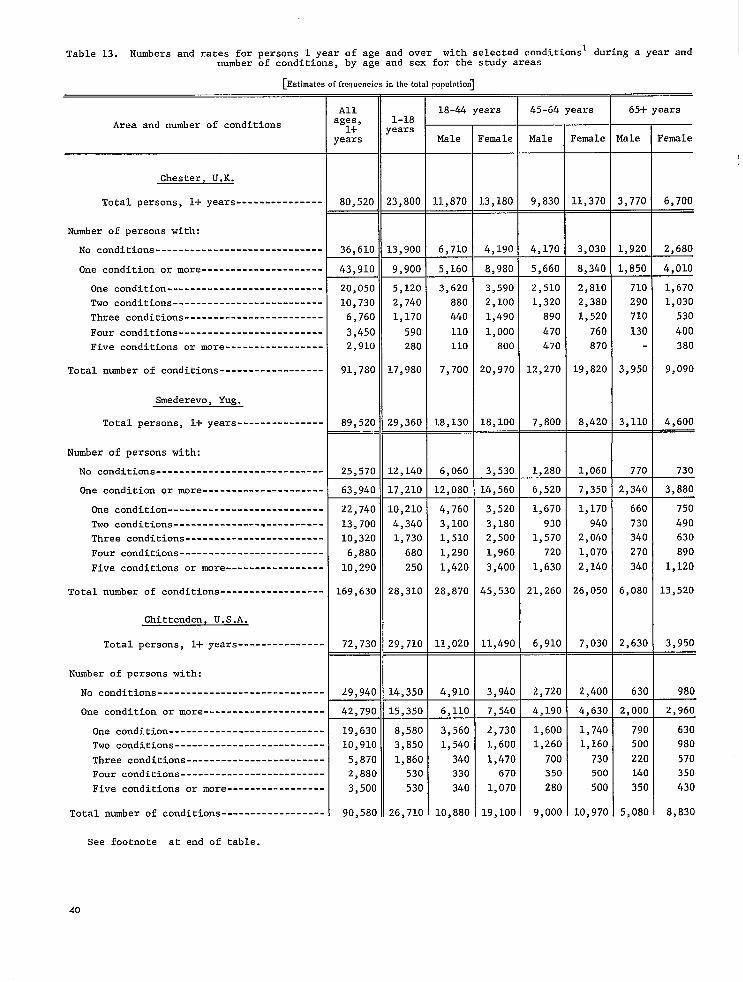
to questions about morbidity provide furthercomplications. The questions asked in the pres-ent study about the presence or absence of 12relatively common acute and chronic “symptom-condition” complexes for which, in all threeareas, medical care is believed to be beneficial(table A) was an attempt to overcome some ofthese difficulties. Table F shows the standard-ized annual rates per 1,000 population for personsreporting that they did not recall having had any ofthe 12 conditions in the previous 12 months, thosewho reported having had only one of the 12 condi-tions, those who reported having had one or moreconditions, and the total number of conditions re-ported from the selected list of 12. The rates forpersons with only one condition are about the samein the three areas. The rates for persons with“one or more conditions” and the rates for “allconditions” are substantially higher in Smederevo(730 per 1,000 persons over 1 year old and 2,030conditions per 1,000 persons over 1year old) thanin Chester (540 persons per 1,000 persons over 1year old and 1,130 conditions per 1,000 personsover 1 year old) and Chittenden (610 persons per1,000 persons over 1 year old and 1,330 conditionsper 1,000 persons over 1 year old). The reverseis true for persons reporting that they had hadnone of the 12 conditions in the previous 12months.
Rates for seven conditions in adults and forfive conditions in children were higher in Sme-derevo than in the other two areas (table 15). Of
Table E. Medical-care resources available for the study areas
I Population ratios
Chester, U.K----------------------------------------- 1:950 1:140 1:80Smederevo, Yug--------------------------------------- 1:1,170 1:;,; (): 1:150Chittenden, U. S. A------------------------------------ 1:470 : 1:90
lIncludes osteopaths in Chittenden; similar professions not found in other two areas.21ncludes public health nurses, visiting nurses, district nurses, office and clinic
nurses, health visitors and midwives.
31ncludes beds in psychiatric, tuberculosis and chronic-disease hospitals, and in con-valescent, maternity, and nursing homes.
12
Table F. Persons 1 year of age and over reporting specific conditional and specificconditions reported per year for the study areas
the 12 conditions, lower rates were observedonly for varicose veins and hemorrhoids inadults
and for skin rashes in children. The observeddifferences could, in part, be attributed to dif-
ferences in perception or reporting, but theyare also compatible with basic differences ingeneral morbidity. If overreporting was the mainfactor contributing to the higher rates reportedin Smederevo, it might be expected to$e char-acteristic of most conditions for both adults and
children. In fact, for those conditions reportedfor both adults and children,thepatterns differed;for example, cough in relation to breathlessness,
headaches, skin rashes, and boils.Table15 showsthat the rank order correlations between pairsof
study areas were, for the most part, high, andthe coefficients of concordance forallthreeareas
were O.94for adults and 0.84 for children.
460 *18270 *14390 *17
Standard-ized
rate per1,000
persons2
540 *18730 *14610 *17
Persons with only1 condition
Standard-Sample ized
fre- rate perquency 1,000
persons2
189 250516295 240 * 13290 260 *13
All conditions
Standard-Sample ized
fre- rate perquency 1,000
persons2
E_l_x!E
When the measures ofmorbidity are furtherrefined by inquiry about the presence of the 12
“symptom-condition” complexes in adults duringthe previous 2-week period, the relationship
between Smederevo and the other two areas ismaintained. The same is true when the measure
is restricted to those conditions causing “greatdiscomfort” in the previous 2-week period; therewere410 conditions per1,000adults inSmederevo
compared with 240 per l,OOOin Chester and330
per l,OOOin Chittenden (table G).In summary, the rates for persons reporting
only one of 12 “conditions” present are similar;
all other measures of morbidity employed, i.e.,
persons affected, number of conditions, discom-fort, and prevalence of specific conditions, indi-cate substantially higher levels ofreportedmor-
bidity in Smederevo. The possibilityof cultural
13
Table G. Specific conditional and specific conditions associated with “great discom-fort” in adults 18 years of age and over during a 2-week period for the study areas
Table H, Days of activity limitation and bed disability and persons with activitylimitation and bed disability during a 2-week period for the study areas
differences in perception and reporting cannot beexcluded. Whether this population does or does not
have higher levels of true morbidity is perhapsless important from the viewpoint of organizingmedical care than the observation that those ques-tioned tkink that they have a substantial amount
of morbidity.A critical criterion for assessing the effec-
tiveness of medical care is its capacity to improvefunction or at least diminish objective disability.Table H gives the rates for a 2-week period for
days of “activity limitation” (i.e., inability to
carry on normal daily activities because of ill-ness), and for persons with “bed disability. ”
The differences are in the same direction forboth forms of disability; they parallel the dif-ferences observed for “all conditions” and for
those associated with “great discomfort” but aresubstantially larger (table G). It is of interest
that higher rates for Smederevo are observedboth for days of activity limitation and bed disa-
bility and for persons affected in each category.These differences are in contrast to the relative
similarity between the other two areas for allthese rates. The mean length of “activity limita-
tion” in Smederevo is 5.9 days compared with4.2 in Chester and 4.7 in Chittenden. Similarly
the mean length of “bed disability” in Smederevois 5.5 days compared with 1.9 in Chester and 3.1in Chittenden. The higher levels in Smederevodo not appear to be a function of “malingering”
by workers since the same patterns are observedfor children who receive no sickness insurance
benefits.
Table J. Visua 1 imps irments, eye examinations, and use of eyeglasses by adults 18years of age and over for the study areas
Area
Chester, U. K-----------------------------------Smederevo, Bug---------------------------------Chittenden, U. S. A------------------------------
Area
Chester, U. K-----------------------------------Smederevo, Bug---------------------------------Chittenden, U. S. A------------------------------
Unable to “readnewspapers”l
withouteyeglasses
Samplefre-
quency
171203217
Standard-ized
rate per1,000
adults2
350 *17330 *15380 *15
Eye examinationsduring previous
year
Samplefre-
quency
1:;168
Standard-ized
rate per1,000
adults2
170 * 17120 *11270 *18
Unable to“recognize
frienda” withouteyeglasses
+
Standard-Sample ized
fre- rate perquency 1,000
adulta2
110 * 14% 100 * 1297 160 A 15
Use of eyeglassessome or all of
time
T
Standard-Sample ized
fre- rate perquency 1,000
adults2
_mEI“Read” understood and interpreted to mean “see ordinary newspaper print.”
2* standard errors of ratea.
15
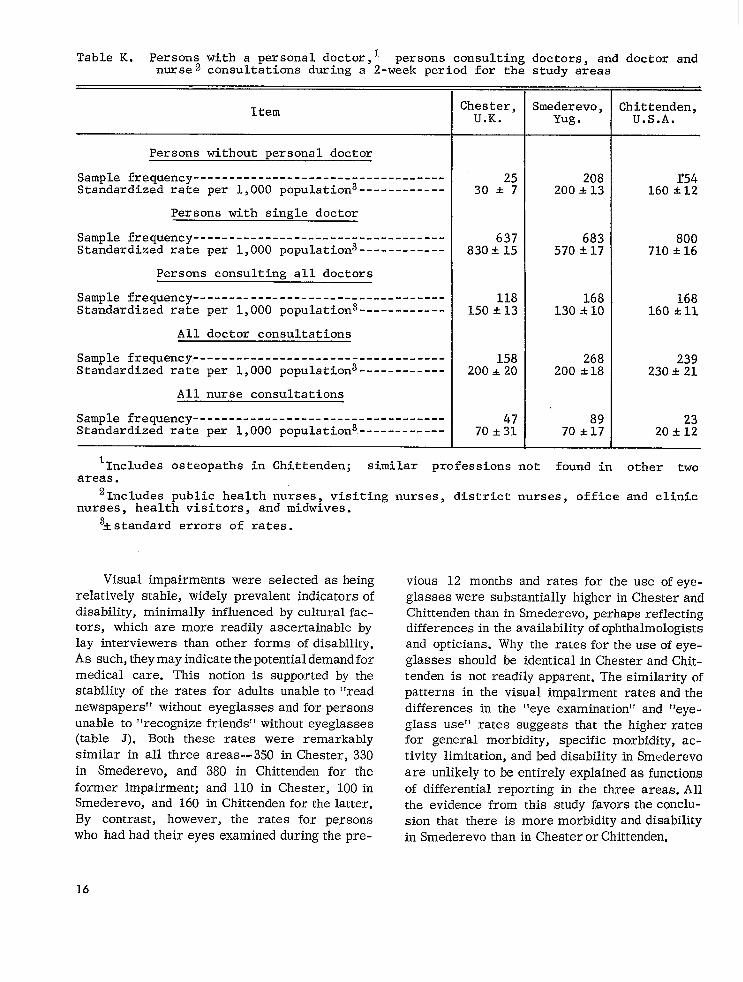
Table K. Persons wi.t’n a personal doctor,l persons consulting doctors, and doctor andnurse2 consultations during a 2-week period for the study areas
Item
Persons without personal doctor
Sample frequency -----------------------------------Standardized rate per 1,000 population3------------
Persons with single doctor
Sample frequency -----------------------------------Standardized rate per 1,000 populations ------------
Persons consulting all doctors
Sample frequency -----------------------------------Standardized rate per 1,000 populations ------------
All doctor consultations
Sample frequency -----------------------------------Standardized rate per 1,000 population3------------
All nurse consultations
Sample frequency -----------------------------------Standardized rate per 1,000 population3------------
Chester,U.K.
253od=7
637830* 15
118150*13
158200* 20
4770*31
Smederevo,Yug .
208200=!=13
683570*17
168130*10
268200 *18
70 i H
Chittenden,U.S.A.
154160*12
800710*16
168160 +11
239230* 21
2320* 12
1Includes osteopaths in Chittenden; similar professions not found in other twoareas.
21ncludes ~ublj_c health nurses, visiting nurses, district nurses, office and clinic
nurses, health visitors, and midwives.
3&standard errors of rates.
Visual impairments were selected asheing
relatively stable, widely prevalent indicators ofdisability, minimally influenced byculturalfac-tors, which are more readily ascertainable bylay interviewers than other forms of disability.Assuch,theymay indicatethepotential demandfor
medical care. This notion is supported by thestability of the rates for adults unableto “read
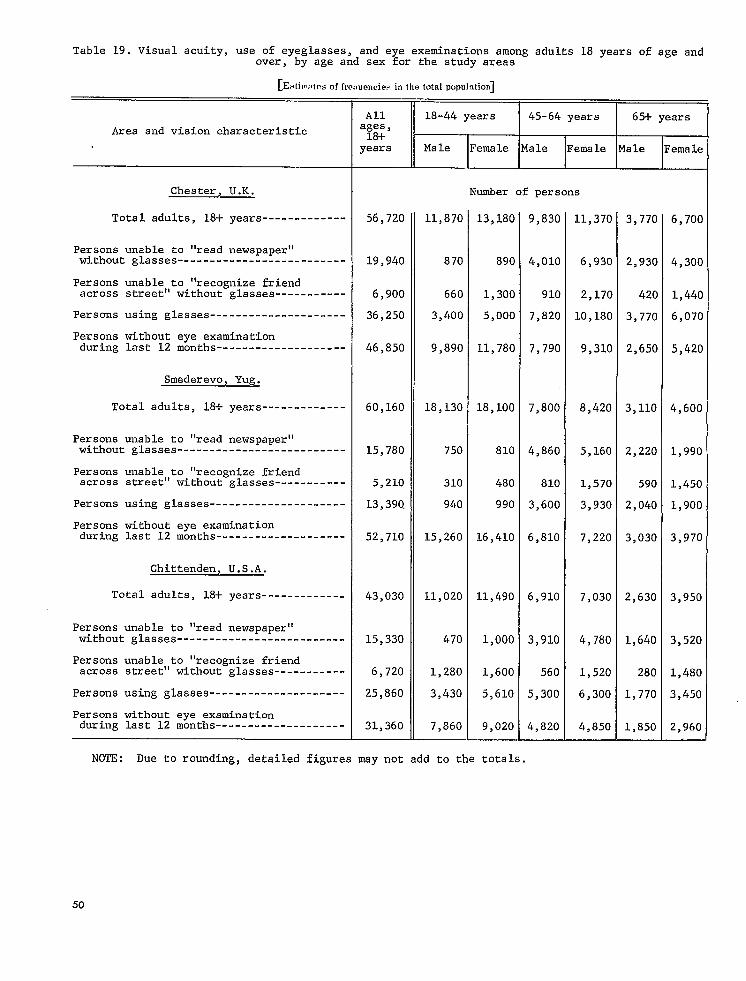
newspapers” without eyeglasses and for personsunable to “recognize friends” without eyeglasses(table J). Both these rates were remarkably
similar in all three areas--35O in Chester, 330
in Smederevo, and 380 in Chittenden for the
former impairment; and 110 in Chester, lOOinSmederevo, and 160 in Chittenden for the latter.
By contrast, however, the rates for personswho had had their eyes examined during thepre-
vious 12 months and rates for the use of eye-
glasses were substantially higher in Chester andChittenden than in Smederevo, perhaps reflectingdifferences in the availability y of ophthalmologistsand opticians. Why the rates for the use of eye-
glasses should be identical in Chester and Chit-tenden is not readily apparent. The similarity ofpatterns in the visual impairment rates and the
differences in the “eye examination” and “eye-glass use” rates suggests that the higher ratesfor general morbidity, specific morbidity, ac-
tivity limitation, and bed disability in Smederevo
are unlikely to be entirely explained as functions
of differential reporting in the three areas. All
the evidence from this study favors theconclu-sion that there is more morbidity and disability
in Smederevo than in ChesterorChittenden.
16
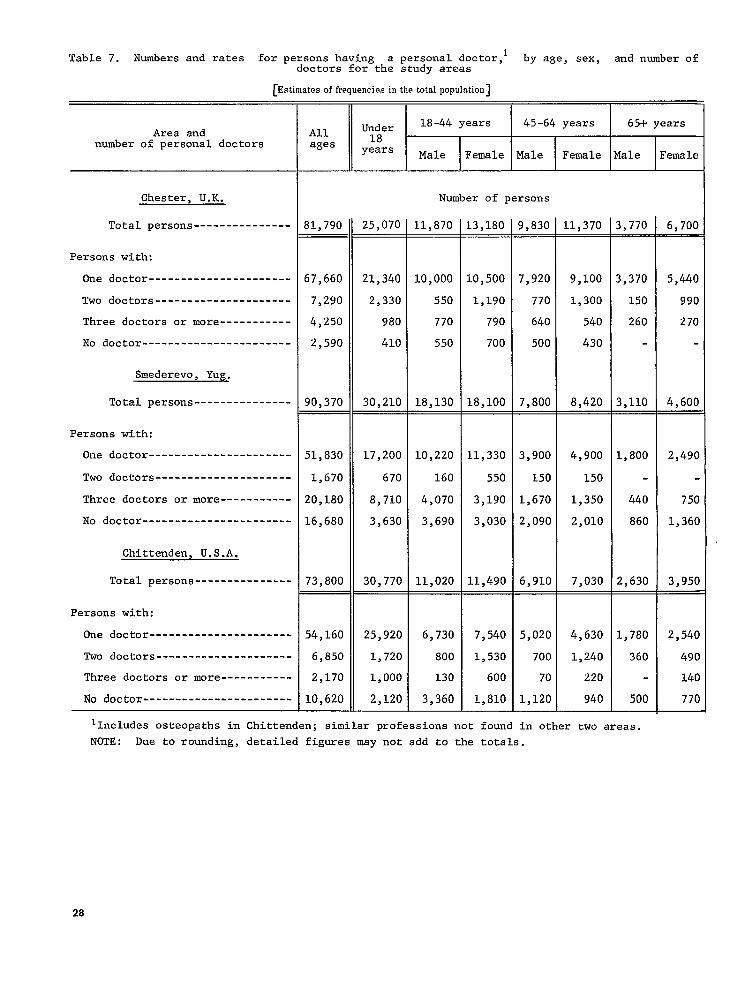
Table K shows therates for persons havinga single “personal doctor” and for doctor con-sultations. As might be expected, in Chester,
where the British National Health Service makes
a general practitioner available for everyone,the rate (830 per 1,000 population) was substan-tially higher for persons who reported that they
have a personal doctor than it was in the othertwo areas. Smederevo may have had a lower rate(570 per 1,000 population) because many patientsattend health units and health centers, each
staffed by several physicians, any one of whom
a patient may see on successive visits. TheChittenden rate (710 per 1,000 population) wasintermediate. Rates in the three areas for the
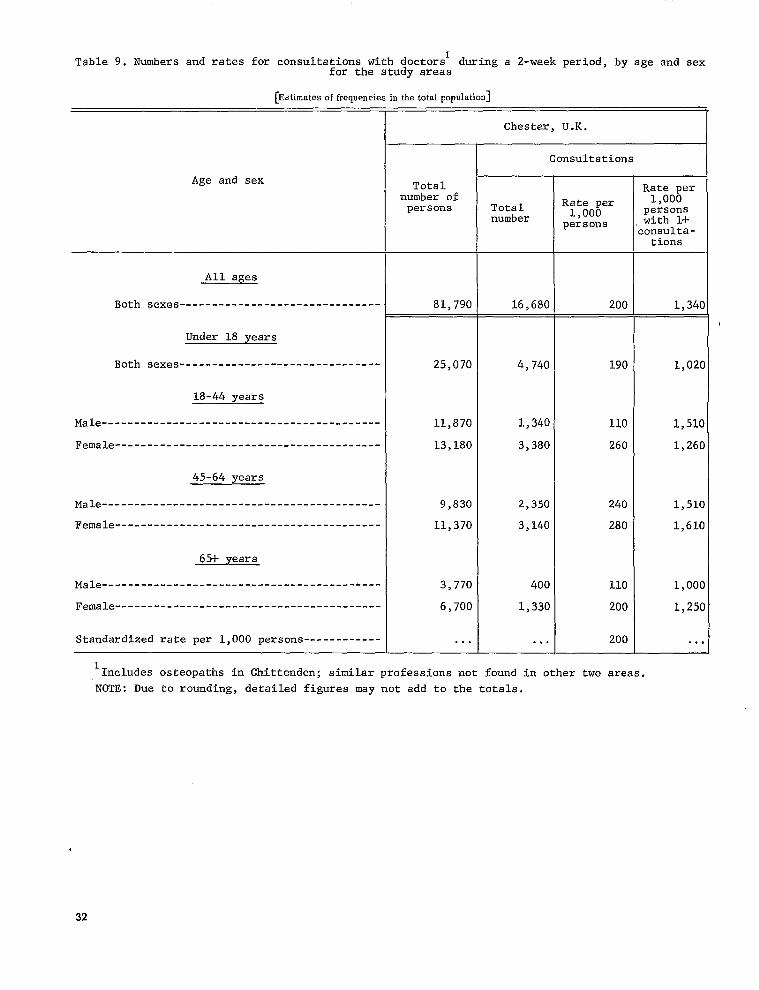
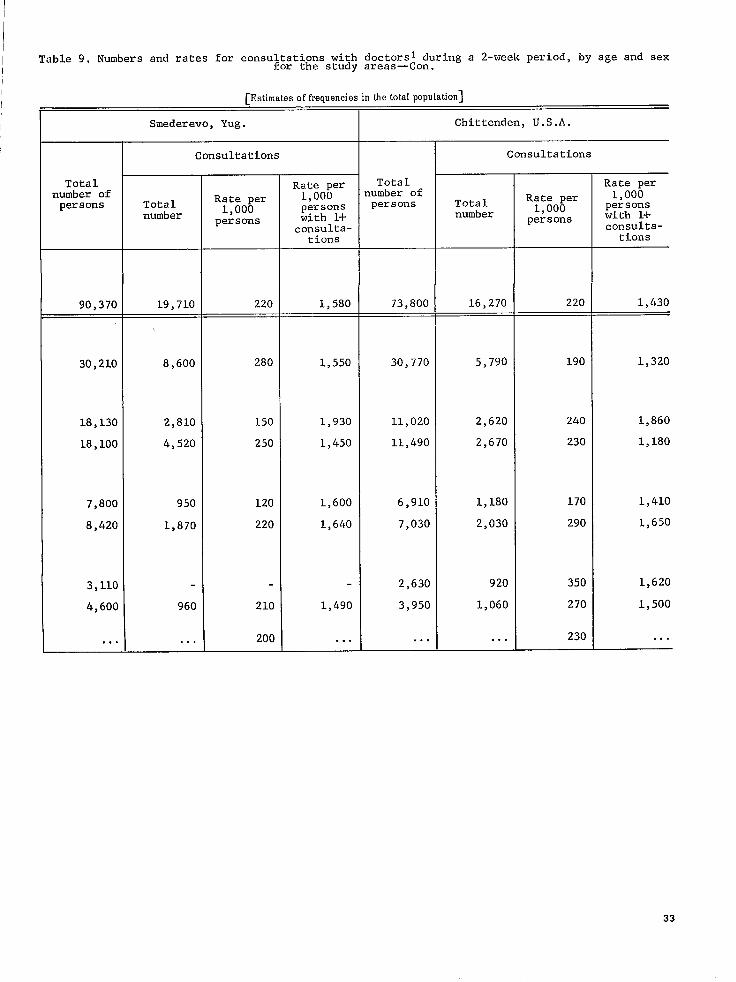
number of persons consulting doctors during a2-week period and the rates for all doctor con-sultations during a 2-week period are virtuallyidentical, Rates for all nurse consultations weremarkedly less in Chittenden. None of the consul-tation rates appeared to be positively correlatedwith the ratio of physicians or nurses available
to the populations of the three areas.
Table L gives selected characteristics of thepersonal doctors designated by the respondents.Most patients in all three areas were within 30
minutes’ travel time of their doctor, and mostfound him relatively “unhurried” and preparedto “listen” and “explain.”
Data shown in table M reflect the propensity
of the population to consult doctors in relationto reported levels of morbidity. Again, the pro-portion of all conditions for which no doctor wasconsulted during the previous 12 months was
similar—a range of 22-34 percent. The tendencyfor adults having one or more conditions not toconsult a doctor appeared greater in Smederevo(69 percent) and Chittenden (66 percent) than inChester (41 percent). The proportion of selectedconditions in adults that caused “great discom-fort” during the 2-week period but for which nodoctor was consulted was almost identical inthe three areas. In each of the three areas aboutfour out of five of those individuals who reportedthat they had experienced “great discomfort” in
the past 2 weeks from one or more of the listed
Table L. Selected characteristics of doctor reported bv adults 18 vears of age andover having a personal doctor $or the ~tudy areas “
Item
Adults with simzle Dersonal doctor
Number -------- ----------- --------- -----------------Percentage -----------------------------------------
Doctor’ s office within 30 minutes travel time
Number ---------------------------------------------Percentage -----------------------------------------
Doctor “unhurried” most of time
Number ---------------------------------------------Percentage -----------------------------------------
Doctor “listens” most of time
Number ---------------------------------------------Percentage -----------------------------------------
Doctor “explains” most of time
Number ---------------------------------------------Percentage -----------------------------------------
2hester,U.K.
493100
3;:
34683
37389
32278
Smederevo,Mlg .
613100
52085
51584
53287
49581
Chittenden,U.S.A.
502100
46393
46893
48396
46693
17
Table M. Proportion of specificwith specific conditions for
Table N. Doctor consultationsfor persons 1 year of age and over without any condi-tions and with one or more conditions during a 2-week period for the study areas
The extentto which patientsconsulteddoc-tors for curativeservicesin contrastto pre-ventiveservicesis indicatedin tableN. Vir-tuallyidenticalratesfor “personswithoutanyconditionsconsultingdoctors”were found inChesterand Chittenden(50per 1,000persons).The rate for Smederevo was somewhat less
presenceof a financialbarrier to theuse ot
medical care, sometimes associatedwith thefee-for-servicesystem,was not an importantdeterrent.Doctors were consultedfor check-ups and possiblepreventiveservicesas fre-quentlyin Chittendenas in Chester.The doctorconsultationratesfor persons withconditionswere virtuallyidenticalinallthreeareas.
18
Table O shows the use of drugs (medicine,salves, or pills) by adults in the three areas.About twice as many adults had taken prescribed
medicine in the previous 48 hours in Chester
(31S percent) and Chittenden (48 percent) as inSm~&’revo (19 percent). The same relationshipheld for the proportion of persons who had taken
m~$clicines not prescribed by a doctor. In spite ofapparently higher morbidity and disability rates,the use of drugs and self-medication was at lowerlevels in Smederevo than in Chester and Chitten-
dtm.
Table P shows the standardized annual rates
per 1,000 population for the use of all hospitals,
including psychiatric hospitals, in the three areas;the rates are similar to the national rates for therespective countries. The annual admission rateper 1,000 population is much higher in Chitten-den (170 per 1,000) than in Chester (90 per 1,000)
and Smederevo (100 per 1,000); the rate for per-sons admitted is also higher. The annual rate ofhospital days per 1,000 population is lowest inChester, but the standard errors are large.
Table O. Use of drugs 1 by adults 18 ears of age and over during the previous 2 daysfor t~e study areas
Area
Chester, U. K--------Smederevo, Yug ------Chittenden, U. S. A---
Total
T
Num- ~~~~-ber age
514 100776 100627 100
Using anydrugs
197 38147303 ‘H
Using only Using drugs Using both
drugs pre - not pre - prescribed
scribed by scribed by and nonpre -
doctor doctor scribeddrugs
Num- ::;;- Num-ber :::;- berNum-ber age age
I I 1 1
97 19 76 15 2394 6
172 27 I18 2:
Per-cent -
age
4
l“Medicines, salves, or pills. ”
Table P. Admissions, persons admitted, and hospital days for all persona 1 year ofage and over per year and mean length of stayl for the study areas
In spite of substantial differences in ways oflife, in organization of health services, and inreported morbidity and disability, people in thethree study areas in England, Yugoslavia, and theUnited States appear to consult doctors in verymuch the same way. Tabulations by levels ofeducational achievement showed no importantcontrasts between the respective study areas. Thepossibility exists that there is some kind of pro-pensity for consulting a doctor or a nurse forcurative services. This propensity seems un-related to the number of doctors available tothe population. Different factors may influencethe use of preventive and curative services.
On the other hand, it is apparent that patternsof hopital utilization vary substantially in thethree areas, and these differences raise inter-esting questions about the ways in which hospi-tals are organized and used in the three areas.
On the basis of this study, the Committeefor the International Collaborative Study of Medi-cal Care Utilization has concluded that epidemi-ologic methods employing household interviewsare feasible for undertaking international andregional studies of medical care utilization. Theinternal consistency of the rates observed withrespect to both similarities and differences isreassuring; most of the standard errors areacceptable. The consistency of hospital utilizationdata with national data in the three areas affordsadditional support for the committee’s conclu-
sion. Validation studies indicate that the methodsare responsive to the problem.
In the full-scale study now underway in 11areas in Argentina, Canada, Finland, Poland,the United Kingdom, the United States, and Yugo-slavia the same general methods will be em-ployed, including the use of identical question-naires and manuals (translated and retranslated),uniform training programs for interviewers andcoders, coordination of activities in the field bytraveling consultants, and communication amongthe participants by means of frequent large andsmall working sessions. The sample size in eachstudy area will be expanded to at least 1,000households. Many changes and improvements willbe made in the questionnaires, manuals, and com-puter programs. The sampling design will con-tinue to be a matter of local choice depending onprior experience and the availability of samplinginformation in each area. More refined methodswill be introduced to obtain comparability betweenthe study areas in the classification of occupationsand in the measurement of health personnel andfacilities. With the confidence gained from thefeasibility study that the methods are suitable,it is now possible to progress to the examinationof some of the original hypotheses of interest andto explore in greater depth the relationships be-tween the availability of health personnel andresources, the methods of organizing medicalcare and paying for services, and the utilizationof medical care.
PUBLICATIONS OF COMhiITTEE FOE INTERNATIONAL
COLLABORATIVE STUDY OF MEDICAL CARE UTILIZATION
Committee for International Collaborative Study of hledicalCare Utilization: The Chronicle of a Feasibility Study, 1964-
66.82 pp., 1966 (available from Committee participants).
Mabry, J. H., and others: The natural history of an inter-
national collaborative study of medical care utilization.Social Sciences Information (UNESCO) 5:37-55, 1966.
“ihite, K. I,., and others: International comparisons ofmedical-care utilization. A~ew England J..lled. 277:516-522,
1967.
Bite, T., and White, K. L.: Factors related to the use ofhealth services, an international comparative study. Medics?
Cure 7:124-133, Mar. -Apr., 1969.
20
DETAILED TABLES
Table 1.
2.
3.
4.
5.
6.
7.
8.
9.
10.
11.
12.
13,
14.
15,
16.
17.
18,
19.
20.
21.
22,
23.
Total number of persons eligible for interview, number interviewed, and numbernot interviewed, by age,urban-rural classification,and sex for the study areas--
Numbers of persons consulting doctors during a 2-week period, by age and sex forthe study areas-----------------------------------------------------------------
Numbers of persons consulting health workers other than doctors and numbers ofconsultations during a 2-week period, by age, sex, and type of consultation forthe study areas-----------------------------------------------------------------
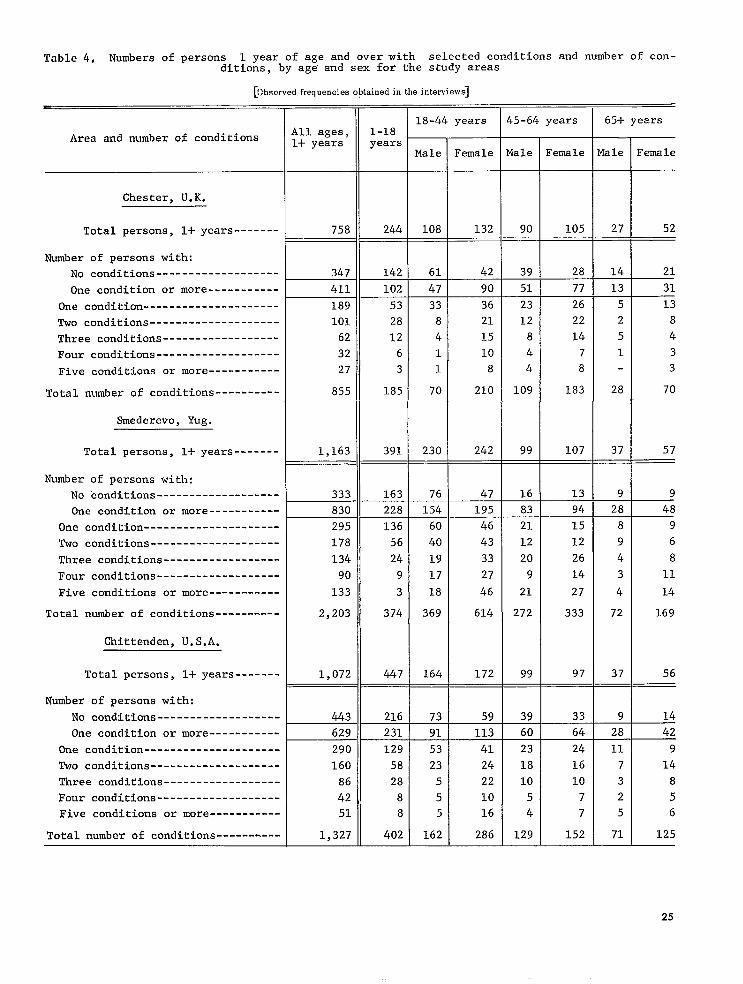
Numbers of persons 1 year of age and over with selected conditions and number ofconditions, by age and sex for the study areas----------------------------------
Numbers of persons admitted to hospitals and number of admissions during a year,by age and sex for the study areas----------------------------------------------
Population estimated from the sample, by age,urban-rural classification, and sexfor the study areas-------------------------------------------------------------
Numbers and rates for persons having a personal doctor, by age, sex, and numberof doctors for the study areas--------------------------------------------------
Numbers and rates for persons consulting doctors during a 2-week period, by age,sex, and number of consultations for the study areas----------------------------
N;mbers and rates for consultations with doctors during a 2-week period, by ageand sex for the study areas-----------------------------------------------------
Numbers and rates for consultations with doctors during a 2-week period, by age,sex, and place of consultation for the study areas------------------------------
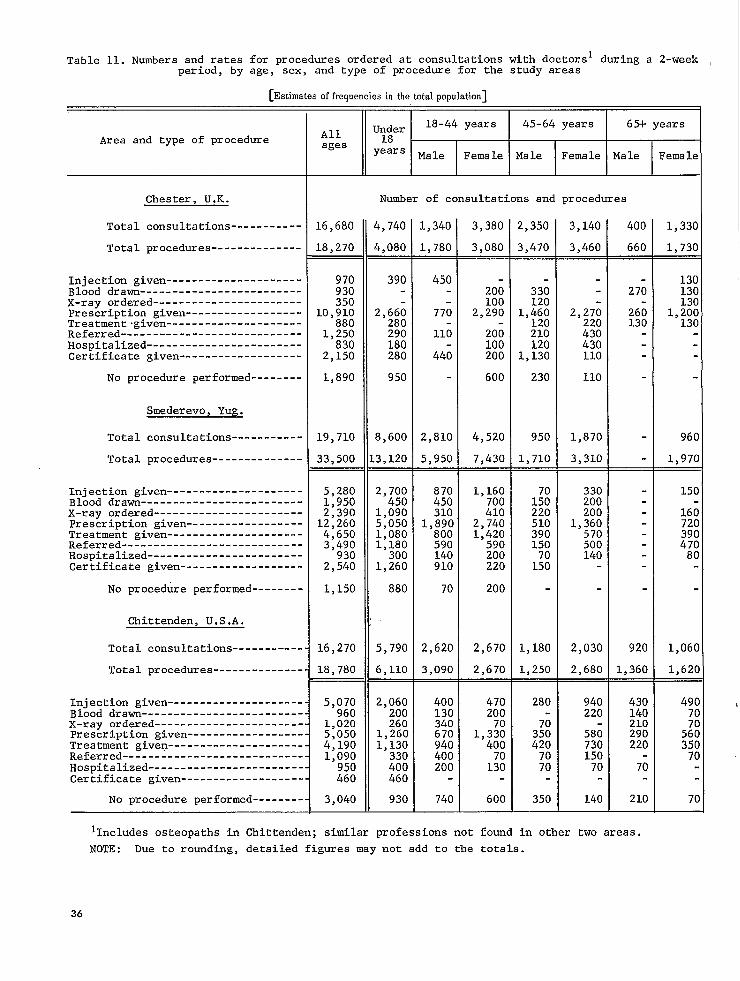
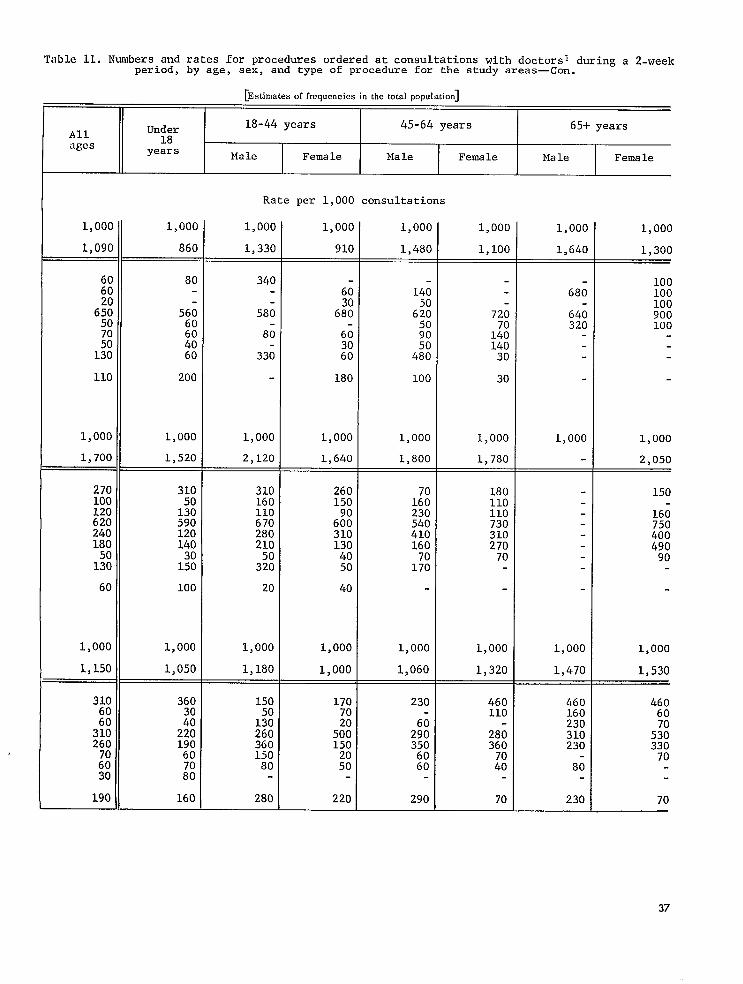
Numbers and rates for procedures ordered at consultations with doctors during a2-week period, by age, sex, and type of procedure for the study areas-----------
Numbers and rates for persons and for consultations with health workers otherthan doctors during a 2-week period, by age, sex, and type of consultation forthe study areas-----------------------------------------------------------------
Numbers and rates for persons 1 year of age and over with selected conditionsduring a year and number of conditions, by age and sex for the study areas------
Numbera and rates for persons 1 year of age and over who had not consulted adoctor for selected conditions during a year and number of conditions,by age andsex for the study areas---------------------------------------------------------
Prevalence of12 selected conditions for adults and children for the study areas-
Numbers and rates for persons with and without conditions consultinga doctorduring a 2-week period and number of conditions for all consultations,by age andsex for the study areaa---------------------------------------------------------
Numbers and rates for persona with activity limitation during a 2-week period andnumber of days per 1,000 persons, by age and sex for the study areas------------
Numbers and rates for persons with bed disability during a 2-week period andnumber of days per 1,000 persons, by age and sex for the study areas------------
Visual acuity, use of eyeglasses, and eye examinations among adults 18 years ofage and over, by age and sex for the study areas--------------------------------
Numbers and rates of conditions among 12 selected conditions reported by adults18 years of age and over,by degree of discomfort and whether or not a doctor wasconsulted during a 2-week period for the study areas---------------------------
Hypothetical behavior for a hypothetical condition compared with actual behaviorfor an actual condition for adults for the study areas--------------------------
Utilization of hospitala during a year, by age and sex for the study areas------
Numbers an~ rates for persons hospitalized during a year and number of admissions,by age and sex for the study areas----------------------------------------------
Page
22
23
24
25
26
27
28
30
32
34
36
38
40
42
44
45
46
48
50
52
.53
54
55
21
Table 1. Total number of persons eligiblefor interview,number interviewed,and number not interviewed,byage, urban-ruralclassification,and sex for the study areas
All ages IIUnder 18 yearsI
18-44 years I 45-64 years I 65+ yearsArea,Urban-rural classi-fication, and sex total I N-I Total I N-I Total I N-I Total I N-I Total I N-I
I I I 1 I #
Chester,U.K.
TOtal----------
Male-----------------
Female---------------
Number of persons
!40.
.08
!32
.57
76
81
83—
32
51
$72
230
242
227
.03
!24
?45
L27
118
)36.
L64
L72
265.
L30
L35
71—
34
37—
32
21
11
22
14
8
10
7
3
12.
102
6
6
6—
4
2
5
3
2
4
2
2
1
1
195
90
L05
L30—
58
72
65—
32
33
206
99107
63—
32
31
143
67
76
196
99
97
157.
77
8C
39—
22
17
36.
17
19
29
16
13
7
1
6
3.
2
1
2
1
1
1—
1
15.
6
9
13—
5
8
2
1
1—
79.
27
52
57—
17
40
22
10
12
94.37
57
31—
11
20
63
26
37
93.
37
56
82—
32
50
11
5
6
35.
14
21
28—
10
18
7—
4
3
6.
3
3
3—
12
3—
2
1
7.
3
4
7—
3
4
.—
-
—
890—
413.
477
584
269
315
306
144
162
1,198
771
353
418
499
119.
60
59
85
41
44
34
19
15
24.
168
13
9
4
11—
7
4
30=
15
15
26
12
14
4—
3
1—
273 257 16.
8
8
6
1
5
10
7
3
3.
12
2
1
1
1
1
3=
3
2—
2
1—
1
272
129
143
179
231 114
136
137
161
128
129
155
107
124
159
41
73
85
27
58
29
Urban ------------
74
85
72
33
39
209
Male -----------------
Female ---------------
228
271
272
125
147
1,174
78
83
112
77
78
102
90
89
93Rural ------------
58
54
405
51
51
402.
219
183
199
104
95
203
115
88
463
39
54
484
14
15
100
Male-----------------
Female ---------------
Smederevo, Yug.
Total ----------
4060
34
12
22
66
Male -----------------
Female ---------------
601
597
533
585
589
520
220
185
201
105
96
204
115
89
466
240
244
233
109124
251
101108
65
33
32
144
68
76
211
urban------------
259
274
665
342
323
1.118
250
270
654
Male -----------------
Female ---------------
Rural ------------
335
319
1.088
131
120
341_
167
174
269
132
137
72
35
37
28
38
100
40
60
89
35
54
11
Male -----------------
Female ---------------
Chittenden, U.S.A.
Total ----------
566
552
889
439
450
229
127
102
551
537
863
427
436
225
254
212
361
190
171
105
64
41
251
212
359
105
106
170
Male -----------------
Female ---------------
Urban ------------
82
88
41
23
18
Male -----------------
Female ---------------
188
171
104
63
41
Rural ------------
5
6
124
101
Male -----------------
Female ---------------
1 = Interviewed.
N-I = Not interviewed.
22
Table 2. Numbers of persons consulting doctorsl during a 2-week period, by age and sex for thestudy areas
~lbserved frequenciesobtsined in the intewiews]
r
Area and number of consultations
Chester, U.K.
Total persons -----------------..
Persons with:
No consultations ------------------
One consultation ------------------
Two consultations -----------------
Three consultations or more -------
Smederevo, Yug.
Total persons -----------------
‘Persons with:
No consultations ------------------
One consultation ------------------
Two consultations -----------------
Three consultations or more -------
Chittenden. U.S.A.
Total persons -----------------
persons with:
No consultations ------------------
One consultation ------------------
Two consultations-----------------
Three consultations or more -------
All ages
771
653
87
26
5
1,174
1,006
107
38
23
1,088
920
126
26
16
~yearsMale Female Male Female Male Female
I I I I
Number of persons interviewed
257
217
32
7
1
402
328
50
12
12
463
397
51
10
5
108
100
6
1
1
230
211
10
4
5
164
143
11
6
4
132.
105
21
5
1
242.
198
29
12
3
172
138
31
1
2
90
76
9
4
1
99.
91
4
3
1
99
87
10
1
1
105
87
10
7
1
107
92
9
5
1
97
80
11
4
2
27
24
3
37
37
37
29
5
2
1
52
44
6
2
57
49
5
2
1
56
46
7
2
1
~Includes osteopaths in Ckittenden; sim-i.lar professions not found in other two areas.
Table 3. Numberstions during
of persons consulting health workeralother than doctors and numbers of consulta-a 2-week period, by age, sex, and type of consultation for the study areas
fbserved frequenciesobtained in the interviews]
Area and type of consultation
Chester, U.K.
Total persons----------------------
Number of
Number of
Number of
Number of
persons with one visit or more-
nurse consultations ------------
dentist consultationa ----------
other consultations ------------
Smederevo, Yug.
Total persons----------------------
Number of persons with one visit or more-
Number of nurse consultationa ------------
Number of dentist consultations ----------
Number of other consultations ------------
Chittenden, U.S.A.
Total persons----------------------
Number of persons with one visit or more-
Number of nurse consultations ------------
Number of dentist consultations----------
Number of other consultations------------
Allages
771
88
47
43
46
L,174
66
89
19
38
.,088
83
23
54
29
Under18
years
257
29
8
19
15
402
22
35
6
3
463
36
10
22
13
18-44 years
Male
108
15
2
8
6
230
8
3
3
16
164
10
5
6
5
Female
132
16
4
9
6
242
23
38
8
11
172
12
1
13
2
45-64 years
Male
90
7
5
5
4
99
5
3
5
99
7
2
2
4
Female
105
8
6
5
107
2
3
1
97
11
5
6
2
65-!-years
Male
27
4
15
2
37
2
2
1
37
3
3
1
Female
52
9
7
2
8
57
4
7
1
56
4
2
2
lIncludes public health nuues, visiting nurses, district nurses,health visitors, and midwives.
office and clinic nurses,
24
Table 4, Numbers of persons 1 year of age and over with selected conditions and number of con-ditions, by age’and sex for the study areas
[Observed frequencies obtained in the interviews]
>
65+ years18-44 years 45-64 yearsAll ages,1+ years
1-18yearsArea and number of conditions
Female
132
42
90
36
21
15
10
8
210
242
47
195
46
43
33
27
46
614
172
Male ?emale
105
28
77
Yale FemaleMale
108
61
47
33
8
4
1
1
70
230
76
154
60
40
19
17
18
369
164
Chester, U.K.
758
347
411
189
101
62
32
27
855
1,163
244
142
102
53
28
12
6
3
185
391
90 27
14
13
52Total persons, 1+ years-------
Number of persons with:
No conditions -------------------
One condition or more -----------
One condition---------------------
WO conditions --------------------
Three conditions ------------------
Four conditions -------------------
Five conditions or more -----------
Total number of conditions ----------
39
51
21
31
13
8
4
3
3
70
57
23
12
8
4
4
109
99
16
83
21
12
20
9
21
272
99
26
22
14
7
8
183
107
5
2
5
1
28
37
Smederevo, Yug.
Total persons, 1+ years-------
Number of persons with:
No conditions -------------------
One condition or more -----------
One condition---------------------
Two conditions --------------------
Three conditions ------------------
Four conditions -------------------
Five conditions or more -----------
333
830
295
178
134
90
133
2,203
1,072
163
228
136
56
24
9
3
374
447
13
94
15
12
26
14
27
333
97
9 9
28
8
9
4
3
4
72
37
48
9
6
8
11
14
169
56
Total number of conditions ----------
Chittenden, U.S.A.
Total persons, 1+ years-------
Number of persons with:
No conditions -------------------
One condition or more -----------
One condition---------------------
Two conditions --------------------
Three conditions ------------------
Four conditions -------------------
Five conditions or more -----------
443
629
216
231
129
58
28
8
8
402
73
91
59
113
39
60
33
64
24
16
10
7
7
152
9
28
11
7
3
2
5
71
14
42
9
14
8
5
6
125
290
160
86
42
51
1,327
53
23
5
5
5
162
41
24
22
10
16
286
23
18
10
5
4
129Total number of conditions----------
25
Table 5. Numbers of persons admitted to hospitals and number of admissions during a year, by ageand sex for the study areas
[Observed frequencies obtained in the interviews]
!5-64 years 65-I-years18-44 yearsUnder18
years
257
19
411Area and number of admissions
Chester. U.K.
Saleages
Male
108
1
Female Female Male Female
771
57
Total persons ----------------------
Number of persons with:
One admission or more ------------------
One admission --------------------------
Two admissions -------------------------
Three admissions or more ---------------
Total number of admissions ---------------
Smederevo. YLUZ.
132
25
90
5
105
4
27
1
52
2
46
10
1
69
,174
102
20
5
30
242
35
18
1
20
402
41
1
1
230
13
2
3
8
99
7
5
2
9
99
13
8
3
2
20
3
1
5
107
4
4
4
97
15
11
4
19
1
1
37
37
10
8
1
1
14
1
1
4
57
2
Total persons ----------------------
Number of persons with:
One admission or more ------------------
One admission --------------------------
TWO admissions -------------------------
Three admissions or more ---------------
Total number of admissions ---------------
Chittenden, U.S.A.
83
18
1
122
,088
147
32
9
50
463
49
12
1
14
164
12
29
5
1
42
172
37
1
1
-
3
56
11
11
11
Total persons ----------------------
Number of persons with:
One admission or more ------------------
One admission --------------------------
TWO admissions -------------------------
Three admissions or more ---------------
Total number of admissions ---------------
130
14
3
168
48
1
50
10
2
14
34
3
40
26
Table & Population estimated from the sample by sge,the a~udy areaa
urban-rural classification, and aex for
[Estimatesof frequencies in the total population]
I I
Under18
yeara
18-44years
45-64years
65rFyears
AllagesArea, urban-ruralclassification,and sex
I I
Chester, U.K.
Total--------------------------------------------
Number of persons
81,790
37,960
43,830
53,570
24,700
28,870
28,220
25,070—
12,500
12,570
14,740
7,150
7,600
10,330
25,050
11,870
13,180
16,470
8,280
8,180
8.580
21,200
9,830
11,370
14,560
6,790
7,770
6,640
3,040
3,600
16.220
10,470
3,770
6,700
7,800
2,480
5,320
2,670
1,290
1,380
7,710
3,110
4,600
2,250
790
1,460
5,460
2,310
3,140
6,580
Male ---------------------------------------------------
1Includes osteopathsin Chittenden;similar professionsnot found in other two areas.
NOTE: Due to rounding,detailed figuresmay not add to the totals.
34
Table 10. Numbers and rates for consultations with doctorsl during a 2-week period, by age, sex,and place of consultation for the study areas—Con.
[Estimate.of frequencies in the tmtal population]
I
Under 18-44 yearsAll
45-64 years 65+ years
ages 18years
Male Female Male Female Male Female
Rate per 1,000 consultations
1,000 1,000 [ 1,000 1.0001.000 1.000 1,000I 1,000
790
52019080
130m 800
56018060
180
870 660
570200100
130
52010030
20040 I 80I
370 100I
10030
70
40 I 80 12060
30
130 17030
140
370100
100
1,000 1,000 1.000 1.000
740
=!_=760 790 660 660
510
2;:
260
640
120
240
250
540
210
620
40
330
430230
340
34018080
20040
14070
26070
1,000 1,000 1,000 1,000
720 600 j 770I
730 940 780 850 I 790
500 5605050 l%
70020
70
75040
220
220
+
850 590200
80
86
4
-t=
5020
200 60230 I 80 80 \ 200
35
for procedures ordered at consultations with doctors 1 during a 2-weekTable 11. Numbers and ratesperiod, by age, sex, and type of procedure for the study areas
[Estimatesof frequencies inthetotalpopulation]
Under 18-44 years 45-64 years 65+ yearsAllages 18
wars Male Female Male Female Male Female
Area and type of procedure
Number of consultations and proceduresChester, U.K.
lIncludes osteopaths in (lhittenden; similar professions not found in other two areas.
NOTE : Due to rounding, detailed figures may not add to the totals.
36
Table 11. Numbers and rates for proceduresordered at consultationswith doctorsl during a Z-weekperiod, by age, sex, and type of procedure for the study areas—Con.
[Estimatesof frequencies in the total population]
Under I18-44 years I 45-64 years I 65+ years
Allages
18years Male Female Male Female Male Female
Rate per 1,000 consultations
1,00C
1,48C
1,00C
1,09C
1,000
860
1,000
1,330
1,000
910
1,000
1,100
1,00C
1,64C
1,000
1.300
6C6C
6;:5C
;:130
110
1,000
1,700
80
560
::4060
200
1,000
1,520
340
58;
8;
336
1,000
2,120
310160110670280210
3%
20
1,000
1,180
150
1%26036015080
280
100100100900100
1,000
2.050
140
6::5090
42:
100
1,000
1,800
720
1::14030
30
1,000
1,780
18011011073031027070
1,000
1,320
68;
640320
1,000
180
1,000
1,640
270100120620240180
1::
60
1,000
1,150
31050130590120140
1::
100
1,000
1,050
260150
6::
1%23054041016070170
1,000
1,060
150
16075040049090
1,000
1,530
1,000
1,470
3101304050
40
1,000
1,000
3lC6C
3![26C
::3C
19C
360
::22019060
;:
160
17070
46o110
28;360
;:
70
46c160230310230
8;
230
46060
5<:330
70
70
5%1502050
220
37
Table 12. Numbersdoctors during
and rates for persons and for consultations with healtha 2-week period, by age, sex, and type of consultation for
[Estimates of frequencies in the total populatim]
Area andtype of consultation
Chester, U.K.
Total persons--------------
Persons with one visit or more---
Nurse consultations --------------
Dentist consultations ------------
Other consultations --------------
Smederevo, Yug.
Total persons--------------
Persons with one visit or more---
Nurse consultations--------------
Dentist consultations------------
Other consultations------------- -
Chittenden, U.S.A.
Total persons--------------
Persons with one visit or more---
Nurse consultations--------------
Dentist consultations------------
Other consultations---------- ----
workersl other thanthe study areas
Allages
81,790
9,560
5,750
4,520
5,040
90,370
4,890
6,610
1,390
2,9N
73>800
5,650
1,560
3,660
1,980
Under
11-
18-44 years
18years Male Female
I I
Number of persons or consultations
25,070
2,870
780
1,870
1,440
30,210
1,660
2,640
440
230
30,770
2,390
660
1,460
870
11,870
1,650
220
890
650
18,130
610
210
230
70
11,020
670
330
400
330
13,180
1,600
390
910
590
18,100
1,630
2,670
580
1,330
11,490
800
70
870
130
3,830
820
590
590
470
7,800
370
250
360
6,910
490
140
140
280
L1,370
870
650
540
8,420
150
250
70
7,030
790
360
430
150
3,770
580
2,190
290
3,110
160
1[+~
90
2>630
220
220
70
6,700
1,180
930
270
1,050
4,600
320
580
70
3>950
280
140
140
9 visiting nurses,]ILl~l,~despublic health n~ses~ district nurses,health visitors, and midwives.
office and clinic nurses,
NOTE : Due to rounding, detailed figurea may not add to the totals.
38
Table 12. Numbers and rates for persons and for consultations with health workersl other thandoctors during a 2-week period, by age, sex, and type of consultation for the study areas--Con.
Allages
1,000
120
70
50
60
1,000
50
70
10
30
1,000
80
20
50
30
[Estimatesoffrequenciesinthetotalpopdat.icm]
Under18-44 years 45-64 years 65+ years
18 -years Male Female Male Female Male Female
1,000
110
30
70
60
1,000
50
90
10
10
1,000
80
20
50
30
Rate per 1,000 persona or consultations
1,000
140
20
70
60
1,000
30
10
10
70
1,000
60
30
40
30
1,000
120
30
70
40
1,000
90
150
30
40
1,000
70
10
80
10
1,000
80
60
60
50
1,000
50
30
50
1,000
70
20
20
40
1,000
80
60
50
1,000
20
30
10
1,000
110
50
60
20
1,000
150
580
80
1,000
50
50
30
1,000
80
80
30
1,000
180
140
40
160
1,000
70
130
20
1,000
70
40
40
Standard-ized rateper 1,000persons
1,000
120
70
50
60
1,000
50
70
10
30
1,000
80
20
50
30
39
Table 13. Numbers and rates for persons 1 year of age andnumber of conditions, by age and
over with selected conditional durin~ a year andsex for the study areas
-.
[Estimatesofheq.mmiesinthetotal~opulationl
All~ges,1+
rears
80,520
18-44 years 45-64 years 65+ years1-18years
23,800
Male
.1,870
~emale
13,180
Male ?emele
Area and number of conditions
{ale ~emale
Chester, U.K.
Total persons, 1+ years ---------------
Number of persons with:
No conditions -----------------------------
One condition or more ---------------------
One condition ---------------------------
TWO conditions --------------------------
Three conditions ------------------------
Four conditions -------------------------
Five conditions or more -----------------
Total number of conditions ------------------
Smederevo, Yug.
Total persons, 1+ years ---------------
Number of persons with:
No conditions -----------------------------
One condition or more ---------------------
One condition ---------------------------
Two conditions --------------------------
Three conditions ------------------------
Four conditions -------------------------
Five conditions or more -----------------
Total number of conditions ------------------
Chittenden, U.S.A.
Total persons, 1+ years ---------------
Number of persons with:
No conditions -----------------------------
One condition or more ---------------------
One condition ---------------------------
Two conditions --------------------------
Three conditions ------------------------
Four conditions -------------------------
Five conditions or more -----------------
Total number of conditions ------------------
See footnote at end of table.
9,830 11,370 3,770 6,700—
2,680
4,010
1,670
1,030
530
400
380
9,090
4,600—
730
3.880
3,030
8,340
2,810
2,380
1,520
760
870
19,820
8,420
1,92036.610 13.900 6.710 4.190 4.170
43,910 9.900 5,160 8,980 5,660
2,510
1,320
890
470
470
12,270
7,800
L&J
710
290
710
130
3,950
3,110
20,050
10,730
6,760
3,4502,910
91,780
89,520—.
25,570
5,120
2,740
1,170
590
280
17,980
29,360
3,620
880
440
110
110
7,700
18,130
3,590
2,100
1,490
1,000
800
20,970
18,100—
3,5306,060 1,280
6.520
1,060
7.350
770
2.340
L“,140
63,940
22,740
13,70C
10,32C
6,88C
10,29C
169,63C
72,73C
17,210
10,210
4,340
1,730
680
250
28,310
29,710
L2,080
4,760
3,100
1,510
1,290
1,420
28,870
11,020
L4,560
3,520
3,180
2,500
1>960
3,400
$5,530
11,490
1,670
9301,570
720
1,630
21,260
6,910
1,170
9402,040
1,070
2,140
26,050
7,030
660
730
340
270
340
6,080
2,630
750
490
630
890
1,120
13,520
3,950
98029,94(
42,79(
14,350
15,350
4,910
6,110
3,5601,540
340330
340
10,880
3,940
7,540
/?,730
1,600
1,470
670
1,070
19,100
2,720
4,190
1,600
1,260
700350
280
9,000
2,400
4,630
1,740
1,16C
730
50C
50C
10,97C
630
Q(J
790500
220
140
350
5,080
2,960
630
980
570350
430
8,830
19,63(
10,91(
5,87(2,88(
3,50(
90,58(
8,580
3,850
1,860530
530
26,710
40
Table 13. Numbers and rates for persons 1 year of age and over with selected conditions’ during a year andnumber of conditional by age and sex for the study areas—Con.
ktimates of frequencies in tlie total rc-ulationl
Allages,1+
yeara
18-44 years 45-64 years 65+ years 3tsndard-ized rateper 1,000persona
1-18years
Area and number of conditions
Male Female
1,00C
MaleMale
1,000
Fema k Female
Chester, U.K.
Total persona, 1+ years -------- 1,000 1,000-
580
420
210
110
5020
10
750
1,810
1,000_
410
590
350
150
60
20
10
960
1,640
1,000
1,00C 1,000_
420
~
260
130
90
50
50
1,250
2,170
1,000
160
840
210
120
200
90
210
2,720
3,260
1,000
1,000 1,000—
400
600
250
150
80
60
60
1,360
2,260
1.000
1,000
Rate per 1,000 persons with:No conditions ----------------------
One condition or more --------------
One condition --------------------
TWO conditions -------------------
Three conditions -----------------
Four conditions ------------------
Five conditions or more ----------
Total number of conditions per 1,000persons -----------------------------
460
540
250
130
80
40
40
1,140
2,090
1,000
560
~
300
70
40
10
10
650
1,490
1,000
320
680
270
160
110
80
60
1,590
2,330
1.000
27C
730
250
210
130
70
80
1,740
2,380
1,000
130
870
140
110
240
130
250
3,090
3,540
1,000
510
490
190
80
190
30
1,050
2,140
1,000
250
750
210
240
110
90
110
1,960
2,600
1,000
46f)
540
250
130
80
40
30
1,130
...
1,000
270
730
240
150
130
80
130
2,030
...
1,000
Conditions per 1,000 persons with onecondition or more -------------------
Smederevo, Yug.
Total persona, 1+ yeara --------
Rate per 1,000 persona with:No conditions ----------------------
One condition or more --------------
One condition --------------------
Two conditions -------------------
Three conditions -----------------
Four conditions ------------------
Five conditions cm mOre ----------
290
710
250
150
110
80
110
1,890
2,650
1,000
330
670
260
170
80
70
80
1,590
2,390
1,000
190
180
190
180
140
110
190
2,520
3,130
1,000
160
840
160
110
140
190
240
2,940
3,490
1,000
Tota 1 number of conditions per 1,000persons -----------------------------
Conditions per 1,000 persons with onecondition cm more -------------------
Chittenden, U.S.A.
Total persona, 1+ yeara --------
Rate per 1,000 persona with:No conditions ----------------------
One condition or more --------------
One condition --------------------
Two conditions -------------------
Three conditions -----------------
Four conditions ------------------
Five conditions or mcme ----------
Total number of conditions per 1,000persons -----------------------------
410
590
270
150
80
40
50
1,240
2,120
480
520
290
130
60
20
20
900
1,740
440
550
32Cr
140
30
30
30
990
L,780
340
660
YG
140
130
60
90
1,660
2,530
390
610
230
180
100
50
40
1,300
2,150
340
660
250
160
100
70
70
1,560
2,370
240
760
300
190
80
50
130
L,930
2,530
250
750
160
250
140
90
110
2,240
2>980
390
610
260
160
80
40
60
1,330
...Conditions per 1,000 persons with onecondition or more -------------------
1see cOnditiOn~ listed in adult and child quest ionnairea, appendix I, pages 62 and 70, table III.
NOTE: Due to rounding, detailed figures may not add to the totals.41
Table 14. Numbers and rates for persons 1 year of age and over who had not consulted a doctorl for selectedconditions during a year and number of conditions, by age and sex for the study areas
[Estimatesof frequencies in the total population]
Area andnumber of unattended conditions
Chester, U.K.
Total persons, 1+ yeara ----------------
Number of persons with:
One condition or more ---------------------
one c~nditi~n ---------------------------
TWO conditions --------------------------
Three conditions or more ----------------
No unattended conditions ------------------
Total number of unattended conditiona -------
Smederevo, Yug.
Total persons, 1+ years ---------------
Number of persons with:
One condition or more ---------------------
One condition ---------------------------
Two conditions --------------------------
Three conditions or more ----------------
No unattended conditions ------------------
Total number of unattended conditions -------
Chittenden, U.S.A.
Total persons, 1+ years ---------------
Number of persons with:
One condition or more ----------------------
One condition ----------------------------
Two conditions ---------------------------
Three conditions or more -----------------
No unattended conditions -------------------
Total number of unattended conditions --------
See footnotes at end of table.
65+ years18-44 years 45-64 yearsAllages,
1+years
80,520
1-18Iears
?3,800
Male
11,870
?emale
L3,180
Male
9,830
?emale
L1,370
Male
3,770
~emale
6,700—
1,660
1,030
630
5,040
2,290
4,600—
3,060
1,070
860
1,130 ,
1,540
6,670
3,950—
1,410
840
430
140
2,540
2,120
18,190
13,360
3,770
1,060
62,330
24,290
89,520
3,070
2,680
290
90
?0,730
3,550
?9,360
1,870
1,430
220
220
10>000
2,640
18,130
4,190
3,200
800
200
8,990
5,490
L8,1OO
2,410
1,480
820
120
7,410
3,470
7,800
4,000
2,700
860
430
7,370
5,740
8,420
990
840
150
2,780
1,130
3,110
32,620 3,820 6,550 8,920 4,200
2,170
620
1,400
3,610
8,900
6.910
4,530
2,020
1,340
1,170
3,890
9,060
7.030
1,550
18,810
7,270
6,550
56,890
57,770
72.730
2,970
850
!5,530
4,670
?9.710
4,610
1,140
800
11,590
9,820
11.020
5,370
2,030
1,520
9,180
15,340
L1.490
590
430
530
1,550
3,310
2.630
17,950 6,110
4,850
800
470
?3,590
7,910
2,890 3,470 1,400 1.660 1.000
12,660
3,580
1>710
54,790
26,390
2,150
540
200
8,130
4,160
2,470
600
400
8,010
5,410
980
350\70
5,510
1,880
940
430
290
5,370
3,040
430
430
140
1,630
1,870
42
persons 1 year of age and over who had not consulted a doctorl for selectedand number of conditions, by age and sex for the ‘study areas—Con.
Table 14. Number s,,and rates forconditions- during a year
[Estimates of frequencies in the total population]
18-44 years 45-64 years 65+ years andard -ed rater 1,000rsons,years
Allagea,1+
years
L-18years
Area andnumber of conditions
Male
1.000
Female iale
L,000
Female Male
1.000
?emale
1.000
Chester, U.K.
Total persons, 1+ years --------
Rate per 1,000 persona with:
(l-wcondition or more--------------
One condition --------------------
TWO conditions -------------------
Three conditions or mOre ---------
Nu unattended conditions -----------
Tnta 1 number of unattendedccxtditions per 1,000 persOns --------
Unuttended conditions per 1,000 per-sons with one condition or more -----
Smederevo, Yu~
Total persons, 1+ years --------
Rate per 1,000 persona with:
Onu condition or more --------------
One condition --------------------
Two conditions -------------------
Three conditions or more ---------
No unattended conditions -----------
Total number of unattendedconditions per 1,000 persons --------
Llnuttended conditions per 1,000 per-sons with one condition or more -----
Chittenden, U.S.A,
Total persons, 1+ years --------
Rote per 1,000 persons with:
One condition or more --------------
One condition --------------------
Two conditions -------------------
Three conditions or more ---------
No unattended conditions -----------
Tots 1 number of unattendedconditions per 1,000 persons --------
Unattended conditions per 1,000 per-scms with one condition or more-----
1.000 ..000 1,000 1.000 1.000
260 250230 130 160 320 250 350 230
170
50
10
770
300
1,330
1,000
110
10
870
150
L,160
1,000
120
20
20
840
220
1,410
1,000
240
60
10
680
420
1,310
1,000
150
80
10
750
350
1,440
1,000
240
80
40
650
500
1,430
1,000
220
40
740
300
1,150
1,000
150
90
750
340
1,380
1,000
660
230
190
250
330
1,450
2,180
1.000
170
50
10
770
300
...
1,000
400
220
90
80
600
730
...
1.000
360
210
80
70
640
640
1,770
1,000
250
130
100
30
870
160
L,220
L,000_
210
360
250
60
40
640
540
1,500
1,000
260
490
300
110
80
510
850
1,720
1,000
300
540
280
80
180
460
L,140
?,120
L,000_
200
540
240
160
140
460
1,080
2,000
1,000—
240
500
190
140
170
500
1,070
2,140
1.000
380 360 260
170
50
20
750
360
1,470
160
30
20
790
270
L,290
190
50
20
740
380
1,440
210
50
30
700
470
1,560
140
50
10
800
270
L,350
130
60
40
760
430
1,820
160
160
50
620
710
1,860
210
110
4(J
640
540
1,500
170
60
20
740
390
...
]Includes ~steopaths in Chittenden; similar profeasiona not found in Other twO areas.
‘See conditions listed in adult and child questionnaires, appendix I, pages 62 and 70, table 111.
NOTE: Due to rounding, detailed figures may not add to the totals.
43
Table 15. Prevalence of 12 selected conditions1 for adults and children for the study areas
Selected condition
Adults
Nervousness -----------
Arthritis-------------
Cough or breathless-ness-----------------
Backache--------------
Headaches-------------
Varicose veins--------
Skin rash-------------
Hemorrhoids-----------
Stomsch trouble-------
Sore throat cm cOld---
Boils-----------------
Hernia----------------
Children
Earache---------------
Sore throat or cold---
Stomach trouble-------
Measles---------------
Cough or breathless-ness-----------------
Skin rash-------------
Joint pain------------
Headaches-------------
Chickenpox------------
Whooping cough--------
Boils-----------------
Bum or scald---------
[Estimates of frequencies in the tdrd pp.le.tim-]
ankrder
1
2
3
4
5
6
7
8
9
10
11
12
1
2
3
4
5
6
7
8
9
10
11
12
Chester, U.K.
[ut$ar
per-sonsin
;ample
97
81
75
68
65
60
56
47
39
38
16
8
33
32
21
20
19
19
10
.9
7
6
5
4
:sti-mtedlumberofper-sons
0,590
9,150
8,470
7,510
6,890
6,680
6>070
5,280
4,220
4,150
1,700
930
3,200
3,110
2,040
1,960
1,850
1,83C
97C
88C
68C
59C
49C
37C
tand-ard-izedratesper1,000ersons
180
150
150
130
120
110
110
90
70
70
30
20
130
130
80
80
80
80
40
40
3C
2C
20
2C
Lankrrder
1
2
6
3
4
9
8
10
5
7
12
11
2
1
3
4
5
9
8
7
10
6
12
11
SmederevO, Yug.
:umberofper-sonsin
ample
317
288
138
254
213
70
73
53
174
129
20
41
54
8~
4e
4:
26
1;
1;
2(
1:
2;
L
;
Adults
Coefficient of correlation: Chester and Smederevo------ 0.82Chester and Chittenden----- 0,90Smederevo and Chittenden--- 0.94
Coefficient of concordance: All three areas------------ 0.94
,sti-!stedumberofper-sons
4,510
2,460
0,740
9,820
6,400
5,330
5,760
4,000
.3,340
9,910
1,540
3,390
4,080
6,660
3,740
3,110
1,980
1,26C
1,30C
1,53C
1,20C
1,95C
300
53C
Children
0.760.610.450.84
tand-ard-izedratesper1,000ersons
410
400
200
340
280
90
110
70
210
150
30
70
140
230
120
100
70
50
50
60
40
60
10
20
Chittenden, U.S.A.
nnkrder
1
2
4
3
5
10
6
8
7
9
12
11
1
3
7
4
5
2
9
8
6
12
11
10
umberofper-sonsin
ample
171
128
93
113
86
43
71
64
67
48
14
15
73
57
29
39
33
64
1$
25
3C
4
5
14
:sti-atedumberofper-sons
1>770
8,940
6,320
7,620
5,840
2,990
4,780
4,380
4,560
3,310
890
1,050
4,850
3,790
1,930
2,720
2,330
4,320
1,260
1,730
2,000
270
400
930
:tand-ard-izedratesper1,000,ersons
270
210
150
180
130
70
110
100
110
80
20
70
160
130
70
80
80
140
40
60
70
10
10
30
iSee conditions listed in adult and child questionnaires, appendix 1, pages 62 and 70, table III.
44
Table 16. Numbers and rates for persons with and without conditions consulting a doctorl duringa 2-week period and number of conditions for all consultations,areaa
lInclude5 osteopaths in Chittenden; similar professions not found in Other two areas.
NOTE : Due to rounding, detailed figures may not add to the totals.
45
rates for personswith activity limitationduring a 2-week period and num-clays per 1,000 persons, by age and sex for the study areas
Table 17. Numbers andber of
[Estimatesoffrequenciesh thetotalpopulation]
II I I I
Under 18-44 years 45-64 years 65+ yearsAllages 18
years Male Female Male Female Male Female
Area and duration
Chester, U.K.
Total persons ---------------
Persona with no days----------
Persons with 1 day or more----
Persons with 1-7 days-------------Personswith 8-13 days------------Persons with 14 days or more------
Days per 1,000 persons------------
Days per 1,000 persona withactivity limitation--------------
Smederevo,Yug.
Total persons---------------
Personawith no days----------
Personawith 1 day or more----
Personswith 1-7 days-------------Personswith 8-13 days------------Persona with 14 days or more------
Days per 1,000 persons------------
Days per 1,000 persons withactivity limitation--------------
Chittenden,U.S.A.
Total persona---------------
Personawith no days----------
Peraonswith 1 day or more----
Personswith 1-7 days-------------Personswith 8-13 days------------Persons with 14 days or more------
Daya per 1,000 persons------------
Days per 1,000 personswithactivity limitation--------------
Number of persona
81,790—
72,410
9,380
8,020200
1,160
...
..*
90,370
71,990
18,370
13,4001,79C3,180
...
...
73,80(
25,070—
21,290
11,870 L3,180 9,830 L1,370 \,770 6,700
8,930 ),200 5,80010,880 11,780 LO,51O
3.780 990 1,400
1,400
...
...
18,100
13,710
890 870 570 890
990
...
...
18,130
16,120
2,010
1,750
26;
...
...
11,020
420
470
...
...
7,800
6,000
430100320
...
...
8,420
5,280
420-
150
...
..*
3,110
2,570
760.
130
...
...
4,600
3,5909090
...
...
30,210
25,270 3,040
4,940
3,790750400
...
...
30,77C
4.390 1.800 3.130 530 1,570
940
52:
...
...
3,950
3,520400470
...
...
11,490
1,030250520
...
...
6,910
2,200320620
...
...
7,030
6.010
180
366
...
...
2,630
2,140 3,520’65>230
8,560
6,900340
1,330
...
...
27,38C
3,39C
9>880
1,140
9>890
1,600
1,400
20;
...
...
6,420
490
420
76
...
...
&30 !1,020
580
3%
...
...
500
220
2%
...
...
3,130130130
...
...
940
1;:
...
...
210
21;
...
...
NOTE : Due to rounding, detailed figures may not add to the totals.
46
Table 17. Numbers and ratesber of days per
a 2-week Deriod and num-for personawith activity limitationduring1,000 persons, by age and sex for the study
[Estimates of frequencies in the total population]
areas-Con.
Standard-ized rateper 1,000persons
1,000
890
‘8 t=5-==-Under
years
45-64 years
==F==
65+ years
=
Allages
Rate per 1,000 persons
1,000 1,000 1,000
870
1,000 1,000 1,000 1,000 1,000
850890 850 920 890 910 920
110
100
16500
4,340
1,000
150
150
460
3,020
1,000
80
80
160
1,890
1,000
110
110
240
2,280
90
40
Si
830
9,200
1,000
80
40
;;
590
7,750
1,000
150
110
4i
1,150
7,630
1,000
830
130
110
2i
750
5,590
1,000
660
340
110
100
16490
...
1,000
780
220
1,000
630790
210
160
%
1,220
6,010
1,000
820
160
1303010
880
5,390
1,000
890
110
100
10
530
4,760
1,000
760 770
240
1902030
1,220
5,030
230
1303070
1,680
7,280
1,000
370
2604070
2,460
6,660
1,000
170
60
110
1,920
1,170
1,000
810
20020120
2,690
7,900
1,000
890
150
::
1,360
...
1,000
880
1,000
900
100
860 930 860880
120 110
100
350
3,170
140 70 140 190 110 120
801010
480
4,640
120
20
640
4,610
60
10
280
3,980
80
;:
1,030
7,120
803080
1,720
9,110
50
56
1,030
9,500
::20
620
...
::20
550
4,730
47
Table 18. Numbers and rates for personswithdays per 1,000 persons, by
bed disabilityduring a 2-week period and number ofage and sex for the study areas
[EstimatesofFmquentiesinthetotalpqulation]
Area and durationUnder 18-44 years 45-64 years 65+ years
18 I I I I IAllages years
I Male I Female Male Female Male FemaltI I I I I I
Chester, U.K.
Total persons---------------
Personswith no days----------
Personswith 1 day or more----
Persona with 1 day----------------Persons with 2-7 days-------------Persons with 8-13 days------------Personswith 14 days or more------
Days per 1,000 persons------------
Days per 1,000 persons with beddisability-----------------------
Smederevo,Yug.
Total persons---------------
Personswith no days----------
Personswith 1 day or more----
Personswith 1 day----------------Personswith 2-7 days-------------Personawith 8-13 days------------Personswith 14 days or more------
Days per 1,000 persons------------
Days per 1,000 persons with beddisability-----------------------
Chittenden,U.S.A.
Total persons---------------
Personswith no days----------
Peraonswith 1 day or more----
Personswith 1 day----------------Personswith 2-7 days-------------Personswith 8-13 days------------Personswith 14 days or more------
Days per 1,000 persons------------
Days per 1,000 persons with beddisability-----------------------
Number of persons
81,790 25,070 11,870
11,100
770
650110
...
...
18,130
17,350
780
69;
9i
...
...
11,020
10,350
670
340330
...
...
13,180 9,830 11,370 3,770 6.70C— - - -
77,120 23,150 12.580 9,590
230
10,620
760
3,640
130
6,43C
27C4,670
2,6801,880
116
...
...
90,370
1,920
1,260660
...
...
30,210
600
400200
...
...
18,100
16,310
110540
11;
...
...
8,420
130
...
...
3,110
13C13C.
...
...
4,600
23;
...
...
7,800
6,68080,940
9,420
1,1806,1901,0201,030
...
...
73,800
26,580
3,630
7,510 2,930 3,59(
1,01(
79(
1:1
...
...
3,95C
1,790 1.13C 910 180
186
...
...
2,630
6002,670210150
...
...
30,770
28,640
2,130
1,2008007070
...
...
350890400150
...
...
11,490
10,420
1,070
330600
13;
...
...
17C62C
2:[
.0.
...
6,91C
5;:25070
,..
...
7,030-
69,000
4,800
2,2302,090
418
...
...
6,630 6,590 2,490
140
3,87C
70280 430
70210
...
...
22070
140
...
...
7a.--
...
...
7;
70
...
...
NOTE: Due to rounding,detailed figuresmay not add to the totals.
48
Table 18. Numbers and rates for personswith bed disabilityduring a 2-week period and number ofdays per 1,000 persons, by age and sex for the study areas—Con.
[Estimates of frequencies in the total population]
Table 19. Visual acuity, use of eyeglasses, and eye examinations among adults 18 years of age andover, by age and sex for the study areas
[Estinstes of frcouenties in the total population]
Area and vision characteristic
Chester, U.K.
Total adults, 18-I-years-------------
Persons unable to “read newspaper”without glasses--------------------------
Persons unable to “recognize friendacross street” without glasses-----------
Persons using glasses---------------------
Persons without eye examinationduring last 12 months--------------------
Smederevo, Yug.
Total adults, 18+ yeara-------------
Persons unable to “read newspaper”without glasses--------------------------
Persons unable to “recognize friendacross street” without glassea-----------
Persons using glasses---------------------
Persons without eye examinationduring last 12 months--------------------
Chittenden, U.S.A.
Total adults, 18+ years-------------
Persons unable to “read newspaper”without glasses--------------------------
Persons unable to “recognize friendacross street” without glasses-----------
Persons using glasses---------------------
Persons without eye examinationduring last 12 months--------------------
All 18-44 years 45-64 years 65+ yearaages,18+
years Male Female Male Female Male Female
Number of persons
56,720
19,940
6,900
36,250
46,850
60,160
15,780
5,210
13,390.
52,710
43,030
15>330
6,720
25,860
31,360
11,870
870
660
3,400
9,890
18,130
750
310
940
15,260
11,020
470
1,280
3,430
7,860
13,180
890
1,300
5,000
11,780
18,100
810
480
990
16,410
11,490
1,000
1,600
5,610
9,020
9,830
4,010
910
7,820
7,790
7,800
4,860
810
3,600
6,810
6,910
3>910
560
5,300
4,820
11,370
6,930
2,170
10,180
9,310
8,420
5,160
1,570
3,930
7,220
7,030
4,780
1,520
6>300
4,850
3,770
2,930
420
3,770
2,650
3,110
2,220
590
2,040
3,030
2,630
1,640
280
1,770
1,850
6,70C
4,30C
1,44C
6,07C
5, 42C
4,600
1,990
1,450
1,900
3,970
3,950
3,520
1,480
3,450
2,960
NOTE : Due to rounding, detailed figures may not add to the totals,
50
TakIle19. Visual acuity,use of eyeglasses, and eye examinationsamong adults 18 years of age andover, by age and sex for the study areas—con.
[Estimates of frequencies in the total population]
Allagea, 18-44 yeara 45-64 years 6.5-I-years
18+years Male Female Male Female Male Female
Rate per 1,000 persons
1,000
350
120
640
830
1,000
260
90
220
880
1,000
360
160
600
730
1,000
70
50
290
830
1,000
40
20
50
840
1,000
40
120
310
710
1,000
70
100
380
890
1,000
40
30
50
910
1,000
90
140
490
780
1,000
410
90
800
790
1,000
620
100
460
870
1,000
560
80
770
700
1,000
610
190
890
820
1,000
610
190
470
860
1,000
680
220
900
690
1,000
780
110
1,000
700
1,000
710
190
660
980
1,000
620
110
670
700
1,000
640
220
910
810
1,000
430
310
410
860
1,000
890
370
870
750
Standard-ized rateper 1,000persons
1,000
330
,110
610
830
1,000
330
100
270
880
1,000
370
160
610
730
51
Table 20. Numbers and rates of conditions among 12 selected conditions reported by adults 18 yeara of ageand over, by degree of discomfort and whether or not a doctor2 waa consulted during a 2-week period for thestudy areas -
Degree of discomfort
Total conditions reported---
Conditions with great discomfort--
Conditions with some discomfort---
Conditions with no discomfort -----
Total conditions reported---
Conditions with great discomfort--
Conditions with some diacomfort---
Conditiona with no discomfort -----
Total conditions reported---
Conditions with great discomfort--
Conditions with some discomfort---
Conditions with no discomfort -----
[Estimatesoffrequenciesh thetotalpopulation]
Cheater, U.K. Smederevo, Yug. Chittenden, U.S.A.
Doctor consultations during a 2-week period
One One OneTotal or None Total or None Total or None
more more more
Number of conditions
71,650
13,380
32,430
25,840
5,770 [65,8801 137,400
I I 11~2,820 10,560 24,030 3,470 20>560 14,060
2,510 29>920 64,420 1,680 62,740 37,500
440! 25,4001 48,95011 150! 48,800111,340
4,440 58,460—.
2,900
1,270
11,160
36,230
270 11,070
Rate of doctor consultations per 1,000 conditions
Rate of relative discomfort per 1,000 conditions
1,000
190
450
360
1,000 I 1,000 I 1,000 II 1,000 I 1,000 I 1>000
Isee conditions listed in adult questionnaire, appendix 1, Page 62, table III.
21ncludes osteopaths in Chittenden; similar professions not found in other two areas.
*650 190
290 610
M!..b!
NOTE: Total numbers of adults 18 yeara of age and over were 56,720 in Chester; 60,160 in Smederevo; and43,030 in Chittenden.
Due to rounding, detailed figures may not add to the totals.
52
Table 21. Hypothetical behavior for a hypothetical condition compared with.-an actual condition for adults for the study areas
Area and condition
Chester, U.K.
Cough or breathlessness -------------------------------------
Rusty nail injury-------------------------------------------
Hypotheticalcondition
Numberre-spend-ing
435
412
511
639
458
775
576
465
627
Percentwho
wouldnot
consultdoctor
6
12
4
9
6
7
10
18
5
actual behavior for
Actual conditioncausing discomfort
Numberre-
spend-ing
50
74
2
91
227
2
78
147
2
Percent~ho havenevercon-sulteddoctor
20
31
2
35
46
‘2
26
34
2
‘See appendix I, adult questionnaire, questions 17-19 on page 64 for hypothetical conditionsand table III on page 62 for actual conditions.
‘Not applicable because rusty nail injury was not one of the conditions used in the question-naire.
53
Table 22. Utilization of hoapitala during a year, by age and sex for the study areas
[Estimates of frequencies in the total population]
Area and hospital utilization
Chester, U.K.
Total persons------------
Total number of hospital days--
Number of persona hospitalized-
Number of admissions-----------
Days per 1,000 persons---------
Mean length of stay in days----
Smederevo, yug,
Total persons------------
Total number of hospital days--
Number of persons hospitalized-
Number of admissions-----------
Days
Mean
per 1,000 persona---------
length of stay in days----
Chittenden, U.S.A.
Total persons------------
Total number of hospital days--
Number’of persons hospitalized-
Number of admissions-----------
Days per 1,000 persons---------
Mean length of stay in days----
Allages
81,790
72,760
5,840
6,760
890
11
90,370
L32,050
7,930
9,500
1,460
14
I 73,800
93,660
10,020
11,350
1,270
8
Under18
years
25,070
21,610
1,850
1,940
860
11
30,210
47,750
3,220
3,940
1,580
12
30,770
12,940
3,250
3,320
420
4
18-44 years
Male
.1,870
430
110
110
40
4
L.8,130
;1,350
1,010
1,090
1,180
20
L1,020
L7,020
810
880
1,540
19
Female
13,180
14,720
2,500
2,600
1,120
6
18,100
32,770
2,670
3,200
1,810
10
11,490
15,350
2,470
2,670
1,340
6
45-64 years
Male
9,830
L6,41O
560
910
1,670
18
7>800
21,610
520
680
2,770
32
6,910
18,650
910
1,390
2,700
13
‘emsle
.1,370
4,970
430
540
440
9
8,420
4,070
330
330
480
12
7,030
7,510
1,080
1,370
1>070
5
65-I-years
Male
3,770
5,110
150
150
1,360
35
3,110
2,630
7,560
720
940
2,870
8
6,700
9,500
250
510
1,420
18
4,600
4,500
170
250
980
18
3,950
14,630
780
780
3>700
19
NOTE: Due to rounding,detailed figures may not add to the totals.
54
Table 23. Numbers and ratea for persons hospitalized during a year and number of admissions, by age andaex for the study areas
[EstimatesOffrequenciesin the total pcqmkttio”J
Area and number of admissions
Chester, U.K.
Total persons---------------------
Number of persons with:One admission or more-----------------
One admission-----------------------
Two admissions----------------------
Three admissions or more------------
Total number of admissions--------------
Smederevo, Yug.
Total persons---------------------
Number of persons with:One admisaion or more-----------------
One admission-----------------------
Two admissions----------------------
Three admissions or more------------
Total number of admissions--------------
Chittenden, U.S.A.
Total persons---------------------
Number OE persons with:One admission or more-----------------
One admission-----------------------
Two admissions----------------------
Three admissions or more------------
Total number of admissions--------------
See note at end of table.
Allages
81,790
5,840
4,660
1,050
130
6,760
90,370
7,930
6,440
1,410
80
9,500
73,800
10,020
8,830
970
210
11,350
Under18
years
25,070
1,850
1,750
90
1,940
30,210
3,220
2,510
720
3,940
30,770
3,250
3,180
70
3,320
18-44 yeara
Male
11,870
110
110
110
18,130
1,010
920
90
1,090
11,020
810
670
140
880
Female
13,180
2>500
2,000
500
2,600
18,100
2,670
2,220
370
80
3,200
11,490
2,470
2,270
200
2,670
45-64 years
Male
9,830
560
210
350
910
7,800
520—
370
150
680
6,910
910—
560
210
140
1,390
Female
11,370
430—
320
110
540
8,420
330
330
330
7>030
1,080
790
290
1,370
65+ years
!Ia le
3,770
150_
150
150
3,110
_
2,630
720
580
70
70
940
Female
6,700
250
110
130
510
4,600
170
80
80
250
3>950
780
780
780
55
Table 23. Numbers and ratea for persons hospitalized during a year and number of admissions, by age andsex for the study areas—Con.
[Estimatesoffrequenciesi“ thetotalpopulation]
Area and number of admissions
:tandard-,zed rate,er 1,000persona
18-44 years 45-64 years 65+ yearsJnder18~eara
Allages
1,000
70—
60
10
80
1,000
90
Male ‘emsle
1,000
190
Male ‘emale Male Female
Chester, U.K.
Total persons ------------- 1,000
70
1,000
10
1,000
60
20
40
90
1,000
70_
50
20
90
1,000
130
1,000
40
1>000
40
1,000
40
1,000
70Rate per 1,000 persons with:
One admission or more ---------
One admission --------------- 70
80
1,000
110
10
10
1,000
50
150
40
200
1,000
150—
120
20
180
1,000
210
30
10
50
1,000
40
40
40
1,000
150
40
40
1,000
20
20
80
1,000
40
20
20
50
1,000
200
60
10
90
1,000
80
60
10
100
1,000
140
Two admissions --------------
Three admissions or more----
Total number of admissionsper 1,000 persons --------------
Smederevo, Yug.
Total persons -------------
Rate per 1,000 persons with:One admisaion or more --------- —
One admission ---------------
Two admissions --------------
Three admissions or more----
Total number of admissionsper 1,000 persons --------------
70
20
100
1,000
140
120
10
150
80
20
130
1,000
100
100
110
50
60
1,000
70
60
10
80
1,000
270
Chittenden, U.S.A.
Total persons -------------
Rate per 1,000 persons with:One admission or more --------- —
One admission --------------- 200
20
230
80
30
20
200
110
40
190
220
30
30
360
200
200
120
20
170
Two admissions --------------
Three admissions or more----
Total number of admissionsper 1,000 persons --------------
NOTE: Due to rounding, detailed figures may not add to the totals.
56
APPENDIX 1. QUESTIONNAIRES
INTERNATIONAL COLLABORATIVE STUDY OF MEOICAL CARE UTILIZATIONFeasibility Study
DIViSiOIIofMedical Care and Hospitals ofThe Johns Hopkins University
Department of Epidemlolou and Commtmily Medicine of theUniversity of Vermont
.411i.[orm.tim which wauld permit identification o{ the ind;vidtial will be held strictly confidential,
will be used only by persons mgoged in md- for the purpose of this survey.
A HOUSEHOLD HEALTH SURVEY
April 1965
[ am from\Ve are doing a health study in this area, Your house was chose” i“ our sample a“d we would like to talk withyou. \Ye are trying to get a picture of Lhe medical services i“ this area a“d how people use them. The informa-tion yau give us will be confidential. First I would like to ask you some q.estio”s about your living arrange-
ments and who lives in your household.
H.us.h.ld address or description of its locationA,.. I Household numb
(Specify) ❑ el _~,t name of doctor or place rnrtial. Addm..
No Yes
.8 ovw the tclophono?, . clu —IA.t n.me of doctor hlftf*l* Addm..
TOTAL NUMBER OF CONSULTATIONS
f no conmdtations in question 1, skip to yuextion 4, page 3.
acord each consultation mentioned in question 1 in Table 1, page 3, using one eofwm foreach consnhtion.
!ecord any overnight stay in hospital/rmrsfng home mentioned, in question I, in Table IV, page 5.
.1 Ifdoctor was consulted in question I, skip to question 3, below.
Havo you scdconsultod a doctor obaut your health at any Nmc in tho last 12 months? UN. ❑ Y.,
.2 IF NO, A.%
Whomdid yOU last s*c/conm![t a &ctor? 1 y-.. l-. th.= 3 7.-s 9 y.-.. 1... ~.. 5 Y.- 5 y.- .,=.,.
>I Do yOU havo a pOrSOnO[ doctor YOU USUOi!y go to?D ❑ “’
,2 IF YES ASK:
who i, h-? 1.bat MS19 Of doctw rnlthls Addrua
1.3 If more than one doctoris mentioned, ASK:
Which orw do yOU USUally S../ 2’ s.u.t Mm of doctorconsult aboutmost of yew
rnftl.1.
-
Addma.
health pmblcma?
12s9.
None U.t ..me of doctor rniti.t. Addre..
2]1
Cc.ds, ~ Cod.,
II1
I1
I
0!015
q @
!
go7
II
IIIIIIII
III
0!0
E#n
n~n
010
1
n
nI
E#nII
C#o
I
59
60
age 2
Table 1- DOCTOR VISITS AND CONSULTATIONS MENTIONEDIN QUESTION 1have a few more questions about your visits/consultations with the doctor.
IJ ZJ 3J
‘lace of visit. Code from question 1.
Ios that in the last 7 days or the 7 Lasc7days . . . . . . ..llays he for.? (Sfmwu marked calendar)
Lasc7days . . . . . . .. I Lasc7days . . . . . . ..l7 days before that. . . . 2 7 days before that. . . . 2 7 days before that. . ..2
ihot was the main reason fur,eelng/consulting the doctor?
:mi:gpi;$ sy.fmn was
)id you see/...s.[t him be . . . . . No Yes No Yes No Yesm. had any syrnptmr,s/.omplaints?
F YES, ASK:
Vh.t wos it? (Sp.ci/y)
F NO, ASK:k this o follow-up visitlconsult.ti.n No Yes No Yes No Y*Sor an ●arlier illn*ss?
F YES, ASK:
fiat was it? (Specify)
1
M that visit/... s.ltni.n did
myone .
give you an infection? No Yes No Yes No Yes
take blood for a test? No Yes No Yes No Yes
take m X-my? No Yes No Yes No Yes
suggest you J*. another doctor? No Yes No Yes No Yes
arrange for you t. g. to th. hospit.l? No Yes No Yes No Y..
9iv= y.. . ..rtiff. o+.? No Yes No Yes No Yes
give you a pr.scripticm or medicine? No Yes No Yes No Y*S
use any other treatment? No Yes No Yes No Y..
(Specify)
Did .nyone suggest that you s.. thei.actor for that visitlc.nsult.t ion? No Yes No Yes No Y.,
IF YES, ASK: tio suggested youree/c.nsult the doctor . . .
the doctor himself? No Yes No Yes No Yes
another doctor? No Yes No Y*S No Yes
a friend? No Yes No Yes No Y*S
husband/wife? No Y.. No Y*S No Yes
other relative? No Yes No Yes No Yes
anyone ●Is*? No Yes No Yes No Y*S
(Specify)
h. any of this visit/c.”sultationpnid for by your .mpl.yer, workm.n’s No Yes No Yescompensation, ins.rant., vt.lf.m., or
No Yes
the health deptint?
IF YES, ASK, All Part All Part All Par!
Does that cover all or part of the●xpenses? 1 2 1 2 1 2
f condition mentioned in question 3 of Table 1, record on Table III, or if condition alrcvdy listed on Table III, circle number i“eft+znd column next to tfmt condition. I
A variation of this question was asked in Chester and Smederevo: see page 72.I
1
Cod.,
ql
EIJl
IlJ3
q
p
II
I
q+clIII
V
tp
Ep
upQJlp
Up
q
p
p
g
p
U#
q
Ep
Cp
q
CI$i
I
IIp
Ep
uppCIJl
q
q
U#
Ep
QI
UJ3
Ep
igl
Egl
Eg3
y
qp
Qp
ngc 3
No Yes Who? (Specify)
1. ths lost 2 weeks ending yesterday give you on iniection? 00
(midnight), in addition to what you
have alrmdy told me, did
a“yon. . . . *eke blood for u *o.*? mm
take an X-my? On
During the same 2 weeks did you see/consult any of the following persons ABOUT YOUR HEALTH?
No Yes How many N. Yes How nm”y
1. Public health nurse/visitingtimes? times?
:Y$:(dl::i:’:;:fie””h •1 ❑ 6. Optometri.t/opticia. ❑ n
2. N.rss In doctor’s office,.!1”1., or outpatient depart. 7. Dentist ❑ @
ment apart from o visit to adoctor ❑ lm
8. Any other health worker
(=.g., o midwife) ❑ u
3. Chiropodist/podiotrlst nD ___ __(specify)
4. Chiropractor ❑ n9. Did you ask odvice from a
5. Social or welfare worker ❑ n
phormocist/druggi st/chemist? ❑ 0
TOTAL NUMBER OF CONSULTATIONS
f no uisim/consuhtions for questions 4 or 5, skip to qwsstion 6.1, below.lccord tack uisit/consult.tion mentione d in ques~ion 5, on ‘Table //, using one column for eack uisit/consukation.
Table 11- OTNICR VISITS OR CONSULTATIONS VENTIONED IN QUESTION 5
Type of health worker? I 2 3
(Code from question 5.)
Was Act in the last 7 days or the Last 7 days, :.... 1 [.ast7 days . . . . . . 1 Last 7 days . . . . . . 1
7 days before? 7 days before that. 2 7 days before that. 2 7 days before that. 2
.1 WJI was the main reason for seeing. . . ?
.
.2 [f no condition or symptom wcsmentioned, ASK:
Old you see/visit . . . becouse you No Yes No Yes No Yes
had any symptoms/complaints?
.3 IF YES, ASK:
What was it? (Specify)
Have you ever seen/consulted a No Yes No Yes Nodoctor about this?
Yes
Old . . . (name health tt,cv!+cr)suggest No Yesyou samlconsult a doctor?
No Yes No Yes
f ~,>nditi.n m~nti.nrd on Table 11, r.c.,d on Table 111, or if condition already listed on Table 11[, circle number in left-handOIWII”ne,tt r., IM conditkm.
t. I Ourlng thislast 2 weeks since . . . were
there ,l”y days when yO” were not able to
cmrry on your “ormol doily activities
because of inn. s.? ❑ N. ❑ yes-+1, YES, ASK: ‘
How mony different day. altogether
during the 2 weeks?
HOW many of those were during the7 days since last . . . ?
.2 Outing those 2 weeks were y.. in bedanytkn. b.causm of illness? a N. ❑ Y=s+IF YES, ASK,
On how many different days were you
in bed all or part of the day?
.3 IF YES TO 6,1 OR 6,2, ASK,
What was the matter with you? How many of these were during the7 days since I.xt . . ?
r t.audition mc”tio”t.d in question 6.3, record on Table 111, or if cona!tion already listed on Table III, circle number iq left-handulumnnextI. &t ~o”,fi~io”.
2
coder
p
qlII
IIIII
I1
1coder
n
n
1
1II
n :01
1
61
Table 111 – CONDITIONS
1:-2zs.=..‘cG—
2—
)
—
t
—
5
—
5
.
1
—
3
—
9—
10—
11
—
12
—
13—
1
1
1’
1
1
62
ire’. something a littleii fferent, although we maIave talked about some o!these problems be fora. Overthe last 12 months, have you:nd any of these health prob-Ie”s at any time, that ISluring th= post year?
‘Go through list first, the”mk all questions across I
mge [or each “Yes.”)
Rupture or hernia
Varicose veins
Unusual shortness of breath,m wheezing or cough
Frequent stomach troublem vomiting, or diarrhea
Re.peoted attacks of back-❑che, or bockstr.aln, orI.mbngo, or sciatic.
Rep.oted attack. of rhe.ma.tism, arthritis, or other
ioint pain
Frequent nervousness, orworry, or depression, ortrouble sleeping
WOMEN ONLY: Unusual orexcessive ‘ ‘fema l.” bleed-ing or dischwge
During the past 12 months,
b. e,.. had ti th=s.v ?
Skin rash
Bolls
Piles, or hemorrhoids orrectal bleeding
Frequent sore throats orcolds
Frequent sever. headaches
—
[0
r
● s
—
Y—
1’—
Y—
Y
—
Y—
Y—
1
Y—
I
Y—
i-
Y—
1
Y.
r
Y—
1
Y—
I
Y—
{
F
—
N
—
N
—
N
—
n the last! weeks hmt bothered,0” . . .
1234
1234
1234
1234
.1234
1234
1234
1234
1234
1234
1234
1234
123,
1231
1234
123z
123L
123,
love you ●ver seen . doctor about this?ApcIrt from o doctor, hove you ●ver
F YES, ASK: When was the last time. . .asked for any advice or help aboutthis from anyone ●Is. Iik. . nurse,your husband, or wife, a friend,
IF NEVER, ASK: relative, etc.?
(Specify)
1234 II
N,
1234Y1“1
I
1234NI
Y;
N;1234
Y;—
NI
1234y;
Ii
NI
1234 Iyl
N;1234
J
~:
1234Y;
1234
NI
Y;
I
NI1234 I
yl
IN!
1234Y\
INI
1234 Iyl \
I
1234Nt
Y;
~1
1234I
Y;
1234
NI
Y!
1234
I
NI1234 1
Y;
2
cod.,
6311-1!
H16-21
6321-2
1Cods,
n
EaI 1-15
El16-20
6321-25
El26-30
Elba31-35 ~ 31-35
EiOka36-40 : 36-40
I
5Ra41-45 ~ 41-45
EdEiO11-15 ; 11-15
EEim16-XI : 1(I-2Q
Eakl21-25 : 2!1-25
EjjQjj
I
Ea!zil51-55 ; 51-55
I
E&MO5643 : 56-K!
~o 5
.1 Since January lst, 1964, have you bee” i“ m hospital or nursinghome, for overnight or longer? U No ❑ Yes
oLJ,UPLETE T.!f3LE /1’ (Enter most recent admission first!
Table fV – HOSPITAL/NURSING HOME ADii[SSIONS1
For what condition wereyou there?
Did you,.ve an3pera-tion?
-----
No
or
&
N
~
N
Y
N
Y
F YES, ASK: Whet is the name Wos the cost of this
Vhat was the nom.a“d address of the admission covered hy
,f the .+eroti cm? hospital or nursing your employer, w.mk-
home YOU were in? men’s compensation,
When was How; the . . . many: time you nights5 entered? werec you~ there?
;E:
!1.. Yr.
I1II
(Try to get precised.scriptio” ormedical name) I inswmce, welfare or
the health department?
Pure
%rt pri-vate
3 4
3 4
3 4
3 4
3 4
3 4
3 4
3 4
co,1I
I
%5X3-w
la30-39
a40-49
El50-59
am-m
RI30-39
H40-49
13il20->9--t!a Ha40-49N
Y H50-59
RiFl20-29
El30-39
N
Y
N
Y
El40-49
I
N
— Ellail50-59 ; 50-59
Y
ow we would like to ssk you some other questions 211
Coder I CoderI1
p[q
!1
1 Can you see ordinory “ewspoper print withoutglosses?>out your health.
❑ N. ❑ Y=sVISION
1 Have you hod your ● ●s tested for vision by a“yrdoctor, or ophthalmo ogist/oc.list, or optometrist,
or optician in the lost 12 months?
❑ No DYes
.2 IF YES, ASK:
Who did you see most recently?
2 If no and uses glasses, ASK:
Con you see ordinary newspaper print withglasses?
❑ No ❑Yes1
1 Can you see well enough to recognize a friendwolking o“ the other side of the street withoutglasses?
1
1
1
1 ❑ N. ❑ Yes
2 If no and wears glasses, ASK:
Can you see well enough to recognize a friendwalking on the other side of the street withglasses?n~m
I12
,1 Do y.tl use glosses at all? ❑ N. ❑ Yes
,2 IF YES, ASK:
Who presctlhed them for you?(Spt.,. if) )
IIIIIII!III
❑ N. ❑hif respondent can’t see ordinary newspaper print~.or recognize a rtend tcal!+in,g o“ rhe other side ofthe street and p. not had his eyes tested for.isio” in the past 22 montk, ASK:
HOW does it hoppen you haven’t seen anyoneabout your eyes?
~ undue breathlessness, or wheezing, or coughzot mentioned in Table [11, ASK:
7. Supposing youhadunusuol shortness of breoth, or
wheezing, or cough for about 2 weeks but not
necessarily continuously, what would you do
about it?
Anything else? DN.a DYes
I IF YES, ASK, Whet would that be?
I\
~ fregue”t ner.ous.ess, or worry, or depression,,rtrouble sleeping not mentio”edi” Table Ill, ASK
18. Supposing you bada.onst.snt feeli.g of nervous.ness, orwo,ry, ordepr.ssicm, or frouble sleepingfor about 3 weeks, what would you do about it?
Anything ●lse?
IF YES, ASK: What would tbat be?
19. Suppose youstepped .narusty nail and itwentdeep into your foot, wbot would you do about it?
Anything .1s=? ON. OY..
fFYES, ASK: Wbafwould that be?
!0. Ifadoctor isnotmentioned in17,0r 18,or 19, ASK: You didn’t mention a doctor inconnection with 17, or 18, or 19, whywoulthat be?
2
Coder
n
n
n
0
1Cod.r
n
u
n
0
IIIII
IIIIII
;
n~qlIIIIIII111
IIIIItIIII1ItI
E#n
IIII
III1
I
III
I1I11
1III
I
64
I[
ba~, ‘7
21,1 lnsom. famill.s on*memhr ofth. fomIIY looksoltwthch.alth of th. ether members of thefamily.
Is that so in your family? ❑ tb ❑ ,e.
21.2 IF YES, ASK: Whowouldihat be?
22.1 If youcould have about 15mimJtesof uninter-ruptedtlme in ihe next 2 weeks with II doctoryou found sympathetic and understmmfing, isthmrmanythlng you would Iiket.a cisk him about?
❑ No ❑ Yes
IF YES, ASK: Would youtellmewhat it is?
?2.2 Havoyou cvortalked toanydoctor ab.autthis?
❑ No ❑ Y..
IF YES, ASK: What h.appened?
‘F NO, ASK: Why not?
f the respondent has a doctor he usually se..
~he has nodoctorhe usual~y sees, skip m
ucstion 3.1, page 1), ask uestions 23.1–27.
?uestion 28, opposite.
?3.1 l’dllk* toaskyou oneortwo questions obo”tthe doctor you usually see.
Wh.n you visitor consult your doctor does hetake ht. tinm and not hwry you . . .
!5. Ny.. were worried about ap.rs.nal problemthat wosn’ta strictly medical one, such ischildren getting into trouble ordiffic.ltiesbetween husband and wife, de you think yo.might discuss it with your doctor?
No . . . . . . . . . . ..O
Yes . . . . . . . . . ..l
It depends . . . . . . . 2
‘6. Howl.mgdoes itusuolly take youtogat to yourdoctor’ so ffic. . .
Has . . . seen/consulted Q doctor about hidher heolth ot any time in the last 12 months? ❑ N. ❑ Yes
L2 IF No, ASK:1 Yearp
When did he/sh. last see/consult a doctor?3 years, 5 years
less thn” 3 years less than 5years or more
1.1 Does, ., have a personal doctor ;bo. ..usually sees/consult? UN. ❑ %
1.2 IF YES, ASK
Who IS h.? 1.Last “mw of doctor Initials Add re$s
1,3 If mare thw one doctoris mentioned, ASK
Whlcb.an. do.s. . .2.
Last “me .< doctorusually sdconsult about
lniti*ls Address
most of hidbar hralthproblems?
123 Nona 3.Last name of doctor Iniliel. Address
I2,1
Code, , Coder
I
qrq
n
n
n
n
n
n
o
n
1
11
1
nio0’0
n
n
n
n
n
n
67
!ge 2
Table I – DOCTOR VISITS AND CONSULTATIONS MENTIONED IN QUESTION 1 iI
Cod,,, Cod.,Uj&3q-~p
have a few more questions about . . visits/consultations with the doctor.
1 IJ
Iace of visit. Code [romquesLionl.
,ast7days . . . . ..l‘days before that. . 2
as that in the last 7 days or thedays before? (Shoumarkedcalendar)
ist7 days . . . . . . . 1 Last 7 days . . . . . . 1days before that. . 2 7 days before that. 2
bat was tbe main reoson for
teing/consulting the doctor?
‘no condition or symptom wusenlioned, ASK:‘Id . . . see/consult him because ofny sympt. mslc.mplaints?
‘YES, A5K:
‘hat was it? (Specify)
No Yes
=NO, ASK:1.s this a follow-up visit/consult.ti.nor an earlier illness?
upNo Yes No Yes No Yes
FYES, ASK:
Ihatwas it? (Specify)
No Yes
,t tbot visit/co ns.ltati.n didnyo”e . . .
give . . . on inie.ti.n?DqNo Yes I No Yes
No Yes
No Yes
$akebl.a.d for. test? No Yes I No Yes
take an X-ray? No Yes I No Yes
pNo Yes No Yes No Y..suggest . . . see another doctor?
EgNo Ye.
No Yes
arrange for . ..to goto the hospital?
q
U&l
give. , .0 certificate?
No Yesgive. . . o prescription or medicine?
No Yes I No Yes N. Yes.s. my other tre.atme”t?
(Specify)
No Yes Ig3
No Yes
No Yes
the doctor himself?
another doctor? No Ye. I No Yes
No Yesa friend?
No Yes No Yes
N. Yes No Yes
No Yes No Ye.
No Yes No Yes
All Port All Part
1 2 1 2
No Yesa r.lotive?
yourself? No Y..
No Yesanyone else?
(Specify)
No Yes
Uas any of this visit/consultati.npaid for by . . . ●mployer, workmen’scompensation, insu,anc*, welfar. .rIb. h.ohh department?
fF YES, ASK:
Does that cover all or part of theexpenses? +---i-+
ql1/ conditions mentioned in question 3 O( Table /, record on Table Ill, or if condition already listed on Table 111, circle numberi“ left-hand column mzt to that co”diticw.
68 A variation of this question was asked in Chester and Smederevo; see page ’72.
---- .ru~c .
Who? (Specify)
No Ye.
Llnthelast 2weeks ending esterday
1(mldnlght), lnoddltion tow atyo.give. . . an iniection?
00
hovtalre.ady told tne, did.anycme. . .
‘0’= ’’00’’0’”’”’” DO
take a” X.ray?00
i. During the some 2 weeks were any of the following health workers seen/consulted ABOUT . HEALTH?
How many :l:e:?any.1 Publlch.olth nurse/visiting No Yes times?
nurse/district nurse,f healthvisitor in the home ❑ n
.3 Chiropodist/pc. di.atrist ❑ u 9. Anyother health worker nn
.4 Chiropractor ❑ o(Speci\y)
.S.%.clal c.r welfare worker ❑ n
10. Oid you ask odvice from apharmaci st/drug gist/chemist? ❑ u
TOTAL NUMBER OF CONSULTATIONS I[n. t,isits/consultati..s for questions 4 or 5, skip m y.es,io. 6.1 below.?rrord rack visit/consultation mentioned in question 5, on Table /1, using one column @ each visit/consultation.
Table II - OTHER VISITS OR CONSULTATIONS h!ENTIONEf) IN QUESTION 5
L Type of hdth worker? 1 2J 3
(Code from guestion 5)
!. Was that i“ the lost 7 days or the Last 7 days . . . . . . 1 Last 7 days . . . . . . 1
7 days before?
Last 7 days . . . . . . . . 1
7daysbeforetbat. 2 7 days before that. 2 7 days before that. 2
1.1 What wasthemaln reason for seeingthe ...?
1.2 Ifrm condition orsy”ptom wasme.tioncd,ASK:
Old, ., .ec/visit . . . because . . . had N“Yes No Yes No Yes
ony sympt0m5/complaints?
1.3 IF YES, A3K,
Whet was it? (Specify)
L Has , . . war seen/.ons”lt.d a doctorabout this? No Yes No Yes No Yes
i. Oid . ..(n.me he.lthworker) s.ggestyou sdconsultu doctor? No Yes No Yes No Yes
lfc.ndition m.ntio.ed on Tahle H, record on T.blel/l, ori{co"ditio. alre.dy listed on T.ble/i[, circle number inthe left-hand,.o[umn next to dint condition.
!.1 O.tl”g th{s last2 w.eks since. . . werether. a”y days when ... . was”.at abfeto carry onhisihernormcd doily activitiesbmcause of Illrmss? QNo ❑ Y= S-+ IFYES, ASK:
How many different days altogetherduring the 2 weeks?
How many of those were during the7 days since lost . ?
!.2 Outing th.se2 weeks was. . . in btdonytime bec.useof illness? ❑ NO •Ye*+/~ms,As~:
Onhowmany different days was . . .in bed all .rpmtof the day?
How many of those were during the
1.3 IF YES TO 6.1 OR 6,2, ASK,7 days since last . . . ?
What wos them.stter with , . . ?
{ccl. dilionmcntioned inquestio" 6.3, r.cord."T&le l/~ ori/conditio" .lre.dY listed on T.ble III, circle n"mb.rin left-hand,olumn next to that ccmditiom
2;1Coder , Code,
0!0
I
E#nI1
11
11
!
CJn
nnnU
I1
n~n15
11
IIII
U
nnn
69
70
age 4
Table III - CONQITIONS
[F TfIE CIIILD IS OVER 1 YEAR OF AGE, ASK THE FOLLOWING:
H.re’s something . little In the lost H.ve you ●ver seena doctor cibout this? Ap.rt from a doctor, hav. you ordifferent, .Ithough w. ma
}
2 weeks IF YES, ASK: When was the last time?have talked about some o had it
has . . . . ●ver had a“y advi.s. orhelp about this from anyone .Ise
~ these problems before. Over boihcred IF NEVER, ASK: like a nurse, another member ofo the lost 12 months, h.. . . . %’
5 hod any of these healthWhy was thot? the fami Iy, a friend, relative, ●tc.?
No “’”’ :2s-–1
: problems .* any tire., that :g: lf more than a year ago,~ is, during the past year? or
>E~ A-SK: Ie+r+o
: 7 No i
z ye, 4J~{; jjg How does it happen that . . . I
(Go thru list /irst, then has not been since?5
:>== ..*. 0, I (Specify)ask all questions across
e~E:: :=! :
page for each “Yes.”) 0:>= .5; : Yesl
1234 1234 I
N NI
1234 1234 I
1 Rupture or herniaI
Y YI
N N~
1234 1234
2 Whooping cough Y Y!
N Ni
I3 Un. s..l shortness of breadth,
1234 1234
or wheezing or c..gh Y yl
N N;
4 Frequent stomach trouble, or1234 1234
vomiting, or diarrhea Y Y!
N NI
1234 1234
5 Measles (regular or Ge,m.n) Y Y/
N I
‘11234 1234
6 Chickenp.x Y YI
N NI
1234 1234I
7 Burn or scald Y Y!
N NI
1234 1234 I
8 Eoroche or “runny’” ear Y YI
Durhg the past 12 months, - I 1have YIM had .ny of these? j ,_-
.— .—. J
NNI
1234 1234
9 Skin rash Y Y!
NNI
1234 1234
10 Boils Y yl
NNI
1234 1234
11 Joint pain Y yl
LN N 1
I1234 1234
12 Frequent sore throats orcolds Y Y]
N N1
1234 1234I
13 Frequent severe heodach.s y YI
N I
‘11234 1234
14 Y YI
N N I
1234 1234I
15 Y yl
N NI
1234 1234I
16 Y YI
N NI
1234 1234
17 Y Y/
N N;
1234 1234 I
8 Y Y;
z~lCod., , Cod.,
!gn
Elm1!-15 I 11-15
I
Imtfil16-20 I 16-20
❑l!a21-25 I 21-25
Wi5126-30 ; 26-30
KAza31-35 : 31-35
EiN2il41-45 ; 41-45
Eatza46-50 I LVJ-W
EiOII-IS
16-20
❑21-25
•126-30
Eta31-35
❑36-40
❑41-45
Ea46-50
❑51-55
56-60
laII-15
la16-Z!
H21-25
Ea25-X!
Ea31-35
ti!il36-43
la41-45
Ii!il46- %
la51-55
a 56-
7.1 Since Jmnumy lst, 1964, has . . . . been in . b.spit.al .r “ursi”g home,for overnight or longer?
31.? Da Ii ono plata u p@punosti ili delimitno za va;ebocavke u bcdnici i Ie&aje
❑ N. (J.. ❑ ,emam
31.4 Da Ii O-IOpIa6a usluge u potpunosti ili delimiboknda poset”j ete (Icomsultuj=t=) I=k=a ~ ~rdi”aci.
ji opite prakse, kod kufe ili u specijalisti~oj(ordinaciji) ambulauti ?
❑ N. •1 l), •1 ., ,.*.
QUESTION 32
;hester version
EDUCATION
32. At what age did you leave school?
(Specify) years of age
Deduct 5 front age and code
Less than 9 . . . . . . . . . . . . . . . 1
9 . . . . . . . . . . . . ...2
10-11 . . . . . . . . . . . . . . . 3
12 . . . . . . . . . . . . ...4
Morethan12 . . . . . . . . . . . . . . . 5
Smederevo version
I OBRAZOVANJE
32. KolikozavrSenih godina skolovanjasa”speh~imate ?
(Ncwedite)
0- 8 . . . . . . . . . . . . . . 1
9-10 . . . . . . . . . . . . . . 2
11 . . . . . . . . . . . . . . 3
12 . . . . . . . . . . . . . . 4
l? i~i~~ . . . . . . . . . . . . . . . 5
ooo—
73
TECHNICAL
APPENDIX II
NOTES ON STATISTICAL PROCEDURES
Standard Papulatian and Standardized Rates
Age-sex specific rates for the selected conditions,activity limitation, visual impairments, persons withpersonal doctors, doctor consultations, and hospitalutilization were amalgamated within each of threestudy areas by conventional standardization. The popu-lation of Sweden in 1962 was taken as a standard.
~
nTotal, all ages- 100,000
Under 15 years ------ 21,54115-17 years --------- 5,05618-44 years --------- 35,67645-64 years --------- 25,59465 years and over--- 12,133 T
49,892 50,108
11,062 10,4792>584 2,472
18,039 17,63712,679 12,915
5,528 6,605
Asanexample, let r, bethesurvey estimatedrateof disability days per person in the ith age-sex classin Chester, U.K. Let Pi be the number of persons inthe ith age-sex class in the standard population of100,000. Then the standardized rate per 1,000 personsis R=(10-2)Z ~ri = 110, where the summation extendsover all 10 age-sex classes. (See table H, page 14.)
Estimates of Population Totals
Simple expansions of sample totals by the inverseof the sampling rates were used as estimates of popu-lation totals. In Chester the sample totals were multi-plied by 92 for both the urban and rural zones; forChittenden the multiplier was 66; and for Smederevourban sample totals were expanded by 66 and ruralsample totals were expanded by the factor 83.
Standard Errors af Standardized Rates
The usual approximations for estimating s~andarderrors of ratios were employed. Let h index strata
(two in Chester and Smederevoand50in Chittenden) andlet j index the selected sampling units w~thin strata.The f~rmof the estimated rate ri is (~/Xi), where,e.g., Y, is anestimate of thetotal nu~ber of disabilitydays for the ith age-sex class, and Xl is an estimate:f the tot:l number of persons in that age-sex class.Y, and Xl are weighted sums over strata of samplevalues. The variance of r, was estimated as
where N~ and n~ are the total and sample numbers ofsampling units, respectively, of Ihe hth stratum and thes’s are the usual within stratum mean squares andproducts of numerator and denominator variables. Thevariances of the standardized rates (per 1,000 persons)were estimated by
var (l?) = (10-4) Z Pi2 var (r,),1
and the estimated standard errors were given as -),
Standard Errors of Detailed Tables
Standard errors for the estimates shown in thedetailed tables are not presented. Estimates bssed on10 or less observations have sampling errors of theorder of 25 percent or more for each of the three areas.In general, estimates based on sample frequencies ofless than 50 observations should be approached withgreat caution.
Treatment of Noninterviews
Based on the best internal evidence available frominterview schedules, the numbers of persons eligible forinterview in each study area were classified by urban-rural residence and age-sex classification. For ana-lytical purposes a missing interview was representedby averageurban-rural
values of actual data in the appropriateage-sex category of the missing interview.
II!? u. S. GOVERNMENT PRINTING OFFICE: 1969—342049/s7
000
74
OUTLINE OF REPORT SERIES FOR VITAL AND HEALTH Statistics
Series 1.
Series 2.
Series .3.
Sefies 4.
Series 10.
Series 11,
Series 12.
Series 20.
Series 21.
Se rics 22.
Public Health Service Publication No. 1000
l]j.o~,rajt(s atut collecfio}i procedares.- Reports which describe the general Programs of the National
(:entcr for Hea Ith Statistics and its offices and divisions, data collection methods used, definitions,.=
anLl ~Jther material necessary for understanding the data.
Data ~(alaa[iw uud t)letimds seseasch. —Studies of new statistical methodology including: experi-mental tests of new survey methods, studies of vital statistics collection methods, new analytical
techniques, objective evaluations of reliability of collected data, contributions to statistical theory.
.!w~[j,ticai stm[ies,- Reports presenting analytical or interpretive studies based on vital md healthstilt istics, carrying the ilnnlysis further than the expository types of reports in the other series.
Docu~Hc’ufs UJM cuwmitt(~c, J.tports. — Find reports of major committees concerned with vit~ 1 .~ncl
he:llth statistics, ,lnd documents such as recommended model vital registration laws and revised birthand ~ic,;ltll certific:ltes.
Data ,f}”wl tlM Hcalt/t ])/fL,/./iL(,(, SUJ.W_V.—Statistics on ilktess, accidental injuries. disabilit), use ofh.)spit,ll, medical< dental. :lnd other services, and other health-related topics, based on dat~ collectedin :1 cent inuin~ nmional household interview survey.
Data j; “WI theHealthE.yawi~latiou St(rLrtiy. — Data from direct exam ination. testing, and me.~sure -rlttmt of n,ltion,ll wmples of the population provide the basis for two types of reports: (1) e~timates~~f’the nlc,dic~lll~ defined prevalence of specific diseases in the United States and the distributions ofthL> p(]i7uli]tifm with re+pcct to physical. physiological, and psychological characteristics; ond (2)in I[vsis OF rel.ltionships .lmong the vlrious me.wurements without reference to ~n explicit finite
[lllivL~rsc, of pL, rsons.
DataJj.o))ttheltlsfitl(tio]tal Poplilafioll Suroeys. — Statistics relating to the health characteristics nfpers[)n> in institutions, and on medical, nursing, m-d personal care received, based on nationalsilnlples ,~f est.lb]ishments providing these services and samples of the residents or patitints.
.!),ttu]jwitttheHrxpital Dischurqe St(rt’ey .—statistics relating to discharged pati~nts in short-stayh[wl~it:]ls, I,i!sed ,In :1 s:imple of patient records in a national sample of hcmpitals.
1).I/~1 ,JH IICU1lIZ~.,.su~(vce.s: man/Jowev and~aci(ities.—S[atistics on the numbers, geographic distri -
INII11111,.tnd characteristics of health resources including physicians, dcmtists, IILIr~Ls, ot17Fr health111.IIlp[I\YLI“t]ccupati~]ns, Ilospit.lls, nursinc homes, and outpatient and other inpatient facilities.
J911tuw i)lo][a[it~.- Irarious statistics on mortality other than as included in annual or monthlyt-c X)rrs1 —special analyses by cause of death, age, and other demographic variables, also geographic;lncf time sl~ri~.s :III:IIJISCS.
.fkla w ualullfj, l)~ffj.).iaqc, and dirorce. — Various statistics on natality, marriage, and divorce otherth:ln as im-]uded in annual or monthly reports—special anal~,ses by demographic l,ariables, ~]SL)
Sc’t]gr:lphic ami time series analyses, studies of fertility.
DaIa Jj.olll tll~ ,Vatiotlal L\rata[ity atzd ,lIo).tality SarL,cys. —Statistics on characteristics of births andd~,:lths not :IV;li l.+hle fr(ml the vital records. based on sample sur~~eys stemming frL)I_il these records,in{.lmling such t~q~ics .1s mortality by socioeconomic class. medical ex~erience in the Imt yetu ofIi fc,, ~.ll:lrilc.te].istics of pregnancy, {t ,.
I:or .I list of titlcis of rcip[]rts published in these sc’ries. write to: Office of InformationWtion.d Center for lie~lth St.ltisticsU.S. Public Ikalth Service