Page 1
International Competition, R&D Investment Patterns, and Endogenous Sunk Costs in Canada and the United States, 1987-2002
Daniel Ershov, Industry Canada Working Paper 2011-02
ECONOMIC RESEARCH AND POLICY ANALYSIS BRANCH
Working Paper Series
Page 2
This publication is also available online in HTML: http://ic.gc.ca/eic/site/eas-aes.nsf/eng/h_ra02286.html. To obtain a copy of this publication or an alternate format (Braille, large print, etc.), please contact: Economic Research and Policy Analysis Branch Industry Canada C.D. Howe Building 235 Queen Street Ottawa, ON Canada K1A 0H5 Telephone: 343-291-2627 Facsimile: 613-991-1261 and E-mail: [email protected]
Permission to Reproduce
Except as otherwise specifically noted, the information in this publication may be reproduced, in part or in whole and by any means, without charge or further permission from Industry Canada, provided that due diligence is exercised in ensuring the accuracy of the information reproduced; that Industry Canada is identified as the source institution; and that the reproduction is not represented as an official version of the information reproduced, nor as having been made in affiliation with, or with the endorsement of, Industry Canada. For permission to reproduce the information in this publication for commercial purposes, please contact the: Web Services Centre Industry Canada C.D. Howe Building 235 Queen Street Ottawa, ON Canada K1A 0H5 Telephone (toll-free in Canada): 1-800-328-6189 Telephone (Ottawa): 613-954-5031 Fax: 613-954-2340 TTY (for hearing-impaired): 1-866-694-8389 Business hours: 8:30 a.m. to 5:00 p.m. (Eastern Time) Email: [email protected] © Her Majesty the Queen in Right of Canada, represented by the Minister of Industry, 2015 Cat. No. Iu172-1/2011-2E-PDF ISBN 978-1-100-25726-6 Aussi offert en français sous le titre : Concurrence internationale, schémas d’investissements en R-D et coûts irrécupérables endogènes au Canada et aux États-Unis, 1987-2002.
Page 3
The views and opinions expressed in the research paper are those of the author alone and do
not represent, in any way, the views or opinions of the Department of Industry or of the
Government of Canada.
Daniel ErshovIndustry Canada
I would like to thank Marc Duhamel of Industry Canada and Mauricio Varela from North-western
Kellogg for their very helpful comments.
The causal relationship between market structure, innovation, and competition intensity has been
contested in economic literature, resulting in contradictory empirical estimates of the magnitude, and
even the direction, of linkages between competition intensity and research and development (R&D)
spending.
This paper contributes to the literature of competition intensity and innovation by using John Sutton's
(1998) sunk cost theory to provide empirical evidence as to the impact on R&D investment of
competition intensity increases via large scale trade liberalization for countries with heterogeneous
*
Now with the University of Toronto*
1
1
Page 4
productivity levels. Holding relative productivity differences between the two countries constant, sunk
costs theory predicts that an increase in competition intensity between two countries due to the
reduction in trade barriers produces the following effects (in an R&D intensive industry): at first, R&D
expenditures in both countries escalate, but eventually the country with higher productivity raises its
R&D intensity relative to the second country, for a given industry. This results in firms in the country
with lower productivity either dropping out of the industry entirely, or remaining in the industry and
concentrating on producing goods that are less R&D intensive and that incorporate less value added.
Using a difference-in-difference econometric specification and industry level data for the 1987–2002
period, this study finds empirical evidence of these effects in the period following the North American
Free Trade Agreement (NAFTA) between Canada and the United States (US). Although R&D
investment increased for both countries in absolute terms, Canadian industries' R&D intensity
declined relative to their United States competitors.
The paper proceeds as follows. The first section describes the theory of sunk costs and presents its
predictions regarding the impact of an increase in competition intensity on innovation. The second
section discusses the econometric model employed and the data used in the estimation process. The
third section then presents the results, and the fourth section concludes.
The literature of competition intensity and innovation is fraught with contradictory theoretical
hypotheses, and inconsistent empirical evidence. Schumpeter (1934) states that monopoly rents
create an incentive for firms to invest in innovation, thereby producing a negative relationship
between the intensity of market competition and firm innovation. Other models predict the opposite.
Yet another set of models finds an unstable "inverted U" relationship between competition intensity
and innovation. One of the main reasons for these disparities is that most of the literature fails to
account for important methodological issues such as the measurement of competition, or for the
inherent endogeneity between market structure, competition intensity and innovation.
Concerns about these issues have led to the development of theories that offer less specific, though
more certain, predictions. One such relatively new approach is the game theoretic model of
endogenous sunk costs, as developed in Sutton (1991, 1998), which largely avoids causal
econometric estimation in favour of robust reduced form relationships that describe the evolution of
R&D spending in conjunction with competition intensity and market structure. Sunk cost theory has
been proven to be robust for a number of different market types in Sutton (1998), Lyons, Matraves,
and Moffat (2001), and Symeonidis (2002).
This study adopts the theoretical framework of sunk costs from Sutton (1991, 1998). Sunk cost theory
rests on the concept of an equilibrium configuration in a multi-stage oligopoly game played in
quantities (a la Cournot) after firms pay an initial sunk cost to enter the market. The equilibrium
profits of any firm present in the final stage of the game can be defined as a linear function of market
size, and as some function of the number of firms in the market and of the degree of competition
2
3
4
5
2
Page 5
intensity. Thus, the equilibrium configuration can be expressed as a condition where the profits of
firms that have paid the sunk cost to enter the market must be non-negative and cover their sunk cost
of entry, but not so large as to generate new entry in equilibrium.
Sutton (1991) broadly divides industries into "exogenous" and "endogenous" sunk cost industries.
Exogenous sunk cost industries have structural characteristics which do not allow for a firm to
increase its demand by spending more on demand shifters such as R&D or advertising. Since such
an industry does not have significant entry barriers (besides the initial fixed sunk cost), as the market
becomes larger the number of firms it can sustain also increases as profits increase proportionally. A
strictly negative relationship therefore exists between concentration and market size, and the
concentration tends towards zero as market size tends towards infinity.
In endogenous sunk cost industries, however, firms can invest in producing higher value added
products (through R&D), or in advertising, and shift their demand outward, increasing their market
share. When market size is relatively small, the benefits to investing in demand shifters are also
small, and an endogenous sunk cost industry behaves in the same way as an exogenous sunk cost
industry in equilibrium. However, as market size passes a certain threshold, the rewards for
increasing market shares grow much higher than the costs of investment and firms compete in
demand-shifter spending prior to the final stage game, creating an additional entry barrier (besides
the initial sunk cost investment) which, as Sutton (1998) proves, produces a constant minimum level
of equilibrium concentration in the market regardless of its size (Figure 1).
6
Figure 1: Lower Bounds in the Presence of Endogenous Sunk Costs
3
Page 6
The basic case of firms in industries where R&D expenditures do not play a large role as demand
curve shifters (that is, in non-technologically intensive industries) is the following. The intensification
of competition via trade creates two contradictory effects that operate simultaneously: (a) the market
size effect, whereby firm access to larger markets and greater potential sales creates new incentives
to innovate and increase R&D spending; and (b) the competition effect, whereby an increase in
competition intensity squeezes profit margins, making firms less able to engage in innovation and
reduces R&D spending. The predicted outcome is ambiguous since for some industries the market
size effect will far outweigh the competition effect (possibly due to easier commercialization or better
differentiation for their product), while for others, the situation would be opposite.
The market size and competition effects still apply in endogenous sunk cost industries, but there is
also the added impact of R&D competition. Following an increase in trade, products become closer
substitutes across countries, intensifying competition in the joint product market as firms in the
industry now compete directly against both domestic and international rivals. As Sutton (1998)
predicts, this also intensifies competition of spending on demand shifters as the incentives to gain
increased shares of a much larger market are greater, and firms escalate R&D spending and increase
the entry costs in the market.
Some firms are inevitably unable to maintain the escalation process for a long time (due to financial
constraints, or to a lower efficiency of production), and proceed to reduce their R&D expenditures
relative to their more efficient competitors. On an international scale, if a majority of firms in a given
industry in one country are better able to sustain the escalation due to some structural asymmetries
such as higher productivity, the escalation and contraction process will be inherently unbalanced.
Namely, firms in the more productive country, who continue to escalate their spending, would
increase their R&D expenditures relative to firms in the less productive country. As a result, firms in
the less productive country, which are unable to pay the sunk costs required to stay in the industry,
would either drop out of the market entirely or move to producing goods that require less R&D and
embody less value added.
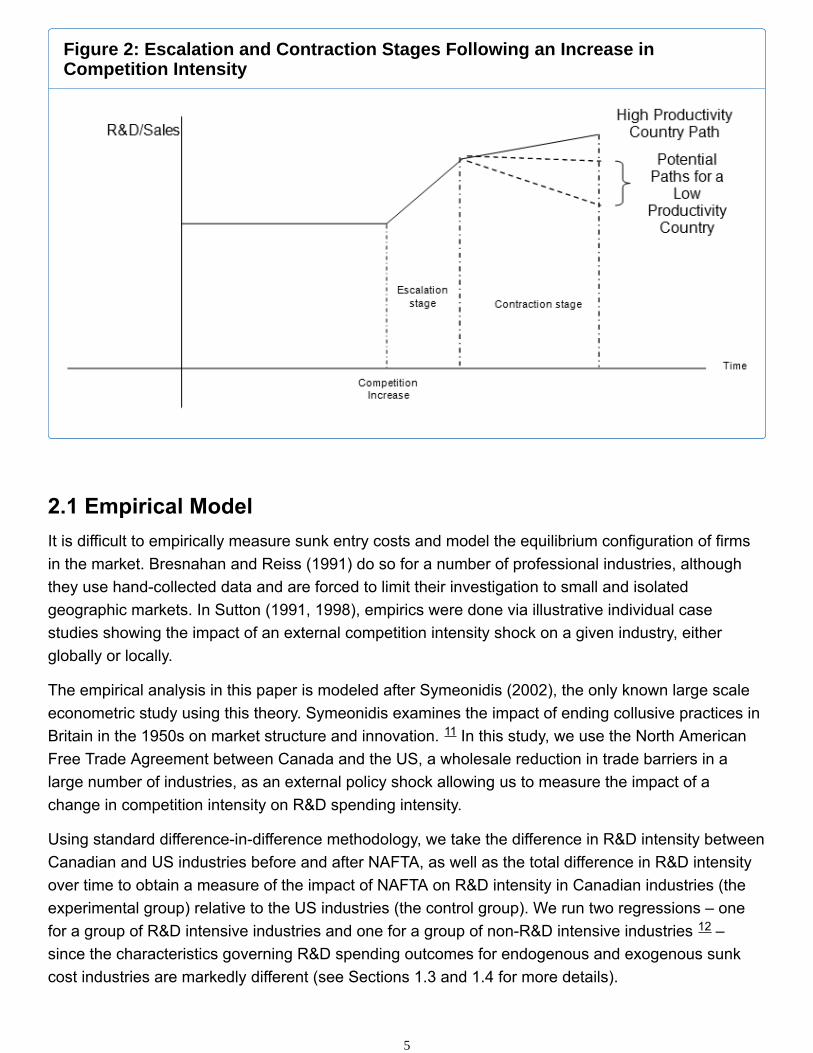
It should be noted that the contraction process does not necessarily leave firms in the less productive
country with a lower innovation intensity compared to the start of the process; theory only predicts
that the paths of high-productivity and low-productivity countries diverge following the contraction
process, expanding the relative innovation gap between them (See Figure 2). Similarly, theory does
not require the low-productivity country to initially have lower R&D intensity than the high productivity
country; the only assured outcome is that their paths diverge following the competition increase.
Lastly, these theoretical predictions are based on the assumption that productivity differences
between the countries are constant over the period examined – that is, it only takes into account the
demand impact of R&D spending and innovation.
7
8
9
10
4
Page 7
It is difficult to empirically measure sunk entry costs and model the equilibrium configuration of firms
in the market. Bresnahan and Reiss (1991) do so for a number of professional industries, although
they use hand-collected data and are forced to limit their investigation to small and isolated
geographic markets. In Sutton (1991, 1998), empirics were done via illustrative individual case
studies showing the impact of an external competition intensity shock on a given industry, either
globally or locally.
The empirical analysis in this paper is modeled after Symeonidis (2002), the only known large scale
econometric study using this theory. Symeonidis examines the impact of ending collusive practices in
Britain in the 1950s on market structure and innovation. In this study, we use the North American
Free Trade Agreement between Canada and the US, a wholesale reduction in trade barriers in a
large number of industries, as an external policy shock allowing us to measure the impact of a
change in competition intensity on R&D spending intensity.
Using standard difference-in-difference methodology, we take the difference in R&D intensity between
Canadian and US industries before and after NAFTA, as well as the total difference in R&D intensity
over time to obtain a measure of the impact of NAFTA on R&D intensity in Canadian industries (the
experimental group) relative to the US industries (the control group). We run two regressions – one
for a group of R&D intensive industries and one for a group of non-R&D intensive industries –
since the characteristics governing R&D spending outcomes for endogenous and exogenous sunk
cost industries are markedly different (see Sections 1.3 and 1.4 for more details).
Figure 2: Escalation and Contraction Stages Following an Increase inCompetition Intensity
11
12
5
Page 8
The estimating equation (for industry i, at time t, and in country c) is, therefore:
= β0 + β1 + β2 + β3 + β4 CANADA* + D + ∂ tc
Where is R&D intensity, is a country dummy (which is 1 for Canadian
industries), is a dummy for whether the industry is in the period before or after NAFTA,
CANADA* is the interaction term between the two, is a vector of industry fixed effects,
and ∂ is the residual term, which in particular may reflect measurement error across the sample.
is the logarithm of median firm sales divided by total sales in the market. This variable
controls for the relative size of Canadian and US firms in a given industry. It is an important control,
since there are heterogeneities in firm and market size which should play an important role in the
R&D spending escalation and contraction process following NAFTA.
β4 is the coefficient which measures the 'difference in differences' of R&D intensity for the
experimental group of Canadian industries relative to their United States counterparts after the overall
effects of NAFTA have been accounted for. As such, it is the variable of interest here. Since
numerous studies show that Canadian industries lag their US counterparts in productivity and
productivity growth, we expect this coefficient to be negative for endogenous sunk cost industries.
This study uses a sample of R&D intensive industries and a sample of non R&D intensive industries
in Canada and the US to create two unbalanced panels covering the 1987-2002 period. By choosing
this time-span, we are able to compare between the 1987–1994 and 1995–2002 sub-periods, which
gives us ample sample space to estimate differences in R&D spending trends before and after
NAFTA.
Following the selection process of Symeonidis (2002), seven industries with an R&D spending to
sales ratio greater than 1% and with the highest number of observations for Canada and the US were
selected as the endogenous sunk cost group for this study. Seven other industries where R&D
spending as a share of firms' sales rarely moved above the 1% threshold were selected to be the
exogenous sunk cost group.
i i
13
14
15
16
17
18
6
Page 9
Industry Sample
R&D Intensive Industries Non R&D Intensive Industries
Industry NAICS Industry NAICS
Fibers Manufacturing 3252 Textile Product Mills Manufacturing 314
Pharmaceutical Manufacturing 3254 Paper Manufacturing 322
Computer Equipment Manufacturing 3341 Petroleum and Coal Products
Manufacturing
324
Communications Equipment Manufacturing 3342 Non-Metallic Mineral
Manufacturing
327
Semiconductor and Other Electronic
Components Manufacturing
3344 Iron and Steel Mills and Alloys
Manufacturing
3311
Navigation, Measuring and Electromedical
Instrument Manufacturing
3345 Alumina and Aluminum Production
and Processing
3313
Aerospace Product and Parts Manufacturing 3364 Forging and Stamping Industry 3321
Due to data limitations, it was only possible to obtain complete data for R&D intensive industries at
the 4 digit NAICS level for Canada and the US. Data was even more limited for the non-R&D
intensive group, resulting in the use of a combination of 3 and 4 digit industries in the sample. This is
a much higher aggregation than the one Sutton (1998) uses – a 5 digit SIC industry – although
Symeonidis (2002) successfully uses similarly aggregated three and four digit SIC industries.
Three primary data sets are used for data on sales and R&D expenditures in industries: The annual
Research and Development in Canadian Industry survey from Statistics Canada, the Survey of
Industrial Research and Development from the National Science Foundation and the US Census
Bureau, and the OECD's Structural Analysis STAN database. Additional data, such as the median
firm size relative to total industry sales came from the Bureau of Economic Analysis in the US and
from Statistics Canada. 19
7
Page 10
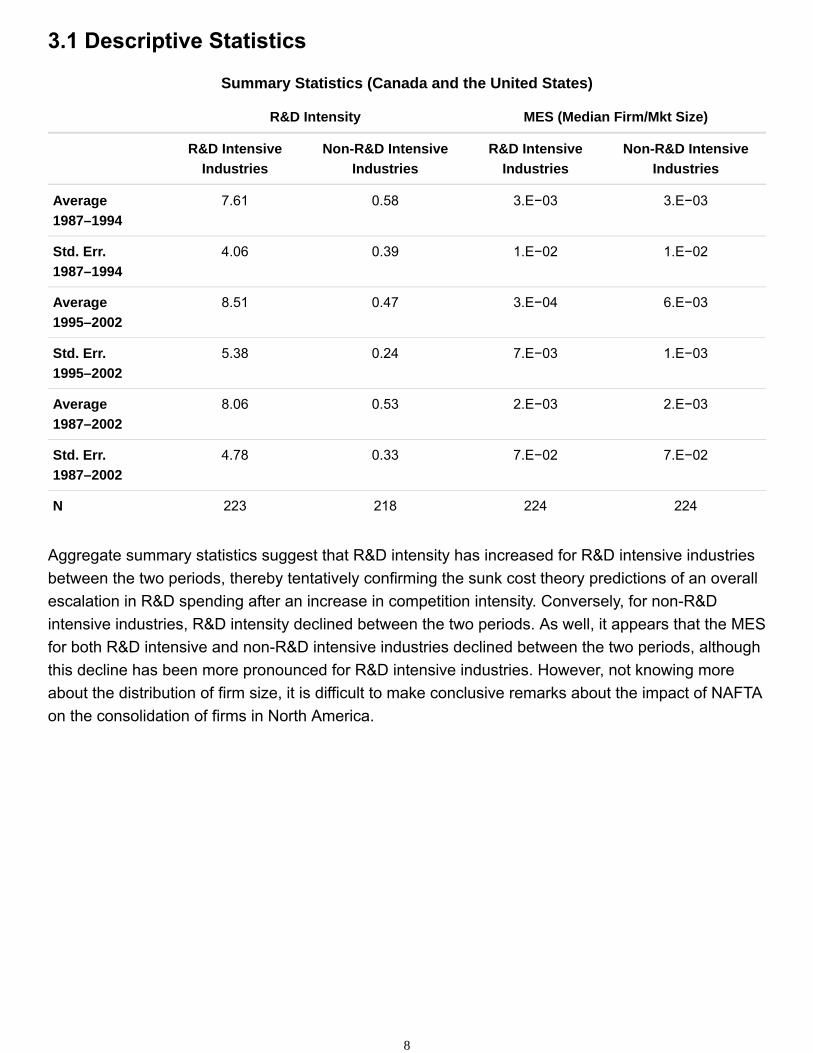
Summary Statistics (Canada and the United States)
R&D Intensity MES (Median Firm/Mkt Size)
R&D Intensive
Industries
Non-R&D Intensive
Industries
R&D Intensive
Industries
Non-R&D Intensive
Industries
Average
1987–1994
7.61 0.58 3.E−03 3.E−03
Std. Err.
1987–1994
4.06 0.39 1.E−02 1.E−02
Average
1995–2002
8.51 0.47 3.E−04 6.E−03
Std. Err.
1995–2002
5.38 0.24 7.E−03 1.E−03
Average
1987–2002
8.06 0.53 2.E−03 2.E−03
Std. Err.
1987–2002
4.78 0.33 7.E−02 7.E−02
N 223 218 224 224
Aggregate summary statistics suggest that R&D intensity has increased for R&D intensive industries
between the two periods, thereby tentatively confirming the sunk cost theory predictions of an overall
escalation in R&D spending after an increase in competition intensity. Conversely, for non-R&D
intensive industries, R&D intensity declined between the two periods. As well, it appears that the MES
for both R&D intensive and non-R&D intensive industries declined between the two periods, although
this decline has been more pronounced for R&D intensive industries. However, not knowing more
about the distribution of firm size, it is difficult to make conclusive remarks about the impact of NAFTA
on the consolidation of firms in North America.
8
Page 11
Summary Statistics
Canada United States
R&D Intensity
MES (Median Firm/Mkt
Size) R&D Intensity
MES (Median Firm/Mkt
Size)
R&D
Intensive
Industries
Non-R&D
Intensive
Industries
R&D
Intensive
Industries
Non-R&D
Intensive
Industries
R&D
Intensive
Industries
Non-R&D
Intensive
Industries
R&D
Intensive
Industries
Non-R&D
Intensive
Industries
Average
1987–1994
8.00 0.47 6.E−03 6.E−03 7.23 0.68 8.E−05 6.E−04
Std. Err.
1987–1994
4.64 0.30 1.E−02 1.E−02 3.41 0.44 2.E−04 1.E−03
Average
1995–2002
8.52 0.39 6.E−04 1.E−03 8.51 0.55 5.E−05 2.E−04
Std. Err.
1995–2002
6.12 0.20 1.E−03 1.E−03 4.57 0.25 9.E−05 3.E−04
Average
1987–2002
8.26 0.43 3.E−03 3.E−03 7.87 0.61 7.E−05 4.E−04
Std. Err.
1987–2002
5.41 0.26 1.E−02 1.E−02 4.06 0.37 1.E−04 1.E−03
N 111 106 112 112 112 112 112 112
When separated by country, summary statistics show that Canadian industries' R&D intensity growth
is 10% lower than their US counterparts, perhaps suggesting that less productive Canadian firms are
unable to maintain the spending escalation at the United States rate. It also appears that the MES
in Canada is larger than that of the United States although this likely only reflects Canada's smaller
market size.
An issue which comes out of the descriptive statistics is that Canada appears to have higher R&D
intensity than the United States for the group of R&D intensive industries, which runs counter to the
common perception (as confirmed by aggregate statistics) that Canadian firms have lower R&D
intensity than United States firms. This may indicate problems with the data, or that a sample
selection bias exists in the analysis. However, both of these are unlikely. Previous studies, such as ab
Iorweth (2005), also find that Canada has a higher R&D intensity than the United States for multiple
R&D intensive industries, but cannot explain this or find any evidence that these industries are
markedly different than other similarly structured Canadian industries. Additionally, as stated before,
sunk cost theory does not require that industries in low productivity countries should have lower R&D
spending than industries in high-productivity countries. In fact, the absolute values are irrelevant,
since the predictions center on relative trends.
20
9
Page 12
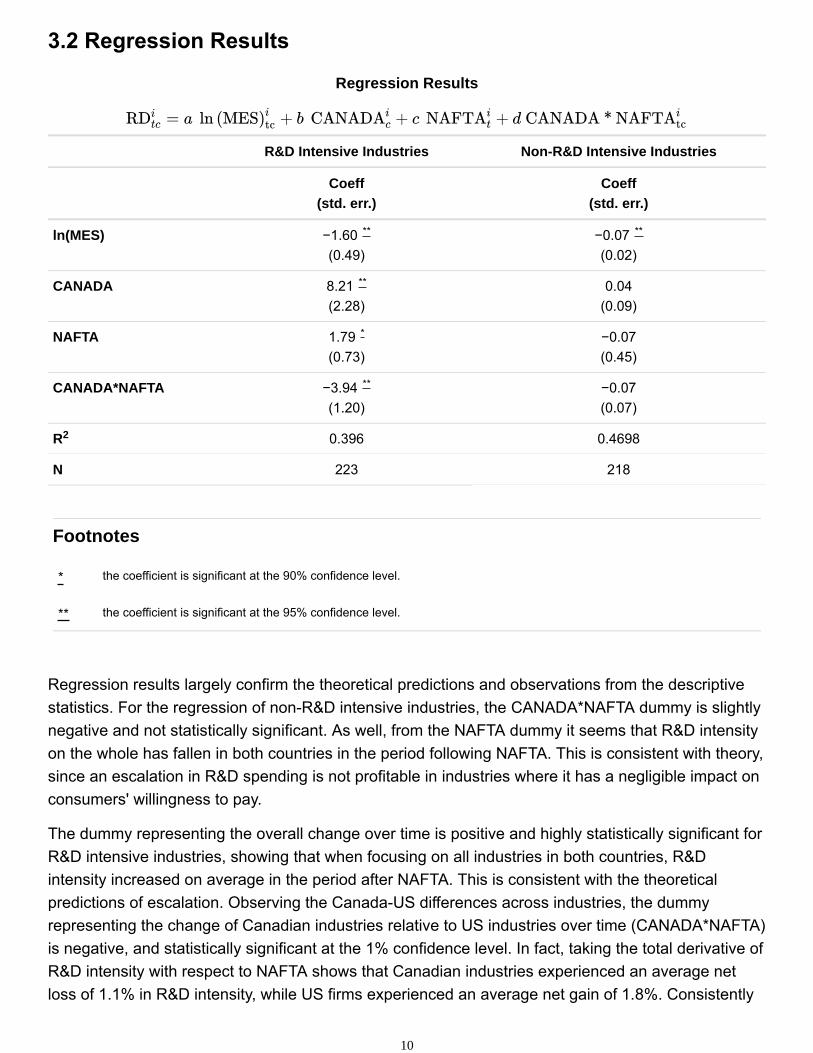
Regression Results
R&D Intensive Industries Non-R&D Intensive Industries
Coeff
(std. err.)
Coeff
(std. err.)
Footnotes
ln(MES) −1.60
(0.49)
−0.07
(0.02)
CANADA 8.21
(2.28)
0.04
(0.09)
NAFTA 1.79
(0.73)
−0.07
(0.45)
CANADA*NAFTA −3.94
(1.20)
−0.07
(0.07)
R 0.396 0.4698
N 223 218
Regression results largely confirm the theoretical predictions and observations from the descriptive
statistics. For the regression of non-R&D intensive industries, the CANADA*NAFTA dummy is slightly
negative and not statistically significant. As well, from the NAFTA dummy it seems that R&D intensity
on the whole has fallen in both countries in the period following NAFTA. This is consistent with theory,
since an escalation in R&D spending is not profitable in industries where it has a negligible impact on
consumers' willingness to pay.
The dummy representing the overall change over time is positive and highly statistically significant for
R&D intensive industries, showing that when focusing on all industries in both countries, R&D
intensity increased on average in the period after NAFTA. This is consistent with the theoretical
predictions of escalation. Observing the Canada-US differences across industries, the dummy
representing the change of Canadian industries relative to US industries over time (CANADA*NAFTA)
is negative, and statistically significant at the 1% confidence level. In fact, taking the total derivative of
R&D intensity with respect to NAFTA shows that Canadian industries experienced an average net
loss of 1.1% in R&D intensity, while US firms experienced an average net gain of 1.8%. Consistently
the coefficient is significant at the 90% confidence level.*
the coefficient is significant at the 95% confidence level.**
** **
**
*
**
2
10
Page 13
with theory, it appears that despite an absolute increase in R&D investment, Canadian R&D intensive
industries lost some ground compared to similar US industries in the period after NAFTA.
Using Canadian and US industry level data for 1987–2002, the findings of this paper provide some
systematic empirical evidence on the impact of an increase in competition intensity via globalization
on innovation intensity in countries with heterogeneous productivity levels (holding relative
productivity levels constant). The evidence is consistent with the theoretical model of endogenous
sunk costs and suggests that an exogenous increase in competition in the post NAFTA period
produced an absolute increase in R&D investment in R&D intensive industries in Canada and the US.
However, the less productive Canadian industries fell relative to their US counterparts in R&D
intensity levels.
These results potentially suggest some answers to the generally accepted but unexplained stylized
fact, that despite Canada's extensive R&D support programs , the R&D intensity gap between
Canada and the United States has persisted over the last twenty years. These results are also
consistent with recent studies which find Canadian firms to be less innovative in their strategic outlook
compared to their US counterparts.
Of course, it should be noted that this study is a simple difference-in-difference comparison between
two periods; as such, it does not present evidence of a definitive causal link between NAFTA and
innovation investment patterns, but merely a suggestion regarding the form such a link might take. In
addition, the economic impact of trade on firms varies depending on factors such as their products,
location, and size (Melitz 2003). This study uses industry level data, and as such it fails to incorporate
firm heterogeneity into the analysis – particularly important since evidence suggests that large firms
(500+ employees) explain much of the R&D investment gap between Canada and the US
(Songsakul, Lau, and Boothby 2008). Future research should use firm level data in examining
changes in the dynamic investment process of firms following an increase in competition intensity.
Sutton's theory suggests that firms which lag in R&D investment in R&D intensive markets are forced
to either exit the markets entirely, or to focus on producing lower value added goods which require
less technological inputs. It is unclear whether this occurred in the period following NAFTA, and it
could be examined further using appropriate data.
This paper also assumes that productivity differences between the two countries are constant over
the period examined – it does not take into account the supply side impact of investment in
innovation. Expanding the study to incorporate the possibility that investing in innovation does not
only expand demand but also improves efficiency could produce further insights into the interaction
between innovation, competition and market structure following globalization.
21
11
Page 14
Acemoglu, D. and J. Linn (2004) "Market Size in Innovation: Theory and Evidence from the
Pharmaceutical Industry," The Quarterly Journal of Economics, MIT Press, vol. 119(3), pp.
1049-1090.
ab Iorweth, A. (2005) "Canada's Low Business R&D Intensity: the Role of Industry Composition,"
Working Papers-Department of Finance Canada 2005-03, Department of Finance Canada.
Aghion P, N. Bloom, R. Blundell, R. Griffith and P. Howitt (2005) "Competition and Innovation: An
Inverted-U Relationship," The Quarterly Journal of Economics, MIT Press, vol. 120(2), pp.
701-728.
Boone, J. (2000) "Competitive Pressure: The Effects on Investments in Product and Process
Innovation," RAND Journal of Economics, vol. 31(3), pp. 549-569.
Bresnahan, T. and Peter C. Reiss (1991) "Entry and Competition in Concentrated Markets," The
Journal of Political Economy, vol. 99(5), pp. 997-1009.
Chen, Z. (2006) "Rivalry, Market Structure and Industrial Competitiveness: Issues and Evidence,"
Industry Canada Mimeograph.
Demsetz, H. (1973), "Industry Structure, Market Rivalry and Public Policy," Journal of Law and
Economics, vol. 16(1), pp. 1-9.
Griliches, Z. (1957) "Hybrid Corn: An Exploration in the Economics of Technological Change",
Econometrica, 25, pp. 501-522.
Kamien, L. and N. L. Schwartz (1982) Market Structure and Innovation. Cambridge: Cambridge
University Press.
Lyons, B.R, Catherine Matraves, and Peter Moffat (2001) "Industrial Concentration and Market
Integration in the European Union," Economica, vol. 68(269), pp. 1-26.
Melitz, M.J. (2003) "The Impact of Trade on Intra-Industry Reallocations and Aggregate Industry
Productivity, " Econometrica, vol. 71 (6), pp. 1695-1725.
National Science Foundation, Division of Science Resources Studies (1999) Research and
Development in Industry: 1995–96, NSF 99-312.
National Science Foundation, Division of Science Resources Statistics (2006)
Research and Development in Industry: 2003. NSF 07-314.
OECD (2003) OECD Economic Outlook, Volume 2003, Issue 1, Paris: OECD.
12
Page 15
OECD (2006) OECD Science, Technology, and Industry Outlook, Paris: OECD.
OECD (2008) Main Science and Technology Indicators, Volume 2008, Release 2, Paris: OECD.
Rao, S. and Andrew Sharpe (2002) eds., Productivity Issues in Canada, Calgary:University of
Calgary Press.
Rao, S. Jianmin Tang, and Weimin Wang (2004) "Measuring the Canada-US Productivity Gap:
Industry Dimensions" International Productivity Monitor, 9, pp. 3-14.
Scherer, F.M. (1967) "Market Structure and the Employment of Scientists and Engineers." American
Economic Review, vol. 57(3), pp. 524–531.
Schumpeter, J. A. (1934) The Theory of Economic Development. New Brunswick, NJ: Transaction
Publishers.
Shaked, A. and John Sutton (1987) "Product Differentiation and Industrial Structure." Journal of
Industrial Economics, vol. 36(2), pp. 131-146.
Songsakul, Thitima, Bernice Lau and Daniel Boothby (2008) "Firm Size and Research and
Development Expenditures: A Canada-U.S. Comparison". Mimeo, Industry Canada
Statistics Canada (2000) Industrial Research and Development: 1999 Intentions, Catalogue no.
88-202-XIB.
Statistics Canada (2006) Industrial Research and Development: 2005 Intentions, Catalogue no.
88-202-XIE.
Sutton, J. (1991) Sunk Costs and Market Structure, Cambridge, Mass: MIT Press.
Sutton, J. (1998) Technology and Market Structure, Cambridge, Mass: MIT Press.
Symeonidis, G. (2002) The Effects of Competition: Cartel Policy and the Evolution of Strategy and
Structure in British Industry, Cambridge, Mass: MIT Press.
13
Page 16
Footnotes
As detailed in Symeonidis (1997), and Kamien and Schwartz (1982), among others.1
e.g. Aghion, Harris and Vickers (1997) and Aghion, Harris, Howitt and Vickers (2001).2
Such as Scherer (1967), Kamien and Schwartz (1982) and Aghion et al (2005).3
Among other failures, in much of the literature, a greater degree of market power is often equated with a
higher level of concentration, which has been proven to be both theoretically and empirically incorrect. For
more details, see Demsetz (1973) and Boone (2000).
4
The model can be applied to a variety of market structures, and it has been explored in depth in other
papers dealing with oligopoly games and entry and exit - such as Bresnahan and Reiss (1991).5
This assertion draws on Shaked and Sutton (1987), which states that in an industry where consumers are
willing to spend more on products of higher quality, a high quality incumbent cannot be pushed out of the
market by a low quality entrant, regardless of how the low-quality product is priced.
6
See, among others, Girliches (1957), and more recently Acemoglu and Linn (2004).7
This process is described in Sutton (1991) for the frozen foods industry. Following deregulation, producers
of frozen foods separated into two groups – large producers who invested heavily in advertising and sold
their products on the commercial market (i.e. in supermarkets), and small producers who did not invest in
advertising at all and sold their products to bulk suppliers. As well, a similar process is described in Melitz
(2003), as high productivity firms take on a majority of an industry's trade following an exogenous increase
in competition intensity.
8
The chain of events described here becomes more complicated if the investment in innovation does not
only push demand outward, but also reduce the costs of production. This analysis is beyond the scope of
the current paper.
9
In fact, it could have higher R&D spending due to various factors such as mandated government rules.10
Specifically, Symeonidis' empirical model regressed the number of patents produced by the industry (a
measure of R&D output) on the logarithm of market size, the logarithm of set-up costs of a firm in a given
industry, and time dummies that represent the changes in competition policy between different periods.
11
Note: according to theory, firms invest in R&D only if it is profitable. As a result, industries with high R&D
intensity ratios are assumed to have the characteristics of endogenous sunk cost industries, and the two
terms are used interchangeably in this paper.
12
Defined, for a given industry, as the total R&D spending of R&D producing firms, divided by the total sales
of these firms, multiplied by 100%.13
We take 1994-5 as the breakpoint, since although NAFTA was signed in 1992, its consequences were not
truly felt until the mid 1990s.14
14
Page 17
Additional controls such as bilateral tariff rates for the two groups of industries were experimented with, but
did not add explanatory value to the endogenous sunk cost regression and did not change the main results
of the exogenous sunk cost regression.
15
A similar issue is discussed in Sutton (1998) when examining the impact of a loosening of international
trade barriers on the electronic telecommunications equipment industry. Specifically, the French
telecommunications firm Alcatel, which enjoyed a near monopoly of the French market, succeeded in
surviving the escalation in R&D spending and expand internationally. In other countries where market
shares were small, the firms could not maintain the escalation process, and they either left the industry, or
they were taken over by larger foreign firms.
16
See Rao and Sharpe (2002), Rao, Tang and Wang (2004), or Chen (2006) for recent Canada-US
productivity comparisons.17
In addition to this rationale, most of the selected industries were used in previous sunk costs studies. For
example, Sutton (1998) uses the aerospace parts manufacturing industry as one of the major endogenous
sunk cost cases, and Symeonidis (2002) includes all of the industries in the sample under the endogenous
sunk cost category as well. While this may introduce some sample selection bias and tautology into the
results, testing the effect of changes in competition on R&D spending according to Sutton's theory does
require specific industry characteristics to be apparent, which this classification accomplishes.
18
Due to data limitations, it has only been possible to include the 1997 and 2002 values for this variable.
Other values have been interpolated using the market size annual growth rates, under the restricting
assumption that the median sized firm also grew proportionally.
19
Note that the growth of R&D intensity in both countries is not a statistical artifact driven by the sales with
actual R&D spending held constant. For both Canadian and US industries, R&D expenditure is the main
driver of changes in R&D intensity.
20
Canadian R&D support programs include venture capital support for entrepreneurs, tax incentives for R&D
performance by firms, as well as some explicit regulations forcing firms to invest a certain percentage of
their profits in research and development in the Pharmaceutical industry. These programs receive
generous funding, as evidenced by OECD (2006) ranking Canada's government tax incentives for
innovation as highest of all G7 countries.
21
15