International Conference: International Conference: “ “ Global Global and Regional Climate Changes and Regional Climate Changes ” ” Kyiv, Ukraine Kyiv, Ukraine 16 16 - - 19 Nov, 2010 19 Nov, 2010 Decisionmaking Decisionmaking for Climate for Climate Adaptation in the Water Sector Adaptation in the Water Sector Eugene Z. Stakhiv (3EHOH CTAXIB) UNESCO-ICIWaRM and Institute for Water Resources U.S. Army Corps of Engineers
Transcript
International Conference: International Conference: ““Global Global and Regional Climate Changesand Regional Climate Changes””
DecisionmakingDecisionmaking for Climatefor ClimateAdaptation in the Water SectorAdaptation in the Water Sector
Eugene Z. Stakhiv(3EHOH CTAXIB)
UNESCO-ICIWaRMand
Institute for Water ResourcesU.S. Army Corps of Engineers
Transitioning to Transitioning to AdaptationAdaptationunder Climate Uncertaintyunder Climate Uncertainty
How to deal with risk, uncertainty and How to deal with risk, uncertainty and ‘‘unknownsunknowns’’ in decision making?in decision making?WeWe’’re in a re in a 2020--year transition periodyear transition period before before good information and reliable models become good information and reliable models become available.available.How to deal with nonHow to deal with non-- stationary climate?stationary climate?Role of Role of GCMsGCMs in evaluation of water resources in evaluation of water resources management optionsmanagement optionsAre the current methods (i.e. stochastic Are the current methods (i.e. stochastic hydrology) hydrology) ‘‘good enoughgood enough’’ to deal with to deal with uncertainty?uncertainty?Are there practical engineering design methods Are there practical engineering design methods to deal with to deal with ‘‘robustnessrobustness’’, , ‘‘resiliencyresiliency’’ and and ‘‘reliabilityreliability’’ ??
Recent AssessmentRecent Assessment of Climate Modelsof Climate Models
Regional trends in extreme events are not always captured by current models
It is difficult to assess the significance of these discrepancies and to distinguish between model deficiencies and natural variability
How Accurate Are Global Climate Models?
Context for Climate Change and Sustainable Context for Climate Change and Sustainable Development: Levels of Analysis for aDevelopment: Levels of Analysis for aConventional Risk Mgmt FrameworkConventional Risk Mgmt Framework
IWRIWRManagementManagementof Water Sectorsof Water Sectors
Integrated Drought
Mgmt
IntegratedFlood
Management
Urban Water Supply
EcologicalFlows
Hydro-power
CommercialNavigation
Irrigation& Drainage
Integrated Water Resources Management
Integrated River Basin (Watershed) Management
Water Sector Focus is on Water Sector Focus is on Risk ManagementRisk Management for for Climate VariabilityClimate Variability (which is foundation for CC)(which is foundation for CC)
In In transition period,transition period, need new/extended methods for need new/extended methods for flood/drought frequency analysis under nonflood/drought frequency analysis under non--stationary stationary climate, with trends.climate, with trends.
Different methods for incorporating Different methods for incorporating Climate Information into Water Climate Information into Water Sector Project Planning/DesignSector Project Planning/Design
GCM scenario analysisGCM scenario analysis (test plans for (test plans for robustness, resiliency, reliability)robustness, resiliency, reliability)Traditional Traditional Stochastic analysisStochastic analysis of historic of historic datadataHindcastingHindcasting based on based on dendroclimatologydendroclimatology& statistical & statistical ‘‘voodoovoodoo’’ to extend records to extend records Extending Extending existing statistical tools & existing statistical tools & modelsmodels (e.g. LP3 (e.g. LP3 ‘‘fatfat--tailedtailed’’ distribdistrib--GEV)GEV)GCM downscalingGCM downscaling and derived frequency and derived frequency analysis (not ready for analysis (not ready for ‘‘prime timeprime time’’).).
Conventional Mechanisms for Adapting to Conventional Mechanisms for Adapting to Climate UncertaintiesClimate Uncertainties
Planning Planning new investmentsnew investments, or for capacity expansion , or for capacity expansion (reservoirs, irrigation systems, levees, water supply, (reservoirs, irrigation systems, levees, water supply, wastewater treatment)wastewater treatment)Operation & regulationOperation & regulation of existing systems: of existing systems: accommodating new uses or conditions (e.g. ecology, accommodating new uses or conditions (e.g. ecology, climate change, population growth)climate change, population growth)Maintenance and Maintenance and majormajor rehabilitationrehabilitation of existing of existing systems (e.g. dams, barrages, irrigation systems, systems (e.g. dams, barrages, irrigation systems, canals, pumps, etc.)canals, pumps, etc.)Modifications in Modifications in processes and demandsprocesses and demands (water (water conservation, pricing, regulation, legislation)conservation, pricing, regulation, legislation)Introduce new Introduce new efficient technologiesefficient technologies (desalting, (desalting, biotechnology, drip irrigation, wastewater reuse, biotechnology, drip irrigation, wastewater reuse, recycling, solar energy )recycling, solar energy )
Functions/Elements of Water Resources Management
Corps Reservoir Operations:Corps Reservoir Operations:Revising/Updating RegulationsRevising/Updating Regulations
Reservoir Master manual
Emergency Operations[ER 11-1-320]
Standard ProjectFloods
[EM 1110-2-1411]
Inflow Design Floods
[ER-1110-8-2]
Review of Completed Projects
[ER 1105-2-100;ER 1165-2-119]
Dam Safety Assurance Program
[ER 1110-2-1155]
Management of Water Control
Systems[EM 1110-2-3600]
Water ControlManagement[ER 1110-2-240]
Drought ContingencyPlans
[ER 1110-2-1941
Corps’ Dam Safety Portfolio Risk Management Process
Risk Informed Priorities for Permanent Risk Reduction
Tolerable Risk Guidelines
Interim Risk Reduction Measures
Issue Evaluation Studies
Dam Safety Modification Reports
Periodic Inspections/Periodic
Assessments/Asset Management
National Dam Safety Program
Routine Inspections: Verifies O&M, More Rigorous Standards, Improved Communication, System-based, Every Year
Periodic Inspections:Verifies O&M, Evaluates Structure Stability, Compares Constructed Criteria to Current Criteria, Every 5 Years
Risk Assessments:Data Intensive, Determine Likelihood and Consequences of Failure, Every 10 Years
Increasing Rigor
Periodic Assessments:Periodic Inspection + Potential Failure Mode and Consequences Analysis, Every 5 Years
Levee Screening: Begin to categorizing.
National Levee Safety Program
Continuous Feedback
Mission: Assess integrity and viability of levees, recommend actions to assure levee systems do not present unacceptable risks to public, property, environment.
11 Water Oriented Agencies11 Water Oriented AgenciesMeet quarterly to align and unify federal Meet quarterly to align and unify federal
floodplain and risk management floodplain and risk management programs and issuesprograms and issues
ReRe--instituted September 2009instituted September 2009Developing fiveDeveloping five--year work planyear work planConducting public listening sessionsConducting public listening sessionsDrafting updated Executive Order Drafting updated Executive Order
Federal Interagency Floodplain Management Task Force
16th century “megadrought”>100 year “megadroughts”
2000-year Climate history of central U.S.
DustBowl
2000 yrs. ago Today
Source: Overpeck 2004
The US Breadbasket: The Mid-West
Uncertainty and Flood Damage CalculationUncertainty and Flood Damage Calculation(Corps of Engineers Procedures (Corps of Engineers Procedures -- HECHEC--FDA;1992)FDA;1992)
Floo
d St
age
(S)
Floo
d St
age
(S)
Flood Discharge (Q)
Flood Discharge (Q)
Freq
uenc
y
Freq
uenc
y
Flood Damage (D)
Flood Damage (D)
Q
S
P
Q
P
D
S
D
UEB - Upper Error Bound
LEB - Lower Error Bound
UEB
LEB
ENSO Floods: LP3 distributionENSO Floods: LP3 distributionMississippi River at Hannibal, Missouri
10000
100000
1000000
-3 -2 -1 0 1 2 3 4
Cumulative Probability (in Units of Standard Deviation)
Discounted Discounted AvgAvg Annual Net Annual Net Benefits (Benefits Benefits (Benefits –– Costs)Costs)
0.95
(25.0)
(40.0)
(155.0)
(30.0)
(20.0)
(300.0)
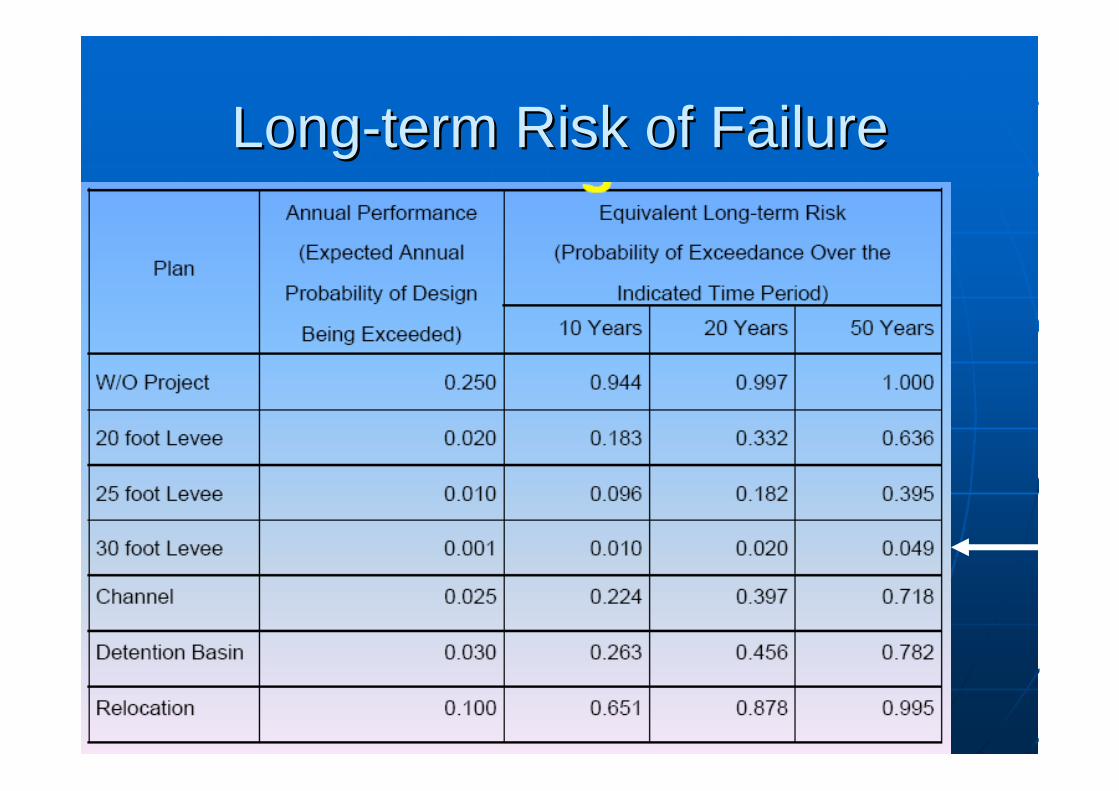
LongLong--term Risk of Failure term Risk of Failure
Uncertainty and Flood Damage CalculationUncertainty and Flood Damage Calculation(Corps of Engineers Procedures (Corps of Engineers Procedures -- HECHEC--FDA;1992)FDA;1992)
Discharge Recurrence Intervals for Different Discharge Recurrence Intervals for Different Frequency Distributions:Frequency Distributions:
100100--year event GEV distribution = 225year event GEV distribution = 225--year event on LP3year event on LP3
0
5000
10000
15000
20000
25000
30000
35000
0 50 100 150 200
Recurrence Interval (years)
Disc
harg
e (c
fs)
GEVLP3Gumbel
CONCLUSIONSCONCLUSIONSFlood and Drought Management are the Flood and Drought Management are the ‘‘leading edgeleading edge’’of any pragmatic adaptation strategy of any pragmatic adaptation strategy –– both for both for ‘‘managedmanaged’’ and and rainfedrainfed systems.systems.Stochastic hydrology is still a useful way of dealing Stochastic hydrology is still a useful way of dealing with climate uncertaintywith climate uncertaintyThe best way to deal with uncertainty is to use proven The best way to deal with uncertainty is to use proven engineering design methods to upgrade engineering design methods to upgrade resiliency,resiliency,robustness and reliability,robustness and reliability,IWRM is the accepted paradigm/context for dealing IWRM is the accepted paradigm/context for dealing with climate adaptation and adaptive managementwith climate adaptation and adaptive managementTransitional pragmatic economic evaluation and Transitional pragmatic economic evaluation and engineering design tools needed in absence of good engineering design tools needed in absence of good information from information from GCMsGCMs and forecasting modelsand forecasting modelsExpansion and improvement of current Expansion and improvement of current hydromethydrometmonitoring systems is essential to effective climate monitoring systems is essential to effective climate adaptation adaptation –– espesp adaptive managementadaptive managementEconomic decision criteria dominate any adaptation Economic decision criteria dominate any adaptation responses responses –– need to be revisedneed to be revised
Finis-Merci
1 0.5 0.2 0.1 0.05 0.02 0.01 0.005 0.002 0.001 Probability of Exceedance
•Presently, the accuracy of regional-scale climate model fall short of meeting the requirements of water resources planning.
• The value of Traditional stochastic hydrologymethods should not be underestimated. Research is required to advance their capability to address Hydroclimate decision making needs.
Concluding points
Factoring in Resiliency in water resources systems design and planning is still the safest approach!
NOAA: El NiNOAA: El Niñño to Help Steer U.S. o to Help Steer U.S. Winter Weather (Winter Weather (October 15, 2009)October 15, 2009)
NOAA Highlights of the U.S. Winter Outlook NOAA Highlights of the U.S. Winter Outlook (December through February) include:(December through February) include:
WarmerWarmer--thanthan--average temperaturesaverage temperatures are favored across much of the western are favored across much of the western and central U.S., especially in the northand central U.S., especially in the north--central states from Montana to central states from Montana to
Wisconsin. Though temperatures may average warmer than usual, peWisconsin. Though temperatures may average warmer than usual, periodic riodic outbreaks of cold air are still possible. outbreaks of cold air are still possible.
BelowBelow--average temperaturesaverage temperatures are expected across the Southeast and midare expected across the Southeast and mid--Atlantic from southern and eastern Texas to southern PennsylvaniAtlantic from southern and eastern Texas to southern Pennsylvania and south a and south
through Florida. through Florida. AboveAbove--average precipitationaverage precipitation is expected in the southern border states, is expected in the southern border states,
especially Texas and Florida. Recent rainfall and the prospects especially Texas and Florida. Recent rainfall and the prospects of more should of more should improve current drought conditions in central and southern Texasimprove current drought conditions in central and southern Texas. However, . However,
tornado records suggest that there will also be an increased chatornado records suggest that there will also be an increased chance of organized nce of organized tornado activity for the Gulf Coast region this winter. tornado activity for the Gulf Coast region this winter.
DrierDrier--thanthan--averageaverage conditions are expected in the Pacific Northwest and the conditions are expected in the Pacific Northwest and the Ohio and Tennessee River Valleys. Ohio and Tennessee River Valleys.
NortheastNortheast: Equal chances for above: Equal chances for above--, near, near--, or below, or below--normal temperatures and normal temperatures and precipitation. Winter weather in this region is often driven notprecipitation. Winter weather in this region is often driven not by El Niby El Niñño but by o but by weather patterns over the northern Atlantic Ocean and Arctic, suweather patterns over the northern Atlantic Ocean and Arctic, such as the North ch as the North Atlantic Oscillation. These patterns are often more shortAtlantic Oscillation. These patterns are often more short--term, and are generally term, and are generally
predictable only a week or so in advance. predictable only a week or so in advance. California:California: A slight tilt in the odds toward wetterA slight tilt in the odds toward wetter--thanthan--average conditions over average conditions over
the entire state. the entire state. Alaska:Alaska: MilderMilder--thanthan--average temperatures except along the western coast. Equal average temperatures except along the western coast. Equal chances for abovechances for above--, near, near--, or below, or below--median precipitation for most areas except median precipitation for most areas except
above median for the northwest. above median for the northwest. Hawaii:Hawaii: BelowBelow--average temperatures and precipitation are favored for the entiraverage temperatures and precipitation are favored for the entire e
state.. state.. This seasonal outlook does not predict where and when snowstormsThis seasonal outlook does not predict where and when snowstorms may hit or may hit or
total seasonal snowfall accumulations. Snow forecasts are dependtotal seasonal snowfall accumulations. Snow forecasts are dependent upon winter ent upon winter storms, which are generally not predictable more than several dastorms, which are generally not predictable more than several days in advance.ys in advance.
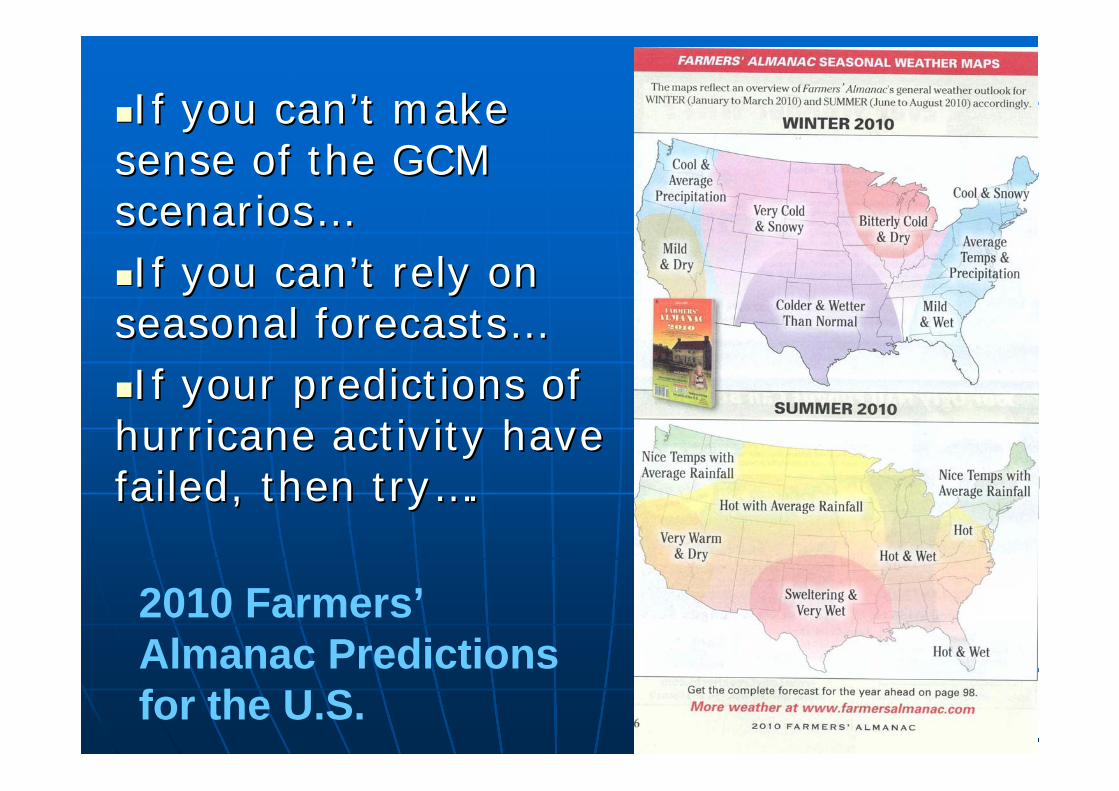
If you canIf you can’’t make t make sense of the GCM sense of the GCM scenariosscenarios……If you canIf you can’’t rely on t rely on
seasonal forecastsseasonal forecasts……If your predictions of If your predictions of
hurricane activity have hurricane activity have failed, then tryfailed, then try……..
2010 Farmers’Almanac Predictions for the U.S.
Uncertainty and Flood Damage CalculationUncertainty and Flood Damage Calculation(Corps of Engineers Procedures (Corps of Engineers Procedures -- HECHEC--FDA;1992)FDA;1992)
Floo
d St
age
(S)
Floo
d St
age
(S)
Flood Discharge (Q)
Flood Discharge (Q)
Freq
uenc
y
Freq
uenc
y
Flood Damage (D)
Flood Damage (D)
Q
S
P
Q
P
D
S
D
UEB - Upper Error Bound
LEB - Lower Error Bound
UEB
LEB
How to translate Global Warming How to translate Global Warming GCM Info into real decisions?GCM Info into real decisions?
Top down approach Top down approach (advocated by (advocated by climate modeling community)climate modeling community):: translating translating GCM outputs into design criteria and GCM outputs into design criteria and decisions, assuming that information is decisions, assuming that information is useful and certainuseful and certainBottom Up:Bottom Up: (advocated by the (advocated by the practitioners) develop incremental practitioners) develop incremental adaptive coping strategies based on adaptive coping strategies based on engrgengrgpractice and experience with risk, practice and experience with risk, uncertainty and build in resiliency, uncertainty and build in resiliency, robustness and reliability (just as werobustness and reliability (just as we’’ve ve always done from the times of the always done from the times of the PharaohsPharaohs
Hurricanes & Global Warming?Hurricanes & Global Warming?2004, 2005 Atlantic hurricane seasons broke 2004, 2005 Atlantic hurricane seasons broke many recordsmany records2006 predicted to have 15 named storms; 10 2006 predicted to have 15 named storms; 10 hurricane strength; 4hurricane strength; 4--5 major making 5 major making landfall in US landfall in US 2006 A BUST !!! Not much happened (FEMA, 2006 A BUST !!! Not much happened (FEMA,
Corps and other agencies spent $millions Corps and other agencies spent $millions anticipating) 2007, 2008, 2009 as well.anticipating) 2007, 2008, 2009 as well.Debate among US meteorologists:Debate among US meteorologists:
A. 25A. 25--40 yr cycle ?40 yr cycle ? (e.g. (e.g. LandseaLandsea & Gray) or & Gray) or B. part of global warming cycleB. part of global warming cycle ?? (e.g. (e.g.
Emmanuel) Emmanuel) Herein lies the problem for water engineersHerein lies the problem for water engineers-- how to how to
translate vague climate scenarios, scientific disputes translate vague climate scenarios, scientific disputes and flawed predictions into design criteria for reliable and flawed predictions into design criteria for reliable structures and response systems?structures and response systems?
0
5
10
15
20
25
30
1854
1858
1862
1866
1870
1874
1878
1882
1886
1890
1894
1898
1902
1906
1910
1914
1918
1922
1926
1930
1934
1938
1942
1946
1950
1954
1958
1962
1966
1970
1974
1978
1982
1986
1990
1994
1998
2002
Total number of tropical cyclones
Number of hurricanes
Number of hurricanes which center's madeU.S. landfall
Source: National Oceanic & Atmospheric Administration
Note: Prior to 1970, tropical cyclones were not monitored by satellites; meaning that those cyclones that did not hit the land of the United States were not systematically recorded.
MANY STRONG WEAKER MANY STRONG WEAKER
Cycle of Hurricanes* (James O’Brien)
Most Damaging HurricanesMost Damaging HurricanesYear Cat Year Cat
GCM Scenarios:GCM Scenarios: Economic Robustness of PlansEconomic Robustness of PlansIJC Lake OntarioIJC Lake Ontario--St. Lawrence Regulation St. Lawrence Regulation
Hindcasting the Flood Record with “Voodoo” Statistical Analysis
The The ‘‘Double DiscountDouble Discount’’ Dilemma of Dilemma of Water Project JustificationWater Project Justification
In the classical expected-value approach, extreme events with low probability of occurrence are given the same proportional weight/importance (in the multiobjective
commensuration process) regardless of theirpotential catastrophic or irreversible impact.
Discounting for the present value of future benefits (r= discount rate of 2, 5, 7, 10 %)Discounting of low probability, high consequence events using flood/drought frequency analysis for ‘expected annual damages’
Effect of Discount Rate on Choice of Option Effect of Discount Rate on Choice of Option for Protection against Sea Level Rise for Protection against Sea Level Rise
0.02 0.03 0.04 0.05 0.06 0.07 0.08(20)
0
20
40
60
80
Discount Rate
Net
Pre
sent
Val
ue ($
'000
,000
)
Project A Project B
Project ANo SLR
Project BWith SLR
Most Damaging HurricanesMost Damaging HurricanesYear Year Cat Cat DamagesDamages
Flood Damages as Percent of GDP(Based on damages and GDP data in 2000 dollars)
0.0%
0.1%
0.1%
0.2%
0.2%
0.3%
0.3%
0.4%
0.4%
0.5%
0.5%
1900
1903
1906
1909
1912
1915
1918
1921
1924
1927
1930
1933
1936
1939
1942
1945
1948
1951
1954
1957
1960
1963
1966
1969
1972
1975
1978
1981
1984
1987
1990
1993
1996
1999
2002
2005
Dir
ect f
lood
dam
ages
as
perc
ent o
f GD
P
0%
5%
10%
15%
20%
25%
Tota
l flo
od d
amag
es a
s pe
rcen
t of G
DP
Direct damages as percent of GDPTotal damages as percent of GDP
MississippiRiver Valley
Ohio & Lower Mississippi River
Basins
Kansas &Missouri Rivers
HurricaneDiane
Hurricane Agnes
Teton DamFailure
Midwest Floods
138%
61%
99%
WeWe’’re in a Transitional Period of Many re in a Transitional Period of Many Climate Uncertainties and UnknownsClimate Uncertainties and Unknowns
Basic Messages:Basic Messages:All drivers of hydrological cycle are affected by climate All drivers of hydrological cycle are affected by climate variability (CV) & global warming variability (CV) & global warming –– climate change climate change (CC)(CC)Water sector is the principal medium through which Water sector is the principal medium through which most people will experience CCmost people will experience CCMany tools, water resources management coping Many tools, water resources management coping options designed for Climate Variability (CV), form the options designed for Climate Variability (CV), form the foundations for CC adaptationfoundations for CC adaptationSocioeconomic factors, land uses, conflicts and Socioeconomic factors, land uses, conflicts and population dynamics will dominate future conditions & population dynamics will dominate future conditions & and modes of adaptation and modes of adaptation -- rather than CCrather than CCTherefore, CC adaptation must be cast within a broader Therefore, CC adaptation must be cast within a broader IWRM frameworkIWRM framework, & not viewed as an independently , & not viewed as an independently pursued analytical paradigm focusing only on CCpursued analytical paradigm focusing only on CCImproving water governance and management is key Improving water governance and management is key to CC adaptation, more so than GCM to CC adaptation, more so than GCM modellingmodelling
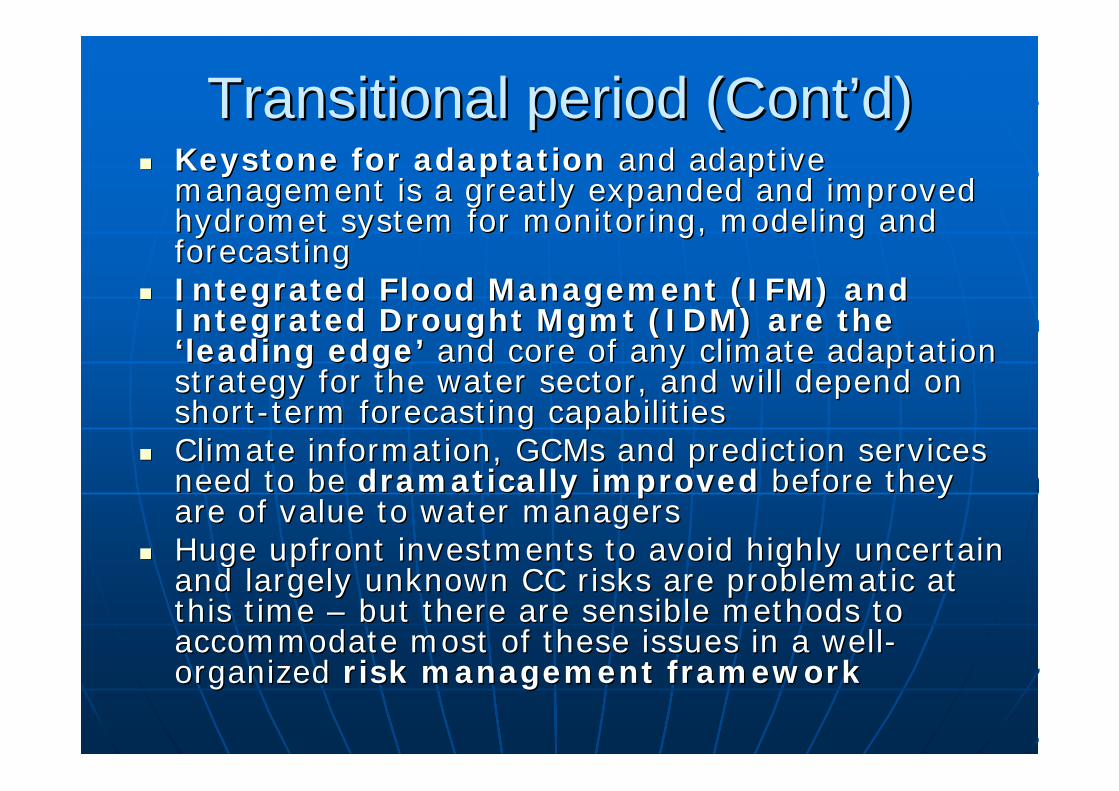
Transitional period (ContTransitional period (Cont’’d)d)Keystone for adaptationKeystone for adaptation and adaptive and adaptive management is a greatly expanded and improved management is a greatly expanded and improved hydromethydromet system for monitoring, modeling and system for monitoring, modeling and forecastingforecastingIntegrated Flood Management (IFM) and Integrated Flood Management (IFM) and Integrated Drought Mgmt (IDM) are the Integrated Drought Mgmt (IDM) are the ‘‘leading edgeleading edge’’ and core of any climate adaptation and core of any climate adaptation strategy for the water sector, and will depend on strategy for the water sector, and will depend on shortshort--term forecasting capabilitiesterm forecasting capabilitiesClimate information, Climate information, GCMsGCMs and prediction services and prediction services need to be need to be dramatically improveddramatically improved before they before they are of value to water managers are of value to water managers Huge upfront investments to avoid highly uncertain Huge upfront investments to avoid highly uncertain and largely unknown CC risks are problematic at and largely unknown CC risks are problematic at this time this time –– but there are sensible methods to but there are sensible methods to accommodate most of these issues in a wellaccommodate most of these issues in a well--organized organized risk management frameworkrisk management framework