29
Volume 63 - Number 6 July-August 2010 International Cotton Advisory Committee COTTON : Review of the World Situation Discover Natural Fibres Initiative

Volume 63 - Number 6
July-August 2010
Intern
ation
al Co
tton
Ad
visory C
om
mittee
COTTON : Review
of the World Situation
Discover
Natural
Fibres
Initiative
COTTON :Review of the World Situation
InternationalCotton
Advisory
Committee
Volume 63 - Number 6
July-August 2010
Tables Supply and Distribution of Cotton 2006-2011 ........................................................................................................................... 2 2009/10 Supply and Use of Cotton by Country ...................................................................................................................... 24 2010/11 Supply and Use of Cotton by Country ...................................................................................................................... 26
Table of Contents
Discover
Natural
Fibres
Initiative
SUMMARY OF THE OUTLOOK FOR COTTON ............................................................................................................................ 3Significant Rebound in World Cotton Production ....................................................................................................................... 3
Cotton PRiCe tRendS in 2009/10 .......................................................................................................................................... 5Highest Prices since the Mid-1990s ........................................................................................................................................... 5Lower Price Volatility .................................................................................................................................................................. 5impact of exchange Rates on Prices in domestic Currencies ................................................................................................... 6increase in Chinese Cotton Prices ............................................................................................................................................. 7Cotton Regains some Attractiveness vis-à-vis Most Competing Crops ..................................................................................... 7Cotton Spinning Margin Down .................................................................................................................................................... 8Geographical differences in the Competitiveness of Cotton vis-à-vis Polyester ........................................................................ 8
ReVieW of 2009/10 ..................................................................................................................................................................... 9Summary ....................................................................................................................................................................................9introduction .................................................................................................................................................................................9China: Rebound in Cotton Mill Use and Imports ...................................................................................................................... 11Other East Asia: Rebound in Cotton Mill Use ........................................................................................................................... 11South Asia: Rebound in Cotton Trade ...................................................................................................................................... 13Central Asia: further decline in Production ............................................................................................................................. 14Turkey: Smallest Crop in 44 years ........................................................................................................................................... 15Middle east: Smaller Production ............................................................................................................................................. 16Africa: Cotton Production down for the fifth Consecutive Season .......................................................................................... 16europe: Slower decline in Production and Consumption ......................................................................................................... 19north America: Continued decline in Production and Consumption ........................................................................................ 20Southern Hemisphere: Small Recovery in Production ............................................................................................................. 21

ICAC SUPPLY AND DISTRIBUTION OF COTTON
Seasons begin on August 12006/07 2007/08 2008/09 2009/10 2010/11 2011/12
Est. Proj. Proj. Proj.Million Metric Tons
BEGINNING STOCKS WORLD TOTAL 12.560 12.801 12.251 12.014 9.45 9.77 CHINA 3.991 3.653 3.321 3.694 3.17 3.19 USA 1.321 2.064 2.188 1.380 0.62 0.80PRODUCTION WORLD TOTAL 26.760 26.029 23.351 21.864 25.24 25.83 CHINA 7.975 8.071 8.025 6.850 7.08 7.25 INDIA 4.760 5.219 4.930 5.100 5.53 5.67 USA 4.700 4.182 2.790 2.654 4.07 3.97 PAKISTAN 2.121 1.876 1.891 2.019 2.19 2.28 BRAZIL 1.524 1.602 1.214 1.230 1.48 1.55 UZBEKISTAN 1.171 1.206 1.000 0.850 1.03 1.04 OTHERS 4.508 3.873 3.501 3.161 3.86 4.07CONSUMPTION WORLD TOTAL 26.429 26.509 23.395 24.465 24.92 25.27 CHINA 10.600 10.900 9.156 9.705 9.90 10.07 INDIA 3.908 4.050 3.863 4.249 4.42 4.55 PAKISTAN 2.633 2.649 2.428 2.307 2.35 2.40 EAST ASIA & AUSTRALIA 1.864 1.835 1.680 1.816 1.86 1.87 EUROPE & TURKEY 2.084 1.744 1.409 1.494 1.48 1.49 BRAZIL 0.992 1.007 0.974 0.976 1.00 1.02 USA 1.074 0.998 0.781 0.740 0.70 0.66 CIS 0.681 0.664 0.596 0.608 0.59 0.58 OTHERS 2.593 2.662 2.508 2.571 2.61 2.63EXPORTS WORLD TOTAL 8.080 8.375 6.626 7.688 8.05 8.31 USA 2.833 2.973 2.890 2.678 3.18 3.25 BRAZIL 0.283 0.486 0.596 0.424 0.47 0.53 UZBEKISTAN 0.980 0.900 0.630 0.820 0.76 0.75 CFA ZONE 0.924 0.591 0.472 0.530 0.53 0.58 INDIA 0.960 1.530 0.515 1.390 1.22 1.18 AUSTRALIA 0.465 0.265 0.261 0.350 0.42 0.51IMPORTS WORLD TOTAL 8.153 8.400 6.545 7.726 8.05 8.31 EAST ASIA & AUSTRALIA 1.899 1.860 1.665 1.879 1.88 1.90 CHINA 2.306 2.511 1.523 2.335 2.85 3.12 EUROPE & TURKEY 1.340 1.081 0.861 1.111 0.95 0.97 PAKISTAN 0.502 0.851 0.430 0.325 0.28 0.23 CIS 0.322 0.271 0.239 0.220 0.20 0.19TRADE IMBALANCE 1/ 0.073 0.025 -0.082 0.038 0.00 0.00STOCKS ADJUSTMENT 2/ -0.164 -0.096 -0.112 -0.001 0.00 0.00ENDING STOCKS WORLD TOTAL 12.801 12.251 12.014 9.449 9.77 10.33 CHINA 3.653 3.321 3.694 3.170 3.19 3.48 USA 2.064 2.188 1.380 0.615 0.80 0.86
ENDING STOCKS/MILL USE (%) WORLD-LESS-CHINA 3/ 58 57 58 43 44 45 CHINA 4/ 34 30 40 33 32 35COTLOOK A INDEX 5/ 59.15 72.90 61.20 78 85*1/ The inclusion of linters and waste, changes in weight during transit, differences in reporting periods and measurement error account for differences between world imports and exports.2/ Difference between calculated stocks and actual; amounts for forward seasons are anticipated.3/ World-less-China's ending stocks divided by World-less-China's mill use, multiplied by 100.4/ China's ending stocks divided by China's mill use, multiplied by 100.
* The price projection for 2010/11 is based on the ending stocks/consumption ratio in the world-less-China in 2008/09 (estimate),in 2009/10 (estimate) and in 2010/11 (projection), on the ratio of Chinese net imports to world imports in 2009/10 (estimate) and2010/11 (projection).95% confidence interval: 71 to 102 cents per pound.
August 2, 2010
5/ U.S. cents per pound.
July-August 2010 3
Cotton (ISSN 0010-9754) is published every two months by the Secretariat of the International Cotton Advisory Committee, 1629 K Street, NW, Suite 702, Washington DC. Editor: Armelle Gruère <[email protected]>. Desktop publishing: Carmen S. León. Subscription rate: $225.00. POSTMASTER: Send address changes to COTTON, 1629 K Street, NW, Suite 702, Washington DC 20006-1636. Copyright © ICAC 2010. No reproduction is permitted in whole or part without the express consent of the Secretariat.
SUMMARY OF THE OUTLOOK FOR COTTON
Significant Rebound in World Cotton Production
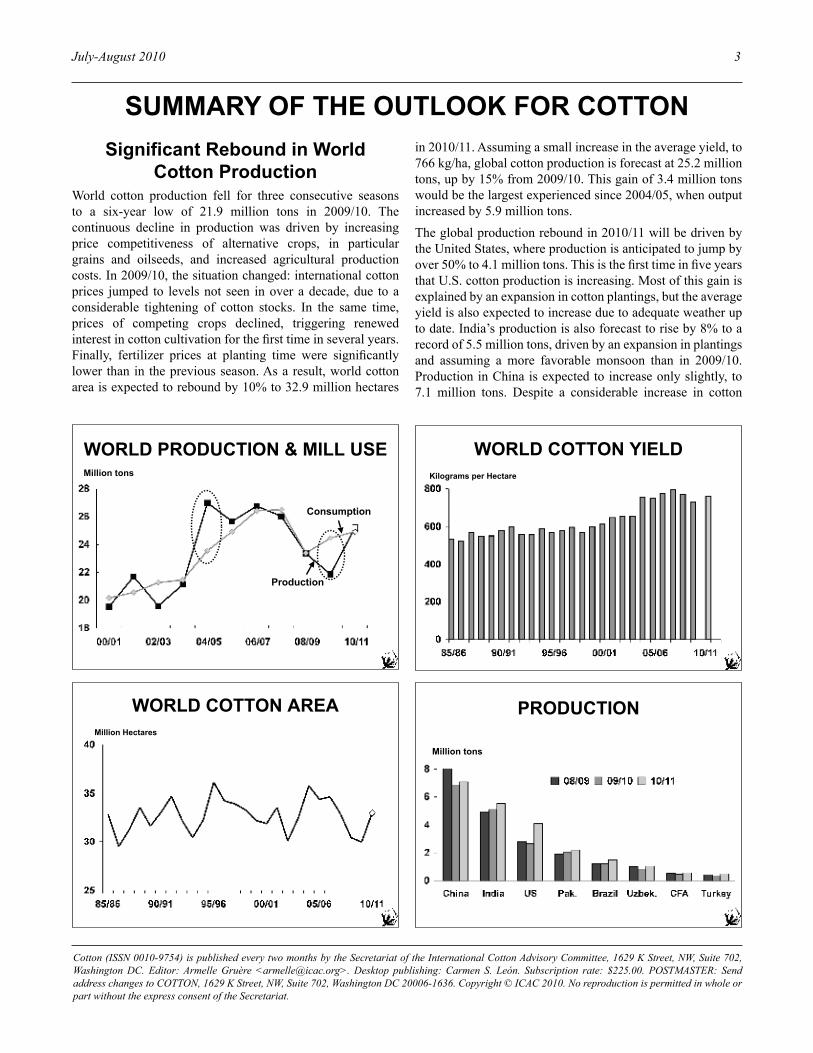
World cotton production fell for three consecutive seasons to a six-year low of 21.9 million tons in 2009/10. The continuous decline in production was driven by increasing price competitiveness of alternative crops, in particular grains and oilseeds, and increased agricultural production costs. In 2009/10, the situation changed: international cotton prices jumped to levels not seen in over a decade, due to a considerable tightening of cotton stocks. In the same time, prices of competing crops declined, triggering renewed interest in cotton cultivation for the first time in several years. Finally, fertilizer prices at planting time were significantly lower than in the previous season. As a result, world cotton area is expected to rebound by 10% to 32.9 million hectares
in 2010/11. Assuming a small increase in the average yield, to 766 kg/ha, global cotton production is forecast at 25.2 million tons, up by 15% from 2009/10. This gain of 3.4 million tons would be the largest experienced since 2004/05, when output increased by 5.9 million tons.
The global production rebound in 2010/11 will be driven by the United States, where production is anticipated to jump by over 50% to 4.1 million tons. This is the first time in five years that U.S. cotton production is increasing. Most of this gain is explained by an expansion in cotton plantings, but the average yield is also expected to increase due to adequate weather up to date. India’s production is also forecast to rise by 8% to a record of 5.5 million tons, driven by an expansion in plantings and assuming a more favorable monsoon than in 2009/10. Production in China is expected to increase only slightly, to 7.1 million tons. Despite a considerable increase in cotton
Million tons
WORLD PRODUCTION & MILL USE
Production
Consumption
WORLD COTTON AREA
Million Hectares
WORLD COTTON YIELD
Kilograms per Hectare
PRODUCTION
Million tons

4 COTTON
prices during 2009/10, the decline in cotton yields experienced that season, the shortage of labor in some areas, an increase in minimum procurement prices for grains, and unfavorable weather at planting time are among factors that prevented a rebound in cotton area in China in 2010/11. Cotton production in Pakistan is forecast up by 8% to 2.2 million tons, driven by expanded plantings. These four countries combined account for two-thirds of the projected global cotton production increase in 2010/11. Larger crops are expected also in Brazil, Uzbekistan, Turkey, Australia, the CFA Zone, and many other countries.
World cotton mill use is projected to continue to recover in 2010/11, growing by 2% to 24.9 million tons, pushed by continued improvement in global economic growth but limited by high cotton prices and a slowing “restocking effect”. China and India are expected to account for 80% of the increase in global cotton mill use in 2010/11. Their combined share of world cotton mill use will increase by one percentage point to 57%.
Imports are expected to continue to recover in 2010/11,
growing by 4% to 8 million tons. This increase will be driven by Chinese imports, forecast 22% larger at 2.9 million tons. These would be the largest Chinese imports in five years. Chinese cotton stocks were estimated down by 14% to 3.2 million tons in 2009/10, including a national reserve much reduced from the previous season. U.S. exports are projected up by 19% to 3.2 million tons in 2010/11, whereas Indian exports could decline to 1.2 million tons due to a reduced exportable surplus.
As global cotton production is expected to exceed mill use in 2010/11, world ending stocks are forecast to rise by 3% to 9.8 million tons. The global stocks-to-use ratio is expected to remain stable at 39%, much lower than the recent five-year average of 49% (2004/05 to 2008/09).
The ICAC Price Model forecasts a 2010/11 season-average Cotlook A Index of 85 cents per pound. The 95% confidence interval extends from 71 to 102 cents per pound. This forecast implies a 9% increase with respect to the 2009/10 forecast. However, caution must be exercised since all commodity markets are subject to great uncertainty.
IMPORTS
Million tons
EXPORTS
Million tons
GLOBAL STOCKS-TO-USE RATIO
COTLOOK A INDEX
Season-average (US cents/lb)
85
July-August 2010 5
COTTON PRiCE TRENdS iN 2009/10
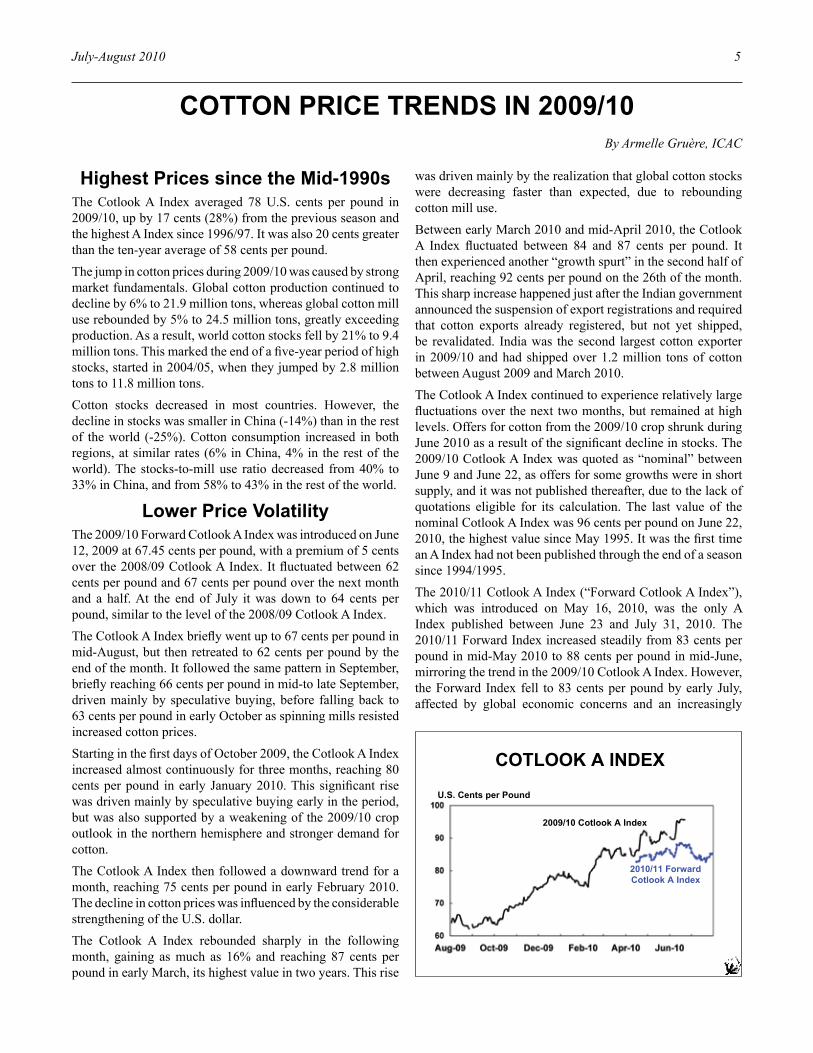
Highest Prices since the Mid-1990sThe Cotlook A Index averaged 78 U.S. cents per pound in 2009/10, up by 17 cents (28%) from the previous season and the highest A Index since 1996/97. It was also 20 cents greater than the ten-year average of 58 cents per pound.
The jump in cotton prices during 2009/10 was caused by strong market fundamentals. Global cotton production continued to decline by 6% to 21.9 million tons, whereas global cotton mill use rebounded by 5% to 24.5 million tons, greatly exceeding production. As a result, world cotton stocks fell by 21% to 9.4 million tons. This marked the end of a five-year period of high stocks, started in 2004/05, when they jumped by 2.8 million tons to 11.8 million tons.
Cotton stocks decreased in most countries. However, the decline in stocks was smaller in China (-14%) than in the rest of the world (-25%). Cotton consumption increased in both regions, at similar rates (6% in China, 4% in the rest of the world). The stocks-to-mill use ratio decreased from 40% to 33% in China, and from 58% to 43% in the rest of the world.
Lower Price VolatilityThe 2009/10 Forward Cotlook A Index was introduced on June 12, 2009 at 67.45 cents per pound, with a premium of 5 cents over the 2008/09 Cotlook A Index. It fluctuated between 62 cents per pound and 67 cents per pound over the next month and a half. At the end of July it was down to 64 cents per pound, similar to the level of the 2008/09 Cotlook A Index.
The Cotlook A Index briefly went up to 67 cents per pound in mid-August, but then retreated to 62 cents per pound by the end of the month. It followed the same pattern in September, briefly reaching 66 cents per pound in mid-to late September, driven mainly by speculative buying, before falling back to 63 cents per pound in early October as spinning mills resisted increased cotton prices.
Starting in the first days of October 2009, the Cotlook A Index increased almost continuously for three months, reaching 80 cents per pound in early January 2010. This significant rise was driven mainly by speculative buying early in the period, but was also supported by a weakening of the 2009/10 crop outlook in the northern hemisphere and stronger demand for cotton.
The Cotlook A Index then followed a downward trend for a month, reaching 75 cents per pound in early February 2010. The decline in cotton prices was influenced by the considerable strengthening of the U.S. dollar.
The Cotlook A Index rebounded sharply in the following month, gaining as much as 16% and reaching 87 cents per pound in early March, its highest value in two years. This rise
By Armelle Gruère, ICAC
was driven mainly by the realization that global cotton stocks were decreasing faster than expected, due to rebounding cotton mill use.
Between early March 2010 and mid-April 2010, the Cotlook A Index fluctuated between 84 and 87 cents per pound. It then experienced another “growth spurt” in the second half of April, reaching 92 cents per pound on the 26th of the month. This sharp increase happened just after the Indian government announced the suspension of export registrations and required that cotton exports already registered, but not yet shipped, be revalidated. India was the second largest cotton exporter in 2009/10 and had shipped over 1.2 million tons of cotton between August 2009 and March 2010.
The Cotlook A Index continued to experience relatively large fluctuations over the next two months, but remained at high levels. Offers for cotton from the 2009/10 crop shrunk during June 2010 as a result of the significant decline in stocks. The 2009/10 Cotlook A Index was quoted as “nominal” between June 9 and June 22, as offers for some growths were in short supply, and it was not published thereafter, due to the lack of quotations eligible for its calculation. The last value of the nominal Cotlook A Index was 96 cents per pound on June 22, 2010, the highest value since May 1995. It was the first time an A Index had not been published through the end of a season since 1994/1995.
The 2010/11 Cotlook A Index (“Forward Cotlook A Index”), which was introduced on May 16, 2010, was the only A Index published between June 23 and July 31, 2010. The 2010/11 Forward Index increased steadily from 83 cents per pound in mid-May 2010 to 88 cents per pound in mid-June, mirroring the trend in the 2009/10 Cotlook A Index. However, the Forward Index fell to 83 cents per pound by early July, affected by global economic concerns and an increasingly
COTLOOK A INDEX
U.S. Cents per Pound
2009/10 Cotlook A Index
2010/11 Forward
Cotlook A Index

6 COTTON
positive outlook for the 2010/11 U.S. cotton crop. The Forward Index fluctuated between 83 and 85 cents per pound during the remainder of July, influenced by doubts regarding the sustainability of strong cotton demand and improved outlooks for the U.S. and Indian 2010/11 crops.
The volatility of the Cotlook A Index decreased from a 21-year high of 50% in 2008/09 to 43% in 2009/101. The 34-cent spread between the minimum and maximum value of the Cotlook A Index was established throughout the season, as the Cotlook A Index increased almost continuously between September 2009 and June 2010.
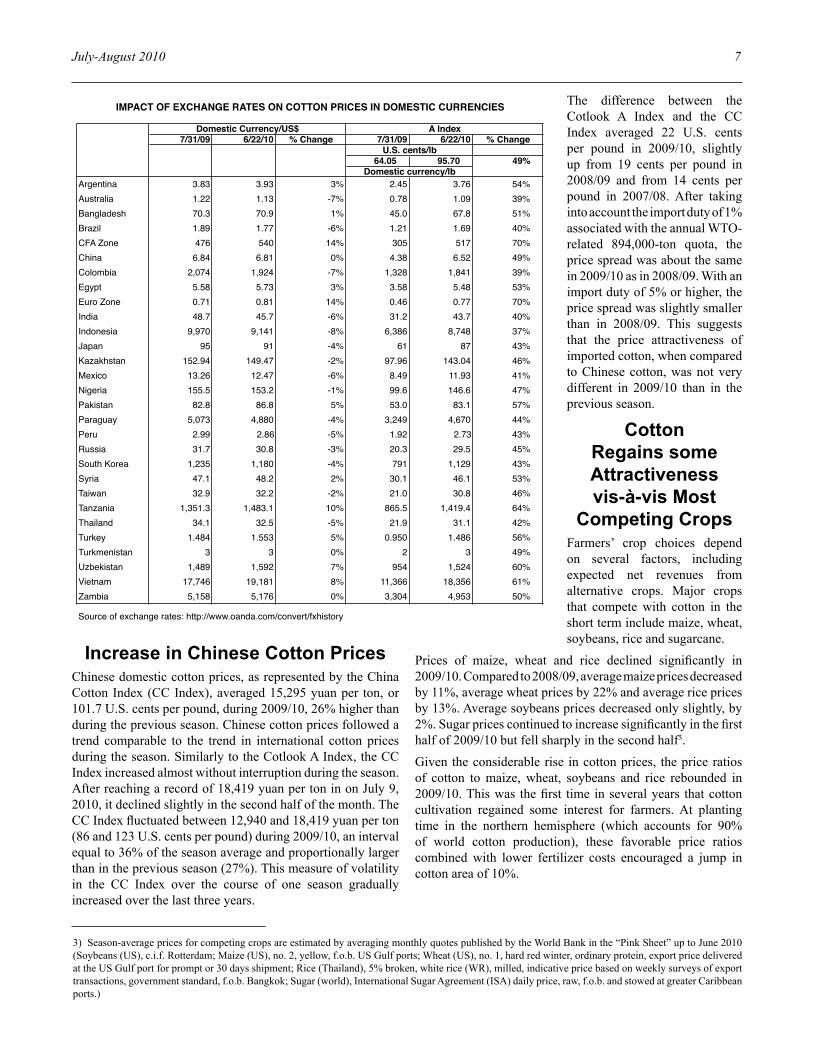
impact of Exchange Rates on Prices in domestic Currencies
International cotton prices are quoted in U.S. dollars. Therefore, exchange rate fluctuations can have an important influence on variations in domestic cotton prices in specific countries. The U.S. dollar weakened against many major currencies for most of the period between early 2002 and the middle of 2008, with an overall depressing effect on cotton prices expressed in the domestic currencies of many countries. It recovered some strength between July and November 2008, before weakening again between March and November 2009. It strengthened between December 2009 and early June 2010, before starting to decline once again.
Between July 31, 2009 and June 22, 2010, its last day of publication, the 2009/10 Cotlook A Index increased by 49% to 95.70 U.S. cents per pound. Over this period, the U.S. dollar strengthened against the currencies of some cotton producing countries, but weakened against the currencies of others. As a result, the significant increase in international cotton prices that took place during 2009/10 was more or less significantly reflected in domestic currencies, depending on the country of production. Between July 2009 and June 2010, the U.S. dollar
strengthened against the currencies of Argentina, the CFA Zone, the European Union, Egypt, Pakistan, Syria, Tanzania, Turkey, Uzbekistan and Zambia. As a result, the A Index increased by 50% or more in these countries. However, the U.S. dollar weakened against the currencies of Australia, Brazil, Colombia, India, Kazakhstan, Mexico, Nigeria, Paraguay and Peru. As a result, the A Index increased by 47% or less in these countries. In China and Turkmenistan, where domestic currencies moved closely to the U.S. dollar, the A Index increased by 49%2. These trends do not necessarily reflect exactly the trends in cotton prices paid to local producers, as other factors play a significant role. Depending on the country, these factors can include: the existence of fixed or minimum seedcotton prices, the involvement of the government in the determination of seedcotton prices paid to farmers and in cotton purchases, the number of intermediate steps in the marketing chain, the dependence of the cotton industry on exports, the existence of barriers to cotton imports or exports, the strength of the local spinning industry, the extent of local cotton stocks from previous seasons, etc.
Between July 31, 2009 and June 22, 2010, the U.S. dollar strengthened against the currencies of some cotton consuming countries, but weakened against the currencies of others. The U.S. dollar appreciated against the currencies of Argentina, Bangladesh, Egypt, the European Union, Pakistan, Syria, Tanzania, Turkey, Uzbekistan and Vietnam, facilitating the recovery (or in some cases slowing the decline) in cotton mill use in these countries. However, the U.S. dollar depreciated against the currencies of Brazil, Colombia, India, Indonesia, Japan, Mexico, Nigeria, Paraguay, Peru, Russia, South Korea, Taiwan and Thailand. This might have limited the rise in the cost of cotton at a time of considerable increase in international cotton prices, but in many cases it decreased the competitiveness of textile production in these countries.
COTLOOK A INDEX
Percent Difference from Season Average
Highest Quote Each Season
Lowest Quote Each Season
% CHANGE IN COTLOOK A INDEXExpressed in Local Currencies
(July 31, 2009 to June 22, 2010)
1) The volatility of the Cotlook A Index is estimated by calculating the spread between the minimum and the maximum values of the Index reached during the season, and dividing it by the season-average.2) However, local Chinese cotton prices did not increase as much as international cotton prices. Between July 31, 2009 and June 22, 2010, the China Cotton Index increased by 38%. The CC Index represents the price level of Type 328, delivered to mill. This is equivalent to SLM 1-1/16” cotton.
July-August 2010 7
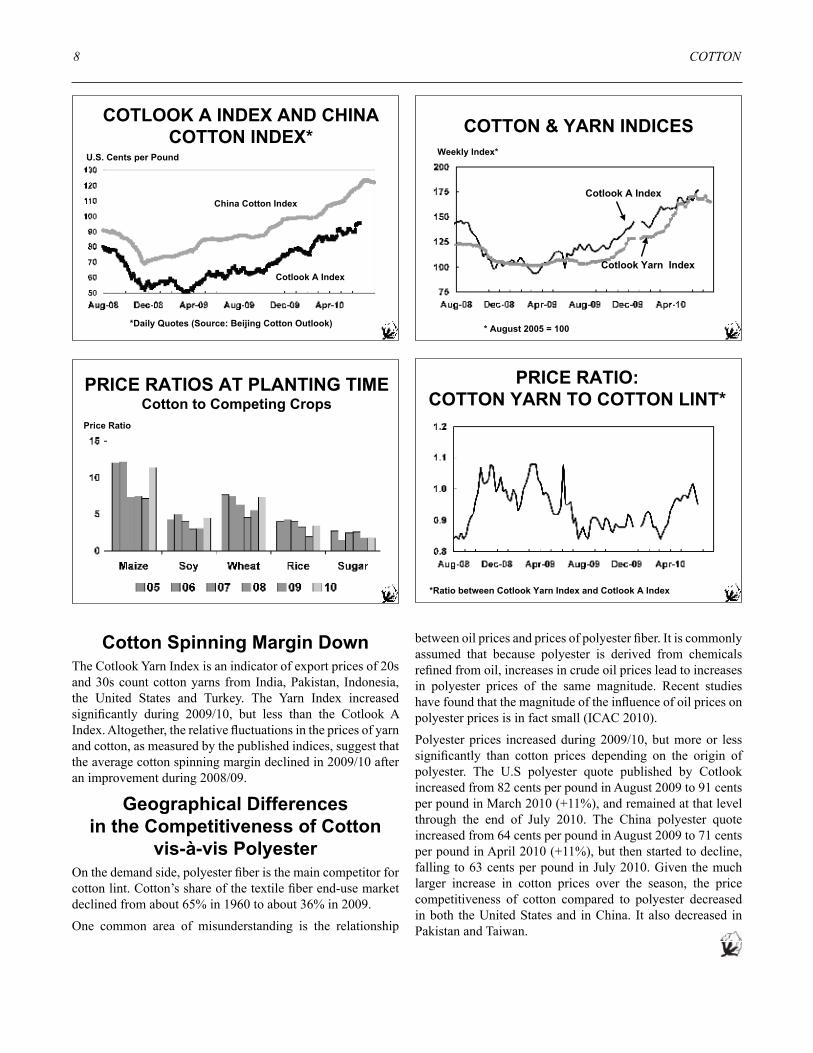
increase in Chinese Cotton PricesChinese domestic cotton prices, as represented by the China Cotton Index (CC Index), averaged 15,295 yuan per ton, or 101.7 U.S. cents per pound, during 2009/10, 26% higher than during the previous season. Chinese cotton prices followed a trend comparable to the trend in international cotton prices during the season. Similarly to the Cotlook A Index, the CC Index increased almost without interruption during the season. After reaching a record of 18,419 yuan per ton in on July 9, 2010, it declined slightly in the second half of the month. The CC Index fluctuated between 12,940 and 18,419 yuan per ton (86 and 123 U.S. cents per pound) during 2009/10, an interval equal to 36% of the season average and proportionally larger than in the previous season (27%). This measure of volatility in the CC Index over the course of one season gradually increased over the last three years.
The difference between the Cotlook A Index and the CC Index averaged 22 U.S. cents per pound in 2009/10, slightly up from 19 cents per pound in 2008/09 and from 14 cents per pound in 2007/08. After taking into account the import duty of 1% associated with the annual WTO-related 894,000-ton quota, the price spread was about the same in 2009/10 as in 2008/09. With an import duty of 5% or higher, the price spread was slightly smaller than in 2008/09. This suggests that the price attractiveness of imported cotton, when compared to Chinese cotton, was not very different in 2009/10 than in the previous season.
Cotton Regains some Attractiveness vis-à-vis Most
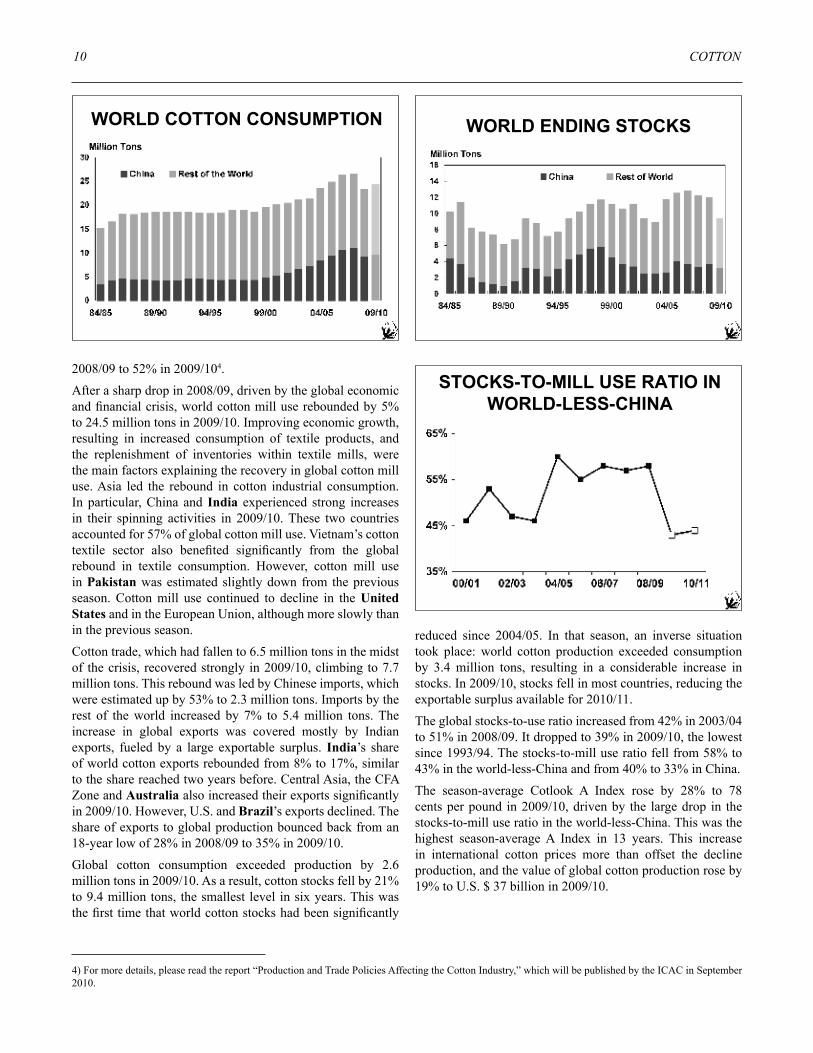
Competing CropsFarmers’ crop choices depend on several factors, including expected net revenues from alternative crops. Major crops that compete with cotton in the short term include maize, wheat, soybeans, rice and sugarcane.
Prices of maize, wheat and rice declined significantly in 2009/10. Compared to 2008/09, average maize prices decreased by 11%, average wheat prices by 22% and average rice prices by 13%. Average soybeans prices decreased only slightly, by 2%. Sugar prices continued to increase significantly in the first half of 2009/10 but fell sharply in the second half3.
Given the considerable rise in cotton prices, the price ratios of cotton to maize, wheat, soybeans and rice rebounded in 2009/10. This was the first time in several years that cotton cultivation regained some interest for farmers. At planting time in the northern hemisphere (which accounts for 90% of world cotton production), these favorable price ratios combined with lower fertilizer costs encouraged a jump in cotton area of 10%.
7/31/09 6/22/10 % Change 7/31/09 6/22/10 % Change
64.05 95.70 49%
Argentina 3.83 3.93 3% 2.45 3.76 54%Australia 1.22 1.13 -7% 0.78 1.09 39%Bangladesh 70.3 70.9 1% 45.0 67.8 51%Brazil 1.89 1.77 -6% 1.21 1.69 40%CFA Zone 476 540 14% 305 517 70%China 6.84 6.81 0% 4.38 6.52 49%Colombia 2,074 1,924 -7% 1,328 1,841 39%Egypt 5.58 5.73 3% 3.58 5.48 53%Euro Zone 0.71 0.81 14% 0.46 0.77 70%India 48.7 45.7 -6% 31.2 43.7 40%Indonesia 9,970 9,141 -8% 6,386 8,748 37%Japan 95 91 -4% 61 87 43%Kazakhstan 152.94 149.47 -2% 97.96 143.04 46%Mexico 13.26 12.47 -6% 8.49 11.93 41%Nigeria 155.5 153.2 -1% 99.6 146.6 47%Pakistan 82.8 86.8 5% 53.0 83.1 57%Paraguay 5,073 4,880 -4% 3,249 4,670 44%Peru 2.99 2.86 -5% 1.92 2.73 43%Russia 31.7 30.8 -3% 20.3 29.5 45%South Korea 1,235 1,180 -4% 791 1,129 43%Syria 47.1 48.2 2% 30.1 46.1 53%Taiwan 32.9 32.2 -2% 21.0 30.8 46%Tanzania 1,351.3 1,483.1 10% 865.5 1,419.4 64%Thailand 34.1 32.5 -5% 21.9 31.1 42%Turkey 1.484 1.553 5% 0.950 1.486 56%Turkmenistan 3 3 0% 2 3 49%Uzbekistan 1,489 1,592 7% 954 1,524 60%Vietnam 17,746 19,181 8% 11,366 18,356 61%Zambia 5,158 5,176 0% 3,304 4,953 50%
Source of exchange rates: http://www.oanda.com/convert/fxhistory
Domestic currency/lb
IMPACT OF EXCHANGE RATES ON COTTON PRICES IN DOMESTIC CURRENCIES
Domestic Currency/US$ A Index
U.S. cents/lb
3) Season-average prices for competing crops are estimated by averaging monthly quotes published by the World Bank in the “Pink Sheet” up to June 2010 (Soybeans (US), c.i.f. Rotterdam; Maize (US), no. 2, yellow, f.o.b. US Gulf ports; Wheat (US), no. 1, hard red winter, ordinary protein, export price delivered at the US Gulf port for prompt or 30 days shipment; Rice (Thailand), 5% broken, white rice (WR), milled, indicative price based on weekly surveys of export transactions, government standard, f.o.b. Bangkok; Sugar (world), International Sugar Agreement (ISA) daily price, raw, f.o.b. and stowed at greater Caribbean ports.)
8 COTTON
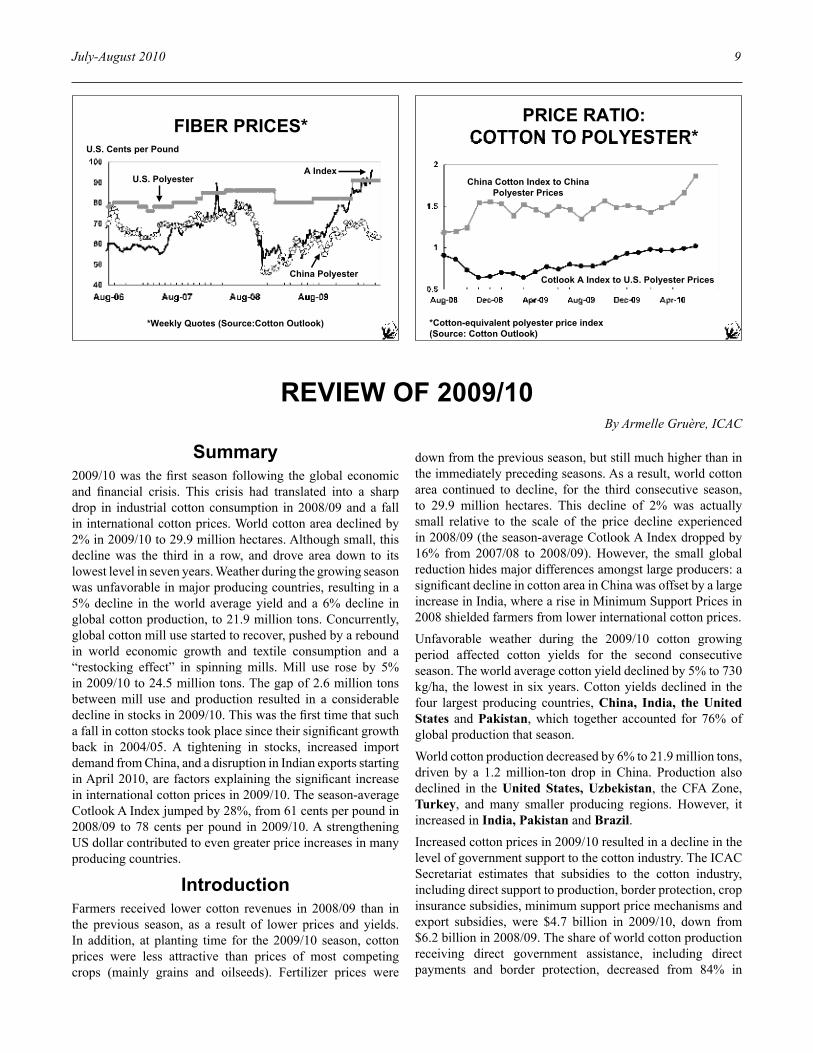
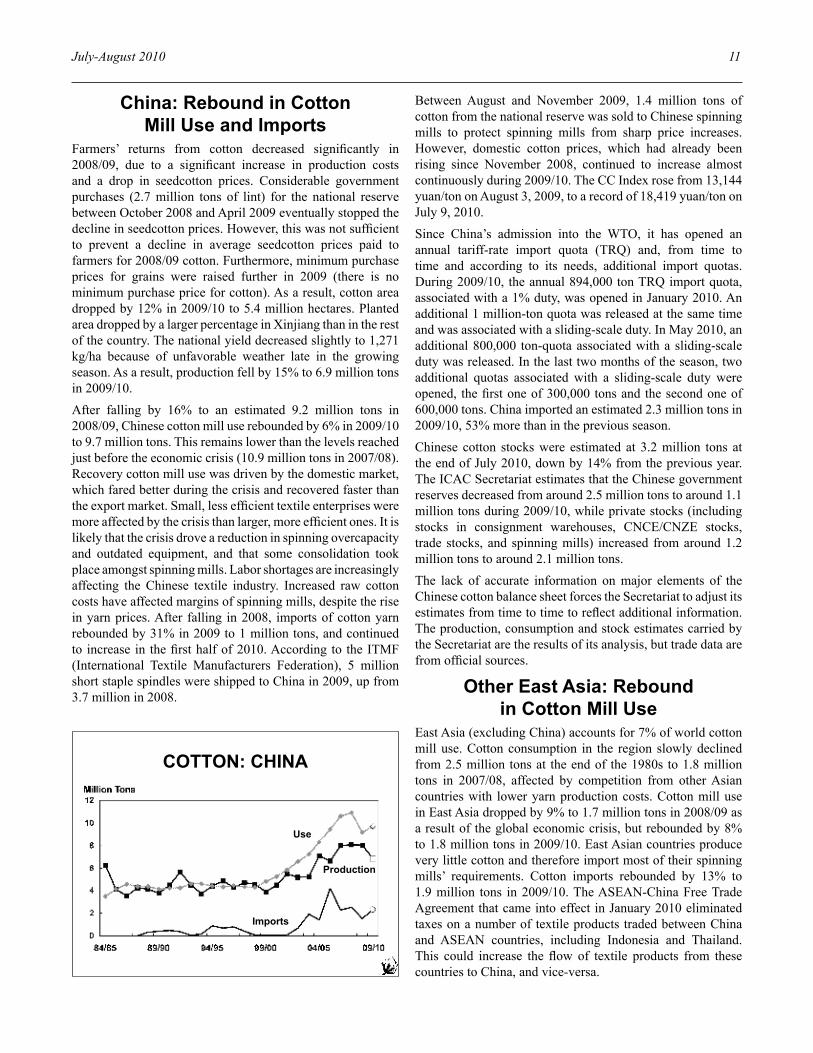
Cotton Spinning Margin downThe Cotlook Yarn Index is an indicator of export prices of 20s and 30s count cotton yarns from India, Pakistan, Indonesia, the United States and Turkey. The Yarn Index increased significantly during 2009/10, but less than the Cotlook A Index. Altogether, the relative fluctuations in the prices of yarn and cotton, as measured by the published indices, suggest that the average cotton spinning margin declined in 2009/10 after an improvement during 2008/09.
Geographical differences in the Competitiveness of Cotton
vis-à-vis PolyesterOn the demand side, polyester fiber is the main competitor for cotton lint. Cotton’s share of the textile fiber end-use market declined from about 65% in 1960 to about 36% in 2009.
One common area of misunderstanding is the relationship
between oil prices and prices of polyester fiber. It is commonly assumed that because polyester is derived from chemicals refined from oil, increases in crude oil prices lead to increases in polyester prices of the same magnitude. Recent studies have found that the magnitude of the influence of oil prices on polyester prices is in fact small (ICAC 2010).
Polyester prices increased during 2009/10, but more or less significantly than cotton prices depending on the origin of polyester. The U.S polyester quote published by Cotlook increased from 82 cents per pound in August 2009 to 91 cents per pound in March 2010 (+11%), and remained at that level through the end of July 2010. The China polyester quote increased from 64 cents per pound in August 2009 to 71 cents per pound in April 2010 (+11%), but then started to decline, falling to 63 cents per pound in July 2010. Given the much larger increase in cotton prices over the season, the price competitiveness of cotton compared to polyester decreased in both the United States and in China. It also decreased in Pakistan and Taiwan.
PRICE RATIOS AT PLANTING TIMECotton to Competing Crops
Price Ratio
COTTON & YARN INDICES
Weekly Index*
Cotlook Yarn Index
Cotlook A Index
* August 2005 = 100
PRICE RATIO:
COTTON YARN TO COTTON LINT*
*Ratio between Cotlook Yarn Index and Cotlook A Index
COTLOOK A INDEX AND CHINA
COTTON INDEX*U.S. Cents per Pound
Cotlook A Index
*Daily Quotes (Source: Beijing Cotton Outlook)
China Cotton Index
July-August 2010 9
REViEW OF 2009/10
Summary2009/10 was the first season following the global economic and financial crisis. This crisis had translated into a sharp drop in industrial cotton consumption in 2008/09 and a fall in international cotton prices. World cotton area declined by 2% in 2009/10 to 29.9 million hectares. Although small, this decline was the third in a row, and drove area down to its lowest level in seven years. Weather during the growing season was unfavorable in major producing countries, resulting in a 5% decline in the world average yield and a 6% decline in global cotton production, to 21.9 million tons. Concurrently, global cotton mill use started to recover, pushed by a rebound in world economic growth and textile consumption and a “restocking effect” in spinning mills. Mill use rose by 5% in 2009/10 to 24.5 million tons. The gap of 2.6 million tons between mill use and production resulted in a considerable decline in stocks in 2009/10. This was the first time that such a fall in cotton stocks took place since their significant growth back in 2004/05. A tightening in stocks, increased import demand from China, and a disruption in Indian exports starting in April 2010, are factors explaining the significant increase in international cotton prices in 2009/10. The season-average Cotlook A Index jumped by 28%, from 61 cents per pound in 2008/09 to 78 cents per pound in 2009/10. A strengthening US dollar contributed to even greater price increases in many producing countries.
introductionFarmers received lower cotton revenues in 2008/09 than in the previous season, as a result of lower prices and yields. In addition, at planting time for the 2009/10 season, cotton prices were less attractive than prices of most competing crops (mainly grains and oilseeds). Fertilizer prices were
PRICE RATIO:
COTTON TO POLYESTER*
*Cotton-equivalent polyester price index
(Source: Cotton Outlook)
China Cotton Index to China
Polyester Prices
Cotlook A Index to U.S. Polyester Prices
FIBER PRICES*U.S. Cents per Pound
A Index
*Weekly Quotes (Source:Cotton Outlook)
U.S. Polyester
China Polyester
By Armelle Gruère, ICAC
down from the previous season, but still much higher than in the immediately preceding seasons. As a result, world cotton area continued to decline, for the third consecutive season, to 29.9 million hectares. This decline of 2% was actually small relative to the scale of the price decline experienced in 2008/09 (the season-average Cotlook A Index dropped by 16% from 2007/08 to 2008/09). However, the small global reduction hides major differences amongst large producers: a significant decline in cotton area in China was offset by a large increase in India, where a rise in Minimum Support Prices in 2008 shielded farmers from lower international cotton prices.
Unfavorable weather during the 2009/10 cotton growing period affected cotton yields for the second consecutive season. The world average cotton yield declined by 5% to 730 kg/ha, the lowest in six years. Cotton yields declined in the four largest producing countries, China, India, the United States and Pakistan, which together accounted for 76% of global production that season.
World cotton production decreased by 6% to 21.9 million tons, driven by a 1.2 million-ton drop in China. Production also declined in the United States, Uzbekistan, the CFA Zone, Turkey, and many smaller producing regions. However, it increased in India, Pakistan and Brazil.
Increased cotton prices in 2009/10 resulted in a decline in the level of government support to the cotton industry. The ICAC Secretariat estimates that subsidies to the cotton industry, including direct support to production, border protection, crop insurance subsidies, minimum support price mechanisms and export subsidies, were $4.7 billion in 2009/10, down from $6.2 billion in 2008/09. The share of world cotton production receiving direct government assistance, including direct payments and border protection, decreased from 84% in
10 COTTON
2008/09 to 52% in 2009/104.
After a sharp drop in 2008/09, driven by the global economic and financial crisis, world cotton mill use rebounded by 5% to 24.5 million tons in 2009/10. Improving economic growth, resulting in increased consumption of textile products, and the replenishment of inventories within textile mills, were the main factors explaining the recovery in global cotton mill use. Asia led the rebound in cotton industrial consumption. In particular, China and India experienced strong increases in their spinning activities in 2009/10. These two countries accounted for 57% of global cotton mill use. Vietnam’s cotton textile sector also benefited significantly from the global rebound in textile consumption. However, cotton mill use in Pakistan was estimated slightly down from the previous season. Cotton mill use continued to decline in the United States and in the European Union, although more slowly than in the previous season.
Cotton trade, which had fallen to 6.5 million tons in the midst of the crisis, recovered strongly in 2009/10, climbing to 7.7 million tons. This rebound was led by Chinese imports, which were estimated up by 53% to 2.3 million tons. Imports by the rest of the world increased by 7% to 5.4 million tons. The increase in global exports was covered mostly by Indian exports, fueled by a large exportable surplus. India’s share of world cotton exports rebounded from 8% to 17%, similar to the share reached two years before. Central Asia, the CFA Zone and Australia also increased their exports significantly in 2009/10. However, U.S. and Brazil’s exports declined. The share of exports to global production bounced back from an 18-year low of 28% in 2008/09 to 35% in 2009/10.
Global cotton consumption exceeded production by 2.6 million tons in 2009/10. As a result, cotton stocks fell by 21% to 9.4 million tons, the smallest level in six years. This was the first time that world cotton stocks had been significantly
reduced since 2004/05. In that season, an inverse situation took place: world cotton production exceeded consumption by 3.4 million tons, resulting in a considerable increase in stocks. In 2009/10, stocks fell in most countries, reducing the exportable surplus available for 2010/11.
The global stocks-to-use ratio increased from 42% in 2003/04 to 51% in 2008/09. It dropped to 39% in 2009/10, the lowest since 1993/94. The stocks-to-mill use ratio fell from 58% to 43% in the world-less-China and from 40% to 33% in China.
The season-average Cotlook A Index rose by 28% to 78 cents per pound in 2009/10, driven by the large drop in the stocks-to-mill use ratio in the world-less-China. This was the highest season-average A Index in 13 years. This increase in international cotton prices more than offset the decline production, and the value of global cotton production rose by 19% to U.S. $ 37 billion in 2009/10.
WORLD COTTON CONSUMPTION
Million Tons
WORLD ENDING STOCKS
STOCKS-TO-MILL USE RATIO IN
WORLD-LESS-CHINA
4) For more details, please read the report “Production and Trade Policies Affecting the Cotton Industry,” which will be published by the ICAC in September 2010.
July-August 2010 11
China: Rebound in Cotton Mill Use and imports
Farmers’ returns from cotton decreased significantly in 2008/09, due to a significant increase in production costs and a drop in seedcotton prices. Considerable government purchases (2.7 million tons of lint) for the national reserve between October 2008 and April 2009 eventually stopped the decline in seedcotton prices. However, this was not sufficient to prevent a decline in average seedcotton prices paid to farmers for 2008/09 cotton. Furthermore, minimum purchase prices for grains were raised further in 2009 (there is no minimum purchase price for cotton). As a result, cotton area dropped by 12% in 2009/10 to 5.4 million hectares. Planted area dropped by a larger percentage in Xinjiang than in the rest of the country. The national yield decreased slightly to 1,271 kg/ha because of unfavorable weather late in the growing season. As a result, production fell by 15% to 6.9 million tons in 2009/10.
After falling by 16% to an estimated 9.2 million tons in 2008/09, Chinese cotton mill use rebounded by 6% in 2009/10 to 9.7 million tons. This remains lower than the levels reached just before the economic crisis (10.9 million tons in 2007/08). Recovery cotton mill use was driven by the domestic market, which fared better during the crisis and recovered faster than the export market. Small, less efficient textile enterprises were more affected by the crisis than larger, more efficient ones. It is likely that the crisis drove a reduction in spinning overcapacity and outdated equipment, and that some consolidation took place amongst spinning mills. Labor shortages are increasingly affecting the Chinese textile industry. Increased raw cotton costs have affected margins of spinning mills, despite the rise in yarn prices. After falling in 2008, imports of cotton yarn rebounded by 31% in 2009 to 1 million tons, and continued to increase in the first half of 2010. According to the ITMF (International Textile Manufacturers Federation), 5 million short staple spindles were shipped to China in 2009, up from 3.7 million in 2008.
Between August and November 2009, 1.4 million tons of cotton from the national reserve was sold to Chinese spinning mills to protect spinning mills from sharp price increases. However, domestic cotton prices, which had already been rising since November 2008, continued to increase almost continuously during 2009/10. The CC Index rose from 13,144 yuan/ton on August 3, 2009, to a record of 18,419 yuan/ton on July 9, 2010.
Since China’s admission into the WTO, it has opened an annual tariff-rate import quota (TRQ) and, from time to time and according to its needs, additional import quotas. During 2009/10, the annual 894,000 ton TRQ import quota, associated with a 1% duty, was opened in January 2010. An additional 1 million-ton quota was released at the same time and was associated with a sliding-scale duty. In May 2010, an additional 800,000 ton-quota associated with a sliding-scale duty was released. In the last two months of the season, two additional quotas associated with a sliding-scale duty were opened, the first one of 300,000 tons and the second one of 600,000 tons. China imported an estimated 2.3 million tons in 2009/10, 53% more than in the previous season.
Chinese cotton stocks were estimated at 3.2 million tons at the end of July 2010, down by 14% from the previous year. The ICAC Secretariat estimates that the Chinese government reserves decreased from around 2.5 million tons to around 1.1 million tons during 2009/10, while private stocks (including stocks in consignment warehouses, CNCE/CNZE stocks, trade stocks, and spinning mills) increased from around 1.2 million tons to around 2.1 million tons.
The lack of accurate information on major elements of the Chinese cotton balance sheet forces the Secretariat to adjust its estimates from time to time to reflect additional information. The production, consumption and stock estimates carried by the Secretariat are the results of its analysis, but trade data are from official sources.
Other East Asia: Rebound in Cotton Mill Use
East Asia (excluding China) accounts for 7% of world cotton mill use. Cotton consumption in the region slowly declined from 2.5 million tons at the end of the 1980s to 1.8 million tons in 2007/08, affected by competition from other Asian countries with lower yarn production costs. Cotton mill use in East Asia dropped by 9% to 1.7 million tons in 2008/09 as a result of the global economic crisis, but rebounded by 8% to 1.8 million tons in 2009/10. East Asian countries produce very little cotton and therefore import most of their spinning mills’ requirements. Cotton imports rebounded by 13% to 1.9 million tons in 2009/10. The ASEAN-China Free Trade Agreement that came into effect in January 2010 eliminated taxes on a number of textile products traded between China and ASEAN countries, including Indonesia and Thailand. This could increase the flow of textile products from these countries to China, and vice-versa.
COTTON: CHINA
Use
Production
Imports

12 COTTON
Cotton mill use in Indonesia reached a record of 530,000 tons in 2000/01, fueled by the export-oriented textile sector. Cotton imports jumped to an estimated 570,000 tons that season, making Indonesia the top importer in the world. However, in the following years the local textile industry faced increased competition in its major export markets as well as domestically. Indonesia faces higher textile production costs than many other Asian countries, due to old equipment and high electricity costs. Consumption was relatively stable between 2004/05 and 2007/08, ranging from 470,000 tons to 490,000 tons. It fell to 435,000 tons in 2008/09, but partially recovered to 450,000 tons in 2009/10. Indonesia imported over 450,000 tons of cotton in 2009/10, remaining the fourth largest importer after China, Turkey and Bangladesh. Cotton production is minimal in Indonesia, accounting for about 1% of domestic consumption.
Thailand’s cotton mill use reached a record of 457,000 tons in 2004/05. However, in the following seasons it gradually declined, due to competition from other Asian countries. It fell by 13% in 2008/09 to 370,000 tons, as the country’s economy was severely hurt by political instability in the first half of the season, as well as the global financial and economic crisis that affected all countries. In 2009/10, cotton mill use recovered to 390,000 tons, as demand for textile products recovered. However, Thailand’s spinning industry continues to face increased competition from imported textiles, in particular from China.
Vietnam is the only country in East Asia where cotton consumption increased in 2008/09. Cotton mill use increased by 9% to 267,000 tons in 2008/09, an increase smaller than in the previous seasons, and then grew even more strongly in 2009/10, rising by 35% to 360,000 tons. Vietnam’s accession to the WTO in 2006 has encouraged investments in the domestic textile industry that are currently continuing. The expansion in cotton mill use is driven mainly by garment and textile exports. Textile production costs remain lower in Vietnam than in many other Asian countries. Vietnam was the third largest importer of short staple spindles in 2009. Cotton
production in Vietnam remains small; it was estimated at 4,000 tons in 2009/10, accounting for only 1% of domestic consumption. Therefore, Vietnam imports most of the cotton it spins.
Cotton mill use in Taiwan decreased significantly in both 2007/08 and 2008/09, reaching 185,000 tons that season. It rebounded to 205,000 tons in 2009/10. Taiwan does not produce any cotton and therefore imports all that it spins. Imports of cotton by Taiwan dropped by 19% in 2008/09 but rebounded by 23% in 2009/10. Since 2004, the number of spindles has shrunk from 4.5 million to less than 2 million. During the past decade, Taiwan gradually upgraded its spinning equipment and increased operating efficiency, while relocating older spindles to mills in China and other Asian countries to take advantage of lower production costs. Increasing emphasis is being placed on the production of value-added functional and eco-textiles. The use of raw cotton is declining while imports of cotton and man-made fiber yarns are increasing. The textile industry of Taiwan is heavily export-oriented. Taiwan’s long-term plan is to shift increasingly out of apparel production and into the household and industrial textiles markets.
Cotton consumption in the Republic of Korea has gradually declined from a peak of 455,000 tons in the end of the 1980s. It stabilized at around 215,000 tons in 2007/08 and 2008/09, but rebounded to 220,000 tons in 2009/10. Strong cotton yarn prices, and efforts to minimize production costs have helped cotton mill use to expand. Korea has maintained strong knitting and weaving and garment manufacturing industries, and 90% of yarn production is sold domestically for eventual export. Korea imports all the cotton it spins. Its cotton imports in 2009/10 were estimated at 220,000 tons, slightly up from the previous season.
Cotton mill use in Japan has declined almost continuously from a peak of 760,000 tons in the late 1980s to an estimated 95,000 tons in 2008/09, with an average annual rate of decline of 10%. It declined further to 75,000 tons in 2009/10. The gradual reduction in manufacturing of cotton products in Japan is due mainly to increased imports of finished products, especially from China, but has recently been exacerbated by the sluggishness of domestic end-use textile consumption. Imports of cotton declined to less than 60,000 tons in 2009/10. The relocation of the Japanese spinning capacity to Southeast Asia and South America, to take advantage of lower production costs, is continuing. About 1.17 million spindles were still operating in Japan in 2009.
Cotton mill use in Hong Kong steadily declined from a high of 245,000 tons in the late 1980s to 25,000 tons in 2008/09. It continued to decline to 20,000 tons in 2009/10. One of the last two remaining cotton spinning mills stopped operating during 2009/10, leaving only one spinning mill. Imports were estimated at 90,000 tons in 2009/10, up slightly from the previous season. However, most of these imports were re-exported, mainly to China.
MILL USE: EAST ASIA(OTHER THAN CHINA)
July-August 2010 13
Cotton mill use in the Philippines has declined almost every year since a peak of 77,000 tons in 1996/97 to an estimated 14,000 tons in 2007/08, but has since remained relatively stable. The Philippines is highly dependent on the domestic market and suffers from competition from textile imports. Local cotton production has almost completely disappeared.
South Asia: Rebound in Cotton Trade
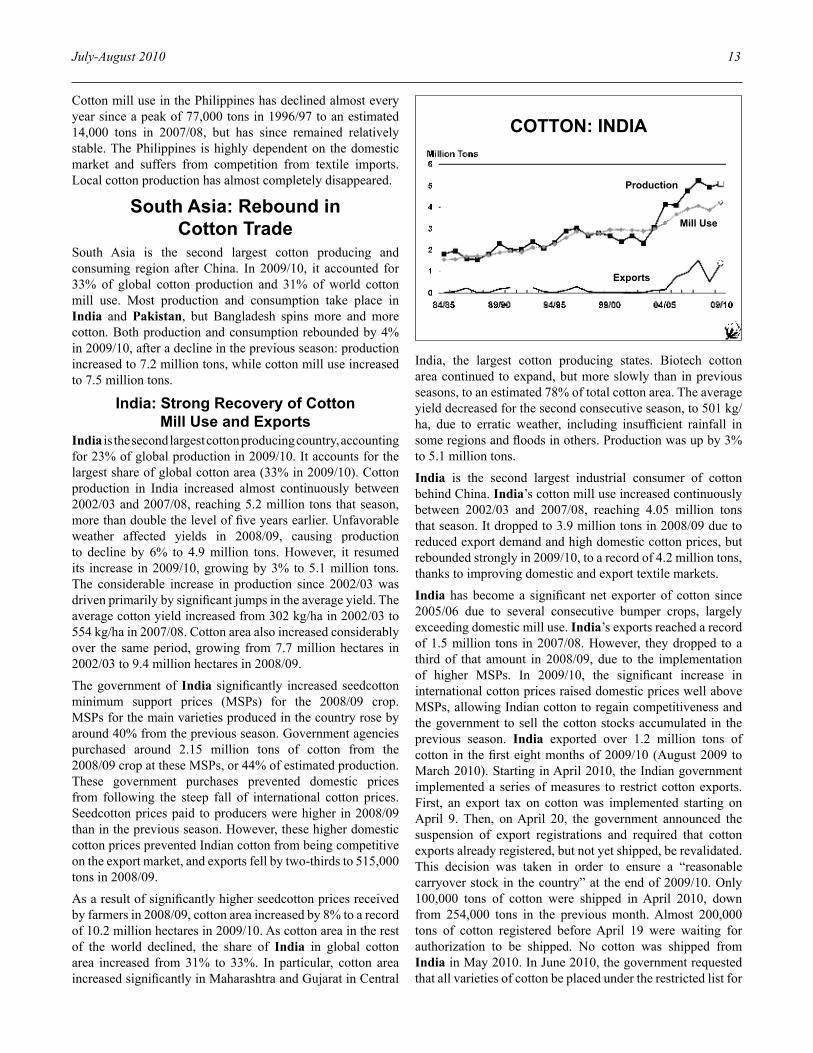
South Asia is the second largest cotton producing and consuming region after China. In 2009/10, it accounted for 33% of global cotton production and 31% of world cotton mill use. Most production and consumption take place in India and Pakistan, but Bangladesh spins more and more cotton. Both production and consumption rebounded by 4% in 2009/10, after a decline in the previous season: production increased to 7.2 million tons, while cotton mill use increased to 7.5 million tons.
india: Strong Recovery of Cotton Mill Use and Exports
India is the second largest cotton producing country, accounting for 23% of global production in 2009/10. It accounts for the largest share of global cotton area (33% in 2009/10). Cotton production in India increased almost continuously between 2002/03 and 2007/08, reaching 5.2 million tons that season, more than double the level of five years earlier. Unfavorable weather affected yields in 2008/09, causing production to decline by 6% to 4.9 million tons. However, it resumed its increase in 2009/10, growing by 3% to 5.1 million tons. The considerable increase in production since 2002/03 was driven primarily by significant jumps in the average yield. The average cotton yield increased from 302 kg/ha in 2002/03 to 554 kg/ha in 2007/08. Cotton area also increased considerably over the same period, growing from 7.7 million hectares in 2002/03 to 9.4 million hectares in 2008/09.
The government of India significantly increased seedcotton minimum support prices (MSPs) for the 2008/09 crop. MSPs for the main varieties produced in the country rose by around 40% from the previous season. Government agencies purchased around 2.15 million tons of cotton from the 2008/09 crop at these MSPs, or 44% of estimated production. These government purchases prevented domestic prices from following the steep fall of international cotton prices. Seedcotton prices paid to producers were higher in 2008/09 than in the previous season. However, these higher domestic cotton prices prevented Indian cotton from being competitive on the export market, and exports fell by two-thirds to 515,000 tons in 2008/09.
As a result of significantly higher seedcotton prices received by farmers in 2008/09, cotton area increased by 8% to a record of 10.2 million hectares in 2009/10. As cotton area in the rest of the world declined, the share of India in global cotton area increased from 31% to 33%. In particular, cotton area increased significantly in Maharashtra and Gujarat in Central
India, the largest cotton producing states. Biotech cotton area continued to expand, but more slowly than in previous seasons, to an estimated 78% of total cotton area. The average yield decreased for the second consecutive season, to 501 kg/ha, due to erratic weather, including insufficient rainfall in some regions and floods in others. Production was up by 3% to 5.1 million tons.
India is the second largest industrial consumer of cotton behind China. India’s cotton mill use increased continuously between 2002/03 and 2007/08, reaching 4.05 million tons that season. It dropped to 3.9 million tons in 2008/09 due to reduced export demand and high domestic cotton prices, but rebounded strongly in 2009/10, to a record of 4.2 million tons, thanks to improving domestic and export textile markets.
India has become a significant net exporter of cotton since 2005/06 due to several consecutive bumper crops, largely exceeding domestic mill use. India’s exports reached a record of 1.5 million tons in 2007/08. However, they dropped to a third of that amount in 2008/09, due to the implementation of higher MSPs. In 2009/10, the significant increase in international cotton prices raised domestic prices well above MSPs, allowing Indian cotton to regain competitiveness and the government to sell the cotton stocks accumulated in the previous season. India exported over 1.2 million tons of cotton in the first eight months of 2009/10 (August 2009 to March 2010). Starting in April 2010, the Indian government implemented a series of measures to restrict cotton exports. First, an export tax on cotton was implemented starting on April 9. Then, on April 20, the government announced the suspension of export registrations and required that cotton exports already registered, but not yet shipped, be revalidated. This decision was taken in order to ensure a “reasonable carryover stock in the country” at the end of 2009/10. Only 100,000 tons of cotton were shipped in April 2010, down from 254,000 tons in the previous month. Almost 200,000 tons of cotton registered before April 19 were waiting for authorization to be shipped. No cotton was shipped from India in May 2010. In June 2010, the government requested that all varieties of cotton be placed under the restricted list for
COTTON: INDIA
Production
Mill Use
Exports

14 COTTON
exports, thus asking cotton exporters to obtain export licenses from the Ministry of Commerce (this replaced the earlier system of registration of export contracts of cotton). Pakistan and Bangladesh rely for a large part on Indian cotton to fulfill the needs of their spinning mills. India granted export licenses for these two destinations in early June 2010. Then starting in mid-June, India began to grant export licenses for other destinations. A total of 45,000 tons of cotton were projected to ship from India in June and July 2010, bringing the total for 2009/10 to 1.4 million tons, or almost three times as high as in 2008/09.
Cotton stocks decreased by an estimated 22%, from a record of 1.9 million tons at the end of July 2009, to 1.5 million tons by the end of July 2010. The Indian stocks-to-use ratio dropped from 44% to 27%.
Pakistan: increase in Production but Further decline in Mill Use
Cotton production in Pakistan increased by 7% in 2009/10 to 2.0 million tons, driven by a recovery in planted area. Several factors encouraged farmers to plant more cotton in 2009/10. First, in the previous season, cotton yields rebounded thanks to overall favorable weather and limited pest infestations, and seedcotton prices remained firm, bringing good returns to farmers. In addition, delayed payments to farmers for rice and sugarcane in 2008/09 pushed some of them to switch area to cotton in 2009/10. Finally, the winter wheat crop was late, preventing sugarcane plantings and thereby diverting area to cotton. These factors resulted in a 10% increase in cotton plantings to 3.1 million hectares in 2009/10. The average yield declined slightly to 649 kg/ha, probably due to slightly higher incidence of the Leaf Curl Virus in Punjab. Production in Punjab was down by 5% to 1.3 million tons, whereas production in Sindh was up by 13% to 536,000 tons. Seedcotton prices paid to producers increased significantly in 2009/10, following the trend in international cotton prices and exacerbated locally by tightening stocks.
Pakistan is the third largest industrial consumer of cotton after China and India, accounting for 10% of global cotton mill use in 2009/10. Pakistan has been one of the largest exporters of cotton yarn since 1988, in particular to China. Cotton mill use in Pakistan jumped by 15% to 2.3 million tons in 2004/05, the season marking the elimination of quotas on textile and apparel trade among WTO members. The expansion slowed considerably in the following seasons. Cotton mill use reached a record estimated at 2.6 million tons in 2007/08, but contracted in 2008/09. In recent years, the Pakistani textile industry was affected by increasing costs of production (in particular costs of labor and energy and high interest rates), and reduced spinning margins. Decreased demand for cotton yarn in 2008/09 added to the financial difficulties of spinning mills. Cotton mill use in Pakistan continued to decline in 2009/10, more slowly than in the previous season, to an estimated 2.3 million tons. The significant rise in cotton and cotton yarn prices and measures to limit cotton yarn exports
may have contributed to this further decline. In January 2010, the government implemented a monthly cap of 50,000 tons on cotton yarn exports. This cap was reduced to 35,000 tons in April, and was replaced by a 15% export duty in May 2010. This export duty was made a little more flexible in June.
Pakistan became a net importer of cotton in 2001/02. Imports reached a record of 850,000 tons in 2007/08. They fell to 444,000 tons in 2008/09, and declined further to 325,000 tons in 2009/10. Pakistan was the seventh largest importer of cotton in 2009/10. Cotton exports from Pakistan doubled to 160,000 tons in 2009/10. This was the third consecutive season of increase in Pakistan’s cotton exports.
Bangladesh: Small increase in Mill UseBangladesh is the sixth largest cotton consumer. It is one of the few countries where cotton mill use continued to expand in 2008/09 thanks to continued investments in the spinning sector and increases in cotton textile exports to its two major markets, the United States and the European Union. Cotton mill use continued to increase in 2009/10, but at a slower rate of 5%, to reach 851,000 tons. The Bangladeshi textile industry continues to benefit from relatively low labor costs compared to other Asian countries. Bangladesh was the third largest importer of cotton in 2009/10, with an estimated 850,000 tons, and the fourth largest importer of short staple spindles in 2009. Cotton production in Bangladesh remains small: it was estimated at 11,000 tons in 2009/10.
Central Asia: Further decline in Production
Cotton production in Central Asia fell in 2009/10 for the second consecutive season, to 1.3 million tons. Cotton area decreased by 10% to 2.3 million hectares, due to substitution with competing crops and unfavorable weather at planting time. The average yield was also down by 8% to 558 kg/ha, the lowest in a decade, affected by unfavorable weather and the lack of quality inputs. Cotton mill use rose by 8% to 400,000 tons after a drop in 2008/09. Cotton exports from Central Asian countries rebounded by 39% to 1.3 million
COTTON: PAKISTAN
Production
Mill Use
Imports

July-August 2010 15
tons, fueled by the large exportable surplus resulting from the significant increase in stocks in 2008/09.
Cotton output in Uzbekistan decreased in 2009/10 for the second consecutive year to 850,000 tons, down by 15% from the previous season. Cotton area declined by 5% to 1.317 million hectares, as the Uzbek government chose to switch some cotton area to food crops. The average yield dropped to 645 kg/ha, down by 10% from 2008/09 and the lowest in six years. The lower yield is attributed to cool and wet weather at planting time, which resulted in some replanting and significantly delayed the crop, and cooler than usual temperatures during the growing season. Cotton mill use was estimated at 270,000 tons in 2009/10, up by 13%. Uzbek exports rebounded by 30% to an estimated 820,000 tons, including stocks from the previous season. Uzbekistan was the third largest exporter of cotton in 2009/10, accounting for 11% of world total.
Turkmenistan’s cotton production fell by 16% to 250,000 tons in 2009/10, primarily due to a smaller planted area. Despite early expectations of an increase in area, given that farmers were satisfied with cotton prices received in 2008/09, a wet and cool spring affected plantings and delayed the crop. The average yield was also estimated down in 2009/10, to 412 kg/ha. Exports rebounded to 235,000 tons, up from 100,000 tons in 2008/09, as the carryover from the previous season was large. Cotton mill use in Turkmenistan was estimated stable at around 90,000 tons in 2009/10.
Cotton production in Tajikistan declined in 2009/10 for the third consecutive season to 82,000 tons, down by 23% from 2008/09. The drop in production was driven by reduction in cotton area, due a diversion to food and grain crops, farmers’ financial difficulties, and unfavorable weather at planting time. The average yield was stable at 481 kg/ha. Mill consumption of cotton was estimated slightly down to 10,000 tons, while exports rebounded by 50% to 105,000 tons.
Kazakhstan’s cotton output declined in 2009/10 for the fifth consecutive season, to 66,000 tons, the smallest in over a
decade. Cotton area dropped by 20% to 140,000 hectares, due to farmers’ dissatisfaction with prices received in 2008/09, their difficulties to finance the new crop and unfavorable weather at planting time. A number of farmers switched to food crops. The average yield decreased to less than 500 kg/ha for the first time since the late 1990s, as a result of unfavorable weather, lack of inputs and low-quality seeds. Cotton consumption in Uzbekistan was estimated stable at 12,000 tons and exports slightly down to 70,000 tons, including stocks remaining from the previous season.
Cotton production in Kyrgyzstan fell by almost half to 14,000 tons in 2009/10, due to a drop in planted area. This was the fifth consecutive season of decline in cotton output. Many farmers switched to the cultivation of alternative crops (mainly vegetables and corn), for which prices were more attractive than those of cotton. Exports were estimated up at 25,000 tons in 2009/10.
Cotton production in Azerbaijan also dropped in 2009/10, by almost half to 11,000 tons, driven by reductions in plantings. This was the fourth consecutive season of decline in production for Azerbaijan, and production was six times lower than in 2005/06. Unfavorable weather and pest pressure during the growing season affected the average yield, estimated down to 379 kg/ha.
Turkey: Smallest Crop in 44 yearsCotton area in Turkey fell by 15% to 280,000 hectares in 2009/10, the smallest area recorded since the late 1940s. Farmers continued to switch land to grains, judged more attractive, less costly and easier to cultivate than cotton. The average cotton yield increased slightly to 1,357 kg/ha. Production in Turkey declined for the sixth consecutive season, to 380,000 tons, the smallest cotton crop since 1965/66.
Cotton mill use in Turkey reached a record of 1.55 million tons in 2004/05 and 2006/07, fueled by a rapid expansion of exports of cotton textile products to Europe. However, cotton spinning fell by 15% in each of the following season, first due to a slow-down in global economic growth and a strong
COTTON: UZBEKISTAN
Million Tons
Production
Mill Use
Exports
COTTON: TURKEY
Million Tons
Mill Use
Production
Imports

16 COTTON
currency, then to the global economic recession resulting in a decline in demand for textile products in Turkey’s major export markets. Turkey’s cotton mill use was estimated at 1.130 million tons in 2008/09, the lowest in a decade. In 2009/10, mill use rebounded to 1.250 million tons, boosted by the global economic rebound and an upturn in demand for textile products from European markets. However, the recovery slowed in the second half of the season, due to a weakening Euro and concerns about Europe’s economic growth.
Cotton imports by Turkey jumped by 42% to 900,000 tons in 2009/10, a result of declining production and rebounding mill use. Turkey was the second largest importer of cotton in 2009/10.
Middle East: Smaller Production Cotton production in Syria was estimated at 218,000 tons in 2009/10, down for the second consecutive season due to lower area and yields. Domestic consumption was estimated up to 185,000 tons. Exports were estimated slightly up to 50,000 tons.
Cotton production in Iran was down by 23% to 65,000 tons, the smallest crop harvested since 1980/81. This was the result of a drop in planted area, due to the decline in seedcotton prices and farmers’ returns during 2008/09. The average yield declined slightly to 619 kg/ha. This was the lowest yield since the end of the 1990s. Domestic consumption was estimated stable at 135,000 tons and imports up slightly to 63,000 tons.
Israel’s cotton area has decreased almost every year since the end of the 1990s due to competition from alternative crops. Cotton area continued to decline in 2009/10 by 26% to 4,000 hectares, the smallest area since at least the 1960s, due mainly to a lack of water during winter. All the cotton grown in Israel in 2009/10 was extra-fine, including three-quarters of Pima and one quarter of Acalpi. The average yield increased by 6% to 1,763 kg/ha. Production declined to 7,000 tons, the smallest crop since the late 1950s. All the cotton produced in Israel is exported.
Africa: Cotton Production down for the Fifth Consecutive Season
Since reaching a record of 2.0 million tons in 2004/05, African cotton production has declined continuously. It was estimated at 960,000 tons in 2009/10, down by 13% from the previous season. This decrease is shared by the three main producing regions: North Africa, the CFA Zone, and East and Southern Africa. However, African cotton exports were estimated at 915,000 tons in 2009/10, up by 10% from the previous season thanks to rebounding demand.
Africa accounted for 10% of world cotton area in 2009/10 (3.0 million hectares). However, the estimated average yield of 328 kg/ha remains less than half the world average. This is
partly explained by the fact that most cotton area in Africa is rainfed, while about half of the world cotton area is irrigated. Production in Africa accounted for 4% of the global output in 2009/10, down from 5% in the previous two seasons. Total cotton mill use in Africa decreased by 2% to 420,000 tons, or 2% of world cotton mill use.
Northern AfricaEgyptian cotton production continued to decline by 16% in 2009/10, to 100,000 tons, due to lower area and yields. Despite higher cotton prices received by farmers in 2008/09, a government decision to increase the area that could be sown to rice in 2009/10 negatively affected cotton plantings. 2009/10 produced the smallest cotton crop in Egypt in at least a century. Long staple (LS) cotton production increased by 5% to 87,000 tons while extra-long staple (ELS) cotton production fell by 44% to 13,000 tons, driven by a sharp drop in area. Exports rebounded by 90% to 76,000 tons, fueled by a large exportable surplus. Egypt is the largest African cotton consumer and Egyptian cotton mill use jumped by 27% to an estimated 190,000 tons, after a sharp fall in the previous season. Imports of upland cotton were estimated up to 120,000 tons.
Cotton production in Sudan dropped by over half in 2009/10 to 13,000 tons. Production of both Barakat (extra-fine) cotton and Acala (medium staple) cotton declined significantly. The average yield rebounded by 60% to 553 kg/ha. Sudanese cotton production has decreased significantly since 2004/05, when it reached 83,000 tons, driven by reductions in plantings. Policy changes to liberalize the agricultural sector, implemented since 2006/07, have facilitated further drops in cotton area. In 2009/10, new measures to support cotton production in the Gezira scheme (the largest cotton area in the country) did not encourage a rebound in cotton plantings. However, exports increased by 65% to 28,000 tons in 2009/10, fueled by large stocks and the rebound in demand for extra-fine cotton.
PRODUCTION: AFRICA
Million Tons
Francophone Africa
North Africa
Eastern & Southern
Africa

July-August 2010 17
CFA ZoneCotton production in the CFA zone fell by half in three seasons, from a record of 1.1 million tons in 2004/05 to 550,000 tons in 2007/08. Most of this decline was due to a reduction in cotton area, but the average yield also declined below 400 kg/ha. Since 2007/08, production has declined much more slowly. In 2009/10, cotton area decreased by 9% to 1.3 million hectares, due to lower seedcotton prices announced at planting time and unfavorable weather. The average yield remained stable at 377 kg/ha. As a result, production was down by 8% to a 20-year low of 490,000 tons. Cotton mill use in Francophone African countries remains small. It was estimated at 22,000 tons in 2009/10, accounting for 4% of local production. Exports were projected at 530,000 tons, up by 12% from 2008/09.
The combination of lower seedcotton prices and other general problems, including inclement weather, higher fertilizer prices, delayed and/or diminished input applications, and financial difficulties encountered by cotton companies, explain the continuous reduction in production in the CFA zone over the last five years. Between early 2002 and 2008, the strengthening of the CFA franc (pegged to the Euro) against the U.S. dollar offset most increases in international cotton prices, and exacerbated difficulties in years when world prices decreased. Producers’ seedcotton prices, usually announced before planting time, declined significantly in 2005/06 and remained low in the following two seasons. These prices were increased in 2008/09, but cotton area continued to decline that season due to other factors. In 2009/10, the announced seedcotton prices were either the same as or lower than in the previous season. Cotton area in the CFA zone continued to decrease, driven by drops in plantings in Chad, Benin, Burkina Faso, Cameroon and Togo. However, cotton plantings were significantly up in Mali and Côte d’Ivoire. Between December 2009 and June 2010, the CFA franc weakened against the U.S. dollar, with a positive impact on cotton prices expressed in CFA francs. This made possible sales of large quantities of CFA zone cotton, either already produced or to be produced in 2010/11.
Cotton production in Burkina Faso decreased by 16% to 152,000 tons in 2009/10, driven mainly by a reduction in area. The incentive to plant cotton was affected by a decrease in the seedcotton minimum price announced to producers before planting, from 165 FCFA/kg in 2008/09 to 160 FCFA/kg in 2009/10. In addition, an inadequate distribution of rains at planting time also limited cotton area. In the second season of production of biotech cotton in Burkina Faso, 128,000 hectares, accounting for almost a third of total cotton area, were planted with Bt cotton. This represented a significant increase from the 8,000 hectares planted in 2008/09, the first season of adoption of biotech cotton. Unfavorable weather affected the national average yield, down by 7% to 362 kg/ha in 2009/10. However, yields in fields planted to biotech varieties were higher than yields in adjoining fields planted with conventional varieties. In spite of lower production, cotton exports were projected up by 6% to around 170,000 tons
in 2009/10, driven by increased demand from Asia. Burkina Faso was the ninth largest cotton exporter in 2009/10.
Mali was one of the few countries in the CFA zone where cotton production increased in 2009/10. Production was up by 16% to 99,000 tons. This was the first increase in six years, but production remained well below the levels reached from the mid-1990s to the mid-2000s. The increase in production was driven by a significant rebound in cotton plantings, to 259,000 hectares. The seedcotton price announced to producers prior to planting was reduced from 200 FCFA/kg in 2008/09 to 170 FCFA/kg in 2009/10. In addition, delays in seedcotton payments continued in 2008/09. However, the government decided to subsidize fertilizer used on cotton at the same level as for grain production, encouraging an increase in cotton plantings. The average yield decreased by 12% to 382 kg/ha. Exports rebounded by an estimated 14% to 96,000 tons, driven by increased demand. The privatization of Mali’s national cotton company, CMDT (Compagnie Malienne pour le développement des textiles), is on-going. Four companies will soon be selected to take over the cotton production areas of Mali.
Cotton production in Côte d’Ivoire jumped by half to 81,000 tons in 2009/10, the second consecutive year of increase. This rebound was driven by an expansion in cotton plantings, encouraged by government subsidies for fertilizers (for which prices were already lower than in the previous season), higher seedcotton prices received in 2008/09, and changes in the way farmers’ debts are recovered. The seedcotton price announced before planting was reduced from 185 FCFA/kg in 2008/09 to 175 FCFA/kg in 2009/10. The average yield increased as well, to 432 kg/ha. Cotton exports from Côte d’Ivoire were estimated up in 2009/10.
Benin’s cotton production decreased in 2009/10 for the second consecutive year, to 68,000 tons, the smallest crop since the early 1990s. The continued drop in production was driven again by a reduction in plantings. Despite a stable seedcotton price of 190 FCFA/kg, higher than in other CFA zone countries, competition with food crops affected cotton area. Exports were projected higher at 85,000 tons in 2009/10.
After rebounding in 2008/09, cotton production in Cameroon decreased by 18% to 49,000 tons in 2009/10. The seedcotton price was kept stable in 2009/10, at 185 FCFA/kg. However, delays in seedcotton payments to producers in 2008/09, the lack of rains at planting time in 2009 and resulting significant abandonment affected cotton plantings. Cotton area decreased by 34% to 97,000 hectares. The average yield increased to 505 kg/ha. Despite the drop in production, cotton exports from Cameroon were estimated up to almost 60,000 tons due to increased demand.
Cotton production in Chad continued to drop in 2009/10, reaching 14,000 tons, the lowest level since the early 1960s. The 52% fall in 2009/10 was driven by a reduction in cotton plantings to 98,000 hectares. Many farmers have given up cotton

18 COTTON
cultivation, as at planting time in 2009 some of them were still waiting for seedcotton to be picked up from collection points and/or to receive payment for their production. No fertilizers were distributed for the second consecutive season, reducing the average yield to 140 kg/ha. Because the remaining small production is scattered around the territory, this creates huge logistical problems to transport seedcotton to ginning mills.
Production in Togo declined slightly to 11,000 tons in 2009/10, due to reduced plantings. Production in Senegal was estimated down for the third consecutive season, to 8,000 tons. The decline was explained by a reduction in plantings while the average yield remained almost stable at 350 kg/ha.
Anglophone West AfricaCotton area and production in Nigeria have significantly declined since 2004/05, mainly as a result of diminished market prospects due to a gradual reduction in domestic cotton mill use. Mill use was estimated down in 2009/10 to 15,000 tons, compared with 70,000 tons in 2004/05. The Nigerian textile industry has been severely affected in recent years by competition from Asia and smuggling of imported textile products into the country, but also high yarn production costs and frequent electricity shortages. Cotton production in Nigeria dropped by almost half in 2009/10, to 31,000 tons. This much-reduced crop is explained by a fall in planted area. Exports were estimated at around 28,000 tons in 2009/10, whereas imports likely fell to small levels.
Ghana’s cotton production was estimated at less than 3,000 tons in 2009/10.
East and Southern AfricaCotton production in East and Southern African countries decreased by 15% to 352,000 tons in 2009/10, due to reduced plantings. Production decreased in Tanzania, Uganda, Ethiopia and South Africa, but increased in Zimbabwe and Kenya. Cotton mill use stabilized around 250,000 tons in 2005/06 and 2006/07, but declined significantly afterwards. It was estimated between 150,000 tons and 155,000 tons in 2009/10. Cotton exports from East and Southern African countries, including inter-country shipments, were projected at 280,000 tons in 2009/10, down by 6% from the previous season. Imports declined by a third to 45,000 tons.
Cotton production in Tanzania decreased in 2009/10 for the second consecutive season, to 84,000 tons, due to reduced plantings. Several reasons explain the decrease in farmers’ interest in cotton production. Seedcotton prices paid to producers were lower in 2008/09 than in previous seasons. In addition, the attractiveness of competing crops such as tobacco and maize increased. Finally, cotton plantings were affected by late and poorly distributed rains. The average yield increased slightly to 230 kg/ha. Seedcotton prices paid for the 2009/10 crop were significantly higher than in 2008/09. Tanzania consumed around 30,000 tons of cotton and exported 60,000 tons in 2009/10.
Zimbabwe’s cotton production rebounded by 22% in 2009/10, to 105,000 tons, the first time in four seasons that production increased. Cotton area expanded to 340,000 hectares, driven by the higher seedcotton prices paid to farmers in 2008/09 and the implementation of a new system where ginners finance agricultural inputs. The average cotton yield, benefiting from larger than usual input supplies, increased to over 300 kg/ha. Domestic mill use was estimated around 11,000 tons and exports between 80,000 and 90,000 tons.
Cotton production in Zambia was slightly up in 2009/10, reaching 45,000 tons, due to a small expansion in cotton area to 242,000 ha. The attractiveness of cotton versus maize had increased and there were a number of negative issues regarding the marketing of maize in 2008/09 that encouraged some farmers to switch from maize to cotton production. In addition, the cost of agricultural inputs was lower than in the previous season. The cotton yield declined slightly to 186 kg/ha. Cotton exports, including shipments of the previous season’s crop, were projected at 44,000 tons in 2009/10, similar to the previous season’s exports.
Cotton production in South Africa declined to 8,000 tons in 2009/10, the smallest in almost five decades. Cotton area has declined continuously since the end of the 1990s; it stabilized around 10,000 hectares in recent seasons. The decrease in international cotton prices in the mid-2000s combined with a strong local currency and competition from maize and sunflower explain the nonstop decrease in cotton area in South Africa. However, most of the drop in production during 2009/10 was due to a drop in the average yield, to 820 kg/ha, due to an increase in the share of rainfed area. Cotton mill use in South Africa also decreased in the last decade, due mainly to strong competition from textile products imported from Asia. Mill use fell from 81,000 tons in 1997/98 to 38,000 tons in 2008/09, and dropped to 23,000 tons in 2009/10. Imports of cotton were estimated down to 17,000 tons in 2009/10. South Africa remains the largest importer of cotton in Sub-Saharan Africa.
Mozambique’s cotton output decreased slightly to 23,000 tons in 2009/10. A 24% decline in plantings, due to competition with food and cash crops and unfavorable weather, was almost entirely offset by a rebound in the average yield, to 183 kg/ha. There has been an increasing trend in yields in Mozambique in recent years due to investments in a better seed production system, integrated pest management, conservation farming and animal traction.
Cotton production in Uganda fell by 43% to 13,000 tons in 2009/10, driven by a reduction in plantings. The decline in seedcotton prices received by farmers in 2008/09, severe drought conditions at planting time in 2009, and competition from food crops, affected the area dedicated to cotton in 2009/10. Unfavorable weather during the growing season also affected the average yield, estimated at 186 kg/ha. Seedcotton prices received by farmers increased significantly in 2009/10.
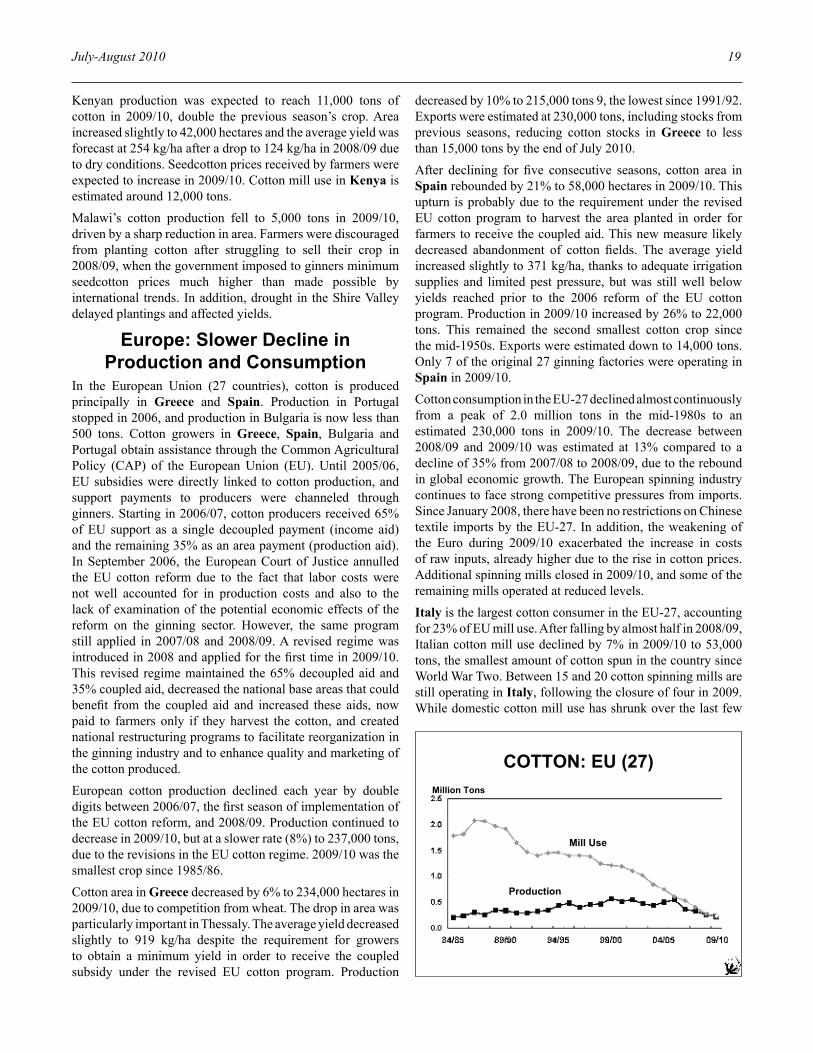
July-August 2010 19
Kenyan production was expected to reach 11,000 tons of cotton in 2009/10, double the previous season’s crop. Area increased slightly to 42,000 hectares and the average yield was forecast at 254 kg/ha after a drop to 124 kg/ha in 2008/09 due to dry conditions. Seedcotton prices received by farmers were expected to increase in 2009/10. Cotton mill use in Kenya is estimated around 12,000 tons.
Malawi’s cotton production fell to 5,000 tons in 2009/10, driven by a sharp reduction in area. Farmers were discouraged from planting cotton after struggling to sell their crop in 2008/09, when the government imposed to ginners minimum seedcotton prices much higher than made possible by international trends. In addition, drought in the Shire Valley delayed plantings and affected yields.
Europe: Slower decline in Production and Consumption
In the European Union (27 countries), cotton is produced principally in Greece and Spain. Production in Portugal stopped in 2006, and production in Bulgaria is now less than 500 tons. Cotton growers in Greece, Spain, Bulgaria and Portugal obtain assistance through the Common Agricultural Policy (CAP) of the European Union (EU). Until 2005/06, EU subsidies were directly linked to cotton production, and support payments to producers were channeled through ginners. Starting in 2006/07, cotton producers received 65% of EU support as a single decoupled payment (income aid) and the remaining 35% as an area payment (production aid). In September 2006, the European Court of Justice annulled the EU cotton reform due to the fact that labor costs were not well accounted for in production costs and also to the lack of examination of the potential economic effects of the reform on the ginning sector. However, the same program still applied in 2007/08 and 2008/09. A revised regime was introduced in 2008 and applied for the first time in 2009/10. This revised regime maintained the 65% decoupled aid and 35% coupled aid, decreased the national base areas that could benefit from the coupled aid and increased these aids, now paid to farmers only if they harvest the cotton, and created national restructuring programs to facilitate reorganization in the ginning industry and to enhance quality and marketing of the cotton produced.
European cotton production declined each year by double digits between 2006/07, the first season of implementation of the EU cotton reform, and 2008/09. Production continued to decrease in 2009/10, but at a slower rate (8%) to 237,000 tons, due to the revisions in the EU cotton regime. 2009/10 was the smallest crop since 1985/86.
Cotton area in Greece decreased by 6% to 234,000 hectares in 2009/10, due to competition from wheat. The drop in area was particularly important in Thessaly. The average yield decreased slightly to 919 kg/ha despite the requirement for growers to obtain a minimum yield in order to receive the coupled subsidy under the revised EU cotton program. Production
decreased by 10% to 215,000 tons 9, the lowest since 1991/92. Exports were estimated at 230,000 tons, including stocks from previous seasons, reducing cotton stocks in Greece to less than 15,000 tons by the end of July 2010.
After declining for five consecutive seasons, cotton area in Spain rebounded by 21% to 58,000 hectares in 2009/10. This upturn is probably due to the requirement under the revised EU cotton program to harvest the area planted in order for farmers to receive the coupled aid. This new measure likely decreased abandonment of cotton fields. The average yield increased slightly to 371 kg/ha, thanks to adequate irrigation supplies and limited pest pressure, but was still well below yields reached prior to the 2006 reform of the EU cotton program. Production in 2009/10 increased by 26% to 22,000 tons. This remained the second smallest cotton crop since the mid-1950s. Exports were estimated down to 14,000 tons. Only 7 of the original 27 ginning factories were operating in Spain in 2009/10.
Cotton consumption in the EU-27 declined almost continuously from a peak of 2.0 million tons in the mid-1980s to an estimated 230,000 tons in 2009/10. The decrease between 2008/09 and 2009/10 was estimated at 13% compared to a decline of 35% from 2007/08 to 2008/09, due to the rebound in global economic growth. The European spinning industry continues to face strong competitive pressures from imports. Since January 2008, there have been no restrictions on Chinese textile imports by the EU-27. In addition, the weakening of the Euro during 2009/10 exacerbated the increase in costs of raw inputs, already higher due to the rise in cotton prices. Additional spinning mills closed in 2009/10, and some of the remaining mills operated at reduced levels.
Italy is the largest cotton consumer in the EU-27, accounting for 23% of EU mill use. After falling by almost half in 2008/09, Italian cotton mill use declined by 7% in 2009/10 to 53,000 tons, the smallest amount of cotton spun in the country since World War Two. Between 15 and 20 cotton spinning mills are still operating in Italy, following the closure of four in 2009. While domestic cotton mill use has shrunk over the last few
COTTON: EU (27)
Million Tons
Mill Use
Production

20 COTTON
years, an important part of the cotton yarn spinning activities have been relocated to other countries but still belong to Italian companies. Cotton mill use in Greece was estimated at 40,000 tons in 2009/10, down by 7% from the previous season. Cotton consumption in Portugal decreased by 13% to 35,000 tons in 2009/10. Cotton mill use in Germany declined by 18% to 32,000 tons. In 2009, there were 19 cotton spinning mills with at least 50 employees in Germany.
France’s cotton consumption continued to decline to 13,000 tons, down by 20% from 2008/09. Three cotton spinning mills are still operating in France, one of them accounting for around 80% of total mill use. Mill use in the Czech Republic was estimated at 9,000 tons in 2009/10, down by a third from the previous season. Poland’s mill use also continued to decrease in 2009/10, to 7,000 tons, down 2,000 tons from 2008/09. In the first half of 2009, spinning mills closed and production of cotton yarns was continued in two mills. Cotton fabrics, knitted fabrics, bed linen and bathroom terry towel are made exclusively from imported yarns. Consumption of cotton waste is rising in Poland; it is currently around 6,000 tones. After falling by a third in 2008/09, cotton mill consumption in Belgium continued to decrease by 20% to 9,000 tons in 2009/10. One cotton spinning mill stopped operating in 2009/10, and there are now two cotton spinning mills operating in the country. In Spain, cotton consumption is estimated stable at 11,000 tons. There are seven cotton spinning mills still operating in Spain. In Austria, cotton consumption was expected to continue to decrease to 4,000 tons in 2009/10. In Switzerland, cotton use decreased by 20% to 3,000 tons in 2009/10. One cotton spinning mill now operates in Switzerland; it produces high-count cotton yarns. Switzerland is the location of many organizations servicing the cotton industry, including merchants, controllers, and banks.
Consumption of cotton in Finland has stopped since the major spinning mill closed in 1998. The Netherlands import small quantities of cotton, which are re-exported. However, both Finland and the Netherlands import cotton fabrics for finishing and dyeing, and both countries have manufacturing industries that use cotton products. The governments of Finland and the Netherlands maintain an interest in cotton on behalf of their own industries and to support producers in developing countries.
Since 2004/05, cotton use in the United Kingdom has been reduced to less than 1,000 tons, down from 465,000 tons in the 1950s. However, the United Kingdom remains the location of the International Cotton Association (ICA) and companies servicing the cotton industry.
After remaining close to 300,000 tons for six years, cotton mill use in Russia fell significantly in 2007/08 and 2008/09, to an estimated 206,000 tons. Cotton mill use continued to decrease, but at a slower pace, in 2009/10 to 190,000 tons. The largest constraint faced by Russian mills is tight credit: textile companies do not have enough capital to qualify for
commercial loans to update machinery. The textile industry also faces significant illegal imports of textile products. Most Russian spinning mills are producing cotton yarn for the domestic market. Russia does not produce cotton, and its suppliers are Central Asian countries.
North America: Continued decline in Production and Consumption
After falling by a third in 2008/09, cotton production in North America continued to decline in 2009/10 but at a slower pace. Cotton production was estimated at 2.7 million tons, down by 6% from the previous year. This was the fourth consecutive season of decline in production in this region. Cotton consumption also continued to contract for the fifth consecutive season, to 1.17 million tons (-3%).
Production in the United States decreased by 5% in 2009/10, to 2.7 million tons. This was the smallest crop since 1986/87. Cotton planted area decreased by 3% to 3.7 million hectares, due to continued competition from grains and soybeans and high cotton production costs. However, the abandonment rate was slightly down, from 20% in 2008/09 to 16% in 2009/10. As a result, harvested cotton area declined by only 0.5% to 3.0 million hectares in 2009/10. The average yield decreased by 4% to 871 kg/ha due to unfavorable weather. This was the second consecutive year of decline in the US cotton yield. While Upland cotton production decreased by 3% to 2.6 million tons, Pima cotton production was down by 7% to 87,000 tons, the smallest crop in nine years due to water constraints and competition from specialty crops.
The United States is the seventh largest consumer of raw cotton. U.S. mill consumption of cotton continued to contract in 2009/10, but more slowly than the previous season. It was estimated at 740,000 tons, down by 5% from 2008/09. The United States remains the largest market for cotton at the retail level. Net domestic consumption of cotton in the United States decreased by 11% to 4.0 million tons. The share of cotton in total domestic consumption of fiber remained stable at 41%. The volume of U.S. imports of cotton products
MILL USE: RUSSIAThousand Tons
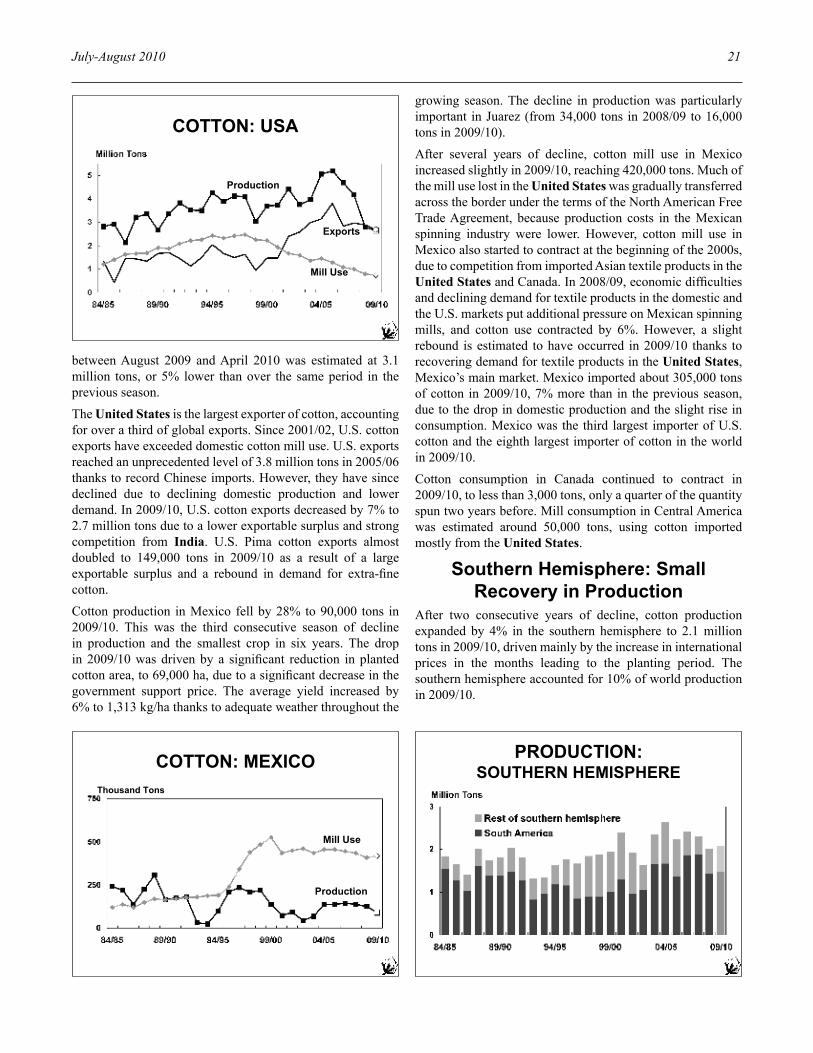
July-August 2010 21
between August 2009 and April 2010 was estimated at 3.1 million tons, or 5% lower than over the same period in the previous season.
The United States is the largest exporter of cotton, accounting for over a third of global exports. Since 2001/02, U.S. cotton exports have exceeded domestic cotton mill use. U.S. exports reached an unprecedented level of 3.8 million tons in 2005/06 thanks to record Chinese imports. However, they have since declined due to declining domestic production and lower demand. In 2009/10, U.S. cotton exports decreased by 7% to 2.7 million tons due to a lower exportable surplus and strong competition from India. U.S. Pima cotton exports almost doubled to 149,000 tons in 2009/10 as a result of a large exportable surplus and a rebound in demand for extra-fine cotton.
Cotton production in Mexico fell by 28% to 90,000 tons in 2009/10. This was the third consecutive season of decline in production and the smallest crop in six years. The drop in 2009/10 was driven by a significant reduction in planted cotton area, to 69,000 ha, due to a significant decrease in the government support price. The average yield increased by 6% to 1,313 kg/ha thanks to adequate weather throughout the
growing season. The decline in production was particularly important in Juarez (from 34,000 tons in 2008/09 to 16,000 tons in 2009/10).
After several years of decline, cotton mill use in Mexico increased slightly in 2009/10, reaching 420,000 tons. Much of the mill use lost in the United States was gradually transferred across the border under the terms of the North American Free Trade Agreement, because production costs in the Mexican spinning industry were lower. However, cotton mill use in Mexico also started to contract at the beginning of the 2000s, due to competition from imported Asian textile products in the United States and Canada. In 2008/09, economic difficulties and declining demand for textile products in the domestic and the U.S. markets put additional pressure on Mexican spinning mills, and cotton use contracted by 6%. However, a slight rebound is estimated to have occurred in 2009/10 thanks to recovering demand for textile products in the United States, Mexico’s main market. Mexico imported about 305,000 tons of cotton in 2009/10, 7% more than in the previous season, due to the drop in domestic production and the slight rise in consumption. Mexico was the third largest importer of U.S. cotton and the eighth largest importer of cotton in the world in 2009/10.
Cotton consumption in Canada continued to contract in 2009/10, to less than 3,000 tons, only a quarter of the quantity spun two years before. Mill consumption in Central America was estimated around 50,000 tons, using cotton imported mostly from the United States.
Southern Hemisphere: Small Recovery in Production
After two consecutive years of decline, cotton production expanded by 4% in the southern hemisphere to 2.1 million tons in 2009/10, driven mainly by the increase in international prices in the months leading to the planting period. The southern hemisphere accounted for 10% of world production in 2009/10.
COTTON: USA
Exports
Mill Use
Production
COTTON: MEXICO
Thousand Tons
Mill Use
Production
PRODUCTION:SOUTHERN HEMISPHERE
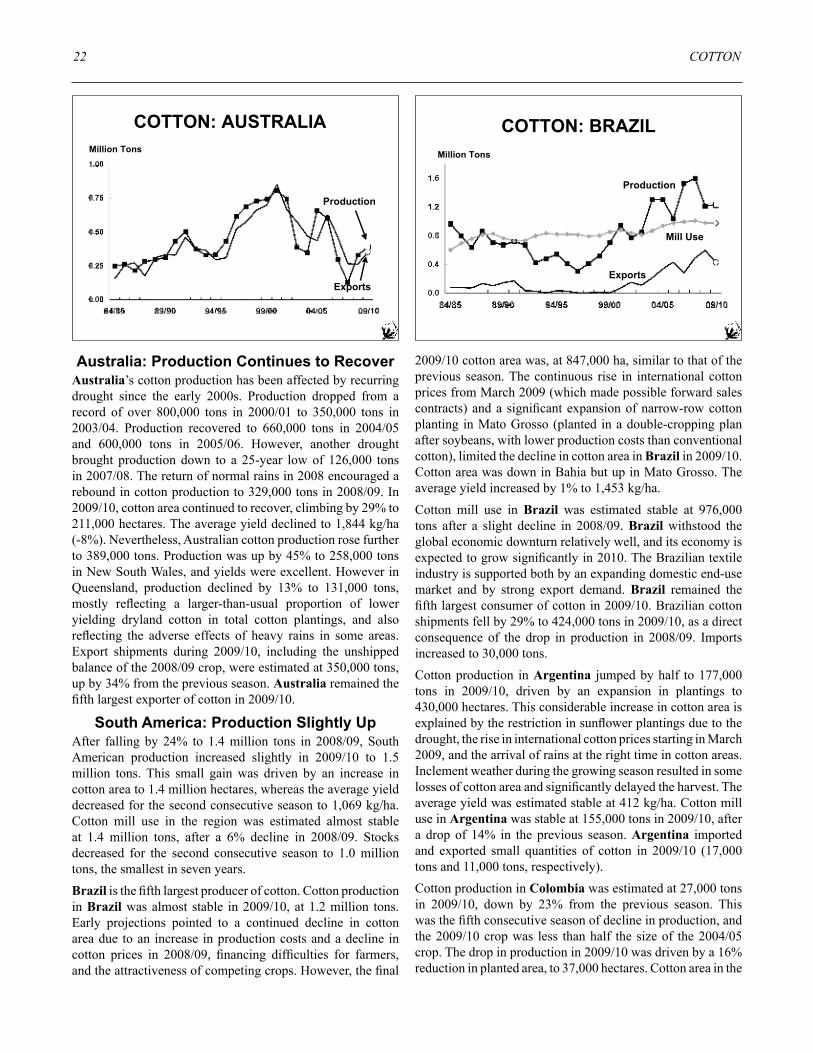
22 COTTON
Australia: Production Continues to RecoverAustralia’s cotton production has been affected by recurring drought since the early 2000s. Production dropped from a record of over 800,000 tons in 2000/01 to 350,000 tons in 2003/04. Production recovered to 660,000 tons in 2004/05 and 600,000 tons in 2005/06. However, another drought brought production down to a 25-year low of 126,000 tons in 2007/08. The return of normal rains in 2008 encouraged a rebound in cotton production to 329,000 tons in 2008/09. In 2009/10, cotton area continued to recover, climbing by 29% to 211,000 hectares. The average yield declined to 1,844 kg/ha (-8%). Nevertheless, Australian cotton production rose further to 389,000 tons. Production was up by 45% to 258,000 tons in New South Wales, and yields were excellent. However in Queensland, production declined by 13% to 131,000 tons, mostly reflecting a larger-than-usual proportion of lower yielding dryland cotton in total cotton plantings, and also reflecting the adverse effects of heavy rains in some areas. Export shipments during 2009/10, including the unshipped balance of the 2008/09 crop, were estimated at 350,000 tons, up by 34% from the previous season. Australia remained the fifth largest exporter of cotton in 2009/10.
South America: Production Slightly UpAfter falling by 24% to 1.4 million tons in 2008/09, South American production increased slightly in 2009/10 to 1.5 million tons. This small gain was driven by an increase in cotton area to 1.4 million hectares, whereas the average yield decreased for the second consecutive season to 1,069 kg/ha. Cotton mill use in the region was estimated almost stable at 1.4 million tons, after a 6% decline in 2008/09. Stocks decreased for the second consecutive season to 1.0 million tons, the smallest in seven years.
Brazil is the fifth largest producer of cotton. Cotton production in Brazil was almost stable in 2009/10, at 1.2 million tons. Early projections pointed to a continued decline in cotton area due to an increase in production costs and a decline in cotton prices in 2008/09, financing difficulties for farmers, and the attractiveness of competing crops. However, the final
COTTON: BRAZIL
Million Tons
Mill Use
Production
Exports
COTTON: AUSTRALIA
Million Tons
Production
Exports
2009/10 cotton area was, at 847,000 ha, similar to that of the previous season. The continuous rise in international cotton prices from March 2009 (which made possible forward sales contracts) and a significant expansion of narrow-row cotton planting in Mato Grosso (planted in a double-cropping plan after soybeans, with lower production costs than conventional cotton), limited the decline in cotton area in Brazil in 2009/10. Cotton area was down in Bahia but up in Mato Grosso. The average yield increased by 1% to 1,453 kg/ha.
Cotton mill use in Brazil was estimated stable at 976,000 tons after a slight decline in 2008/09. Brazil withstood the global economic downturn relatively well, and its economy is expected to grow significantly in 2010. The Brazilian textile industry is supported both by an expanding domestic end-use market and by strong export demand. Brazil remained the fifth largest consumer of cotton in 2009/10. Brazilian cotton shipments fell by 29% to 424,000 tons in 2009/10, as a direct consequence of the drop in production in 2008/09. Imports increased to 30,000 tons.
Cotton production in Argentina jumped by half to 177,000 tons in 2009/10, driven by an expansion in plantings to 430,000 hectares. This considerable increase in cotton area is explained by the restriction in sunflower plantings due to the drought, the rise in international cotton prices starting in March 2009, and the arrival of rains at the right time in cotton areas. Inclement weather during the growing season resulted in some losses of cotton area and significantly delayed the harvest. The average yield was estimated stable at 412 kg/ha. Cotton mill use in Argentina was stable at 155,000 tons in 2009/10, after a drop of 14% in the previous season. Argentina imported and exported small quantities of cotton in 2009/10 (17,000 tons and 11,000 tons, respectively).
Cotton production in Colombia was estimated at 27,000 tons in 2009/10, down by 23% from the previous season. This was the fifth consecutive season of decline in production, and the 2009/10 crop was less than half the size of the 2004/05 crop. The drop in production in 2009/10 was driven by a 16% reduction in planted area, to 37,000 hectares. Cotton area in the

July-August 2010 23
Coastal region declined slightly to 31,000 hectares, whereas cotton area in the Interior region dropped by almost half to 6,000 hectares. El Niño conditions prevented planting of an additional 5,000 hectares in the Coastal region. The average yield was also down by 9% to 746 kg/ha. Cotton mill use was estimated stable at 85,000 tons. Imports were estimated down to 50,000 tons. Colombia has been a net importer of cotton since 1992/93.
Cotton production in Peru was estimated at 28,000 tons in 2009/10, 21% down from the previous season and the smallest crop in more than seven decades. The decrease in production was led again by a decline in planted area. The long-term decline in cotton area in Peru results from various factors, including stagnating yields, lack of research and extension, degeneration of varieties, and financing difficulties. Consumption was estimated around 90,000 tons in 2009/10, down by 10% from 2008/09. As a result of the increasing gap
between production and consumption, Peru’s cotton imports increased to almost 60,000 tons in 2009/10. Most imported cotton comes from the United States.
Cotton area in Paraguay shrank significantly over the last decade due mainly to low cotton prices relative to prices of competing crops, increased boll weevil pressure, and low yields resulting from declining soil fertility, low-quality seeds and poor planting techniques. There are insufficient extension services for cotton producers. Over recent seasons, many traditional cotton farmers switched to sesame. In 2009/10 cotton area dropped by two-thirds to 18,000 hectares. The average yield also decreased due to unfavorable weather. Production fell by 71% to 5,000 tons. This was the sixth consecutive season of decline in production and the smallest crop in 50 years. Domestic cotton mill use was estimated at 7,000 tons in 2009/10, and exports at 4,000 tons.
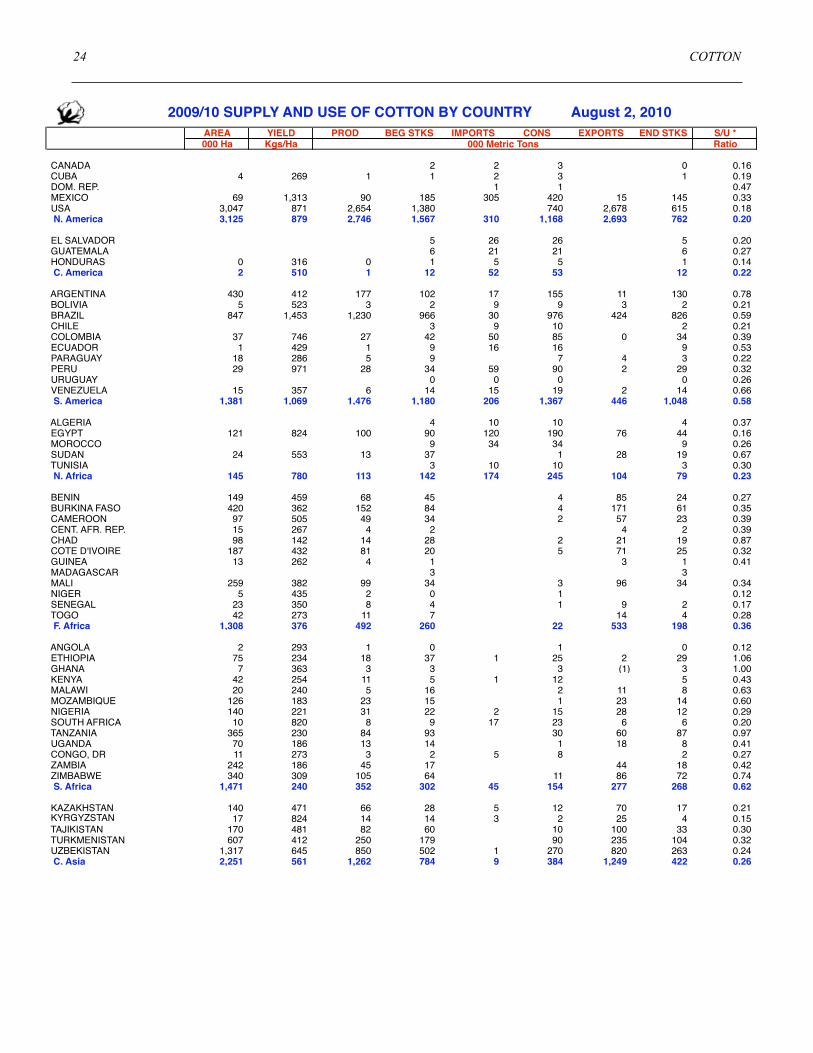
24 COTTON
2009/10 SUPPLY AND USE OF COTTON BY COUNTRY August 2, 2010AREA YIELD PROD BEG STKS IMPORTS CONS EXPORTS END STKS S/U *000 Ha Kgs/Ha 000 Metric Tons Ratio
CANADA 2 2 3 0 0.16 CUBA 4 269 1 1 2 3 1 0.19 DOM. REP. 1 1 0.47 MEXICO 69 1,313 90 185 305 420 15 145 0.33 USA 3,047 871 2,654 1,380 740 2,678 615 0.18 N. America 3,125 879 2,746 1,567 310 1,168 2,693 762 0.20
EL SALVADOR 5 26 26 5 0.20 GUATEMALA 6 21 21 6 0.27 HONDURAS 0 316 0 1 5 5 1 0.14 C. America 2 510 1 12 52 53 12 0.22
ARGENTINA 430 412 177 102 17 155 11 130 0.78 BOLIVIA 5 523 3 2 9 9 3 2 0.21 BRAZIL 847 1,453 1,230 966 30 976 424 826 0.59 CHILE 3 9 10 2 0.21 COLOMBIA 37 746 27 42 50 85 0 34 0.39 ECUADOR 1 429 1 9 16 16 9 0.53 PARAGUAY 18 286 5 9 7 4 3 0.22 PERU 29 971 28 34 59 90 2 29 0.32 URUGUAY 0 0 0 0 0.26 VENEZUELA 15 357 6 14 15 19 2 14 0.66 S. America 1,381 1,069 1,476 1,180 206 1,367 446 1,048 0.58
ALGERIA 4 10 10 4 0.37 EGYPT 121 824 100 90 120 190 76 44 0.16 MOROCCO 9 34 34 9 0.26 SUDAN 24 553 13 37 1 28 19 0.67 TUNISIA 3 10 10 3 0.30 N. Africa 145 780 113 142 174 245 104 79 0.23
BENIN 149 459 68 45 4 85 24 0.27 BURKINA FASO 420 362 152 84 4 171 61 0.35 CAMEROON 97 505 49 34 2 57 23 0.39 CENT. AFR. REP. 15 267 4 2 4 2 0.39 CHAD 98 142 14 28 2 21 19 0.87 COTE D'IVOIRE 187 432 81 20 5 71 25 0.32 GUINEA 13 262 4 1 3 1 0.41 MADAGASCAR 3 3 MALI 259 382 99 34 3 96 34 0.34 NIGER 5 435 2 0 1 0.12 SENEGAL 23 350 8 4 1 9 2 0.17 TOGO 42 273 11 7 14 4 0.28 F. Africa 1,308 376 492 260 22 533 198 0.36
ANGOLA 2 293 1 0 1 0 0.12 ETHIOPIA 75 234 18 37 1 25 2 29 1.06 GHANA 7 363 3 3 3 (1) 3 1.00 KENYA 42 254 11 5 1 12 5 0.43 MALAWI 20 240 5 16 2 11 8 0.63 MOZAMBIQUE 126 183 23 15 1 23 14 0.60 NIGERIA 140 221 31 22 2 15 28 12 0.29 SOUTH AFRICA 10 820 8 9 17 23 6 6 0.20 TANZANIA 365 230 84 93 30 60 87 0.97 UGANDA 70 186 13 14 1 18 8 0.41 CONGO, DR 11 273 3 2 5 8 2 0.27 ZAMBIA 242 186 45 17 44 18 0.42 ZIMBABWE 340 309 105 64 11 86 72 0.74 S. Africa 1,471 240 352 302 45 154 277 268 0.62
KAZAKHSTAN 140 471 66 28 5 12 70 17 0.21 KYRGYZSTAN 17 824 14 14 3 2 25 4 0.15 TAJIKISTAN 170 481 82 60 10 100 33 0.30 TURKMENISTAN 607 412 250 179 90 235 104 0.32 UZBEKISTAN 1,317 645 850 502 1 270 820 263 0.24 C. Asia 2,251 561 1,262 784 9 384 1,249 422 0.26
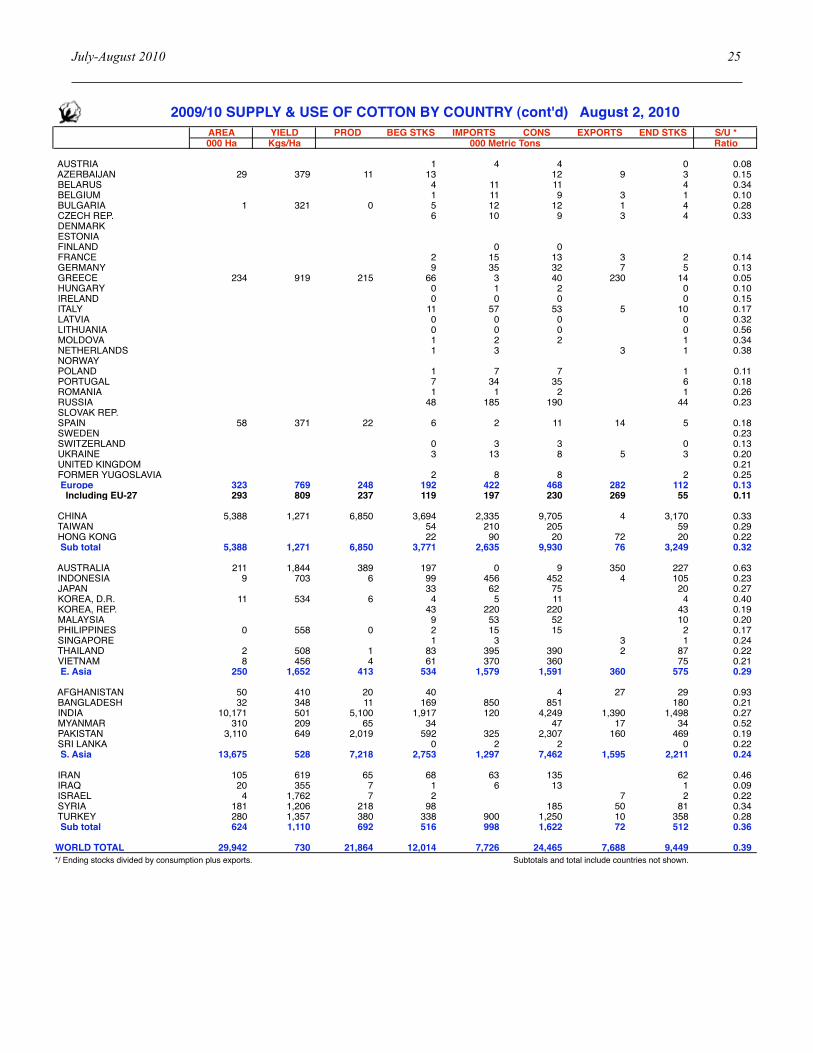
July-August 2010 25
2009/10 SUPPLY & USE OF COTTON BY COUNTRY (cont'd) August 2, 2010AREA YIELD PROD BEG STKS IMPORTS CONS EXPORTS END STKS S/U *000 Ha Kgs/Ha 000 Metric Tons Ratio
AUSTRIA 1 4 4 0 0.08 AZERBAIJAN 29 379 11 13 12 9 3 0.15 BELARUS 4 11 11 4 0.34 BELGIUM 1 11 9 3 1 0.10 BULGARIA 1 321 0 5 12 12 1 4 0.28 CZECH REP. 6 10 9 3 4 0.33 DENMARK ESTONIA FINLAND 0 0 FRANCE 2 15 13 3 2 0.14 GERMANY 9 35 32 7 5 0.13 GREECE 234 919 215 66 3 40 230 14 0.05 HUNGARY 0 1 2 0 0.10 IRELAND 0 0 0 0 0.15 ITALY 11 57 53 5 10 0.17 LATVIA 0 0 0 0 0.32 LITHUANIA 0 0 0 0 0.56 MOLDOVA 1 2 2 1 0.34 NETHERLANDS 1 3 3 1 0.38 NORWAY POLAND 1 7 7 1 0.11 PORTUGAL 7 34 35 6 0.18 ROMANIA 1 1 2 1 0.26 RUSSIA 48 185 190 44 0.23 SLOVAK REP. SPAIN 58 371 22 6 2 11 14 5 0.18 SWEDEN 0.23 SWITZERLAND 0 3 3 0 0.13 UKRAINE 3 13 8 5 3 0.20 UNITED KINGDOM 0.21 FORMER YUGOSLAVIA 2 8 8 2 0.25 Europe 323 769 248 192 422 468 282 112 0.13 Including EU-27 293 809 237 119 197 230 269 55 0.11
CHINA 5,388 1,271 6,850 3,694 2,335 9,705 4 3,170 0.33 TAIWAN 54 210 205 59 0.29 HONG KONG 22 90 20 72 20 0.22 Sub total 5,388 1,271 6,850 3,771 2,635 9,930 76 3,249 0.32
AUSTRALIA 211 1,844 389 197 0 9 350 227 0.63 INDONESIA 9 703 6 99 456 452 4 105 0.23 JAPAN 33 62 75 20 0.27 KOREA, D.R. 11 534 6 4 5 11 4 0.40 KOREA, REP. 43 220 220 43 0.19 MALAYSIA 9 53 52 10 0.20 PHILIPPINES 0 558 0 2 15 15 2 0.17 SINGAPORE 1 3 3 1 0.24 THAILAND 2 508 1 83 395 390 2 87 0.22 VIETNAM 8 456 4 61 370 360 75 0.21 E. Asia 250 1,652 413 534 1,579 1,591 360 575 0.29
AFGHANISTAN 50 410 20 40 4 27 29 0.93 BANGLADESH 32 348 11 169 850 851 180 0.21 INDIA 10,171 501 5,100 1,917 120 4,249 1,390 1,498 0.27 MYANMAR 310 209 65 34 47 17 34 0.52 PAKISTAN 3,110 649 2,019 592 325 2,307 160 469 0.19 SRI LANKA 0 2 2 0 0.22 S. Asia 13,675 528 7,218 2,753 1,297 7,462 1,595 2,211 0.24
IRAN 105 619 65 68 63 135 62 0.46 IRAQ 20 355 7 1 6 13 1 0.09 ISRAEL 4 1,762 7 2 7 2 0.22 SYRIA 181 1,206 218 98 185 50 81 0.34 TURKEY 280 1,357 380 338 900 1,250 10 358 0.28 Sub total 624 1,110 692 516 998 1,622 72 512 0.36
WORLD TOTAL 29,942 730 21,864 12,014 7,726 24,465 7,688 9,449 0.39*/ Ending stocks divided by consumption plus exports. Subtotals and total include countries not shown.

26 COTTON
2010/11 SUPPLY AND USE OF COTTON BY COUNTRY August 2, 2010AREA YIELD PROD BEG STKS IMPORTS CONS EXPORTS END STKS S/U *000 Ha Kgs/Ha 000 Metric Tons Ratio
CANADA 0 2 2 0 0.11 CUBA 4 269 1 1 2 3 1 0.19 DOM. REP. 1 1 0.47 MEXICO 114 1,280 146 145 266 420 14 123 0.28 USA 4,211 966 4,069 615 703 3,180 800 0.21 N. America 4,334 973 4,216 762 272 1,131 3,194 925 0.21
EL SALVADOR 5 26 26 5 0.20 GUATEMALA 6 21 21 6 0.27 HONDURAS 0 316 0 1 5 5 1 0.14 C. America 2 510 1 12 52 53 12 0.22
ARGENTINA 452 416 188 130 17 158 47 130 0.63 BOLIVIA 5 525 3 2 9 9 3 2 0.21 BRAZIL 1,000 1,480 1,480 826 26 1,000 472 859 0.58 CHILE 2 10 10 2 0.21 COLOMBIA 38 750 29 34 57 85 0 34 0.39 ECUADOR 1 431 1 9 16 16 9 0.53 PARAGUAY 38 300 11 3 7 5 2 0.21 PERU 26 976 25 29 65 90 5 25 0.26 URUGUAY 0 0 0 0 0.26 VENEZUELA 15 361 6 14 15 19 2 14 0.66 S. America 1,576 1,106 1,742 1,048 215 1,395 534 1,077 0.56
ALGERIA 4 10 10 4 0.37 EGYPT 157 842 132 44 135 184 74 53 0.20 MOROCCO 9 34 34 9 0.26 SUDAN 120 385 46 19 1 34 30 0.86 TUNISIA 3 10 10 3 0.30 N. Africa 277 644 178 79 189 239 108 98 0.28
BENIN 200 465 93 24 4 80 33 0.39 BURKINA FASO 470 420 197 61 4 180 75 0.41 CAMEROON 145 430 62 23 2 55 28 0.49 CENT. AFR. REP. 15 269 4 2 4 2 0.40 CHAD 79 142 11 19 2 15 14 0.83 COTE D'IVOIRE 206 400 82 25 5 77 25 0.30 GUINEA 13 262 4 1 4 1 0.40 MADAGASCAR 3 3 MALI 272 400 109 34 3 99 40 0.39 NIGER 5 439 2 0 1 0.12 SENEGAL 25 375 9 2 1 7 3 0.35 TOGO 50 276 14 4 13 5 0.37 F. Africa 1,479 397 588 198 22 536 228 0.41
ANGOLA 3 296 1 0 1 0 0.16 ETHIOPIA 79 236 19 29 1 24 2 23 0.88 GHANA 7 367 3 3 3 (1) 3 0.98 KENYA 44 256 11 5 12 5 0.42 MALAWI 30 240 7 8 2 7 6 0.73 MOZAMBIQUE 128 185 24 14 1 22 15 0.63 NIGERIA 200 224 45 12 1 18 26 14 0.33 SOUTH AFRICA 11 890 9 6 16 21 6 5 0.18 TANZANIA 420 232 98 87 30 60 95 1.05 UGANDA 100 300 30 8 1 24 12 0.48 CONGO, DR 11 276 3 2 5 8 2 0.27 ZAMBIA 255 188 48 18 47 19 0.40 ZIMBABWE 391 312 122 72 11 100 83 0.75 S. Africa 1,698 249 423 268 42 153 295 286 0.64
KAZAKHSTAN 140 500 70 17 5 11 64 17 0.23 KYRGYZSTAN 20 824 16 4 3 2 20 2 0.08 TAJIKISTAN 165 490 81 33 9 79 26 0.30 TURKMENISTAN 698 430 300 104 90 232 83 0.26 UZBEKISTAN 1,330 775 1,031 263 1 273 759 263 0.26 C. Asia 2,353 637 1,498 422 9 384 1,153 392 0.25
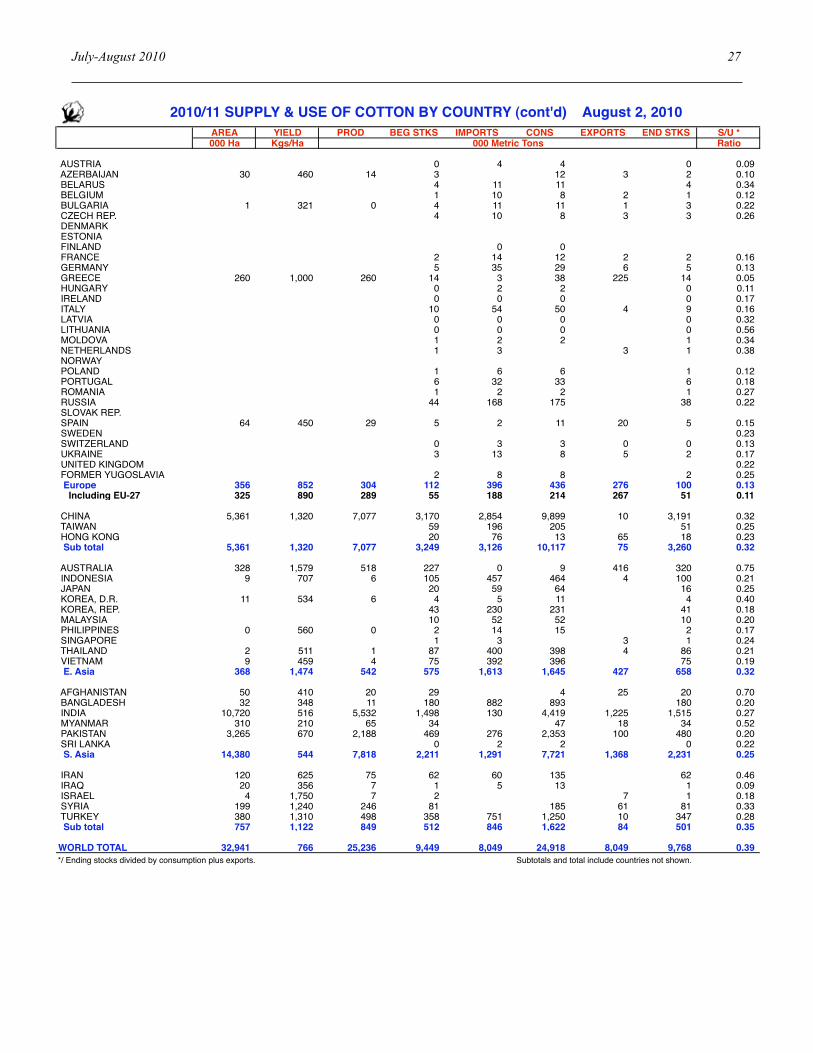
July-August 2010 27
2010/11 SUPPLY & USE OF COTTON BY COUNTRY (cont'd) August 2, 2010AREA YIELD PROD BEG STKS IMPORTS CONS EXPORTS END STKS S/U *000 Ha Kgs/Ha 000 Metric Tons Ratio
AUSTRIA 0 4 4 0 0.09 AZERBAIJAN 30 460 14 3 12 3 2 0.10 BELARUS 4 11 11 4 0.34 BELGIUM 1 10 8 2 1 0.12 BULGARIA 1 321 0 4 11 11 1 3 0.22 CZECH REP. 4 10 8 3 3 0.26 DENMARK ESTONIA FINLAND 0 0 FRANCE 2 14 12 2 2 0.16 GERMANY 5 35 29 6 5 0.13 GREECE 260 1,000 260 14 3 38 225 14 0.05 HUNGARY 0 2 2 0 0.11 IRELAND 0 0 0 0 0.17 ITALY 10 54 50 4 9 0.16 LATVIA 0 0 0 0 0.32 LITHUANIA 0 0 0 0 0.56 MOLDOVA 1 2 2 1 0.34 NETHERLANDS 1 3 3 1 0.38 NORWAY POLAND 1 6 6 1 0.12 PORTUGAL 6 32 33 6 0.18 ROMANIA 1 2 2 1 0.27 RUSSIA 44 168 175 38 0.22 SLOVAK REP. SPAIN 64 450 29 5 2 11 20 5 0.15 SWEDEN 0.23 SWITZERLAND 0 3 3 0 0 0.13 UKRAINE 3 13 8 5 2 0.17 UNITED KINGDOM 0.22 FORMER YUGOSLAVIA 2 8 8 2 0.25 Europe 356 852 304 112 396 436 276 100 0.13 Including EU-27 325 890 289 55 188 214 267 51 0.11
CHINA 5,361 1,320 7,077 3,170 2,854 9,899 10 3,191 0.32 TAIWAN 59 196 205 51 0.25 HONG KONG 20 76 13 65 18 0.23 Sub total 5,361 1,320 7,077 3,249 3,126 10,117 75 3,260 0.32
AUSTRALIA 328 1,579 518 227 0 9 416 320 0.75 INDONESIA 9 707 6 105 457 464 4 100 0.21 JAPAN 20 59 64 16 0.25 KOREA, D.R. 11 534 6 4 5 11 4 0.40 KOREA, REP. 43 230 231 41 0.18 MALAYSIA 10 52 52 10 0.20 PHILIPPINES 0 560 0 2 14 15 2 0.17 SINGAPORE 1 3 3 1 0.24 THAILAND 2 511 1 87 400 398 4 86 0.21 VIETNAM 9 459 4 75 392 396 75 0.19 E. Asia 368 1,474 542 575 1,613 1,645 427 658 0.32
AFGHANISTAN 50 410 20 29 4 25 20 0.70 BANGLADESH 32 348 11 180 882 893 180 0.20 INDIA 10,720 516 5,532 1,498 130 4,419 1,225 1,515 0.27 MYANMAR 310 210 65 34 47 18 34 0.52 PAKISTAN 3,265 670 2,188 469 276 2,353 100 480 0.20 SRI LANKA 0 2 2 0 0.22 S. Asia 14,380 544 7,818 2,211 1,291 7,721 1,368 2,231 0.25
IRAN 120 625 75 62 60 135 62 0.46 IRAQ 20 356 7 1 5 13 1 0.09 ISRAEL 4 1,750 7 2 7 1 0.18 SYRIA 199 1,240 246 81 185 61 81 0.33 TURKEY 380 1,310 498 358 751 1,250 10 347 0.28 Sub total 757 1,122 849 512 846 1,622 84 501 0.35
WORLD TOTAL 32,941 766 25,236 9,449 8,049 24,918 8,049 9,768 0.39*/ Ending stocks divided by consumption plus exports. Subtotals and total include countries not shown.

Interna
tiona
l Forum for Cotton
Promotion
A Resource Tool for the International Forum for
Cotton Promotion
The International Forum for Cotton Promotion presents:
Cotton Promotion Workshop 2010 Sponsored by Cotton Incorporated and Cotton Council International
International Cotton Advisory Committee Plenary Meeting
Thursday, September 23, 201011:00 Second Breakout SessionLubbock, Texas
cottonpromotion.org


