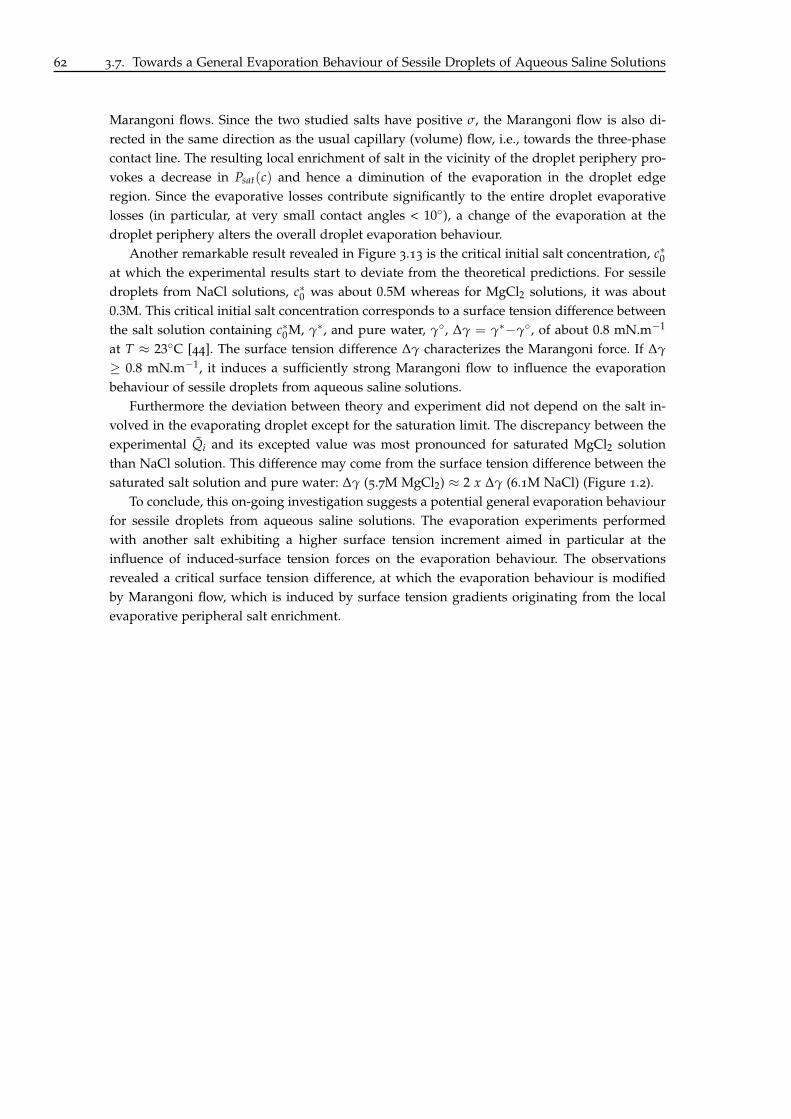
International Cotutelle THESE pour obtenir le grade de Docteur Délivré par : l’Université Montpellier II DISSERTATION zur Erlangung des akademischen Grades "Doctor rerum naturalium" (Dr. rer. nat.) Eingereicht an: der Universität Potsdam Sessile Droplets of Salt Solutions on Inert and Metallic Surfaces: Influence of Salt Concentration Gradients on Evaporation and Corrosion Behaviour Virginie Soulié JURY Prof. Dr. DUFRÊCHE Jean-François ICSM Chairman Dr. RIEGLER Hans MPIKG Examiner Dr. LEQUIEN Florence CEA Saclay Examiner Doctoral Schools and specialities: Sciences Chimiques Balard ED 469: Chimie et Physico-Chimie des Matériaux Mathematisch-Naturwissenschaftlichen Fakultät: Physikalische Chemie Research Units: Commissariat à l’Energie Atomique et aux Energies Alternatives (Saclay, France) Max-Planck-Institut für Kolloid- und Grenzflächenforschung (Potsdam, Germany) in partnership with L.I.A "RECYCLING" CNRS - MPG PhD Supervisors: Prof. Dr. ZEMB Thomas ICSM Prof. Dr. Dr. h.c. MÖHWALD Helmuth MPIKG Reviewers: Prof. Dr. BREZESINSKI Gerald MPIKG Prof. Dr. LEVITZ Pierre UPMC - CNRS Paris, September 2015
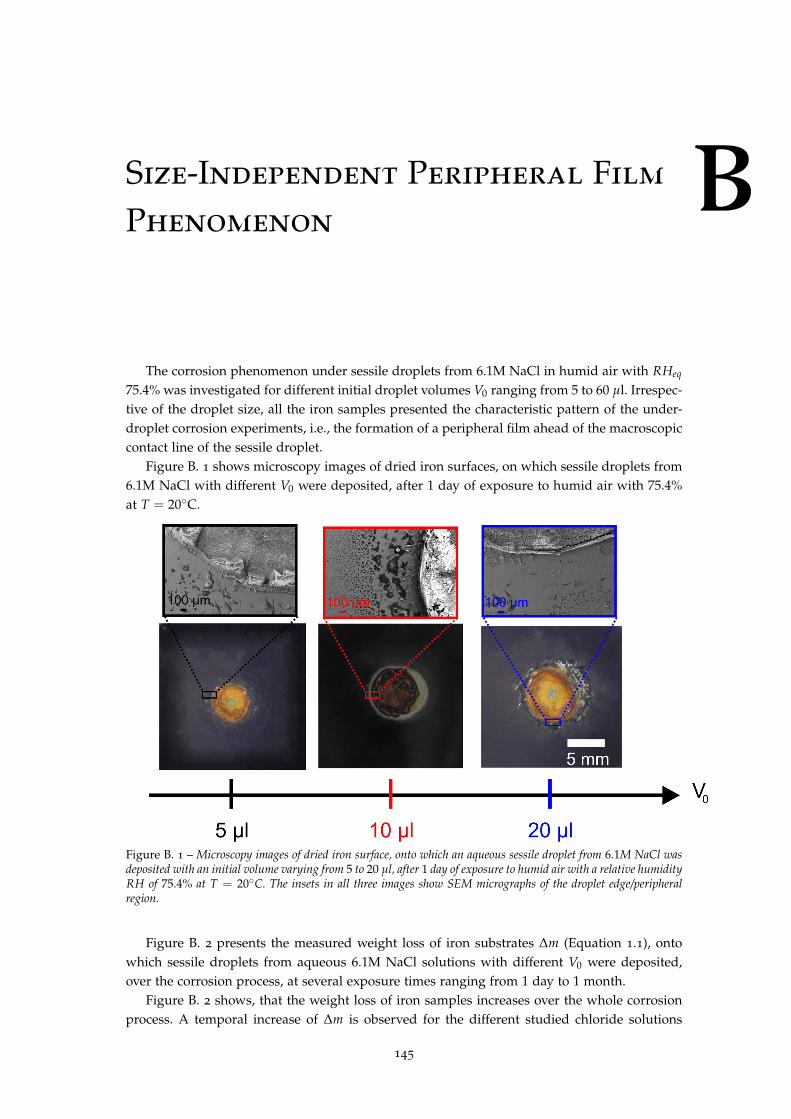
Transcript
International Cotutelle
THESEpour obtenir le grade de Docteur
Délivré par : l’Université Montpellier II
DISSERTATIONzur Erlangung des akademischen Grades "Doctor rerum naturalium" (Dr. rer. nat.)
Eingereicht an: der Universität Potsdam
Sessile Droplets of Salt Solutions on Inert and Metallic Surfaces:Influence of Salt Concentration Gradients on Evaporation and
Corrosion Behaviour
Virginie Soulié
JURY
Prof. Dr. DUFRÊCHE Jean-François ICSM ChairmanDr. RIEGLER Hans MPIKG ExaminerDr. LEQUIEN Florence CEA Saclay Examiner
Doctoral Schools and specialities:Sciences Chimiques Balard ED 469: Chimie et Physico-Chimie des MatériauxMathematisch-Naturwissenschaftlichen Fakultät: Physikalische Chemie
Research Units:Commissariat à l’Energie Atomique et aux Energies Alternatives (Saclay, France)Max-Planck-Institut für Kolloid- und Grenzflächenforschung (Potsdam, Germany)in partnership with L.I.A "RECYCLING" CNRS - MPG
PhD Supervisors:Prof. Dr. ZEMB Thomas ICSMProf. Dr. Dr. h.c. MÖHWALD Helmuth MPIKG
Reviewers:Prof. Dr. BREZESINSKI Gerald MPIKGProf. Dr. LEVITZ Pierre UPMC - CNRS
Paris, September 2015
Published online at the Institutional Repository of the University of Potsdam: URN urn:nbn:de:kobv:517-opus4-90329 http://nbn-resolving.de/urn:nbn:de:kobv:517-opus4-90329
A Jacqueline, ma grand-mère adorée
”Le chemin importe peu, la volonté d’arriver suffit à tout”Albert Camus
Acknowledgements
First of all I would like to thank Prof. Helmuth Möhwald for the opportunity to take anddevelop the first steps of this thesis at the Max Planck Institute of Colloids and Interfaces. Itwas a wonderful and challenging experience in an environment conducive to scientific freedomand cultural exchanges. I really enjoyed your dedication to research and your PhD studentswhich made the PhD experience productive and stimulating.
I would like to express my sincere gratitude to Prof. Thomas Zemb. Since we have knowneach other, I deeply appreciate your trust in me and my scientific skills. Thank you for offeringme this rewarding research project under your supervision. I have always been able to counton you, at any time, to guide me, give me advice or just reassure me. You have always keptan eye on me while allowing me to explore my own ideas. The numerous opportunities that Ihad to meet and interact with experienced researchers, and extend my knowledge are owed tohim. My truly thanks.
I am particularly grateful to Hans Riegler for his enthusiastic, inspirational and fruitfuldiscussions. Especially I would like to acknowledge his patience and the trust that he gaveme from the beginning to the end. Thank you for showing me how to become and think as ascientist: "the obvious is not trivial!"
I cannot imagine a better Mummy-guide into the world of corrosion science than FlorenceLequien. Florence, you have taught me how to survive scientifically: from the very basic princi-ples of corrosion to how to improve talks, how to conduct effectively meetings and how to dealwith scientists. You were always there to help me or give me confidence whenever I needed it.You really supported me whatever I decided to do. ”There are no right or wrong choices in life,but rather decisions we make towards achieving right ones” (Tim J. Wooster). Many thanks for all ofthat.
I am very thankful to Stefan Karpitschka for his numerous contributions that led to manyinvestigations and interesting results. Thank you for sharing your knowledge on droplet sci-ence. It was great that, even though you were extremely busy, you always found time to discuss,gave feedbacks on data interpretation and papers, and provided support.
I would like to thank Damien Féron for the helpful and enlightening scientific discussionsthat have led to a profound understanding of the corrosion phenomena. I enjoyed your supportand your kindness.
Philippe Prené, thank you very much for all your advice, suggestions and help. It was greatthat you were always available to collaborate and discuss about any problem I encountered. Iwill remember your alphabetical classification of the solutions: there is always a suitable planZ solution! I have good memories of our short trips to Marcoule and Berlin.
It is a great pleasure to thank my colleagues from the Interfaces department for the friendlyatmosphere that I enjoyed from the first moment at the summer school in Lecce. My specialthanks are to Marie Jehannin, with whom I shared all the (mis)adventures of a PhD student, Se-bastian Podszus, for our numerous discussions about the political and social system in Franceand Germany, Stephan Eickelmann, Hubert Gojzewski and Chenyu Jiu, for the uncountable
iv
Acknowledgements v
little assistances in the daily lab work, Stefanie Riedel, for the great deal of help with admin-istration. Amy Peterson and Hideh Asanuma, it was always great fun to share office withyou! I would like to thank Rodrigo Pérez-García for his experimental contributions in AFMcharacterization.
I was really fortunate to be also a PhD fellow in the Non-Aqueous Corrosion Laboratory(LECNA). It is a nice and social group, in which the working atmosphere would not be as coop-erative and friendly as it is now without Mylène Belgome, Marie Benoit, Marion Bigot, Marie-Christine Demizieux, Stéphane Heurtault, Barbara Laurent, Anthony Muccioli and MatthieuRivollier. Many thanks to Marie Benoit for everything! Marie, you have been a wonderfulfriend, my confidante and my USB keys saviour, you never doubted me. I also want to thankeveryone in LECNA for immediate support. In particular, I would like to mention Jean-LouisCourouau, Brigitte Duprey, Sidonie Pasquier-Tilliette, Raphaël Robin and Fabien Rouillard.
I would like to acknowledge Gervaise Moine who has taken care of me so well: you com-forted me, supported me and even fed on sweets! I had a real pleasure to be your office matefor two years.
A special thanks to Franck Ferreira-Gomes for his great experimental (and cleaning!) skillsand contributions to the third part of this thesis and ongoing studies. I really enjoyed youroptimism, your joie de vivre without a hitch: "Think like a proton, stay positive!".
I gratefully acknowledge the funding sources that made my PhD work possible. I washonored to be a Max Planck Institute PhD fellow for my first one year and was funded bythe French Alternative Energies and Atomic Energy Commission (CEA) Saclay for the lasttwo years. My work was also supported by LIA (Laboratoire International Associé) Recyclingbetween CNRS/INC and MPG/MPIKG. Special thanks goes to Aurélie Menasria for her un-conditional help to prepare my last minute missions. I also wish to thank the LabEx CheMISyst.
Je tiens à remercier mes parents et mes soeurs pour leur inconditionnel soutien, pour toutl’amour et toute la force qu’ils m’ont donnés et inspirés ... Vous me permettez de vivre mesrêves mais surtout de continuer à rêver ! Merci pour tout !
Je remercie très sincèrement ma famille et mes amis qui m’ont encouragée et ont toujourscru en moi.
Merci à toi, Yannick, qui a supporté et partagé mes joies, mes tristesses et mes caprices.Merci pour tout ton amour et ton fidèle soutien aux quatre coins de l’Europe.
3 Influence of Chloride Concentration and Droplet Size Effect on Corrosion of Ironunder Sessile Droplets from Aqueous Saline Solutions 833.1 Towards a General Peripheral Film Phenomenon . . . . . . . . . . . . . . . . . . 84
Material Parametersθe Equilibrium three-phase contact angleγ Surface tensionγlv Liquid-vapour surface tensionγlv Liquid-vapour surface tension of pure waterγsl Solid-liquid surface tensionγsv Solid-vapour surface tension∆γ Surface tension difference between a salt solution and pure waterσ Surface tension incrementη0 Dynamic viscosityc0 Initial salt concentrationPsat Saturated vapour pressure
xii
Symbols and Abbreviations xiii
RHeq Equilibrium relative humidityD Diffusion coefficientM Molecular weightρ Volumetric mass density
Dimensionless Fluid-Mechanical NumbersBo Bond numberCa Capillary number
Variablesc Salt concentrationc∗0 Critical initial salt concentration
Environment Variables
P Vapour pressureRH Relative humidityT Temperature
Droplet Variables
θ Three-phase contact angleθadv Advancing contact angleθrec Receding contact angleβ, f(θ) Functions of the contact angleRS Radius of the sphere forming the spherical capr Radius of the spherical-cap shaped dropletr Droplet size factorh Height of the sessile dropletV Volume of the sessile dropletV0 Initial volume of the sessile dropletv Normalized volume
Time Variables
t TimetD Diffusion timetF Total evaporation timetF Time scaled to tF
tRH Time scaled with the normalized relative vapour pressure (see I.3.2)t Scaled time
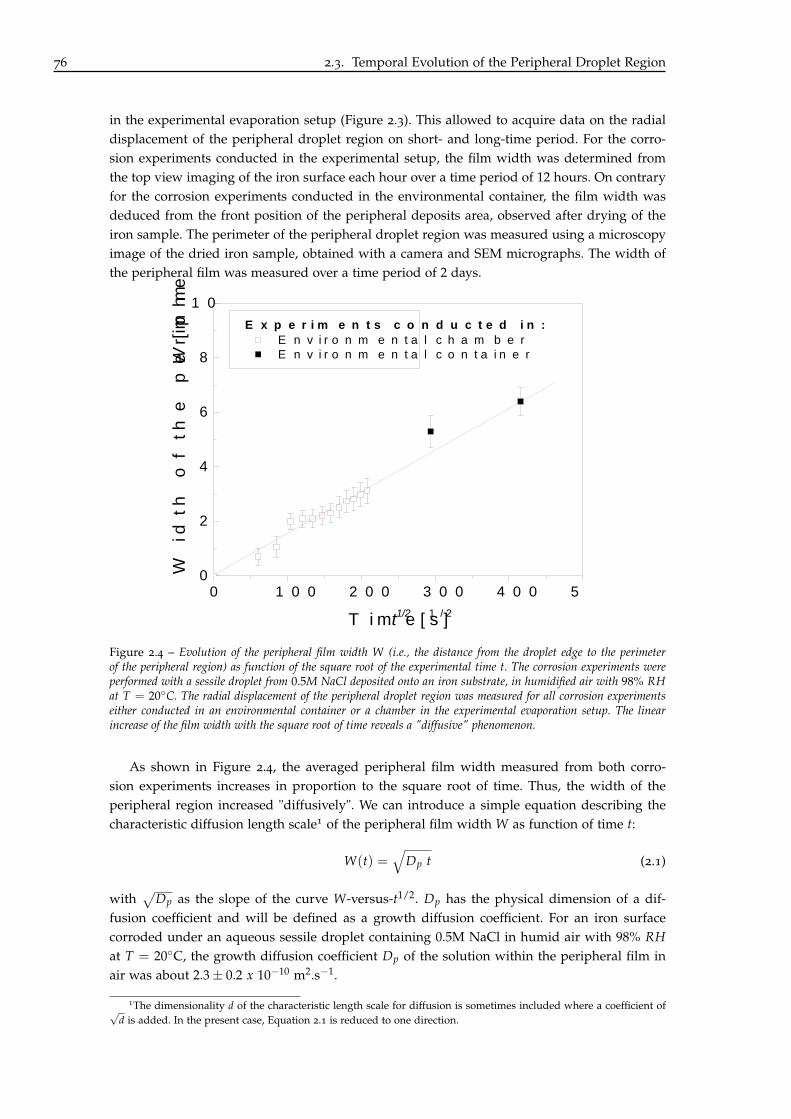
m0 Initial weight of the iron samplemF Weight of the iron sample after corrosion experiment∆m Weight loss of the iron sampleSdrop Surface area of the initially deposited sessile droplet on the iron substrateSC Surface area of the cathodeVcorr Corrosion rateW Width of the peripheral filme Thickness of the peripheral filmDp Growth diffusion coefficientc∗ Critical global salt concentration
Introduction
When you spill a droplet of coffee or tea on a table and let it dry, it leaves behind a distinctstain. All the coffee particles, which were initially uniformly distributed over the sessile droplet,have collected into a dark ring at the edge of the droplet. This is the so-called "coffee-ring ef-fect" firstly investigated by Deegan and coworkers [1] in 1997. They discovered how particlesare transported towards the droplet edge, towards the contact line pinned to the underlyingsubstrate (e.g. the table top), where the water evaporates. Drying stains are not specific to ourdaily life but are also encountered with any type of liquid mixture with (non-volatile) particlessuch as salty water, our model solution system. Inside such an evaporating sessile droplet, thechallenge for engineering application is to predict and control beforehand the pattern forma-tion by understanding the evaporation- and solute-driven flows within the drying droplet andtheir feedback on stain formation.
Evaporation of sessile droplets in ambient atmosphere is a well-known yet not completelysolved problem of classical physics. Past decades were marked by significant advance in exper-iment and theoretical progress in understanding several key aspects of the evaporation process,in particular the vapour diffusion from the sessile droplet surface [2–6] and the hydrodynamicswithin the evaporating droplets [1, 7–10]. It was found, in particular that the evaporative fluxdensity is inhomogeneous along the surface and diverges on approach to the three-phase con-tact line [1, 7, 8, 11]. The resulting mass flow modifies the composition distribution of the fluidconstituents within the droplet. The compositional evolution as well as the evaporation-drivenflow inside the evaporating sessile droplet have been studied almost exclusively and qualita-tively with the resulting properties of the deposit [12–16]. The evaporation behaviour itself hasbeen rarely investigated theoretically and experimentally [17], although this is needed for aquantitative understanding and control of the process.
In the particular model case the sessile droplet of salt solutions is deposited on metallicsurfaces under atmospheric conditions, the electrolyte solution inside the droplet reacts withthe surface, leading to differential aeration corrosion. This is the so-called "Evans droplet" ex-periment firstly described by Evans [18] in 1926. He discovered how the variation in electrolytethickness and hence in diffusion of oxygen to the saline solution-metal interface between thedroplet edge and its center induces spatially separated cathodic and anodic activities underthe droplet. The Evans droplet model is specific for "static" macroscopic sessile droplets, whichis not so ubiquitous in nature and also in industry.
The under-droplet corrosion behaviour is commonly studied in the context of stationaryconditions [19–25] and more recently in evaporating conditions [26, 27]. These reports focus onthe characterization of the induced corrosion process, essentially with electrochemical meth-ods [19, 24, 25] or microscopy characterization [28–30]. The contact of salty droplets on metallicsurfaces involves inevitably interfacial and hydrodynamic issues: apart from the anode-cathodeareas under the droplet, the corrosion behaviour itself and/or the evaporation process wouldinfluence the concentration profiles of all species (ionic and neutral) and the shape and size ofthe droplet that in turn affect the contact angle. The interplay of these phenomena under thesecomplex conditions may change the anode-cathode area separation and evolution.
1
2 Introduction
Most of the work presented in this thesis deals with the consequences of salt concentrationgradients within sessile droplets from aqueous saline solutions on inert and metallic surfaceson the evaporation and corrosion behaviour. As a simple model system, we use macroscopicsessile droplets of salt solutions deposited on either inert silicon wafers or pure iron corrosivesurfaces.
Part I provides the scientific and basic concepts of wetting, evaporation of sessile dropletsfrom pure and complex liquids as well as the corrosion phenomenon in atmospheric conditionsand under sessile droplets. In Chapters 1 and 4 we describe the experimental methods usedin this thesis and then present the material and sample preparation in addition to the dataanalysis of the evaporation and corrosion experiments.
Part II is devoted to the evaporation of sessile droplets of aqueous saline solutions on inertsurfaces. In Chapter 2 we investigate the evaporation behaviour of a water droplet. We showthat the evaporation rate of such a sessile droplet is indeed entirely determined by diffusivetransport of water vapour in the surrounding environment and depends on the relative hu-midity, the droplet size and shape. In Chapter 3 we extend this experimental investigation tosessile droplets evaporating from sodium chloride solutions on inert surfaces. We demonstratethat evaporation does not occur in an universal way with increasing the salt concentration anddecreasing the droplet contact angle. We show that a spectacular change in the nature of theflow field within the drying droplet alters the evaporation behaviour and the patterns of thesalty stains.
The classical under-droplet corrosion experiment is discussed in Part III. Our experimen-tal study with sodium chloride solutions presented in Chapter 5 shows surprisingly that theclassical Evans droplet experiment results in the formation of a peripheral film ahead of themacroscopic contact line. In Chapter 6 the formation of this peripheral film and the corrosionbehaviour have been investigated for various salt concentrations and ion species. We obtaindetailed information on the peripheral film phenomenon.
Part IV describes the observed corrosion process induced by evaporating sessile dropletsfrom sodium chloride solutions on iron. In that case once the flow inside the evaporatingdroplet is identified and known, we can understand the salt-induced corrosion mechanismand the subsequent anode/cathode localisation at the saline solution-metal interface.
IScientific Background
Part I: Scientific Background 7
1 Prerequisites
1.1 Wetting Phenomenon
When a droplet of liquid is placed on a flat and solid surface, there exist two different typesof wetting [31]: partial wetting (the liquid contracts into a sessile droplet with a macroscopiccontact angle θ as illustrated in Figure 1) and total wetting (the liquid spreads completely onthe surface resulting in θ = 01). The equilibrium configuration is defined by a minimization ofthe global surface energy.
Figure 1 – Schematic illustration of a liquid droplet on a flat and solid surface in a vapour phase environment. Thegeometry of the resulting spherical-cap shaped sessile droplet is characterized by: the contact angle θ, the dropletradius r, the radius of the sphere forming the spherical cap RS and the droplet height h.
The wetting phenomenon of a liquid droplet on a flat and solid surface in a vapour phaseenvironment, with a contact angle θE, depends on the capillary forces acting along the threeinterfaces towards the direction that the latter shrink (Figure 1). Normalized to a unit vectorlength δl, these forces Fij represent the interfacial (surface) energies γij between the threephases: solid s, liquid l and vapour v. The Young-Dupré equation describes a local balance ofthe projecting equilibrium forces acting at the three-phase contact line, the intersection of thesolid, liquid and vapour phases [33]:
γlv · cos(θe) = γsv − γsl (1)
Note that at microscopic scale, in partial wetting, ahead of the macroscopic contact line thesolid surface is covered by a molecularly thin liquid film called "precursor film" [31, 34–36]. Itexists because of forces acting on thin layers of a material with different electronic propertiessuch as charge or polarizability, together with forces arising from the molecular structure of thefilm material. These intermolecular forces are commonly described by the disjoining pressure[37, 38].
In this thesis we focus on macroscopic sessile droplets from aqueous saline solutions. Thesurface tension γlv depends on the salt concentration c at the free surface of the sessile droplet[39–43]. The simplest dependency is linear:
γlv = γolv + σ c (2)
with γolv as the surface tension of pure water (72.8 mN.m−1 at T = 20C) and σ as the surface
tension increment, a constant characteristic of each aqueous saline solution [42, 44]. An increasein salt concentration may either raise the surface tension (σ > 0) resulting in a salting-out effect or
1The final outcome is a very thick film resulting from the competition between molecular and capillary forces [32].
8 1. Prerequisites
decrease γlv (σ < 0) leading to a salting-in effect [45]. Divalent chloride salts such as magnesiumchloride MgCl2 have been described as exceptions [46, 47]: they are salting-in agents, whilethey have a positive surface tension increment2. as salting-out agents such as sodium chlorideNaCl. For instance, these two salts (NaCl and MgCl2) are characterized by a depletion from theliquid-air interface, i.e., both anions and cations move away from this interface and these ionsare removed from the surface, so water will be enriched there. This phenomenon is usuallyexplained by the magnitude of the hydration free energy which dominates the free energyrequired for a partially bare ion to exist at the liquid-air interface [41, 43]. They have beenordered in the well-known Hofmeister series [41–43] on the basis of the magnitude of thespecific salt ions from enhancing to disrupting local water structure: e.g., NaCl > MgCl2 andtherefore σMgCl2 > σNaCl . The salt-induced alteration in the structure of the nearby watermolecules has led to a famous but controversial classification of ions as either kosmotropes,structure-makers, or chaotropes, structure-breakers depending on their ability to enhance orinterrupt, respectively, the water structural character [41, 49–51]. The use of these terms forions is unfortunate and very misleading, since the actual changes in the structure between thewater molecules induced by the ions are opposite to what the name of these terms implies [52].For instance, NaCl exhibits salting-out behaviour, but is normally referred to as chaotrope.
1.2 Spherical-cap shaped Sessile Droplet
Equivalent to the Young-Dupré equation (Equation 1), the equilibrium shape of a liquid ses-sile droplet on a flat and solid surface must be minimal of energy. In the absence of grav-ity, it must be a spherical-cap shaped sessile droplet. The nondimensional Bond numberBo = (ρ g r0 h0)/(γlv) (with ρ as the liquid density and g as the gravitational constant),represents the effect of gravity relative to the surface tension. For a water droplet in air withan initial radius r0 of 6.5 mm and an initial height h0 of 150 µm, Bo is about 10−4. Thereforecapillary forces dominate over gravity. The small value of Bo ensures that a millimeter-sizedsessile droplet deposited onto a solid surface in air can be regarded as a spherical cap.
A spherical-cap shaped sessile droplet can be characterized by four different parameters:the contact angle θ, the droplet radius r, the droplet height h and the radius of the sphereforming the spherical cap RS (Figure 1). By geometry, the relationships between the two radii,the contact angle and the volume of the spherical cap V are:
r = RS · sin(θ) and RS =
(3 Vπ β
) 13
(3)
with
V =12
π h(
h2
3+ r2
)and β = (1− cos(θ))2 · (2 + cos(θ))
2In most cases, because σ is usually positive, the salting-out behavior is expected. The addition of salt raises thethe surface free energy of the protein. Therefore, the protein-salt interaction is classified as unfavorable indicatingthat the protein-protein attraction increases, the excess amount of salt is excluded from the domain of the protein.This leads to a reduction in protein solubility [48]. In the particular case of magnesium chloride, the unexpected andexperimentally observed salting-in behaviour is attributed to preferential interactions between the magnesium ion andthe protein surface, i.e., favorable weak ion-binding interactions between the salt and either the charged surface groupsof the protein. These preferential interactions compensate the preferential exclusion of the magnesium ion from thenon polar surface of the protein molecule [46–48]
Part I: Scientific Background 9
2 Evaporation of Sessile Droplets from Pure Liquids
2.1 Evaporation from a Spherical to a Sessile Droplet on a Solid Surface
In 1877, Maxwell was the first to derive the basic droplet evaporation equations by consideringthe simplest case where a pure liquid evaporates uniformly from a spherical (droplet) bulbsurface [2]. Maxwell’s model assumes that the evaporation depends on the diffusion relaxationof the saturated vapour layer immediately above the droplet, and not on the transfer rate acrossthe liquid-vapour interface3. The time-dependent vapour concentration c in the air surroundingthe droplet is governed by the unsteady diffusion equation
∂c∂t
= D ∇2c (4)
with D as the diffusion coefficient of vapour in air. However the evaporation-induced motionof the droplet surface (i.e., the liquid-vapour interface slowly moves as the droplet volumedecreases) is typically much slower than the diffusion time for the vapour transport [56], so thatthe time-dependent term in Equation 4 can be neglected and the quasi-steady concentrationfield is given by
∇2c = 0 (5)
The evaporation rate from the spherical droplet surface Ssphere is determined by the gradientin the vapour concentration ∇c according to Equation 6. Equation 5 is solved subject to theboundary conditions that the vapour concentration at the spherical droplet surface equals thesaturated vapour concentration csat at the temperature of the droplet surface (there is a localconcentration equilibrium at the liquid droplet/air interface), and c∞ far away.
dVdt
= −SsphereDρ∇c = −4π RS
Dρ(csat − c∞) (6)
The rate of volume change for a spherical droplet is found from Equation 6 and is proportionalto the droplet perimeter RS, and not to its surface area.
In this thesis, we focus on macroscopic sessile droplets under atmospheric conditions. Inthis case, the presence of a horizontal and solid surface below the evaporating sessile droplethinders the vapour to diffuse downward. As a result, the evaporation rate is usually deter-mined by the effective diffusion area f (θ) through which vapour molecules are transportedaway from the droplet [3, 4, 57–59]. The factor f (θ) can be totally ignored [4, 60–63], or math-ematically approximated [3, 4, 57–59]. On the one hand, the evaporation rate of the sessiledroplet is expressed as function of the droplet height h and a droplet evaporation constantλ, mainly determined by the intrinsic properties of the evaporating liquid (e.g., the diffusioncoefficient and the heat of vaporization) [61–63]:
dVdt
= −λ h (7)
On the other hand, analytical expressions of the factor f (θ) were determined by considering
3There are two physical mechanisms that can influence the drying rate of a sessile droplet. The first mechanismis the phase change from liquid to vapour: the rate at which molecules can cross the liquid-vapour interface [53, 54].The latter is characterized by a time scale of 10−10 s [55]. The second rate-limiting step is the transport of the vapourmolecules away from the droplet in the surrounding air [1, 7, 9, 10, 53]. This mechanism is valid for times longer thanthe diffusion time tD = r2/D, with D the diffusion coefficient of vapour in air. For a 5-millimeter-sized droplet ofwater, tD is about 0.1 s.
10 2. Evaporation of Sessile Droplets from Pure Liquids
that the vapour molecules diffused from a curved surface only in a radial direction [4, 58] (asdepicted by the solid arc of a radius Rc in Figure 2, the evaporative flux at the droplet edgeis neglected), or in a purely radial direction [57] (the effective diffusion area entirely includesthe sessile droplet surface area as represented by the dashed and solid arc in Figure 2), or byevaluating the diffusion problem as an equivalent electrostatic problem: the capacitance of anisolated conductor formed by the sessile droplet and its mirror-image in the solid surface [3]as shown in Figure 2.
Figure 2 – Geometry of the effective diffusion area of a sessile droplet deposited on a solid and horizontal surface:the solid line at the distance Rc from the center of the curvature represents the diffusion area modeled by Rowanand coworkers [4, 58] while the diffusion region modeled by Shanahan and coworkers [57] is represented by thedashed lines and the solid line. The sessile droplet and its reflection in the solid substrate illustrates the electrostaticequivalent conducting body used to determine the analytical expression of the factor f (θ) (Equation 8) in thePicknett and Bexon evaporation model [3], and the vapour concentration field around a sharp edge that appearswhen θ < 90 (Equation 10). The arrows indicate the non-uniform evaporative flux J (Equation 10) from thesurface of the droplet.
The latter model purposed by Picknett and Bexon [3] was experimentally considered in theliterature as the best approximation for predicting accurately the evaporation rate of sessiledroplets from pure liquids [64–66]. Therefore, in this thesis, we will consider, according to thePicknett and Bexon model [3], that the change of the volume V with time t of a sphericalcap shaped sessile droplet (Equation 3) with a contact angle θ in the quasi steady-state withdiffusion-driven evaporation (Equation 6) is given by
dVdt
= −4π
(3π
) 13 D
ρ
(Vβ
) 13(csat − c∞) f (θ) (8)
To describe the atmospheric conditions in which sessile droplet evaporation occurs, it isconvenient to use the vapour pressure P of the liquid at constant temperature as vapour con-centration variable c (since the vapour obeys the ideal gas law). The vapour pressure thendepends on the relative humidity RH in the surrounding environment:
(csat − c∞) =M
R T(Psat − P) =
MR T
Psat (1− RH) (9)
with M as molecular weight, R as gas constant, T as temperature, Psat as saturated water vapourpressure at/above the droplet surface and P as the water vapour pressure in the backgroundenvironment. However, one must be careful with the application of Equations 8 and 9 to realexperimental conditions, since some physical parameters such as D, Psat or ρ are temperature-
Part I: Scientific Background 11
dependent. The evaporative cooling and heat transfer to the liquid-air interface can influencethe evaporation rate of a sessile droplet [6, 54, 67, 68].
2.2 Divergence of the Evaporative flux at the Droplet Edge
The strength of the evaporative flux J from the droplet surface is determined by the vapourconcentration gradient according to
J = −D ∇c (10)
The evaporative flux is derived from Equation 5, which fulfills the same boundary condi-tions as described in the previous section: the vapour concentration c equals csat at/above thedroplet surface and converges to c∞ far away. When c∞ < csat, a diffusive outflux arises andthe droplet evaporates. A third boundary condition is that the solid surface, onto which thesessile droplet is deposited, is impermeable to the vapour. Mathematically the impermeabilitycondition is equivalent to mirror-imaging of the sessile droplet as illustrated in Figure 2. Thesessile droplet and its reflection has a pointy, singular shape near the contact line, as a chargedconductor with a sharp tip (e.g., a lightning rod). The mathematical problem of finding thevapour concentration field around a sharp edge has an electrostatic equivalent: the electro-static potential around a charged conductor. The shape of the droplet (and its reflection) nearthe contact line can be approximated by a wedge geometry, and a self-similar solution to theevaporative flux can be obtained, which scales as [1, 7, 10]
J ∼ D(csat − c∞)
r
(Rr
)λ(θ)−1(11)
with R as the radial distance to the contact line and
λ(θ) =π
2(π − θ). (12)
Hence for contact angles below 90 (λ < 1, Equation 12), the evaporative flux J diverges asthe contact line is approached (Equation 11). The sharper the droplet edge, the stronger thisdivergence. For very flat sessile droplets (θ 90), a square-root divergence of the evaporativeflux is found (Equations 11 and 12). Hu and Larson [7] numerically showed that similarlyat the sharp tip of a charged conductor, all the iso-concentration (equipotential) lines comeclose together at the contact line of an evaporating sessile droplet with θ < 90, so that theevaporative flux (electric field) diverges.
2.3 Evaporation Modes of a Sessile Droplet on a Solid Surface
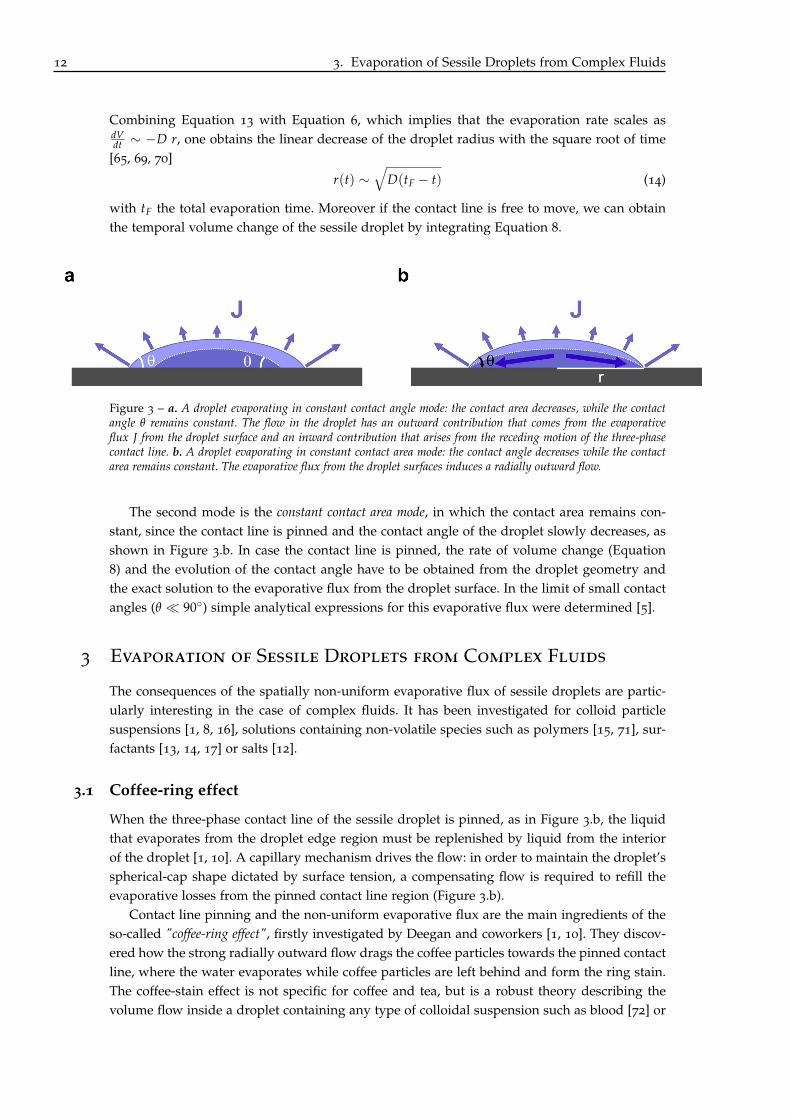
The way the liquid-vapour interface moves as the sessile droplet volume decreases depends onthe mode along which the evaporation takes place. Droplet evaporation can occur along twobasic modes [3, 10, 57, 60, 65]. The first mode is the constant contact angle mode, in which thecontact line is free to move and hence the contact area of the sessile droplet with the substratedecreases while the contact angle remains constant as depicted in Figure 3.a. For a constantcontact angle mode, the time-dependent droplet radius can be estimated from dimensionalarguments. Since the typical droplet volume V scales as V ∼ r3, the rate of volume changescales as
dVdt∼ r2 dr
dt(13)
12 3. Evaporation of Sessile Droplets from Complex Fluids
Combining Equation 13 with Equation 6, which implies that the evaporation rate scales asdVdt ∼ −D r, one obtains the linear decrease of the droplet radius with the square root of time
[65, 69, 70]
r(t) ∼√
D(tF − t) (14)
with tF the total evaporation time. Moreover if the contact line is free to move, we can obtainthe temporal volume change of the sessile droplet by integrating Equation 8.
Figure 3 – a. A droplet evaporating in constant contact angle mode: the contact area decreases, while the contactangle θ remains constant. The flow in the droplet has an outward contribution that comes from the evaporativeflux J from the droplet surface and an inward contribution that arises from the receding motion of the three-phasecontact line. b. A droplet evaporating in constant contact area mode: the contact angle decreases while the contactarea remains constant. The evaporative flux from the droplet surfaces induces a radially outward flow.
The second mode is the constant contact area mode, in which the contact area remains con-stant, since the contact line is pinned and the contact angle of the droplet slowly decreases, asshown in Figure 3.b. In case the contact line is pinned, the rate of volume change (Equation8) and the evolution of the contact angle have to be obtained from the droplet geometry andthe exact solution to the evaporative flux from the droplet surface. In the limit of small contactangles (θ 90) simple analytical expressions for this evaporative flux were determined [5].
3 Evaporation of Sessile Droplets from Complex Fluids
The consequences of the spatially non-uniform evaporative flux of sessile droplets are partic-ularly interesting in the case of complex fluids. It has been investigated for colloid particlesuspensions [1, 8, 16], solutions containing non-volatile species such as polymers [15, 71], sur-factants [13, 14, 17] or salts [12].
3.1 Coffee-ring effect
When the three-phase contact line of the sessile droplet is pinned, as in Figure 3.b, the liquidthat evaporates from the droplet edge region must be replenished by liquid from the interiorof the droplet [1, 10]. A capillary mechanism drives the flow: in order to maintain the droplet’sspherical-cap shape dictated by surface tension, a compensating flow is required to refill theevaporative losses from the pinned contact line region (Figure 3.b).
Contact line pinning and the non-uniform evaporative flux are the main ingredients of theso-called "coffee-ring effect", firstly investigated by Deegan and coworkers [1, 10]. They discov-ered how the strong radially outward flow drags the coffee particles towards the pinned contactline, where the water evaporates while coffee particles are left behind and form the ring stain.The coffee-stain effect is not specific for coffee and tea, but is a robust theory describing thevolume flow inside a droplet containing any type of colloidal suspension such as blood [72] or
Part I: Scientific Background 13
solutions with (non-volatile) particles such as salty water. Pinning of the contact line can occurby pre-existing roughness of the substrate. On top of this, suspended particles that arrive at thecontact line due to the coffee-stain effect create or enforce the pinning and thereby generate aself-pinning mechanism [73]. Recently, it has been shown that the ring-stain formation can besuppressed by using non-spherical particles [74] or by shaking the evaporating droplets withstrong electric fields [75].
3.2 Marangoni effect
The locally non-uniform evaporative flux of the free surface sessile droplets can lead to sur-face tension/energy gradients, that induce a flow because of the non-equilibrium characterof the situation. The total energy can be lowered by replacing a high-energy surface with alow-energy surface. This phenomenon is commonly known as Marangoni effect [76]. It wasfirst qualitatively and correctly explained by James Thomson in 1855 [77] who described thefamous "tears of wine", appearing along the side walls of the glass, out of the wine. TheMarangoni effect is either thermal [8, 78–80] or solutal [12, 13, 81] in nature.
On the one hand, surface tension gradients may arise from spatial variations of tempera-ture originating from the difference in temperature between the substrate and the liquid-airinterface [82] or more generally from the non-uniform cooling along the free surface of thesessile droplet induced by the singularity of the evaporative flux at the contact line [8, 78–80].Thermally induced Marangoni flows in evaporating water-based sessile droplets are predicted[78], but up to now they are not observed unambiguously (most likely surface-active contami-nants [8] may have spoiled the measurements).
On the other hand, with complex fluids surface tension gradients may result from localvariations of the composition [12, 13, 81]. In the case of evaporating sessile droplets fromcomplex fluids, the locally non-uniform evaporation will usually lead to a locally inhomoge-neous distribution of the fluid constituents inside the droplet, that then in turn induce solutalMarangoni flows. Solutal Marangoni flows may be directed either towards or away from thethree-phase contact line [13, 14, 83] depending on the properties of the liquid constituents.The Marangoni flows may lead to advancing [84, 85] or receding contact lines, or to repeatedpinning/depinning with concentric ring-like deposits [13]. Complex internal flow patterns arealso considered with Marangoni vortices near the droplet edge, which supposedly promoteuniform deposits with receding contact lines [13–15, 81].
Hence, controlling and predicting beforehand the pattern formation by evaporating sessiledroplets from complex fluids is not yet fully understood. In particular, it is not yet known, howthe internal fluid flow looks like, how it evolves over time and how this affects the dynamicsof the stain formation. Although the volume flow inside the evaporating sessile droplet canbe found from mass conservation [9], the exact velocity profile within the droplet remainsunknown. In the small contact angle regime, the lubrication approximation is often used todescribe the velocity field inside the droplet [5]. However, even for relatively flat droplets(θ 90) the validity of this approximation near the pinned contact line, where the evaporativeflux diverges, has been questioned [8]. On top of that, Marangoni stresses originating fromsurface tension gradients could lead to additional contributions to the velocity field [78, 86]as the motion of the contact line, in case it is free to move [5]. The purpose of the workdescribed in this thesis is therefore to address the fundamental physics of evaporation of sessiledroplets from aqueous saline solutions, evaporation-driven flow inside the drying droplet, andthe subsequent salt deposition/precipitation and the relation with corrosion.
14 4. Corrosion Phenomenon under Sessile Droplets
4 Corrosion Phenomenon under Sessile Droplets
4.1 Atmospheric Corrosion
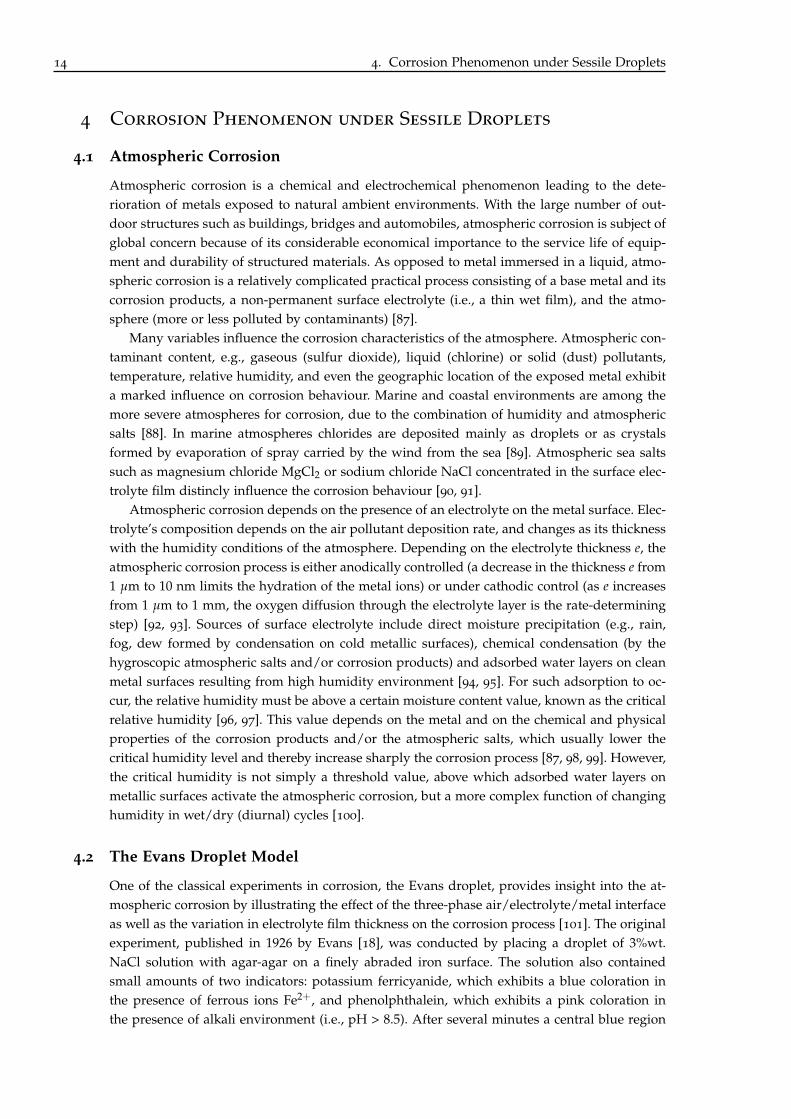
Atmospheric corrosion is a chemical and electrochemical phenomenon leading to the dete-rioration of metals exposed to natural ambient environments. With the large number of out-door structures such as buildings, bridges and automobiles, atmospheric corrosion is subject ofglobal concern because of its considerable economical importance to the service life of equip-ment and durability of structured materials. As opposed to metal immersed in a liquid, atmo-spheric corrosion is a relatively complicated practical process consisting of a base metal and itscorrosion products, a non-permanent surface electrolyte (i.e., a thin wet film), and the atmo-sphere (more or less polluted by contaminants) [87].
Many variables influence the corrosion characteristics of the atmosphere. Atmospheric con-taminant content, e.g., gaseous (sulfur dioxide), liquid (chlorine) or solid (dust) pollutants,temperature, relative humidity, and even the geographic location of the exposed metal exhibita marked influence on corrosion behaviour. Marine and coastal environments are among themore severe atmospheres for corrosion, due to the combination of humidity and atmosphericsalts [88]. In marine atmospheres chlorides are deposited mainly as droplets or as crystalsformed by evaporation of spray carried by the wind from the sea [89]. Atmospheric sea saltssuch as magnesium chloride MgCl2 or sodium chloride NaCl concentrated in the surface elec-trolyte film distincly influence the corrosion behaviour [90, 91].
Atmospheric corrosion depends on the presence of an electrolyte on the metal surface. Elec-trolyte’s composition depends on the air pollutant deposition rate, and changes as its thicknesswith the humidity conditions of the atmosphere. Depending on the electrolyte thickness e, theatmospheric corrosion process is either anodically controlled (a decrease in the thickness e from1 µm to 10 nm limits the hydration of the metal ions) or under cathodic control (as e increasesfrom 1 µm to 1 mm, the oxygen diffusion through the electrolyte layer is the rate-determiningstep) [92, 93]. Sources of surface electrolyte include direct moisture precipitation (e.g., rain,fog, dew formed by condensation on cold metallic surfaces), chemical condensation (by thehygroscopic atmospheric salts and/or corrosion products) and adsorbed water layers on cleanmetal surfaces resulting from high humidity environment [94, 95]. For such adsorption to oc-cur, the relative humidity must be above a certain moisture content value, known as the criticalrelative humidity [96, 97]. This value depends on the metal and on the chemical and physicalproperties of the corrosion products and/or the atmospheric salts, which usually lower thecritical humidity level and thereby increase sharply the corrosion process [87, 98, 99]. However,the critical humidity is not simply a threshold value, above which adsorbed water layers onmetallic surfaces activate the atmospheric corrosion, but a more complex function of changinghumidity in wet/dry (diurnal) cycles [100].
4.2 The Evans Droplet Model
One of the classical experiments in corrosion, the Evans droplet, provides insight into the at-mospheric corrosion by illustrating the effect of the three-phase air/electrolyte/metal interfaceas well as the variation in electrolyte film thickness on the corrosion process [101]. The originalexperiment, published in 1926 by Evans [18], was conducted by placing a droplet of 3%wt.NaCl solution with agar-agar on a finely abraded iron surface. The solution also containedsmall amounts of two indicators: potassium ferricyanide, which exhibits a blue coloration inthe presence of ferrous ions Fe2+, and phenolphthalein, which exhibits a pink coloration inthe presence of alkali environment (i.e., pH > 8.5). After several minutes a central blue region
Part I: Scientific Background 15
surrounded by a peripheral pink area, and the formation of a rust ring in between is observed[18, 101].
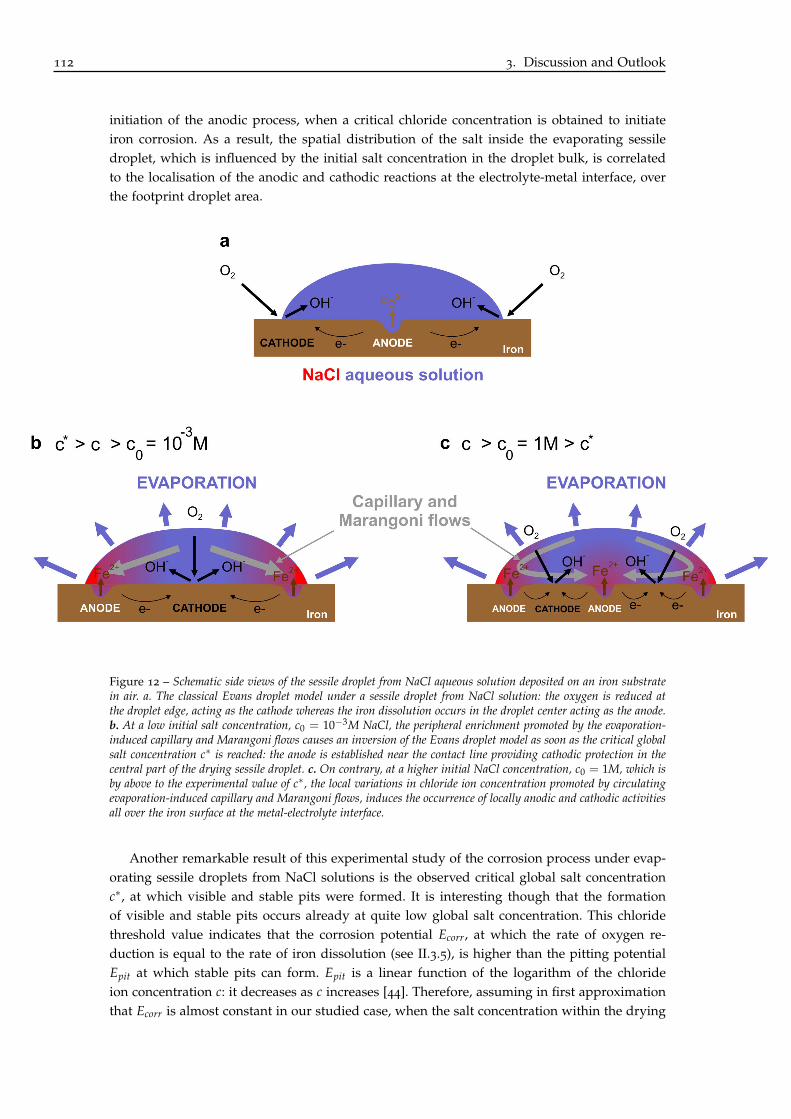
The changes in color of indicators inside the macroscopic and stationary sessile droplet froma jelly electrolyte solution demonstrate the formation of a localized electrochemical cell and inparticular, the natural distribution of the anodic and cathodic reactions inside the droplet asshown in Figure 4. The oxygen O2 reduction, which results in the production of hydroxyl ionsOH−, occurs at the droplet edge at the metal-electrolyte interface, because the diffusion pathlength of oxygen from the environmental vapour phase to the metallic substrate-solution isshortest at the contact line region. Thus at the perimeter of the droplet the alkaline cathode isformed as depicted in Figure 4.
O2(dis) + 4 e− + 2 H2O→ 4 OH−(aq) (15)
The alkalinity developed provides protection for the iron surface in the droplet edge region,since any ferrous ion was detected with the indicator [18, 19].
Figure 4 – The classical Evans droplet model under a sessile droplet from aqueous saline (electrolyte) solution: theoxygen is reduced at the droplet edge, acting as the cathode, whereas the iron dissolution occurs in the droplet centeracting as the anode. A rust ring is formed from the reaction between anodic and cathodic products within the sessiledroplet, in the region midway between the anodic and cathodic areas.
The corresponding anode is established at the metal surface-electrolyte interface, whereoxygen is deficient (i.e., away from the three-phase contact line). Close(r) to the droplet center,ferrous ions Fe2+, generated from the metal, are released into the droplet solution.
Fe(s) → Fe2+(aq) + 2 e− (16)
The anodic reaction leads to localized pitting corrosion (i.e., a localized penetration of the metalsurface) somewhere close(r) to the sessile droplet center as depicted in Figure 4.
Where the inner anodic ferrous ion-containing and outer-edged cathodic alkaline liquidsimpinge upon each other, precipitation of hydrated ferrous hydroxide Fe(OH)2 occurs, whichis highly insoluble and forms an annulus within the droplet as illustrated in Figure 4. Thering rust comes from the oxidation of the initially precipitated ferrous hydroxide, leading tothe formation of lepidocrocite γ-FeOOH [102, 103]. This reaction, in addition to the cathodicreaction, also reduces the level of dissolved oxygen in the solution.
The Evans droplet experiment illustrates the differential aeration phenomenon, generallyobserved in semi-immersed conditions (i.e., the iron is partly immersed in a neutral solution):anodic areas are separated from the cathodic regions, appearing near to the waterline wherethere is a ready availability of oxygen. It is important to note that neither the anodic nor ca-thodic reaction in the Evans droplet experiment involve the participation of sodium chloride.
16 4. Corrosion Phenomenon under Sessile Droplets
The electrolyte function is to provide paths of high conductivity for the ionic current.The Evans droplet has been performed more recently in stationary or dynamic (evaporat-
ing) conditions in order to determine the influence of the chloride concentration, the relativehumidity and the droplet size on the occurrence of pitting corrosion under chloride solutiondroplets deposited onto stainless steels [20, 21, 90, 91]. No single critical chloride concentrationor critical relative humidity for pit initiation was found [20, 91]. The increase of the chlorideconcentration during drying and the initial chloride concentration within the sessile dropletinfluence sharply the onset of pitting [20]. Tsutsumi et al. [21, 90] suggest that there is a de-creased likelihood of pitting under small evaporating sessile droplets (with a diameter < 5 mm),because the smaller exposed area supports a less cathodic current. Hence despite a generalagreement on the relative roles of the different controlling factors in the Evans droplet model,there is a lack of studies demonstrating how to control and predict the material damages undersessile droplets in environmental conditions. The purpose of the work developed in this the-sis is therefore to investigate the corrosion phenomenon under sessile droplets from aqueoussaline solutions, the salt-induced corrosion mechanism and the subsequent anodic/cathodiclocalisation inside stationary or evaporating sessile droplets.
IIEvaporation of Sessile Droplets from
Aqueous Saline Solutions?
?Oral contributions containing main results of this PhD part have been presented at international conferences as:
• Virginie Soulié, Stefan Karpitschka, Florence Lequien, Philippe Prené, Thomas Zemb, Helmuth Moehwald and HansRiegler. Concentration Dependence of Coffee-Ring Formation in Sessile Droplets of Saline Solutions. The 1st InternationalWorkshop on Wetting and Evaporation: Droplets of Pure and Complex Fluids, Marseilles, France, June 2013.
• Virginie Soulié, Stefan Karpitschka, Florence Lequien, Philippe Prené, Thomas Zemb, Helmuth Moehwald and HansRiegler. Evaporation Behavior of Sessile Droplets from Complex Fluids: Aqueous Saline Solutions. The 4th InternationalWorkshop on Crystallization in Porous Media, Amsterdam, The Netherlands, June 2014.
• Virginie Soulié, Stefan Karpitschka, Florence Lequien, Philippe Prené, Thomas Zemb, Helmuth Moehwald andHans Riegler. Salt-Induced Marangoni Flows in Evaporating Sessile Droplets. The 7th Conference of the InternationalMarangoni Association, Vienna, Austria, June 2014.
1Experimental Methods and
Equipment
1.1 Experimental setup
Setup for evaporation experiments
In this thesis the evaporation experiments were performed with a new experimental setupdesigned and built by Karpitschka S. and Riegler H. (Max Planck Institute of Colloids andInterfaces, Potsdam) for the study of sessile droplets coalescence [104–107]. The main purposeof the setup is the real-time observation of sessile droplets from the top and the side simulta-neously, with a few-micron scale resolutions.
Figure 1.1 shows a schematic illustration of the experimental setup for observing the evapo-ration process of sessile droplets. The evaporation behaviour was optically imaged from the topand the side. From above the sample one camera imaged the sessile droplets through a macrolens with extension tubes. Therefore the imaging scale or the field of view (FoV) from the topwas improved. The sample area was homogeneously illuminated with a coaxial light system.In line with the camera and the sample, a flat mirror at a 45-degree angle to the optical axis wasilluminated sidewards and casted light downwards on the sample area. This lighting designenhanced the contrast of the droplet contour. As a result, the local brightness of the dropletimage can be translated into the local surface inclination. Simultaneously a second camera withan object-space telecentric lens inspected the side of the sessile droplets. Therefore the imagingscale or FoV remained constant over the whole sample depth (i.e., 2 cm): the apparent sizeand shape of the sessile droplets did not change with distance from the camera and across theentire FoV. The samples were illuminated from the opposite site with a telecentric illumination,i.e., a collimated light with very good uniformity and low divergence. The two insets in Figure1.1 show as an example images of a sessile droplet few seconds after its deposition from thetop and the side.
The evaporation experiments were performed in an environmental chamber under con-trolled temperature T and relative humidity RH. The relative humidity was adjusted with aconstant gaseous flux (2000 ml.min−1) of an appropriate mixture of dry and wet nitrogen (pu-rity 5.0, Messer) through the environmental chamber. The gas flux was weak enough to avoidconvective flows effects on the evaporation behaviour of the sessile droplets. The temperaturewas controlled by adjusting the temperature of the flow of moist nitrogen diffusing throughthe sample chamber with a high-precision temperature-controlled heating and cooling bath.Additionally the temperature and the relative humidity were also directly measured in the en-vironmental chamber. All the evaporation experiments were carried out at T = (23.0± 0.5).
21
22 1.1. Experimental setup
Figure 1.1 – Schematic illustration of the experimental setup for observing the evaporation process of sessile droplets.The evaporation behaviour was optically imaged from the top and the side. The two insets show simultaneous top andside view images taken from a real experiment. The evaporation experiments were performed in an environmentalchamber under controlled temperature T and relative humidity RH.
Besides the experimental setup allows the ”in-situ” visualization of the flow field inside thedroplet with particle tracking velocimetry (PTV). For this purpose, the top view illuminationis replaced by a monochromatic laser beam allowing the illumination of the fluid motion in arestricted observational area. A specific amount of fluorescent particles with a certain diameteris added in the droplet liquid (see next section for more detailed information). The observationof the particles movement within the droplet fluid reveals the direction of the liquid flowinside the droplet.
Data analysis of evaporation experiments
In a typical evaporation experiment, the dynamics of the sessile droplets’ free surface topologywere measured. Most relevant were the time evolution of the droplets contact angle θ(t) andtheir shape: the droplets radius r(t) and height h(t). The main droplet geometry parameterswere derived from the optical imaging in the simultaneous top and side views. A specializedanalysis software developed by Karpitschka S. (Max Planck Institute of Colloids and Interfaces,Potsdam) was used for the data analysis of the evaporation experiments.
From the top view, the contact area of sessile droplets with the substrate and their contactline motion could be observed on-line. The radii of the droplet footprint were measured fromthe top view images by taking the circle with an optimum match to the droplet perimeter(contact) line. The experimentally observed three-phase contact lines were in most cases quitecircular, as depicted for instance in the top view inset of the Figure 1.1.
The droplet contact angles and heights were derived from the side aspect. Contours of thesessile droplets were extracted from the side view imaging and circle, ellipse or polynomial fit-ting methods were used to determine the droplet heights and contact angles. The most widelyused method to measure, with accuracy, the droplet heights was the fitting of the dropletshape as a circular contour. This reconstruction is valid since sessile droplets were sphericalcap-shaped. The usual dimensions (heights) of the sessile droplets in evaporation experimentswere always below the capillary length. Therefore gravitation influences were negligible (seeI.1.2). Thus sessile droplets kept a spherical cap shape over the evaporation process.
However to perform accurate contact angle measurements, the side contour aspect of
Chapter 1. Experimental Methods and Equipment 23
sessile droplets was extrapolated with ellipses or polynomial equations1. Advancing (θadv)and receding (θrec) contact angles were determined by inflating and deflating the droplet, byadding/pumping liquid with the needle of the syringe embedded in the sessile droplet. Thecontact angles (left and right, as measured from the side view) at which the triple contact linestarted or stopped moving were averaged in order to measure θadv or θrec, respectively. Therepeatability was determined by the substrate and not by the measurement method, since thecontact angle hysteresis (i.e., the difference between the advancing and receding contact angles)arises in general from surface roughness and/or heterogeneity [65]. It was typically within ±1 for advancing and receding contact angles.
The volume of sessile droplets was determined by combining their top and side aspects:the time evolution of the radius of the contact area was measured from the top aspect and thedroplet height from the side aspect. The top and side aspects of sessile droplets were correlatedat the moment of the liquid disconnected from the tip of the syringe and changed its shapefrom a pendant droplet at the tip of the syringe to a sessile droplet on the substrate. The timedifference between both images was calculated to correctly extrapolate both sessile dropletsradius and height at each time t. Since the sessile droplet had a spherical cap shape, its volumewas calculated from the measured heights h(t) and radii r(t) by:
V(t) =12
π h(t)(
h2(t)3
+ r2(t))
(1.1)
The droplet volume determined from the observed heights and radii was consistent withthe volume adjusted with the syringe upon its deposition, V0 (see II.2.1 for more detailedinformation). The main uncertainties for the droplet volume determination came from thevertical offset of the substrate baseline used in the droplet height measurements and the volumeerror upon deposition from the syringe. The substrate baseline uncertainty can be eliminatedby determining its true position. For this purpose, the time correlation between top and sideaspects of sessile droplets can be used to extrapolate the side aspect profile to the positions ofthe three-phase contact lines known from the top aspects. Typical corrections to the measureddroplet heights were 40 µm, resulting in fluctuations of the calculated volumes smaller than1%. The volume error from the syringe itself and from the manipulator was the main remaininguncertainty. This induced volume variations smaller than 5%.
1.2 Material and sample preparation
Sessile droplets from aqueous saline solutions, with different initial volumes ranging from 1 to10 µl, were deposited with a syringe onto solid, planar and inert substrates.
Saline solutions and substrate
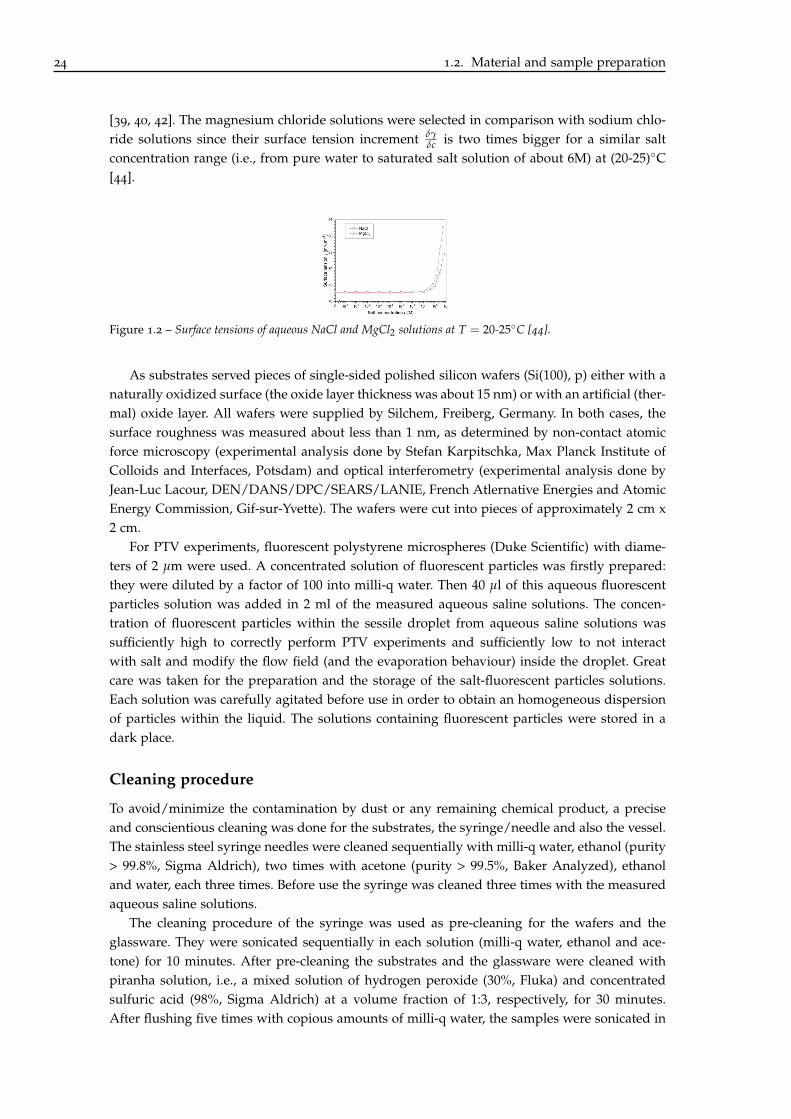
Two different saline solutions have been chosen for the evaporation experiments: sodium chlo-ride NaCl (Sigma Aldrich) and magnesium chloride MgCl2 (magnesium chloride hexahydrate,VWR Chemicals) solutions. The aqueous saline solutions were prepared with MilliporeTM wa-ter (resistivity 18 MΩ.cm−1) with salt concentrations ranging from 10−7M NaCl or 10−3MMgCl2 to the saturation limit, i.e., 6.1M NaCl or 5.7M MgCl2 [108, 109]. Surface tension γ
of the aqueous saline solutions increased with salt concentration c as presented in Figure 1.2
1The circular-like profile of the droplet shape under-predicts the contact angle values higher than 30. The twoother fitting methods allow the calculation over a wider range of contact angle values.
24 1.2. Material and sample preparation
[39, 40, 42]. The magnesium chloride solutions were selected in comparison with sodium chlo-ride solutions since their surface tension increment δγ
δc is two times bigger for a similar saltconcentration range (i.e., from pure water to saturated salt solution of about 6M) at (20-25)C[44].
Figure 1.2 – Surface tensions of aqueous NaCl and MgCl2 solutions at T = 20-25C [44].
As substrates served pieces of single-sided polished silicon wafers (Si(100), p) either with anaturally oxidized surface (the oxide layer thickness was about 15 nm) or with an artificial (ther-mal) oxide layer. All wafers were supplied by Silchem, Freiberg, Germany. In both cases, thesurface roughness was measured about less than 1 nm, as determined by non-contact atomicforce microscopy (experimental analysis done by Stefan Karpitschka, Max Planck Institute ofColloids and Interfaces, Potsdam) and optical interferometry (experimental analysis done byJean-Luc Lacour, DEN/DANS/DPC/SEARS/LANIE, French Atlernative Energies and AtomicEnergy Commission, Gif-sur-Yvette). The wafers were cut into pieces of approximately 2 cm x2 cm.
For PTV experiments, fluorescent polystyrene microspheres (Duke Scientific) with diame-ters of 2 µm were used. A concentrated solution of fluorescent particles was firstly prepared:they were diluted by a factor of 100 into milli-q water. Then 40 µl of this aqueous fluorescentparticles solution was added in 2 ml of the measured aqueous saline solutions. The concen-tration of fluorescent particles within the sessile droplet from aqueous saline solutions wassufficiently high to correctly perform PTV experiments and sufficiently low to not interactwith salt and modify the flow field (and the evaporation behaviour) inside the droplet. Greatcare was taken for the preparation and the storage of the salt-fluorescent particles solutions.Each solution was carefully agitated before use in order to obtain an homogeneous dispersionof particles within the liquid. The solutions containing fluorescent particles were stored in adark place.
Cleaning procedure
To avoid/minimize the contamination by dust or any remaining chemical product, a preciseand conscientious cleaning was done for the substrates, the syringe/needle and also the vessel.The stainless steel syringe needles were cleaned sequentially with milli-q water, ethanol (purity> 99.8%, Sigma Aldrich), two times with acetone (purity > 99.5%, Baker Analyzed), ethanoland water, each three times. Before use the syringe was cleaned three times with the measuredaqueous saline solutions.
The cleaning procedure of the syringe was used as pre-cleaning for the wafers and theglassware. They were sonicated sequentially in each solution (milli-q water, ethanol and ace-tone) for 10 minutes. After pre-cleaning the substrates and the glassware were cleaned withpiranha solution, i.e., a mixed solution of hydrogen peroxide (30%, Fluka) and concentratedsulfuric acid (98%, Sigma Aldrich) at a volume fraction of 1:3, respectively, for 30 minutes.After flushing five times with copious amounts of milli-q water, the samples were sonicated in
Chapter 1. Experimental Methods and Equipment 25
milli-q water for 15 minutes in order to remove traces of acid and dust. The piranha treatmentwas concluded by another milli-q water rinse and sonication of about 15 minutes.
After cleaning the glassware were dried by blowing with nitrogen (purity 5.0, Messer)and dried over a night in a drying oven at 150C. After the complete piranha treatment, thesubstrates were stored under milli-q water in a closed vessel to prevent contamination. Allexperiments were performed with freshly prepared substrates, i.e., no more than 8 hours aftercleaning. Immediately before further usage, they were dried in a flow of pure nitrogen.
Thermal oxidation procedure
The equilibrium contact angles2 θe of sessile water droplets on the freshly prepared substrateswere about 1 with a very small hysteresis (≤ 0.5). The contact angles did not change over thesamples storage in milli-q water for up to 8 hours.
The wetting behaviour of sessile droplets from pure water (and also from aqueous salinesolutions) is quite sensitive to the temperature treatment of the silicon wafers. This is attributedto the number of OH groups on the wafers surfaces [110]. In support of this hypothesis, thewettabilities of the wafers surfaces were changed by thermal oxidation.
Thermal oxidation was performed in ambient air at different elevated temperatures rangingfrom 250 to 1000C. After cleaning and drying, the samples were annealed in an oven for aboutone hour in normal atmosphere at three different temperatures: 250, 500 and 1000C. As a laststep, the substrates were cooled down for about one hour in the oven. Residual dust wasblown off with pure nitrogen before usage. One inconvenient of the thermal treatment was theshort-term stability of the samples. 4 hours after the thermal treatment, the contact angle valuedecreased by at least 10%. For this reason, the samples were used within few hours after thefinal drying step.
Figure 1.3 – Contact angles measurements on thermally oxidized silica surfaces for pure (milli-q) water and differentaqueous sodium chloride solutions.
2Upon contact with the substrate, the sessile droplets spread towards their equilibrium shape. From a macroscopicpoint of view, the sessile droplets reached a quasi steady-state condition. Within seconds, the liquid-vapour interfacehit on the solid substrate a (macroscopic) three-phase equilibrium contact angle θe.
26 1.2. Material and sample preparation
Figure 1.3 shows the obtained contact angles with different thermal treatments for differentaqueous sodium chloride solutions. Depending on the thermal treatment and on the sodiumchloride concentration, the equilibrium contact angle varies between 1 and 50.
2Evaporation of Pure Water Sessile
Droplets
In this chapter we investigated the evaporation of sessile droplets from pure water. The aim ofthis chapter was to apprehend the issues of the evaporation process of sessile droplets from asimple and single liquid. Sessile droplets of pure water on planar, horizontal and inert solidsubstrates stood for the ideal evaporating case. But how did "ideal" sessile droplets from pureliquid evaporate?
The evaporation behaviour was optically imaged and measured from top and side aspects ofthe sessile droplet. The temporal study of the droplet volume and shape revealed the signatureof the (expected) constant contact angle evaporation mode [3].
Quantitative evaporation experiments were performed at different relative humidities inthe surrounding air, with various droplet contact angles and volumes. The main objective wasto understand what is the influence of experimental parameters such as the relative humidityon the evaporation process and how important are the geometrical droplet contributions onthe evaporation behaviour?
In particular we focused our study on the evaporation rate of the drying sessile dropletsfrom pure water. We found that the evaporation rate was affected and related to the ambienthygrometry and on the droplet size and contact angle. The obtained relations were discussedand theoretically confirmed by analytically solving the evaporation process.
27
28 2.1. Evaporation Behaviour: No-Pinning of the Contact Line
2.1 Evaporation Behaviour: No-Pinning of the Contact Line
Figure 2.1 shows the time evolution of the droplet volume calculated from the measuredheights h(t) and radii r(t) (Eq.1.1) during the evaporation of a sessile droplet containing purewater at a relative humidity RH of 0%.
0 1 0 0 2 0 0 4 0 0 5 0 0 6 0 0 7 0 00
2
4
6
8
1 0
1 5 0 s
~ 5 m m5 . 3 m m
5 0 s
3 0 0 s
T o p v i e w
S i d e v i e w
3 0 0
Volum
e V [µ
l]
T i m e t [ s ]
Trans
ient tim
e
L a t e r a l r e s o l u t i o n l i m i t
5 0 1 5 0
~ 5 m m
5 0 s 3 0 0 s1 5 0 s
θ
~ 7 m m ~ 6 m m
V 0
- 6 - 4 - 2 0 2 4 60 . 0
0 . 1
0 . 2
Heigh
t [mm]
x [ m m ]
Figure 2.1 – Evaporation of a sessile droplet from pure water at a relative humidity RH of 0%. The insets show thesimultaneous height profile and top view images at three different evaporation times: 50, 150 and 300 s. The straightline depicts the linear decrease of the droplet volume with time experimentally observed at the initial stage of theevaporation (i.e., between t = 50 and 300 s). The extrapolation of this linear volume change yielded at t = 0 s theinitially deposited volume V0.
At t = 0 s, the sessile droplet was deposited. This was the moment when the liquid (in thepresent case, pure water) disconnected from the tip of the needle and changed its shape froma pendant droplet at the needle tip to a sessile droplet on the substrate. Upon contact withthe substrate, the sessile droplet spread towards its equilibrium shape. Typically the spreadingtook few seconds, slowing down rapidly. Empirically we found that this transient (spreading)time last less than 50 s. After this transient time, the sessile droplet reached from a macroscopicview point a quasi-steady state condition. The liquid-vapour interface hit on the solid substratea (macroscopic) three-phase equilibrium contact angle θe of about 1.
Depending on the size and contact angle of the sessile droplet and on the experimental con-ditions (relative humidity), there was a certain time window, where the sessile droplet shapeand its temporal change can be measured quite accurately from the side view of the exper-imental setup. Accurate height values were obtained before the height of the sessile dropletbecame smaller than about 50 µm. Thus for all cases presented in this thesis, we can determinewith accuracy the evaporation behaviour (i.e., the time evolution of the sessile droplet shape)after the transient time until the experimentally time observed at the lateral resolution limit(the lateral time).
In particular the loss of the sessile droplet volume was quantitatively and accurately cal-
Chapter 2. Evaporation of Pure Water Sessile Droplets 29
culated in this time window. Figure 2.1 presents the measured volume from the top and sideimagings as a function of time. For sessile droplets from pure water, it was possible to measureit approximately after the lateral time and until the droplet totally evaporated (i.e., the sessiledroplet volume reached a zero value). The corresponding volume data points are presented inFigure 2.1 as grey closed symbols after the lateral time.
The volume of the sessile droplet containing pure water decreased over the whole evapora-tion process. Between t = 50 and 300 s, the volume decrease was linear with time as depictedby the straight line in Figure 2.1. A linear extrapolation of the sessile droplet volume change(between t = 50 and 300 s) to t = 0 s yielded the initially deposited volume V0, which was about9.6 µl. As explained in the previous chapter (see II.1.1), the syringe manipulation resulted influctuations of its indicated volume (i.e., 10 µl) smaller than 5%. Therefore all droplets volumedata presented in this thesis were scaled to their initial volume V0, which was derived from thelinear extrapolation of the evaporation curve, as presented in Figure 2.1, to t = 0 s:
v =VV0
(2.1)
For times much longer than 300 s, the droplet volume decreased more slowly with time: itschange deviated from the linear decrease.
The two insets in Figure 2.1 show the sessile droplet height profile and the simultaneoustop view images at three different evaporation times: t = 50, 150 and 300 s, as indicated in themain plot of the time evolution of the sessile droplet volume. The top view images confirmthat the contact sessile droplet area with the substrate is reasonably circular in shape. Thusthe sessile droplet radii were measured with confidence. Otherwise the top view images cor-related with the height profiles show that the sessile droplet keeps its spherical-cap shape overthe evaporation process. Therefore the hypothesis of a spherical cap-shaped sessile droplet todetermine the droplet volume (Equation 1.1) was consistent and valid during the whole evap-oration experiment.
In addition the top view images show that the sessile droplet radius decreases from about 7to 5 mm between t = 50 and 300 s. Meanwhile the contact angle θ of the sessile droplet remainsconstant (about 1), as depicted by the height profiles in the same time interval. As a conse-quence, after deposition and spreading, the sessile droplet of pure water retains a constantshape (i.e., a constant contact angle) with a decreasing footprint area during its evaporation.Sessile droplets of pure water evaporate in the unpinned, constant contact angle mode1.
A linear decrease of the droplet volume is observed between t = 50 and 300 s as indicatedin Figure 2.1 with a straight line. Thus an evaporation rate (i.e., a droplet volume change pertime unit: dV
dt ) is rather well defined and can be measured in this time interval. For times muchlonger (t > 300 s), the evaporation rate diminishes over the lifetime of the droplet. The deviationof the evaporation rate at further times was expected for the evaporation of sessile droplets inconstant contact angle mode [3]. This will be explained in detail in the discussion section (seeII.2.5).
1Minor deficiencies on the contact line pinning occurred during the evaporation of sessile droplets from purewater. They can be glimpsed in the lower right corner of the droplet footprint area in the top view image at t = 50 or300 s (as depicted in the inset of Figure 2.1). They were induced by the very small contact angle observed when sessiledroplets of pure water were deposited on silicon wafers.
30 2.2. Effect of Relative Humidity on Evaporation
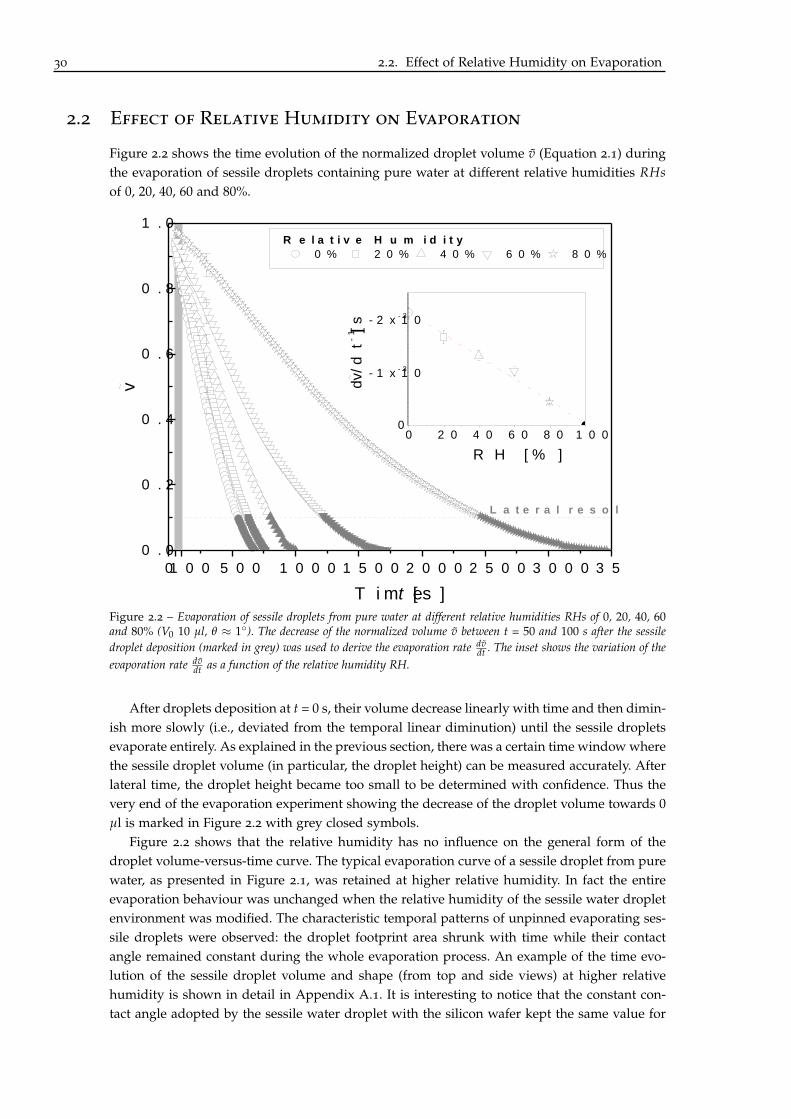
2.2 Effect of Relative Humidity on Evaporation
Figure 2.2 shows the time evolution of the normalized droplet volume v (Equation 2.1) duringthe evaporation of sessile droplets containing pure water at different relative humidities RHsof 0, 20, 40, 60 and 80%.
R e l a t i v e H u m i d i t y 0 % 2 0 % 4 0 % 6 0 % 8 0 %
L a t e r a l r e s o l u t i o n l i m i t
T i m e t [ s ]
0 2 0 4 0 6 0 8 0 1 0 00
- 1 x 1 0 - 3
- 2 x 1 0 - 3
dv/dt
[s-1 ]
R H [ % ]
Figure 2.2 – Evaporation of sessile droplets from pure water at different relative humidities RHs of 0, 20, 40, 60and 80% (V0 10 µl, θ ≈ 1). The decrease of the normalized volume v between t = 50 and 100 s after the sessiledroplet deposition (marked in grey) was used to derive the evaporation rate dv
dt . The inset shows the variation of theevaporation rate dv
dt as a function of the relative humidity RH.
After droplets deposition at t = 0 s, their volume decrease linearly with time and then dimin-ish more slowly (i.e., deviated from the temporal linear diminution) until the sessile dropletsevaporate entirely. As explained in the previous section, there was a certain time window wherethe sessile droplet volume (in particular, the droplet height) can be measured accurately. Afterlateral time, the droplet height became too small to be determined with confidence. Thus thevery end of the evaporation experiment showing the decrease of the droplet volume towards 0µl is marked in Figure 2.2 with grey closed symbols.
Figure 2.2 shows that the relative humidity has no influence on the general form of thedroplet volume-versus-time curve. The typical evaporation curve of a sessile droplet from purewater, as presented in Figure 2.1, was retained at higher relative humidity. In fact the entireevaporation behaviour was unchanged when the relative humidity of the sessile water dropletenvironment was modified. The characteristic temporal patterns of unpinned evaporating ses-sile droplets were observed: the droplet footprint area shrunk with time while their contactangle remained constant during the whole evaporation process. An example of the time evo-lution of the sessile droplet volume and shape (from top and side views) at higher relativehumidity is shown in detail in Appendix A.1. It is interesting to notice that the constant con-tact angle adopted by the sessile water droplet with the silicon wafer kept the same value for
Chapter 2. Evaporation of Pure Water Sessile Droplets 31
all evaporation experiments, i.e., θ ' 1. Sessile droplets containing pure water evaporated inunpinned, constant contact angle mode irrespective of the relative humidity.
Nevertheless the relative humidity had an influence on the evaporation kinetics of sessilewater droplets. At the initial stage of the evaporation process, the droplet volume decreasedlinearly with time. The time window, where the linear diminution of the droplet volume wasobserved, changed according to the relative humidity. Generally the evaporation curves evolvedfrom a linear to a non-linear slope when the sessile droplet volume reached 4-5 µl. As a resultan evaporation rate dv
dt (i.e., a normalized droplet volume change per time unit) was rather welldefined in a certain time period varying between t = 50 and > 1500 s depending on the relativehumidity. In order to have a better comparison and to gain insight into the evaporation studyof sessile droplets, the evaporation rate was always in this thesis measured between t = 50 and100 s. This time period is marked in grey in Figure 2.2.
The inset in Figure 2.2 illustrates the variation of the evaporation rate dvdt as a function of the
relative humidity. The evaporation rate is inversely proportional to the relative humidity of thesessile water droplet environment. The relative humidity had of course an impact on how longthe evaporation process sustained, since RH stands for the ratio between the (imposed) vapourpressure above/at the droplet surface and the saturated vapour pressure of the liquid withinthe sessile droplet. More the water vapour pressure imposed in the ambient air increased to-wards the saturated vapour pressure of water (100% theoretically), which constituted the sessiledroplet, less water molecules diffused from the droplet bulk to the ambient environment. Thussessile water droplets should tend to an equilibrium condition with its environment when theambient hygrometry augmented towards 100%. The equilibrium condition was observed whenthe relative humidity was 100%. As depicted in the inset of the Figure 2.2, the evaporation ratedecreases with RH yields a zero value at RH = 100%. The relative humidity, where the sessiledroplet neither evaporates nor condensates, is called the equilibrium relative humidity RHeq.Our experimental RHeq value determined for sessile droplets of pure water at T = 23C agreeswith the expected theoretical one [111].
2.3 Effect of Droplet Contact Angle and Size on Evaporation
Figure 2.3 shows the time evolution of the normalized droplet volume v (Equation 2.1) duringthe evaporation of sessile water droplets with various contact angles θ ranging from 1 to 40
(Figure 2.3.A) and deposited with different initial droplet volumes V0 from 1 to 10 µl (Figure2.3.B) at a relative humidity RH of 0%.
As from 50 s after the droplets deposition, their volume was calculated from the measuredh(t) and r(t) over the entire lifetime of the evaporating droplets. As shown in Figure 2.3.A, ses-sile droplets with higher contact angles adopt the typical evaporation profile that we observedat very low contact angle as depicted in Figure 2.1 (and also with a wide range of relativehumidities, Figure 2.2). The droplet volume follows a temporal linear diminution and then,slowly decreases to reach a zero value. Similar behaviour is observed when the initially de-posited droplet volume decreases from 10 to 1 µl (Figure 2.3.B). As a result the droplet contactangle and size has no influence on the evaporation profile of sessile droplets from pure water.
The detailed study of the temporal evolution of the droplet shape (from top and side as-pects) at higher contact angles and at smaller droplet volumes revealed that the evaporationmode of sessile water droplets was retained. An example of this investigation at a higher con-tact angle and at a smaller droplet size is illustrated in detail in Appendix A.1. The footprint ofthe droplet contact area with the substrate receded over the lifetime of the evaporating droplet.
32 2.3. Effect of Droplet Contact Angle and Size on Evaporation
Figure 2.3 – Evaporation of sessile droplets from pure water A. with various contact angles θ ranging from 1 to40 (V0 10 µl) and B. at different initial droplet volumes V0: 1, 5 and 10 µl (θ ≈ 1) at RH 0%. The decrease ofthe normalized volume v between t = 50 and 100 s after the sessile droplet deposition (marked in grey) was used toderive the evaporation rate dv
dt . The inset shows the variation of: A. the evaporation rate dvdt as a function of θ and B.
the logarithm of the evaporation rate dVdt as a function of the logarithm of V0.
Chapter 2. Evaporation of Pure Water Sessile Droplets 33
Meanwhile the contact angle of the droplet remained constant. Our evaporation experimentsshow that the contact angle of sessile water droplets on naturally oxidized silica wafers is in-dependent of the droplet size. Irrespective of the geometrical parameters of sessile droplets(i.e., the size and contact angle), sessile droplets containing pure water evaporate in unpinned,constant contact angle mode.
The decrease of the normalized volume v at the initial stage of the evaporation process(arbitrarily chosen between t = 50 and 100 s) was used to derive the evaporation rate dv
dt . Theinset in Figure 2.3.A shows the variation of the evaporation rate as a function of the contactangle θ. It diminishes as the droplet contact angle increases. Thus increasing the contact angleof the sessile droplet led to an augmentation of its lifetime. The contact angle effect on theevaporation rate can be explained by the singularity of the vapour flux diffusing from the freesurface of the droplet into the surrounding air at the droplet edge. At lower contact angles, thevapour flux diverged significantly in the droplet edge region. On contrary when the contactangle increased towards 90, the non-uniformity of the vapour flux along the droplet free sur-face was reduced. Therefore increasing θ from 1 to 40 induced a more uniform vapour fluxalong the surface of sessile droplets from pure water and hence a temporal diminution of theevaporation process.
The opposite behaviour is observed when the initially deposited droplet volume is de-creased from 10 to 1 µl as shown in Figure 2.3.B. A sessile droplet evaporates faster as its initialvolume decreases. As a consequence the evaporation rate of sessile droplets dV
dt (to simplify theargumentation) should depend on the droplet volume: dV
dt ∝ Vα0 , with α a constant. The inset
in Figure 2.3.B shows the variation of the logarithm of the evaporation rate dVdt as a function of
log(V0). We find that dVdt is proportional to approximately the third power of V0 (α ≈ 0.35 ±
0.02), as depicted in the inset of the Figure 2.3.B. Since the droplet volume is related to its ra-dius2 r, the evaporation rate was proportional to the droplet size. Our experimental results areconsistent with the expected evaporation behaviour of sessile droplets from pure liquid [3]. Thedependence of the evaporation rate on the geometrical droplet parameters will be explained indetail in the discussion section (see II.2.5).
2.4 Theoretical Analysis of Evaporation
According to Picknett and Bexon[3], the change of the normalized droplet volume v with timet of a spherical cap shaped sessile droplet with a contact angle θ in the quasi steady-state withdiffusion-driven evaporation is given by:
dvdt
= −4 π
(3π
) 13 D M
ρ R TPsat (1− RH)
v13
V23
0
f (θ)
β13
(2.2)
with D as diffusion coefficient of water in air, M as molecular weight of water, ρ as waterdensity, R as gas constant, T as temperature, Psat as saturated water vapour pressure at/abovethe droplet surface, RH as relative humidity in the background environment, β and f (θ) asfunctions of the contact angle θ, with:
β = (1− cos(θ))2 (2 + cos(θ)) (2.3)
2The volume of the sessile droplet V is proportional to the radius of the sphere forming the spherical cap RS tothe power of three which itself is related to the droplet radius r to the power of three: V ∼ R3
S ∼ r3. The geometricalrelationship between these three geometrical parameters was explained in the scientific background part (see I.1.2).
The geometrical contributions can be combined as a function of the contact angle f (θ):
f (θ) =f (θ)
β13
(2.5)
Note that f (θ) is as an exponentially decreasing function towards f (θ = 90) = 0.4 betweenθ = 0 and 90.
Since the temperature and the contact angle θ remained constant over the whole evaporationexperiments of sessile droplets from pure water, Equation 2.2 can be integrated as follows:
v23 = 1− 4
3π
(3π
) 13 V−
23
0 Mρ R T
D Psat (1− RH) f (θ) t (2.6)
Equation 2.6 reveals that for sessile droplets evaporating in unpinned, constant contactangle mode, the (normalized) droplet volume to the power of two third v
23 decreases linearly
with time. In addition the slope of v23 -versus-time is proportional to the relative humidity
RH and also to a geometrical function of the contact angle f (θ) (Equation 2.5). Thereforea variation of the relative humidity or the contact angle will give us different slopes of thev
23 -versus-time curves and hence an estimation of D, the diffusion coefficient of water in the
surrounding environment 3.
Determination of the diffusion coefficient D
In order to facilitate the analysis of the evaporation results and to have a better comparison,the time t was scaled to the final time tF, which was derived from the evaporation curve to Vor v = 0 µl:
tF =t
tF(2.7)
Therefore with the rescaled time tF, Equation 2.6 reads as:
v23 = 1− 4
3π
(3π
) 13 tF V−
23
0 Mρ R T
D Psat (1− RH) f (θ)︸ ︷︷ ︸Si , i = RH or θ
tF (2.8)
Figure 2.4 shows the evolution of the normalized droplet volume to the power of two thirdv
23 of evaporating sessile droplets from pure water as a function of the normalized time tF
at different relative humidities from 0 to 80% (Figure 2.4.A) and at different contact anglesranging from 1 to 40 (Figure 2.4.B).
Irrespective of the relative humidity or the contact angle, the normalized droplet volume tothe power of two third v
23 decreases linearly with the normalized time tF. The linear decrease of
3A variation of the droplet size can also be used to estimate the diffusion coefficient of water in the back-ground environment. For this purpose, the geometrical contributions in the evaporation rate equation (Equation 2.2)should be modified to highlight the droplet radius instead of the normalized droplet volume and the function β:
( 3vπβ )
13 = r
V0 sin(θ) . Furthermore the droplet radius should be approximated as a constant which is consistent, since theevaporation rate was determined as a constant in an initial short evaporation period. Nevertheless the evaporation ofsessile droplets from pure water was only studied at three different volumes which may be insufficient to determinecorrectly D. This study supported the experimental value obtained for the diffusion coefficient of water in air.
Chapter 2. Evaporation of Pure Water Sessile Droplets 35
0 . 0 0 . 2 0 . 4 0 . 6 0 . 8 1 . 00 . 0
0 . 2
0 . 4
0 . 6
0 . 8
1 . 0v2/3
R e l a t i v e H u m i d i t y 0 % 2 0 % 4 0 % 6 0 % 8 0 %
t F
0 2 0 4 0 6 0 8 0 1 0 00 . 0
- 0 . 5
- 1 . 0
- 1 . 5
- 2 . 0
S RH
R H [ % ]
A
0 . 0 0 . 2 0 . 4 0 . 6 0 . 8 1 . 00 . 0
0 . 2
0 . 4
0 . 6
0 . 8
1 . 0
v2/3
C o n t a c t a n g l e 1 ° 1 0 ° 3 0 ° 4 0 °
t F
0 . 4 0 . 8 1 . 2 1 . 60 . 0
- 0 . 5
- 1 . 0
- 1 . 5
- 2 . 0
S θ
f ( θ)
B
Figure 2.4 – Evaporation of sessile droplets from pure water A. at different relative humidities RHs from 0 to 80%(V0 10 µl, θ ≈ 1) and B. with various contact angles θ ranging from 1 to 40 (V0 10 µ) at RH 0%. The lineardecrease of the normalized volume to the power of two third v
23 with the normalized time tF was used to derive the
slope Si (i = RH or θ). The inset shows the variation of: the slope of the curve A. SRH as a function of RH and B.Sθ as a function of f (θ).
36 2.5. Discussion and outlook
v23 with time is a signature of evaporating sessile droplets with unpinned three-phase contact
line [3]. Thus Figure 2.4 confirms the experimental observations of the top and side aspects ofsessile water droplets evaporating with different RHs or with various θ, as described in theprevious sections. Sessile droplets from pure water evaporated in unpinned, constant contactangle irrespective of the relative humidity and the droplet contact angle (and also the dropletsize).
In all cases, v23 decreased linearly with tF. There were well-defined slopes Si (i = RH or θ)
for each studied relative humidity (0, 20, 40, 60 and 80%) or each contact angle adopted bysessile water droplets on the substrate (1, 10, 30 and 40). The two insets depicted in Figure 2.4show the linear variation of the slopes Si (i = RH or θ), derived from the linear decrease of v
23
with tF at different relative humidities or with different droplet contact angles, as a functionof the relative humidity (Figure 2.4.A) or the function of the contact angle f (θ) (Figure 2.4.B).The slope values correlated to the experimental parameters and constants values allowed thedetermination of the diffusion coefficient of water in the surrounding air. At a temperature of23C, we found D ≈ 2.9 x 10⁻⁵ ± 0.2 m2.s−1. This experimental value was comparable withthe value of 2.5 x 10⁻⁵ m2.s−1 from the literature [66, 112].
2.5 Discussion and outlook
Here we investigated the evaporation of sessile droplets from pure water on planar, horizon-tal and inert substrates. The study of the time evolution of the sessile droplet volume andshape (Figure 2.1) revealed the signature of evaporating sessile droplets in unpinned, con-stant contact angle mode. This evaporation mode was expected and experimentally observedfor sessile droplets containing pure liquids [3, 64–66] since any particle or surface hetero-geneities/roughness induce a pinning of the contact line.
The lifetime of an evaporating sessile droplet depends on the manner in which it evapo-rates. As explained in the scientific background part (I.2.3), sessile droplets can evaporate inunpinned, constant contact angle mode as sessile water droplets and/or in pinned, constantcontact area mode (i.e., the diameter of the droplet footprint area remains constant while itscontact angle decreases with time) [3, 113]. In particular the evaporation curves presented inFigures 2.1, 2.2 and 2.3 illustrate the sometimes overlooked result first qualitatively obtainedby Picknett and Bexon[3] that a sessile droplet evaporating in constant contact angle mode hasa longer lifetime than an initially identical droplet evaporating in pinned, constant contact areamode (i.e., any transition in the evaporation kinetics is observed for evaporating pinned sessiledroplets). As Picknett and Bexon[3] described at the initial stage of the evaporation, the dropletvolume decreased linearly with time in both evaporation modes. Nevertheless the evaporationcurve for constant contact angle mode diverged significantly towards the end of the dropletlifetime. Any elusive reason of this behaviour was advanced by the Picknett and Bexon evapo-ration model [3].
Our experimental results confirmed the tendency of unpinned sessile droplets from waterto evaporate slower at the end of the drying. This may arise from the formation of a thin wa-ter film at the very last stage of the droplet evaporation [114]. The disjoining pressure arisingin the flattening drying droplet may favor the formation of a thin and stable water film. Theevaporation rate of this thin water film should be markedly slower because of interfacial forcesbetween the solid-liquid and the liquid-vapour interfaces. Therefore the formation of a thinwater film close to the complete drying evaporation will retard the evaporation process. Ourexperimental results provided encouraging support for the theoretical predictions from the
Chapter 2. Evaporation of Pure Water Sessile Droplets 37
Picknett and Bexon model [3].Quantitative evaporation experiments on sessile droplets containing pure water were per-
formed at different RHs from 0 to 80%, with various droplet contact angles ranging from 1 to40 and initially deposited volumes from 1 to 10 µl. The evaporation characteristics of sessiledroplets from pure water was retained with higher RH, at higher θ and at smaller V0. Theenvironmental condition and the geometrical contributions had no influence on the unpinningevaporation behaviour of sessile droplets from pure water.
Nevertheless the evaporation rate depended on these different parameters as illustrated inFigures 2.2 and 2.3. The temporal change of the normalized droplet volume dv
dt decreased as:
• RH decreased towards 100% as illustrated in Figure 2.2. When increasing the RH value,the environment of the sessile droplet from pure water became more saturated withvapour concentration. Since the evaporation process is diffusion-limited, the transfer ofwater molecules in air is lowered and thus the kinetics of evaporation slowed down.
• θ increased as shown in Figure 2.3.A. This relationship came from the presence of awetted area limited by a contact line when the problem of an evaporating sessile dropletis considered. For a hemispherical droplet, the evaporative flux along the droplet surfaceis constant. A divergence of the vapour flux at the droplet edge occurred for contactangles smaller than 90, i.e., for spherical-cap shaped (sessile) droplets [53]. Therefore asthe contact angle decreased from 90 to 1, the singularity of the evaporative flux nearthe droplet edge region was enhanced. Notwithstanding the relationship between theevaporation and the contact angle was simple and exact.
• The temporal change of the droplet volume dVdt decreased as V
13
0 decreased as depictedin Figure 2.3.B. The evaporation of a hemispherical or spherical-cap shaped droplet isproportional to the droplet radius (RS ∼ r ∼ V
13 ). Thus the rate of droplet evaporation
is proportional to the droplet radius and not to the surface area of the droplet [115].Therefore large droplet evaporated faster than small droplet.
These experimental observations are in agreement with the Picknett and Bexon evapora-tion model [3] (Equation 2.2). As expressed in Equation 2.2, the evaporation rate dependson the vapour pressure difference Psat(1 − RH) (with Psat the saturated water vapour pres-sure at/above the droplet surface), on the droplet size and on a function of the contact anglef (θ). Furthermore the normalized droplet volume to the power of two third derived from theevaporation rate equation decreased linearly with time. This linear decrease is a well-knownproperty for sessile droplets evaporating in unpinned, constant contact angle mode. It was ex-perimentally demonstrated in Figure 2.4 and theoretically useful to determine D, the diffusioncoefficient of water in air.
To conclude we demonstrated in this chapter that the evaporation of sessile droplets frompure liquid was an unexpectedly complicated process. From an experimental viewpoint, theevaporation was controlled by the diffusion of the volatile compound in the atmosphere. Thetheoretical analysis of the evaporation process is acceptably understood and coherent withthe experiments. Future project will include modelisation of the evaporation process of sessiledroplet from pure liquid.
3Evaporation of Sessile Droplets
from Sodium Chloride Solutions?
In this chapter we investigated the evaporation of sessile droplets from sodium chloride solu-tions. The aim of this chapter was to understand how did an aqueous sessile droplet containinga non-volatile and soluble component evaporate?
The evaporation of this aqueous binary mixture was not as straightforward as simple andsingle liquid. The non-volatile component, in our case sodium chloride (NaCl), enriched asthe volume of the evaporating droplet decreased. Thus, the following questions arose: whereand when did the salt enrichment occurred inside the droplet? What was the impact of thisenrichment on the evaporation behaviour and rate? Will it lead to a pinning of the three-phasecontact line? Did the sessile salty droplet evaporate faster or slower than sessile water droplets?In the following, we addressed those questions.
For this purpose, as in the previous chapter, quantitative evaporation experiments wereperformed. We studied the impact of the relative humidity in the surrounding environment,the droplet size and contact angle as well as the initial sodium chloride concentration on theevaporation and particularly, on the evaporation rate. The main objective was to apprehendstep-by-step the influence of each parameter on the evaporation of sessile salty droplet, basedon the theoretical approach described in the previous chapter for the evaporation of sessiledroplet from pure liquid.
The normalization step-by-step of the measured evaporation rate with the influential pa-rameters (i.e., the environmental relative humidity and the geometrical contributions) had forobjective to focus on the impact of salt concentration on evaporation and to ultimately achievean universal, free-unit, evaporation rate equation. Particle tracking velocimetry experiments,correlated to a comparison of the theoretical/experimental value of the evaporation rate, al-lowed us to figure out the influence of the flow pattern, in particular the Marangoni effectalong the evaporating droplet surface, and its feedback on the evaporation profile.
?Published as: Virginie Soulié, Stefan Karpitschka, Florence Lequien, Philippe Prené, Thomas Zemb, HelmuthMoehwald and Hans Riegler. The Evaporation Behavior of Sessile Droplets from Aqueous Saline Solutions. PhysicalChemistry Chemical Physics, 17, 22296-22303, 2015.
39
40 3.1. Evaporation Behaviour: Pinning of the Contact Line
3.1 Evaporation Behaviour: Pinning of the Contact Line
3.1.1 Evaporation Behaviour
Figure 3.1 shows the time evolution of the droplet volume calculated from the measuredheights h(t) and radii r(t) during the evaporation of a sessile droplet containing 10−3M NaCl(sodium chloride) at a relative humidity RH of 0%.
0 1 0 0 2 0 0 4 0 0 5 0 0 6 0 00
2
4
6
8
1 015 0 s
5 0
T o p v i e w
3 0 0
3 0 0 s
1 5 0 s
5 0 s
Volum
e V [µ
l]
T i m e t [ s ]
Trans
ient ti
me
L a t e r a l r e s o l u t i o n l i m i t
1 5 0
S i d e v i e w
θ
~ 5 . 6 m m
V 0
- 6 - 4 - 2 0 2 4 60 . 0
0 . 1
0 . 2
Heigh
t [mm]
x [ m m ]
Figure 3.1 – Evaporation of a sessile droplet from 10−3M NaCl at a relative humidity RH of 0%. The inset plotshows the height profile at three different evaporation times: 50, 150 and 300 s. The other inset shows top viewimage 50 s after droplet deposition. The straight line depicts the linear decrease of the droplet volume with timeexperimentally observed. The extrapolation of this linear volume change yielded at t = 0 s the initially depositedvolume V0.
At t = 0 s, the sessile droplet was deposited with a syringe on the substrate. Upon con-tact with the substrate the sessile droplet spread towards its equilibrium shape. Typicallythe spreading took few seconds, slowing down very quickly. Empirically we found that thistransient (spreading) time last less than 50 s irrespective of the liquid (pure water or NaClsolutions) contained in the sessile droplet. After this transient time, the sessile droplet reacheda quasi-steate condition from a macroscopic viewpoint. The sessile droplet from 10−3M NaClon the solid substrate adopted a (macroscopic) three-phase equilibrium contact angle θe ofabout 2 ± 0.5. This value is relatively close to the equilibrium contact angle obtained withsessile water droplet in the same experimental conditions.
As explained in the previous chapter, the temporal change of the droplet shape was mea-sured on a certain time window. Accurate height values were obtained from the transient time(i.e., 50 s after droplet deposition) until the lateral time whose its value depends on the saltconcentration, the droplet size and contact angle and also on the relative humidity. Thus theevaporation behaviour of the sessile droplet (i.e., the time evolution of the droplet shape) was
Chapter 3. Evaporation of Sessile Droplets from Sodium Chloride Solutions 41
determined with confidence after the transient until the lateral times.In particular the temporal change of the droplet volume was calculated in this time window.
Figure 3.1 presents the measured droplet volume from the top and side aspects as a functionof time. The volume of the sessile droplet containing 10−3M NaCl decreases linearly with timeover the whole studied evaporation range. As shown in Figure 3.1, the straight line depictsthe linear temporal decrease of the sessile droplet volume. In comparison with sessile waterdroplets, there was no deviation of the droplet volume at further times. This indicates that theevaporation behaviour of sessile droplets from aqueous sodium chloride solutions may behavedifferently as pure water. The linear extrapolation of the sessile droplet volume decrease to t =0 s revealed typically a variation of the initially deposited volume V0 by about 5%.
The side view inset in Figure 3.1 shows the droplet height profiles at three different evapo-ration times (i.e., t = 50, 150 and 300 s) as determined from the side view imaging. The otherinset shows the top view image of the sessile droplet at t = 50 s. These two insets in Figure 3.1illustrate that the sessile droplet keeps its spherical-cap shape over the evaporation process1.Thus as for sessile water droplets the volume of salty droplets can be calculated accurately(Equation 1.1) assuming a spherical cap shape during the whole evaporation experiment(observed in the time window).
Additionally the height profiles show that the contact angle θ decreases between t = 50and 300 s. Meanwhile the sessile droplet radius remains constant (r ∼ 5.6 mm), as depictedin the side aspect profiles. After deposition and spreading the three-phase contact line of asessile droplet from 10−3M NaCl pinned. As a result the footprint area of the sessile dropletfrom 10−3M NaCl remained constant while its contact angle decreased during its evaporation.Sessile droplets from 10−3M NaCl evaporated in the pinned, constant contact area mode.
The evaporation experiments of sessile droplets from aqueous NaCl solutions were per-formed with seven decades of initial sodium chloride concentrations from 10−8 to 6.1M (i.e.,to the saturation limit). Above a concentration of 10−6M NaCl, the sodium chloride concentra-tion had no influence on the evaporation curve (i.e., on the droplet volume-versus-time curve).The droplet volume-versus-time curve depicted in Figure 3.1 was representative of the typicalevaporation curve obtained with NaCl concentrations ranging from 10−6 to 6.1M. In fact theentire evaporation behaviour presented in Figure 3.1 was unchanged when the salt concentra-tion varied between 10−6M to to the saturation limit. The characteristic temporal patterns ofpinned evaporating sessile droplets were observed: the contact angle decreased with time whilethe footprint of the droplet contact area with the substrate remained constant over the lifetimeof the evaporating droplet. Examples of the time evolution of the sessile droplet volume andshape (from top and side views) at different representatives sodium chloride concentrations areshown in detail in Appendix A.2.1. Sessile droplets from aqueous sodium chloride solutionsevaporated in pinned, constant contact area mode for NaCl concentrations higher than 10−6M.
In contrast for sodium chloride concentrations smaller than 10−7M we found that the sessiledroplets evaporated in unpinned, constant contact angle mode as sessile water droplets. Afterdeposition and initial spreading the sessile droplets containing very low NaCl concentrationsdid not pinned and retained a constant shape (constant contact angle) with a decreasing foot-print area during evaporation. Thus our evaporation experiments performed in a wide rangeof NaCl concentrations revealed that a very small amount of sodium chloride in sessile water
1Since the three different droplet height profiles were presented in the same plot the side aspect of the sessiledroplet appeared as geometrically distorted for t ≥ 150 s. Different scaling for each droplet height profile confirms thespherical caps during the whole evaporation process.
42 3.1. Evaporation Behaviour: Pinning of the Contact Line
droplets changed drastically the evaporation behaviour. The transition between pinning andno-pinning evaporation occurred at a quite very low NaCl concentrations.
3.1.2 Pattern Formation
Figure 3.2 shows top views of the deposition pattern obtained after complete evaporation ofsessile droplets from aqueous sodium chloride solutions at different concentrations of NaClranging from 10−6 to 6.1M at a relative humidity of 0%.
Figure 3.2 – Morphologies of the final deposit obtained after complete drying of sessile droplets containing aqueousNaCl solutions at different initial salt concentrations from 10−6 to 6.1M NaCl. The evaporation experiments wereperformed at a relative humidity RH of 0% with 10 µl-sessile droplets. At the top of each final deposition pattern isshown the corresponding intensity profile illustrating the deposition distribution over the droplet footprint diameter.Note that the profile shows the inverted grey scale of the corresponding top view image of the sessile droplet, measuredwith an image analysis software.
Figure 3.2 reveals that the morphologies of the final dried deposit change with increasingsodium chloride concentration. The corresponding plot of each dried sessile picture shows itsreflected light intensity profile as a function of the radial position along the droplet diameter(i.e., the radial position scaled with the droplet diameter). The intensity profile was derivedfrom the middle of the droplet footprint area along its diameter and averaged over 10% of thedeposition diameter (i.e., within the dotted lines depicted on 10−3M NaCl deposit picture).The intensity is proportional to the inverse of the grey scale in the final deposit picture, whichin turn may correspond to the concentration of the precipitated salt. The intensity was de-termined from the grey scale of the top view image of the sessile droplet, measured with animage analysis software (Image J). To better reveal the pattern deposit, the image contrast wasenhanced so that the background substrate appears white and the sessile droplet in grey scale.As a first approximation, we assumed a linear relationship between the grey scale and salt areaenrichment. Notwithstanding the intensity profile plot was relatively useful to illustrate thedeposition distribution of each final deposit picture but was not at all an absolute measure ofthe salt density.
From 10−6 to 10−3M NaCl, the final deposit obtained after complete evaporation exhibitsthe classical "coffee-ring" deposition (see I.3.1). Most of the precipitation of sodium chlorideis concentrated at the droplet edge. A closer examination with optical microscopy confirmed
Chapter 3. Evaporation of Sessile Droplets from Sodium Chloride Solutions 43
the outer deposition ring of salt in this NaCl concentration range2. Very few NaCl precipitatesoccupied the droplet center. Similar deposition patterns are observed at very high sodiumchloride concentrations. Above a NaCl concentration of 2M nearly all the precipitated sodiumchloride are deposited at the initial pinned contact line. A very pronounced salt-ring at thedroplet edge is observed as shown in the fourth picture in Figure 3.2. In comparison to verylow NaCl concentrations (below 10−3M NaCl), some sodium chloride crystals surrounding bydendrites are deposited in the droplet center.
For intermediate NaCl concentrations (i.e., between 10−2 to 1M NaCl), the deposition pat-terns change dramatically as depicted by the second and third pictures in Figure 3.2. A moreuniform salt deposition is observed as illustrated in the corresponding intensity profiles. Thecomplete footprint area is covered with micro-crystallites of different morphologies includingfingers, fractal aggregates, fractal branches and even crystals which appeared in the dropletcenter.
Our observations suggest that the different morphologies of the final pattern obtained af-ter complete drying of sessile droplets containing sodium chloride solutions at different initialNaCl concentrations originated from a complex interplay of flows dynamics including capil-lary flow [1] and other instabilities such as solutal Marangoni effect [76]. The visualization ofthe flow pattern will be shown in the section 3.5. Furthermore the flow dependence on the finaldeposit will be explained in detail in the discussion section 3.7.
3.2 Influence of Relative Humidity on Evaporation
3.2.1 Evaporation Behaviour
Figure 3.3 shows the time evolution of the normalized droplet volume v (Equation 2.1) duringthe evaporation of sessile droplets containing 10−3M NaCl at different relative humidities RHsof 0, 20, 40 and 60% 3.
After droplets deposition at t = 0 s, their (normalized) volume decreased linearly withtime. Therefore even at higher relative humidities the typical evaporation curve of sessile saltydroplets (i.e., a linear temporal change of the droplet volume during its whole evaporation)was retained. As for sessile water droplets, we found that the evaporation behaviour of sessilesalty droplets was preserved over the studied range of RHs. The characteristic temporal pat-terns of pinned evaporating sessile droplets were observed: the droplet contact angle decreasedwith time while its footprint area remained constant during the whole evaporation process. Anexample of the time evolution of the sessile droplet volume and shape (from top and side imag-ings) at higher relative humidity is presented in detail in Appendix A.2.2.1. As observed forsessile droplets from pure water, the equilibrium contact angle adopted by the sessile dropletfrom 10−3M NaCl just 50 s after deposition onto the silicon wafer kept the same value forall evaporation experiments at different RHs, i.e., θe ≈ 2. Sessile droplets from 10−3M NaClevaporated in pinned, constant contact area mode irrespective of the relative humidity.
However, the relative humidity had an (expected) influence on the evaporation kinetics ofsessile salty droplet. Within the initial evaporation time period (i.e., between t = 50 and 100s) and also later, the droplet (normalized) volume decreased linearly with time. This decreasemarked in grey in Figure 3.3 was used to derive the evaporation rate dv
dt , i.e., the normal-
2For sessile droplets containing initially sodium chloride concentration smaller than 10−4M the top view imagedid not show to the naked eye the salt ring at the droplet edge. Optical microscopy was used to confirm the presenceof precipitated salt at the initial pinned contact line.
3Since a saturated NaCl solution condensed for RH higher than 75%, the relative humidity impact on the evapo-ration of sessile droplets from NaCl solutions was only presented in this thesis between 0 and 60%.
44 3.2. Influence of Relative Humidity on Evaporation
0 5 0 0 1 0 0 00 . 0
0 . 2
0 . 4
0 . 6
0 . 8
1 . 0
R e l a t i v e h u m i d i t y R H 0 % R H 2 0 % R H 4 0 % R H 6 0 %
v
T i m e t [ s ]
9 90 2 0 4 0 6 0 8 00
- 1 x 1 0 - 3
- 2 x 1 0 - 3
dv/dt
[s-1 ]
R H [ % ]
Figure 3.3 – Evaporation of sessile droplets from 10−3M NaCl at different relative humidities RHs of 0, 20, 40and 60% (V0 = 10 µl, θ ≈ 2). The decrease of the normalized volume v between t = 50 and 100 s after the sessiledroplet deposition (marked in grey) was used to derive the evaporation rate dv
dt . The inset shows the variation of theevaporation rate dv
dt as a function of the relative humidity RH.
ized droplet volume change per time unit. The inset in Figure 3.3 shows the variation of theevaporation rate dv
dt as a function of the relative humidity. The evaporation rate is inverselyproportional to the relative humidity. This effect was experimentally demonstrated with sessiledroplets from pure water in the previous chapter and theoretically expressed in Equation 2.2according to the Picknett and Bexon evaporation model [3]. A linear extrapolation of the evap-oration rate decrease with RH yielded at dv
dt = 0 s−1 to the equilibrium relative humidity RHeq
for 10−3M NaCl solution. We found an experimental value for RHeq of about 99%. This valueagreed quite well with the expected value of 99.8% at T = 23C [116].
For sessile droplets from aqueous solutions with/without salt the evaporation rate dependson the vapour pressure difference (PH2O
sat − P) with PH2Osat the saturated water vapour pressure
at/above the droplet surface (due to the local equilibrium at the droplet-air interface) and Pthe water vapour pressure at infinite distance from the droplet, i.e., the water vapour pressureof the ambient environment. Since the resulting influence of the relative humidity on the evap-oration rate is known and experimentally identified, the time t was scaled with the vapourpressure difference normalized to the saturation vapour pressure of pure water:
tRH = tPH2O
sat − P
PH2Osat
= t (1− RH) (3.1)
As a reminder the relative humidity RH stands for the ratio between the water vapour pres-sure of the surrounding air with the saturation vapour pressure of water. With the time scalingbased on the normalization with the relative vapour pressure (Equation 3.1) all the evaporation
Chapter 3. Evaporation of Sessile Droplets from Sodium Chloride Solutions 45
curves experimentally measured at different RHs should result in a single v-versus-tRH , sincethe geometrical contributions (droplet volume and contact angle) were approximately constantover the studied range of RHs.
Figure 3.4 shows the measured normalized droplet volume v (Equation 2.1) as a function ofthe rescaled time tRH (Equation 3.1) for evaporating sessile droplets of 10−3M NaCl at differentrelative humidities from 0 to 60%. All the evaporation curves measured at different RH levelcollapse nicely into a single curve corresponding to the evaporation curve at RH = 0%. Figure3.4 demonstrates that the evaporation of sessile droplets does not depend on the environmentalrelative humidity if the droplet volume and the time are appropriately normalized accordingto Equations 2.1 and 3.1, respectively. Therefore the evaporation rate dv
dtRHin the initial evapo-
ration period (i.e., the slope of the obtained single evaporation curve between t = 50 and 100 s,marked in grey in Figure 3.4) has from now one and only one value irrespective of the relativehumidity.
0 1 0 0 2 0 0 3 0 0 4 0 0 5 0 00 . 0
0 . 2
0 . 4
0 . 6
0 . 8
1 . 0R e l a t i v e h u m i d i t y
R H 0 % R H 2 0 % R H 4 0 % R H 6 0 %
v
t R H [ s ]Figure 3.4 – Normalized droplet volume v (Equation 2.1) as a function of the scaled time with the normalizedrelative vapour pressure tRH (Equation 3.1). The experiments were performed with sessile droplets containing aninitial NaCl concentration of 10−3M (V0 = 10 µl, θ ≈ 2) at different relative humidities RHs of 0, 20, 40 and 60%.
3.2.2 Salt-concentration dependence
The influence of the relative humidity on the evaporation of sessile droplets containing dif-ferent initial NaCl concentrations from 10−6 to 6.1M was investigated. For higher initial NaClconcentrations, an increase of the relative humidity from 0 to 60% had no impact on the evapo-ration behaviour of the sessile droplets. The typical evaporation curve of pinned drying sessiledroplets from salty solution as depicted in Figure 3.3 was retained at higher relative humidityover the wide studied range of initial NaCl concentrations. Examples of the temporal change
46 3.2. Influence of Relative Humidity on Evaporation
of the sessile droplet volume measured from top and side views at different relative humidities(from 0 to 60%) for sessile droplets containing higher initial salt concentrations are presented inAppendix A.2.2.2. Irrespective of the relative humidity sessile droplets from aqueous sodiumchloride solutions evaporated in pinned, constant contact angle mode for NaCl concentrationshigher than 10−6M.
The evolution of the evaporation rate as a function of the relative humidity was also studiedfor concentrated NaCl solutions. The detailed investigation is illustrated in Appendix A.2.2.2.Our results reveal that the evaporation rate dv
dt is inversely proportional to the relative humid-ity as observed for lower NaCl concentrations. The absolute values of the evaporation ratedepend on NaCl concentration. Concentrated sessile salty droplets evaporated slower: theyhad a longer lifetime than lower NaCl concentrated droplets. According to Raoult’s law theaddition of a non volatile solute such as sodium chloride to an aqueous solution provokes adiminution of the vapour pressure of the salty solution [116]. Therefore, since the evaporationrate depends on the vapour pressure difference Psat(1− RH), increasing co and equivalentlydecreasing Psat induces a diminution of the evaporation rate. The decrease in Psat, and byextrapolation the equilibrium relative humidity RHeq, with the initial salt concentration wasexperimentally demonstrated. Indeed, the measured RHeq derived from the extrapolation ofthe evaporation decrease with RH at dv
dt = 0 s−1 decreased from 99 to 75.4% if the NaCl con-centration in the sessile droplet increased from 10−3 to 6.1M. Our experimental values areconsistent with the expected values obtained from Raoult’s law and also in the literature at T= 23C [116].
For evaporating sessile droplets from higher initial NaCl concentrations the rescaled evap-oration curves (i.e., the normalized droplet volume v-versus-tRH) measured at different RHscoincided as well into a single evaporation curve. The corresponding figures are shown inAppendix A.2.2.2. Thus for sessile droplets from aqueous saline solutions the environmentalrelative humidity has no influence on the evaporation process if the droplet volume and thetime are appropriately normalized according to Equations 2.1 and 3.1, respectively.
3.2.3 Pattern formation
The influence of relative humidity on the pattern at the end of the evaporation of sessiledroplets from aqueous NaCl solutions was investigated by considering same initial volumeof sessile droplet evaporating at four different representative NaCl concentrations in differentRH levels. Final sessile droplet pictures are presented in Figure 3.5. This figure shows morpho-logical and structural evolutions of drying droplets of NaCl solutions at two extreme differentvalues of RH: 0 and 60%.
In both relative humidity cases, the shape of the final structures after complete evapora-tion of sessile droplets from aqueous NaCl solutions changes as NaCl concentration increasesfrom 10−6 to 6.1M. However, the three different characteristics patterns identified at low hu-midity are preserved in high-humidity environment. At low NaCl concentrations (from 10−6
to 10−3M) the final dried structure exhibits the classical "coffee-ring" but in a wider circularshape (i.e., the salt ring is less focused at the droplet periphery) in higher relative humidityenvironment. Above a concentration of 2M NaCl the peripheral salt deposition is retained. Ata relative humidity of 60% in the surrounding air of the sessile droplets, the observed crystalsat the end of the evaporation appear bigger and devoid of dendrites structures around them.For intermediate NaCl concentrations (i.e., between 10−2 and 1M NaCl) the uniform deposi-tion over the entire footprint area of the dried sessile droplet is preserved at higher relativehumidity.
Chapter 3. Evaporation of Sessile Droplets from Sodium Chloride Solutions 47
Figure 3.5 – Morphologies of the final deposit obtained after complete drying of sessile droplets containing aqueousNaCl solutions at different initial salt concentrations from 10−6 to 6.1M NaCl. The evaporation experiments wereperformed at two different relative humidities RHs of 0% and 60% with 10 µl-sessile droplets.
Our observations suggest that relative humidity has a non-negligible impact on the finalstructures obtained at the very last stage of evaporation. Increasing the relative humidity from0 to 60% led to double/triple the drying time. Therefore a high-humidity environment im-posed a slower evaporation rate which in turn, produced a slower capillary drift towards thedroplet edge (i.e., the vapour flux at the droplet edge was reduced) [71]. As the evaporationrate was slow the salt ions had more time to diffuse towards the formed crystal nuclei. As aresult smoother and bigger crystals emerged when the relative humidity of the ambient air ofthe sessile droplet from aqueous NaCl solutions increased.
3.3 Influence of Droplet Contact Angle and Size on Evapora-tion
Figure 3.6 shows the temporal change of the normalized droplet volume v (Equation 2.1) dur-ing the evaporation of sessile droplets containing initially a NaCl concentration of 10−3M (A)with various contact angles θ from 2 to 40 and (B) at different initial droplet volumes V0 from1 to 10 µl at a relative humidity RH of 0%.
As from 50 s after the droplets deposition, the volume calculated from the measured h(t)and r(t) decreases quite linearly with time within the studied time period (i.e., from the tran-sient to the lateral times) in all cases (Figure 3.6). As shown in Figure 3.6.A, sessile dropletswith higher contact angles adopt the typical evaporation profile that we observed at very lowcontact angles (Figure 3.1). Similar behaviour is preserved when the initially deposited dropletvolume is increased from 1 to 10 µl as depicted in Figure 3.6.B. Therefore the evaporation pro-file of sessile droplets from 10−3M NaCl is unchanged with varying the droplet contact angle(θ < 90) and size.
48 3.3. Influence of Droplet Contact Angle and Size on Evaporation
0 50 500 10000.0
0.2
0.4
0.6
0.8
1.0BDroplet volume
1 µl 5 µl 10µl
100
v
Time t [s]100
A
0 50 500 10000.0
0.2
0.4
0.6
0.8
1.0Contact angle
2° 10° 30° 40°
v
Time t [s]
Figure 3.6 – Evaporation of sessile droplets from 10−3M NaCl A. with various contact angles: 2, 10, 30 and 40
(V0 10 µl) and initially deposited B. with different volumes: 1, 5 and 10 µl (θ ≈ 2) at a relative humidity RH of0%. The decrease of the normalized volume v between t = 50 and 100 s after the sessile droplet deposition (markedin grey) was used to derive the evaporation rate dv
dt .
The detailed investigation of the temporal change of the droplet shape (from top and sideaspects) at higher contact angles and at smaller initial droplet volumes confirmed that theevaporation mode of sessile droplets containing 10−3M NaCl was retained. An example of thisstudy at a higher contact angle and at a smaller droplet size is shown in detail in AppendixA.2.3.1. The footprint of the droplet diameter remained constant over the studied lifetime ofthe evaporating droplet. Meanwhile the contact angle of the droplet decreased. Our experi-mental evaporation results revealed that the contact angle of sessile droplets from 10−3M NaCldeposited onto naturally oxidized silicon wafers was independent of the droplet size. Irrespec-tive of the geometrical parameters of sessile droplets (i.e., r and θ), sessile droplets from 10−3MNaCl evaporated in pinned, constant contact area mode.
Within the initial evaporation range (i.e., between t = 50 and 100 s) and later, the droplet(normalized) volume decreases linearly with time. For this initial temporal decrease markedin grey in Figure 3.6, we determined the evaporation rate dv
dt . The evaporation rate decreaseswith increasing the contact angle θ (Figure 3.6.A). θ is calculated from the droplet shape at t =50 s. Similar results were obtained with sessile droplets from pure water. As the contact angleincreases towards 90, the singularity of the vapour flux (diffusing from the free surface of thedroplet into the surrounding air) at the droplet edge is reduced, resulting in a global diminu-tion of the evaporation rate. Furthermore, as the droplet size decreases, dv
dt increases (Figure 3.6.B). As illustrated with sessile water droplets, larger droplets evaporated slower than smallerones.
Our experimental evaporation results showed that the evaporation rate of sessile dropletsfrom 10−3M NaCl solution was dependent on the droplet size and contact angle. According tothe Picknett and Bexon model [3], the change of the normalized droplet volume v with time tof a spherical-cap shaped sessile droplet with a contact angle θ in the quasi-steady state withdiffusion-driven evaporation is given by:
dvdt
= −4 π1
V0
D Mρ R T
(Psat − P) f (θ)r
sin(θ)(3.2)
with D as diffusion coefficient of water in air, M as molecular weight of water, ρ as water den-sity, R as gas constant, T as temperature, Psat as saturated vapour pressure at/above the droplet
Chapter 3. Evaporation of Sessile Droplets from Sodium Chloride Solutions 49
surface, P as water vapour pressure in the background environment and f (θ) as function ofthe contact angle θ (Equation 2.4).
Equation 3.2 is equivalent of the evaporation rate equation presented in the previous chap-ter for sessile water droplets (Equation 2.2), since the Picknett and Bexon evaporation model [3]is valid for pinned and unpinned sessile droplets. The geometrical contributions in Equation2.2 (i.e., the normalized droplet volume v and the functions of the contact angle β and f (θ))were expressed as function of the droplet radius r and contact angle θ (r ≈ constant since sessiledroplets from 10−3M NaCl evaporated in pinned, constant contact area mode) and combinedas an equivalent droplet size factor r:
V13
0 f (θ)(
3 vπ β
) 13= f (θ)
rsin(θ)
= r (3.3)
We focused in this thesis on the evaporation behaviour at times between 50 and 100 s afterdroplet deposition, i.e., typically only about 10% of the time for the complete evaporation ofthe droplets. During the initial evaporation period, we found that the evaporation rate wasconstant, irrespective of the evaporation mode (i.e., either constant contact angle mode or con-stant contact area mode) [3]. Therefore the droplet size factor r can be assumed as constantwith excellent approximation during the initial evaporation times range according to Equation3.2. For the data analysis r (particularly θ since r remained constant for sessile droplets from10−3M NaCl over their evaporating lifetime) was calculated from the droplet shape at t = 50 s.
Since the resulting effect of the geometrical parameters (i.e., r and θ) on the evaporationrate was experimentally identified, the time tRH (i.e., the time t scaled to the relative vapourpressure difference, Equation 3.1) was scaled with the droplet size factor r:
t = tRH r = tPH2O
sat − P
PH2Osat
r (3.4)
Figure 3.7 shows the normalized droplet volume v (Equation 2.1) as function of the scaledtime t (Equation 3.4) for sessile droplets containing initially a concentration of 10−3M NaCl. Theexperiments were performed at different RHs, with various θ and at different V0. The evap-oration curves measured at different relative humidities and droplet contact angles collapsenicely into a single curve if the droplet volume and time are scaled appropriately accordingto Equations 2.1 and 3.4, respectively. Therefore the evaporation rate dv
dt calculated in the ini-tial evaporation period (marked in grey in Figure 3.7) has from now one and only one valueirrespective of RH and θ. Figure 3.7 demonstrates that the evaporation behaviour of sessiledroplets from 10−3M NaCl may be described by an universal equation. This will be explainedand demonstrated in detail in the next section. The scaled evaporation curves measured atdifferent V0 do not coincide with others evaporation curves, since the normalized evaporationrate dv
dt is still inversely dependent on the initial droplet volume V0 (Equation 3.2).
The impact of the droplet size and contact angle on the evaporation of sessile dropletsfrom different initial NaCl concentrations (i.e., between 10−6 to 6.1M) was studied. The evap-oration curves presented in Figure 3.6 are representative for all the experimental evaporationexperiments obtained over the wide studied range of NaCl concentrations with different θ andV0. Examples of the time evolution of the sessile droplet volume measured from top and sideaspects at different droplet sizes and contact angles for sessile droplets containing NaCl con-centrations ≥ 10−6M are illustrated in Appendix A.2.3.2. Irrespective of the droplet contactangle and size, sessile droplets from aqueous sodium chloride solutions evaporated in pinned,
50 3.4. Universal Evaporation Behaviour
0 5 0 0 1 0 0 00 . 0
0 . 2
0 . 4
0 . 6
0 . 8
1 . 0R e l a t i v e h u m i d i t y
0 % 2 0 % 4 0 % 6 0 %C o n t a c t a n g l e
2 ° 1 0 ° 3 0 ° 4 0 °D r o p l e t v o l u m e
1 µ l 5 µ l 1 0 µ l
v
t [ m m . s ]
0 1 0 2 0 3 0 4 0 5 00
1
2
3
r [mm]
θ [ ° ]
Figure 3.7 – Normalized droplet volume v (Equation 2.1) as a function of the scaled time t (Equation 3.4). Theexperiments were performed with sessile droplets containing an initial NaCl concentration of 10−3M at differentrelative humidities RHs of 0, 20, 40 and 60% (V0 = 10 µl, θ ≈ 2), with various contact angles θ: 2, 10, 30 and40 (V0 10 µl) and at different droplet volumes V0: 1, 5 and 10 µl (θ ≈ 2). The inset shows the droplet size factorr (Equation 3.3) as a function of the initial contact angle θ0.
constant contact angle mode for NaCl concentrations higher than 10−6M.Similar trend for the evaporation rate evolution with the droplet contact angle and size
was observed at higher NaCl concentrations. Sessile droplets with a higher contact angle orwith a higher initial deposited droplet volume evaporated more slowly. The absolute values ofthe evaporation rate dv
dt depended on NaCl concentration. dvdt decreased as NaCl concentration
within the aqueous sessile droplet increased. Since dvdt depends on the saturated vapour pres-
sure Psat (Equation 3.2) and Psat is dependent on the salt concentration (as demonstrated inthe previous section, RHeq, by extension, Psat decreased with increasing NaCl concentration),concentrated NaCl induced a diminution of the evaporation rate dv
dt .Nevertheless, for evaporating sessile droplets from higher NaCl concentrations (≥ 1M
NaCl), the rescaled evaporation curves (i.e., the normalized droplet volume v-versus-t, thescaled time with the relative vapour pressure difference and the droplet size factor) observedat different θ and V0 do not coincide into a single curve as partially obtained at lower NaClconcentrations (Figure 3.7). The corresponding figures are presented in Appendix A.2.3.2. Asa result the evaporation behaviour of sessile NaCl droplets seems to be strongly affected byinitial salt concentration.
3.4 Universal Evaporation Behaviour
In this chapter we presented the different experimental influences of the environmental rela-tive humidity and the geometrical droplets parameters (i.e., r and θ) on the evaporation rate
Chapter 3. Evaporation of Sessile Droplets from Sodium Chloride Solutions 51
dVdt of sessile droplets from NaCl solutions. Step by step we introduced a normalization of the
droplet volume and the time as function of the experimental observations made at differentrelative humidities, with various droplet contact angles and sizes. The droplet volume V wasnormalized to the initial volume V0, which was derived from the linear extrapolation of theevaporation curve V-versus-t to t = 0 s (Equation 2.1). The time t was scaled with the nor-malization of the relative vapour pressure and with the droplet size factor r (Equation 3.4).RH is the environmental relative humidity as adjusted by the flow of moist nitrogen and alsomeasured in the sample chamber. r was determined from the droplet shape and size at t = 50s (Equation 3.3).
Equation 3.2 strictly describes the evaporation rate of sessile droplets from pure liquidssuch as pure water since the saturated vapour pressure Psat is assumed constant along thedroplet surface [3]. In a complex fluid such as a binary aqueous mixture of a non-volatile andsoluble solute, the evaporation of the solvent (water) will change the local composition of themixture solution and thus the vapour pressure will depend on the the radial position and alsoon the solute concentration. As demonstrated with the determination of RHeq (see II.3.2), thesaturation vapour pressure Psat depends on the salt concentration c in the droplet. Thus thetime scaling based on the saturation vapour pressure for pure water PH2O
sat allowed us to focusour study on the impact of the salt on the evaporation rate, since neither the precise spatialcomposition nor the resulting influence on the evaporation rate was known. We only experi-mentally determined a global effect of the initial NaCl concentration on the evaporation rate.
As a consequence with the scaled time, t (Equation 3.4), Equation 3.2 reads as:
dvdt
= −4 πD M PH2O
satρ R T V0
g(c) (3.5)
g(c) describes the deviation of the evaporation rate for an aqueous salt solution with saltconcentration c in comparison to the case of pure water. Thus g(c) is a spatio-temporal functionof the salt concentration within (at the surface) of the sessile droplet.
All the parameters involved in Equation 3.5 can be assumed as constant. As saturation watervapour pressure and diffusion coefficient we assumed the literature constant value of PH2O
sat =3175 Pa[116] and D = 2.5 x 10⁻⁵ m2.s−1 [66, 112] at T ≈ 23C. V0 can be assumed approximatelyconstant from the experimental determination/measurement even if we observed a typicalvariation of the deposited volume by about 5%. Since the evaporation experiment is principallylimited to a short initial time period (between 50 and 100 s after droplet deposition), we canconsider that the function g(c) was constant. Assuming that the salt concentration within thesessile droplet barely changed during the initial evaporation period, we can consider that g(c)' g(c0) = constant, with c0 as initial (inweight) salt concentration. As a result, during the initialshort evaporation period,
dvi
dt(c0) = constant (3.6)
Furthermore, we assumed that the salt was distributed homogeneously inside the dropletand in particular at the droplet surface. In Equation 3.2 we consider the saturated vapourpressure Psat as the water vapour pressure in the aqueous NaCl solution (with a NaCl concen-tration c) above/at the droplet surface, Psat = Psat(c) ' Psat(c0). Therefore g(c) had a simpleform:
g(c) =Psat(c)− P
PH2Osat − P
=(Psat(c)/PH2O
sat − RH)
(1− RH)(3.7)
52 3.4. Universal Evaporation Behaviour
Thus with relative humidity, RH, the initial evaporation rate of sessile droplets containingan initial salt concentration c0 can be described by the following equation:
dvi
dt(c0) = −4 π
D M PH2Osat
ρ R T V0
(Psat(c)/PH2Osat − RH)
(1− RH)= constant (3.8)
With Equation 3.8, the evaporation rate was still inversely proportional to the droplet size.Therefore Equation 3.8 can be transformed into a unit-free, normalized evaporation rate Qi,with Qi = 1:
Qi = −dvi
dt(c0)
14 π
ρ R T V0
D M PH2Osat
(1− RH)
(Psat(c)/PH2Osat − RH)
= 1 (3.9)
Thus Equation 3.9 describes an universal normalized evaporation rate equation: all theinitial evaporation rates dV
dt measured experimentally for different relative humidities RHs,droplet contact angles θ, initial droplet volumes V0 and initial NaCl concentrations c0, shouldresult in a value of 1 if:
• the droplet volume V and the time t are scaled according to Equations 2.1 and 3.4;
• c0 was translated into the corresponding saturated water vapour pressure in NaCl solu-tions, Psat(c) (approximated as Psat(c0)) at T ≈ 23C [116];
• the evaporation of sessile droplets from pure water was correctly described by Equation3.2 [3];
• the initial scaled evaporation rate dvdt (c0) was approximately as a constant (Equation 3.6);
and,
• the distribution of salt within the droplet (in particular, at the droplet surface) was ho-mogenous, i.e., the assumption described in Equation 3.7 was valid.
Equation 3.9 was determined as function of each experimental parameter (i.e., RH, θ, V0
and c0). If Qi = 1, the different conditions cited above were valid: the evaporation behaviourcan be described by the universal Equation 3.8. If not, Qi 6= 1, the conditions were not valid,in particular the last one assuming an homogeneous distribution of the salt within the droplet.Therefore Equation 3.9 provides a convenient approach to test the validity of the different as-sumptions.
Figure 3.8 presents the experimentally observed normalized evaporation rates Qi as func-tion of the initial NaCl concentration c0 from 0 to 6.1M for various contact angles varying from1 to 50, various initial droplet volumes from 1 to 10 µl and at different relative humiditiesfrom 0 to 60%. The dashed line depicts the theoretically expected normalized evaporation rate,scaled to a value of 1 according to Equation 3.9. The main assumption of the theoretical pre-dictions was an uniform distribution of the (inweight) salt concentration inside the droplet.
Up to a NaCl concentration of 0.5M, the measured normalized evaporation rates Qi agreequite well with the theoretical predictions irrespective of the relative humidity, the contact an-gle and the droplet size. This holds for the evaporation with unpinned, constant contact anglemode (i.e., c0 > 10−7M NaCl) as well as with pinned, constant contact area mode for 10−6 ≥c0 ≥ 0.5M NaCl. As an example, Figure 3.7 confirms that the evaporation behaviour of sessiledroplets from 10−3M NaCl at different RHs and θ for an initial volume of 10 µl is described byan universal evaporation equation depicted in Equation 3.8. Several control experiments with
Chapter 3. Evaporation of Sessile Droplets from Sodium Chloride Solutions 53
a
Figure 3.8 – Experimentally observed normalized evaporation rates Qi as function of the initial NaCl concentrationc0 from 0 to 6.1M for various contact angles varying from 1 to 50, various initial droplet volumes from 1 to 10µl and at different relative humidities from 0 to 60%. The dashed line depicts the theoretically expected normalizedevaporation rate according to Equation 3.9 with the assumption of the (inweight) salt concentration distributeduniformly inside the droplet. The droplets evaporated in pinned, constant contact area mode except for NaCl con-centrations ≤ 10−7M. The inset plot shows more precisely the evolution of Qi as function of c0 with different V0 atNaCl concentrations ≥ 10−1M.
salt concentrations c0 < 10−8M NaCl (data not presented in Figure 3.8) match quantitatively aswell as qualitatively the evaporation and the non-pinning behaviour as depicted in Figure 3.8.
Above a NaCl concentration of 0.5M, the measured normalized evaporation rates Qi agreewith the theory only for a droplet contact angle higher than 30 with an initial droplet vol-ume of 10 µl. For θ ≤ 20 at V0 = 10 µl, the measured normalized evaporation rates Qi aresignificantly smaller than expected. The deviation is most pronounced for the small contactangles. Similar trend is observed for V0 ≤ 10 µl with θ ≤ 10. On contrary the deviation isless pronounced at smaller droplet size. Thus the deviation of the experimental measurementsfrom the theory depends either on the contact angle at fixed droplet volume or on the dropletvolume at fixed small contact angles. However, with the scaling described in Equation 3.9 thedeviation from the theoretical predictions is independent from the relative humidity. This be-haviour was identified in the previous section I.3.2. Figure 3.4 (and also Figures A. 6 and A. 7
in Appendix A.2.2.2 for higher NaCl concentrations) confirm that the rescaled evaporation ratedoes not depend on the relative humidity.
Within the time period under consideration in this thesis, i.e., from the deposition of thedroplet to the end of the initial evaporation period (100 s after the droplet deposition), at mostup to about 20% of the initial liquid droplet volume may evaporate. This initial evaporationtimes range was marked in grey in each presented figure of this thesis part. A decrease of thedroplet volume due to its evaporation will lead to a corresponding increase of the salt con-
54 3.5. Flow Patterns within Evaporating Sessile Salty Droplets
centration since only water evaporated in the binary system. Therefore an enrichment in saltwithin the droplet will induce a decrease in Psat(c) and hence a diminution of the evapora-tion rate according to Equation 3.2. If this salt concentration increase was uni f orm within theentire droplet volume and provoked a measurable change in the evaporation rate value (bydecreasing Psat(c) as described in Equation 3.2), then the observed rescaled evaporation ratesdvdt as presented in Figure 3.7 (for instance for 10−3M NaCl) should not be constant with thescaled time t and by extention, with the time t. Instead the evaporation rate should decreaseas the droplet volume decreases, particularly at rather late stages, when the sessile droplet vol-ume has been reduced considerably. This was not the experimental observed case. Thereforean uni f orm increase of NaCl concentration as cause for the difference between experimentalresults and theory of the evaporation rates as obtained for high initial salt concentrations (Fig-ure 3.8) must be discarded.
An analysis of the different assumptions as described above suggests that the main reasonfor the deviation between the theoretical predictions and the experimental findings was aninhomogeneous salt distribution within the droplet. A non-uniform salt distribution within theevaporating sessile droplet altered the evaporation profile and thus g(c) can not be approxi-mated as we assumed in Equation 3.7.
3.5 Flow Patterns within Evaporating Sessile Salty Droplets
A detailed study of the evaporation rate as function of the initial NaCl concentration showed usthat a heterogeneous salt distribution within the evaporating sessile droplet caused a deviationof the experimental evaporation results with the theoretically predicted values for high initialNaCl concentrations. The origin of the inhomogeneous salt distribution within the droplet wasinvestigated by particle tracking velocimetry (PTV) experiments. PTV experiments consistedof adding fluorescent particles within the sessile salty droplet. The observation of the particlesmovement inside the evaporating droplet will reveal the direction of the flow field within thedroplet as well as the resulting particle area enrichment.
Figure 3.9 and 3.10 show the particle tracking velocimetry experiments performed withevaporating sessile droplets from 10−3M NaCl (Figure 3.9) and 1M NaCl (Figure 3.10) at arelative humidity RH of 0% with an initial droplet volume of 10 µl. To improve the contrastand to better reveal the particle movement, the image contrast as measured originally by thecamera was inverted. Originally bright, the fluorescing particles appear from now dark.
A sequence of four frames are presented in each figure. Figure 3.9 shows a time span of 300s. It was recorded about 50 s after the droplet deposition, i.e., long after the droplet had initiallyspread to its final perimeter and the three-phase contact line was pinned in this position. Oncontrary Figure 3.9 shows a time span of slighly less than 1 s. At the top of each image ofFigures 3.9 and 3.10 is depicted the side aspect of the sessile droplet as it was recorded fromthe side view camera (and also used for the determination of the droplet shape for the dropletvolume measurement). The dashed line indicates the position of the substrate surface. Thedepth of focus of the imaging exceeded the droplet height. Therefore the imaging was not ableto reveal the vertical position of the fluorescent particles within the sessile droplet. The mainpart of each image shows the top aspect of the sessile droplet. The fluorescent particles appearas dark dots or streaks. The length and direction of the streak reflect the speed and directionof the particle movement during the exposure (oversampling) time.
As indicated, the inset in each of the four frames magnifies the same area at the dropletedge region. In each inset of Figure 3.10 the location/path of a selected, individual particle
Chapter 3. Evaporation of Sessile Droplets from Sodium Chloride Solutions 55
is marked with red circles. The selected and individual particle is identified in the first framein Figure 3.10 with a red dashed arrow. In Figure 3.10 the black arrows indicate the observeddirection of the movement of this individual particle and thus the direction of the flow of thesolution environment in which the particle is embedded. On contrary in Figure 3.9 any particlewas needed to be selected and identified to show up the flow direction.
Figure 3.9 – PTV experiments in a sessile evaporating droplet from 10−3M NaCl at a relative humidity of 0% andwith an initial deposited volume of 10 µl. For better contrast the image is inverted with the fluorescing particlesappearing in dark. The sequence of frames shows a time span of 300 s recorded about 50 s after the droplet deposition.At the top of each image is illustrated the side view of the droplet with the dashed line indicating the position of thesubstrate surface. The main part of the images depicts a top view of the droplet with the fluorescing particles showingup as dots or streaks the amount of particle movement during the camera exposure time. The inset magnifies in allfour frames the same area at the droplet edge region.
Figure 3.9 reveals an unique liquid flow only directed towards the droplet edge region.The observed liquid flow towards the three-phase contact line induces a peripheral depositionof fluorescing particles. Over the evaporation process the peripheral deposit of fluorescentparticles is enhanced. Few fluorescing particles are visible at the end of the evaporation in thedroplet center region. At low initial NaCl concentrations we observed the typical volume liquidflow directed towards the droplet periphery in evaporating sessile droplets. It is caused by theexcess of liquid loss in the peripheral area due to the spatially non-uniform evaporative fluxalong the droplet surface. This capillary flow results classically in the peripheral deposition ofcoffee powder particles, the ”coffee-stain effect”’ [1].
Figure 3.10 shows a different flow field within the evaporating sessile droplet containing anhigher initial NaCl concentration. In the first two images the selected and individual particledepicted in the inset figure moves towards the droplet periphery. In the last two images itmoves away from it. The salt concentration has an impact on the observed flow pattern. Athigher NaCl concentration, it changes dramatically. The observed liquid flow away from thethree-phase contact line reveals an additional flow mechanism: a Marangoni flow component[76]. This will be explained in detail in the discussion section.
3.6 Discussion and outlook
Here we investigated the evaporation of sessile droplets from sodium chloride solutions on pla-nar, horizontal and inert substrates. The evaporation experiments were performed over heightdecades of initial NaCl concentrations, with various droplet contact angles from 2 to 50, withvarious initially deposited volumes ranging from 1 to 10 µl and at different relative humiditiesvarying from 0 to 60%. The study of the temporal change of the sessile droplet volume andshape (Figure 3.1) revealed the signature of sessile droplets evaporating in pinned, constant
56 3.6. Discussion and outlook
Figure 3.10 – Tracing of fluorescing particles (appearing in dark) in a sessile evaporating droplet from 1M NaCl ata relative humidity of 0% and with an initial deposited volume of 10 µl. The sequence of frames shows a time span ofless than 1 s recorded about 80 s after the droplet deposition. At the top of each image is illustrated the side view ofthe droplet with the dashed line indicating the position of the substrate surface. The main part of the images depicts atop view of the droplet with the fluorescing particles showing up as dots or streaks the amount of particle movementduring the camera exposure time. The inset magnifies in all four frames the same area at the droplet edge region.The circles identify the location/path of an individual particle, the black arrows the direction of the movement.
contact area mode for NaCl concentrations higher than 10−6M. This evaporation mode wasexpected [1] for aqueous sessile droplets containing non-volatile component and also exper-imentally observed before for salty droplets [71, 83, 117, 118]. The environmental conditionand the geometrical contributions (i.e., the droplet radius and contact angle) did not alter thepinning evaporation behaviour observed for sessile droplets from NaCl solutions as depictedin Figures 3.3 and 3.6.
However, the observed pinning evaporation behaviour was not retained over the widestudied range of NaCl concentrations. For initial NaCl concentration c0 ≤ 10−7M, the ses-sile droplets evaporated in unpinned, constant contact angle mode. This was remarkable thatthe transition between pinning and non-pinning of the three-phase contact line occurred atrelatively quite low salt concentrations. The origin of the threshold between pinning and non-pinning at c0 ≈ 10−6M NaCl was not obvious. That may arise from the too low initial saltconcentration to induce quickly (after the droplet deposition and a short initial spreading) apinning of the contact line or from the too fast evaporation process occurring at RH 0% topromote a sufficient transient excess salt concentration at the droplet edge to provoke its self-pinning. Future work will include a more detailed investigation on the pinning/non-pinningtransition in the evaporation behaviour of NaCl solutions. In particular the influence of a high-humidity environment or droplet size on its threshold value will be interesting.
As for sessile water droplets (studied in the previous chapter), the evaporation rate of evap-orating sessile droplets from NaCl solutions was dependent on the relative humidity of thesurrounding environment (Figure 3.3) and on the droplet shape (contact angle) and size (Fig-ure 3.6). Therefore we analyzed step-by-step the experimental evaporation experiments mea-sured for saline solutions by following the theoretical description of the evaporation of sessiledroplets from single volatile pure liquid [3, 53]. To this end the droplet volume was scaledby the initially deposited volume V0 (Equation 2.1) and the evaporation time was scaled withthe relative vapour pressure difference (we used the saturation vapour pressure of pure water,Equation 3.1) and with the geometrical contributions of the droplet (radius and contact angle,Equation 3.3). The evaporation behaviour of sessile droplets from NaCl solutions as depictedin Figure 3.7 cannot be rescaled as straightforward as in the case of pure water. In order toinvestigate the influence of salt concentration on the evaporation rate, the evaporation rate was
Chapter 3. Evaporation of Sessile Droplets from Sodium Chloride Solutions 57
approximated as a constant during the initial short studied evaporation period between t =50 and 100 s (Equation 3.6) and an uniform salt distribution within the droplet (at the dropletsurface) was assumed (Equation 3.7). With the step-by-step normalization of the evaporationrate, we achieved a single, universal, unit-free initial volume evaporation rate Qi described byEquation 3.9.
For initial salt concentrations c0 ≤ 0.5M NaCl, the experimentally measured normalizedevaporation rate Qi agreed with the theoretical predictions as shown in Figure 3.8. On con-trary, above an initial NaCl concentration of 0.5M, the measured Qi were smaller than thetheoretically predicted values (Figure 3.8). The origin of the deviation between the predictedand the measured evaporation behaviour at hight salt concentrations was an inhomogeneoussalt distribution inside the droplet. This was revealed by particle tracking velocimetry (PTV)experiments presented in Figure 3.10.
The evaporative flux diffusing from the free surface of the droplet into the surroundingair is non-uniform along the droplet surface. The vapour flux is enhanced at the edge of theevaporating sessile droplet as shown in Figure 3.11.a. The singularity of the evaporative fluxinduces a capillary flow towards the peripheral region of the droplet [1]. In the case of sessiledroplets containing volatile and non-volatile components, the capillary flow, in combinationwith the pinning of the contact line, leads to an enrichment of the non-volatile componentin the droplet edge region. In our case, a local enrichment of sodium chloride is induced inthe droplet peripheral region as illustrated in Figure 3.11.a. This will lead to a surface tensiongradient within the evaporating sessile droplet. With sodium chloride the surface variationscan become quite substantial since the surface tension γ increases with increasing the salt con-centration. The surface tension of a saturated sodium chloride solution is about 84 mN.m−1
[44]. In comparison, pure water and low NaCl concentrations solutions (i.e, c0 ≤ 10−1M) havea surface tension of about 73 mN.m−1. Therefore, as NaCl concentration increases, a surfacetension gradient may evolve in evaporating sessile droplets from NaCl solutions. It can besufficiently high to induce a Marangoni flow [104, 105]. Since a local and transient excess ofsodium chloride is produced in the droplet peripheral region, the surface tension is higher atthe droplet edge than at its center. Thus the Marangoni flow is directed towards the dropletedge, i.e., in the same direction as the usual replenishment flow for evaporating sessile dropletswithout surface tension gradient as presented in Figure 3.11.b.
00 1 01
Figure 3.11 – a. Evaporation behaviour of a sessile droplet from aqueous sodium chloride solutions. Locally varyingevaporation rate and resulting concentration gradient. : b. below and c. above 10−1M NaCl.
Figure 3.11.b illustrates the flow pattern that PTV experiments revealed for evaporatingsessile droplets containing an initial NaCl concentration lower than 10−1M (Figure 3.9). Fig-ure 3.9 shows an unique particle movement towards the three-phase contact line. This mayarise from the capillary flow compensating for the local evaporative losses at the droplet edgeregion, possibly increased by a Marangoni flow component. Theoretically diffusive dilution re-sulting from the salt concentration gradient should reduce the evaporation-induced gradient.
58 3.6. Discussion and outlook
The diffusive dilution effect is not negligible, but the capillary flow (as well as the Marangoniflow) are preponderant. This only flow towards the droplet edge may favor the formation of asalt-ring deposition. This pattern formation was observed for low initial NaCl concentrationsas depicted in Figure 3.5.
For higher initial NaCl concentrations, the surface tension gradient will lead to a strongerMarangoni flow towards the droplet edge. However, in the end, the system stabilizes in aquasi-stationary state with minimum interfacial and hydrodynamic energy (viscous dissipa-tion). Thus, as illustrated in Figure 3.11.b, the replenishment flow component will still exactlycompensate for the evaporative losses at the droplet periphery. In contrast, the Marangoni flowwill transport towards the peripheral droplet region extra liquid, which will be in excess of theevaporative losses. As a result, the capillary pressure will increase near the droplet edge andwill decrease in its center. Therefore, because of the liquid/mass conservation, a compensat-ing capillary (volume) flow away from the three-phase contact line will be driven to transportthe excess amount of liquid towards the droplet center. The flow back will occur preferentiallywithin the droplet volume, near the liquid-substrate interface to minimize frictional losses withthe opposite Marangoni flow component at/near the air-water interface. The result will be aconvective flow pattern within the evaporating sessile droplet as presented in Figure 3.11.c.
For high initial NaCl concentrations (i.e., c0 ≥ 10−1M), PTV experiments revealed a liquidflow towards and away from the droplet periphery as depicted in Figure 3.10. The top viewimaging of Figure 3.10 did not show the vertical location of the flow directions because the en-tire vertical droplet was in focus. Nevertheless we observed a convection flow near the dropletperiphery. Aside from a volume flow component away from the droplet edge region, the obser-vation of convection rolls confirmed the Marangoni flow scenario illustrated in Figure 3.11.c.The circulating flows within the evaporating sessile droplet may favor the formation of a moreuniform salt deposit or a wider salt-ring at the droplet periphery. This pattern formation wasobserved at higher NaCl concentration (i.e. c0 > 10−3M) as presented in Figure 3.5
PTV experiments presented in Figures 3.9 and 3.10 revealed significant local variations inthe liquid composition within the sessile droplet (and at the air/water interface) over the stud-ied range of NaCl concentrations. Therefore the assumption of an homogeneous salt distribu-tion within the droplet (Equation 3.7) was not strictly valid. The singularity of the evaporativeflux at the droplet edge induces an enrichment of NaCl in this peripheral region. The localenrichment of sodium chloride in the vicinity of the droplet periphery will induce a decreasein Psat(c) (i.e., the water vapour pressure in the aqueous solution containing a NaCl concentra-tion, c, above/at the droplet surface) and hence a diminution of the evaporation in the dropletedge region (Equation 3.2). Since the evaporative losses from the peripheral droplet regioncontribute significantly to the entire droplet ones, a change of the evaporation at the dropletedge can substantially alter the overall droplet evaporation behaviour. Figure 3.8 shows thatthis is the case for initial NaCl concentrations c0 higher than 0.5M. Thus the Marangoni effectinduced in evaporating sessile salty droplet at high NaCl concentrations had a feedback on theevaporation behaviour.
Quantitative evaporation experiments on sessile droplets containing aqueous sodium chlo-ride solutions were performed at different RHs, with various θ and V0 in order to analyze theinfluence of these different parameters on the evaporation behaviour. As shown in Figure 3.8,above a NaCl concentration of 0.5M, the experimentally measured normalized evaporation rateQi at smaller contact angles (i.e., θ ≤ 20 for a fixed initial droplet volume V0 of 10 µl) andat smaller droplet sizes (for a fixed range of contact angles) were significantly smaller thanthe theoretically predicted values (Equation 3.9). The sensitivity of the discrepancy betweentheory and experiment with the contact angles confirmed the proposed scenario, depicting the
Chapter 3. Evaporation of Sessile Droplets from Sodium Chloride Solutions 59
impact of Marangoni flow and its feedback on the evaporation behaviour. When the dropletcontact angle increases towards 90 the singularity of the evaporative flux near the dropletedge region was reduced. Increasing the droplet contact angle from 2 to 50 leads to decreasethe inhomogeneity of the evaporation rate between the droplet edge and its center. Thereforethe relative contribution of the evaporative losses from the droplet periphery compared to theoverall evaporation decreased as the contact angle increased. In addition, the more homoge-neous evaporation rate along the droplet surface leads to less pronounced Marangoni flows.
Furthermore, the deviation between theory and experiment was less pronounced for smallerdroplet sizes with a fixed range of low contact angles as shown in Figure 3.8. The divergenceof the evaporative flux at the droplet edge region induced a peripheral enrichment of sodiumchloride within the evaporating sessile droplet, leading to pronounced Marangoni flow at highsalt concentrations. Nevertheless the Marangoni effect may be affected by the droplet dimen-sions. In smaller droplet size the diffusive dilution effect may reduce the concentration (surfacetension) gradient and subsequently annihilate the own origin of the Marangoni effect. Thusthe relative contribution of Marangoni effect in the evaporation behaviour was reduced as thedroplet size decreased.
To conclude we demonstrated in this chapter that the evaporation of sessile droplets fromNaCl solutions was quite complex process. The flow behaviour was strongly affected by theinitial NaCl concentration. The flow behaviour within an evaporating droplet of saline solutionwas dominated by a solely outward flow (combination of Marangoni and capillary forces) atlow initial salt concentrations. At high salt concentrations, the flow behaviour changed drasti-cally and was governed by the compensating Marangoni and capillary flows that lead to con-vection rolls. Thus the evaporation induced constitutional gradients and the resulting surfacetension gradients lead to Marangoni effect. In return, this changed the evaporation behaviour,particularly the evaporative losses from the droplet edge region. These processes are depen-dent on the droplet shape and size.
For a better understanding of the evaporation of the sessile droplets from aqueous salinesolutions, future project should include the investigation with different salts having positiveand negative surface tension increments σ (Equation 2). It will be interesting to study a widerange of salts exhibiting positive σ such as NaCl in order to gain insight in the impact ofMarangoni flow on the evaporation behaviour. On the other hand, salts with a negative σ willinduce a Marangoni flow directed away from the three-phase contact line and may lead todifferent evaporation behaviours and salt distributions within the evaporating sessile droplet.
3.7 Towards a General Evaporation Behaviour of Sessile
Droplets of Aqueous Saline Solutions
In order to have a better understanding of the influence of the Marangoni flow on the evapo-ration behaviour of sessile droplets from aqueous saline solutions, we studied the evaporationof sessile droplets containing another salt solution having a positive surface tension incrementσ. Magnesium chloride solutions (MgCl2) were selected since the surface tension increment ofMgCl2 solutions is two times bigger than the one of NaCl solutions for a similar salt concen-tration range (i.e., from pure water to saturated salt solution of about 6M) at (20-25)C [44] (seeI.1.1).
The evaporation experiments were performed for different MgCl2 concentrations from 10−3
to 5.7M at a relative humidity of 0% with an initial droplet volume of 10 µl. Within the studiedrange of MgCl2 concentrations, the evaporation of sessile droplets from aqueous magnesium
60 3.7. Towards a General Evaporation Behaviour of Sessile Droplets of Aqueous Saline Solutions
chloride solutions complied for all significant aspects with the ones experimentally identifiedin the case of NaCl:
• the contact angle values: θ was about [2-10];
• the pinning regime: these salty sessile droplets evaporated in constant contact area mode;
• the subsequent evaporation behaviour: the droplet volume decreased linearly with time,particularly during the initial evaporation period (i.e., between t = 50 and 100 s); and,
• the deposit morphology as result of the evaporation process: as the initial MgCl2 concen-tration increased, it evolved from a salt-ring structure to an uniform pattern.
The final deposits of drying sessile droplets from aqueous magnesium chloride solutions arepresented in Figure 3.12. In comparison to Figure 3.2 illustrating the three different morpho-logical regimes of NaCl deposits, the main difference between these two salts resides in thecompositional structure of the dried salt pattern at (very) high salt concentration. As depictedin Figure 3.12, the evaporation of concentrated MgCl2 solutions does not induce a pronouncedsalt-ring at the droplet edge with some crystals in the droplet center as observed for saturatedNaCl solution (Figure 3.2) but causes a dense and uniform salt deposit over the complete foot-print droplet area. One of the first reasons that we can mention is the viscosity effect on flowduring the evaporation process. The dynamic viscosity η0 increases with increasing salt con-centration [119, 120]. At 20C, the dynamic viscosity of pure water is about 1.0 mPa.s [120].With saturated MgCl2 solution η0 increases by a factor of 7 [120] whereas with for NaCl sat-uration limit, only by a factor of less than 2 [119]. Therefore, the viscosity effect inside theevaporating sessile droplet becomes non negligible for aqueous magnesium chloride solutions.However, the observation of uniform patterns at higher c0 promotes qualitatively the occur-rence/influence of Marangoni flow within evaporating sessile droplets from aqueous salinesolutions.
Figure 3.12 – Morphologies of the final deposit obtained after complete drying of sessile droplets containing aqueousMgCl2 solutions at different initial salt concentrations from 10−3 to 5.7M. The evaporation experiments wereperformed at a relative humidity RH of 0% with 10 µl-sessile droplets.
We focused our experimental analysis on the evaporation rate of sessile droplets from mag-nesium chloride solutions. The normalized initial evaporation rate Qi (Equation 3.9) was ex-perimentally determined for each initial MgCl2 concentration. We still assumed for the de-termination of Qi that the distribution of salt within the sessile droplet was homogeneous(Equation 3.7). The droplet volume and the evaporation time was scaled according to Equa-tions 2.1, 3.3 and 3.4. For Equation 2.1, the scaling of the volume was based on the measure-ment/determination of the initial droplet volume V0. The time scaling according to Equation
Chapter 3. Evaporation of Sessile Droplets from Sodium Chloride Solutions 61
3.4 was based on the normalization of the relative vapour pressure and the droplet size factor r(Equation 3.3). The relative humidity RH of the surrounding environment was adjusted by theflow of moist nitrogen and also measured in the sample chamber as the temperature T. Thedroplet size factor r was determined from the measured droplet size and shape at t = 50 s. Thesaturated water vapour pressure in MgCl2 solutions was the literature value corresponding tothe initial MgCl2 concentration, c0 at T ≈ 23C [109].
Figure 3.13 presents the experimentally observed normalized evaporation rates Qi as func-tion of the initial salt concentration for two different salts having positive σ: NaCl and MgCl2.The dashed line depicts the theoretically expected normalized evaporation rate, scaled to avalue of 1 according to Equation 3.9.
I n i t i a l s a l t C o n c e n t r a t i o n c 0 [ M ]
N o P i n n i n g o ft h e c o n t a c t l i n e
Figure 3.13 – Experimentally observed normalized evaporation rates Qi as function of the initial salt concentrationc0 from 0 to 6.1M NaCl or from 10−3 to 5.7M MgCl2 at a relative humidity of 0%. The dashed line depicts thetheoretically expected normalized evaporation rate according to Equation 3.9 with the assumption of the (inweight)salt concentration distributed uniformly inside the droplet. The droplets evaporated in pinned, constant contact areamode except for NaCl concentrations ≤ 10−7M.
Up to a MgCl2 concentration of 0.7M, the measured normalized evaporation rates Qi agreedquite well with the theoretical predictions. Above this critical MgCl2 concentration, the mea-sured normalized evaporation rates Qi were smaller than expected. As for NaCl solutions, weobserved a deviation between the theoretical predictions and the experimental results for highinitial salt concentrations.
The origin of the discrepancy between theory and experiment is the non-uniform salt dis-tribution within the evaporating sessile droplet. Capillary flow originating from a non-uniformevaporative flux along the droplet surface induces a peripheral salt enrichment. This inhomo-geneous salt concentration inside the droplet results in surface tension gradients, leading to
62 3.7. Towards a General Evaporation Behaviour of Sessile Droplets of Aqueous Saline Solutions
Marangoni flows. Since the two studied salts have positive σ, the Marangoni flow is also di-rected in the same direction as the usual capillary (volume) flow, i.e., towards the three-phasecontact line. The resulting local enrichment of salt in the vicinity of the droplet periphery pro-vokes a decrease in Psat(c) and hence a diminution of the evaporation in the droplet edgeregion. Since the evaporative losses contribute significantly to the entire droplet evaporativelosses (in particular, at very small contact angles < 10), a change of the evaporation at thedroplet periphery alters the overall droplet evaporation behaviour.
Another remarkable result revealed in Figure 3.13 is the critical initial salt concentration, c∗0at which the experimental results start to deviate from the theoretical predictions. For sessiledroplets from NaCl solutions, c∗0 was about 0.5M whereas for MgCl2 solutions, it was about0.3M. This critical initial salt concentration corresponds to a surface tension difference betweenthe salt solution containing c∗0M, γ∗, and pure water, γ, ∆γ = γ∗−γ, of about 0.8 mN.m−1
at T ≈ 23C [44]. The surface tension difference ∆γ characterizes the Marangoni force. If ∆γ
≥ 0.8 mN.m−1, it induces a sufficiently strong Marangoni flow to influence the evaporationbehaviour of sessile droplets from aqueous saline solutions.
Furthermore the deviation between theory and experiment did not depend on the salt in-volved in the evaporating droplet except for the saturation limit. The discrepancy between theexperimental Qi and its excepted value was most pronounced for saturated MgCl2 solutionthan NaCl solution. This difference may come from the surface tension difference between thesaturated salt solution and pure water: ∆γ (5.7M MgCl2) ≈ 2 x ∆γ (6.1M NaCl) (Figure 1.2).
To conclude, this on-going investigation suggests a potential general evaporation behaviourfor sessile droplets from aqueous saline solutions. The evaporation experiments performedwith another salt exhibiting a higher surface tension increment aimed in particular at theinfluence of induced-surface tension forces on the evaporation behaviour. The observationsrevealed a critical surface tension difference, at which the evaporation behaviour is modifiedby Marangoni flow, which is induced by surface tension gradients originating from the localevaporative peripheral salt enrichment.
IIICorrosion of Iron under Sessile Droplets
from Chloride Solutions?
?Oral contribution containing main results of this PhD part has been presented as: Virginie Soulié, StefanKarpitschka, Florence Lequien, Philippe Prené, Damien Féron, Thomas Zemb, Helmuth Moehwald and Hans Riegler.Atmospheric Corrosion of Iron Induced by Sessile Droplets from Aqueous Saline Solutions. European Corrosion CongressEUROCORR, Graz, Austria, September 2015.
1Experimental Methods and
Equipment
1.1 Experimental Methods
General principle
In this thesis part the experimental purpose was the observation and investigation of the corro-sion phenomenon induced by a sessile droplet from chloride solutions deposited onto a planarmetal substrate. The main requirement on the corrosion experiment was to avoid significantevaporation/condensation of the droplet in the timescale of the set of experiments (typicallyless than few months) in order to barely change the bulk droplet composition. The latter wasachieved by fixing the environmental conditions of the gas surrounding the droplet (air). Atfixed temperature and for a given (fixed) relative humidity, called the equilibrium relative hu-midity RHeq, the droplet containing the aqueous saline solution was in dynamic equilibriumwith its vapour phase environment. There was a constant exchange of water (i.e., evaporationor condensation) between the solution droplet and the vapour phase.
Figure 1.1 shows a schematic illustration of the experimental principle for investigating thecorrosion phenomenon occurring under sessile droplets. The corrosion experiments were per-formed in a closed and airtight container (ThermoScientificTM NalgeneTM Acrylic DesiccatorCabinets) under controlled temperature T and relative humidity RH. The relative humiditywas adjusted with a reservoir of saturated salt solutions [111]. The nature and composition ofthe reservoir solution was dependent on the aqueous saline solution in the sessile droplet (seenext section for more detailed information). The reservoir was positioned in the upper place ofthe container (i.e., above the samples) in order to avoid convective flow effects on the equilib-rium behaviour of sessile droplets. The temperature was controlled using the environmentalconditions fixed in the air-conditioned room where the container was placed. Additionally thetemperature and the relative humidity were also directly monitored with a temperature andhumidity sensor (Rotronic Hygrolog, Switzerland) in the controlled environmental container.All the corrosion experiments were carried out at T = (20± 2)C.
The sessile droplet with an initial volume V0 of 10 µl was deposited onto the substrate witha syringe, and then the sample was transferred quickly and carefully into the environmentalchamber. The transfer had to be rapid in order to avoid evaporative losses from the depositedsessile droplet and also to minimize destabilization of the relative humidity inside the environ-mental chamber, particularly for high-humidity environment.
Although visible to the naked eye, the physical development of the initiation of the corro-sion process was best observed with the experimental setup used for evaporation experimentsand presented in the previous part (see II.1.1). The latter allowed a real-time observation of
67
68 1.2. Material and sample preparation
Figure 1.1 – Schematic illustration of the experimental method for investigating the corrosion phenomenon undersessile droplets. The corrosion experiments were performed in an environmental chamber under controlled tempera-ture T and relative humidity RH.
sessile droplets from the top and the side simultaneously. Time-lapse recording of the imagingallowed the entire process to be viewed in a shortened time period. Any gas flux was used toadjust the relative humidity and the temperature in the environmental chamber. RH was alsocontrolled with a reservoir of saturated salt solutions, placed in a beaker around the sample.T was the ambient temperature: T = (20± 2)C. The experimental method conducted either inthe environmental container or in the experimental evaporation setup showed both the sameconsistent and reproducible corrosion results.
Scanning electron microscopy with energy dispersive X-ray spectroscopy
Samples were analyzed ex-situ using a Leica Stereoscan 440 SEM (Scanning Electron Micro-scope) equipped with an EDS (Energy Dispersive X-ray Spectroscopy) analysis system. Sec-ondary electron images and X-ray analysis were obtained using a working distance of 6.5 mmand an accelerating voltage of 15 kV.
1.2 Material and sample preparation
Saline solutions and substrates
Four different chloride solutions have been chosen for the corrosion experiments: sodiumchloride NaCl (Sigma Aldrich), potassium chloride KCl (Sigma Aldrich), lithium chlorideLiCl (VWR Chemicals) and magnesium chloride MgCl2 (magnesium chloride hexahydrate,VWR Chemicals) solutions. Most experiments were performed with saturated salt solutions[108, 109, 121]. Additionally concentrated aqueous solutions of sodium chloride and magne-sium chloride were also used. The aqueous saline solutions were prepared with MilliporeTM
water (resistivity 18 MΩ.cm−1). The different chloride solutions were selected to cover a widerange of relative humidities, i.e., from 10.5 to 99% at T = 20C [109, 111, 116]. Furthermore thesurface tension of the different studied chloride solutions varied between 73.8 and 92.8 mN.m−1
at T = 20C (Table 1.1) [44]. The nature and composition of the reservoir solution used to con-trol the relative humidity in the environmental chamber was either the same as in the bulkdroplet or binary saturated aqueous solutions whose RH value was equivalent to the RHeq
value of the bulk solution droplet [111]. The different corresponding bulk droplet/reservoirsolutions used in this study are listed in Table 1.1.
The main uncertainty for the equilibrium relative humidity RHeq value came from fluctu-ations of temperature. Typical variations in temperature were 2C, resulting in fluctuations ofthe measured relative humidities value: RHeq ± 0.5%.
Chapter 1. Experimental Methods and Equipment 69
Table 1.1 – Surface tension γ and equilibrium relative humidity RHeq at T = 20C with the corresponding reservoirsolution for each studied droplet bulk solution.
As substrates served pieces of pure iron ARMCO Telar 57 (Fe = 99.85%). Pure iron stoodfor the ideal case of a metal substrate. All the samples were supplied from the same sheet ofiron by WEBER, France. They were cut into pieces of approximately 2 cm x 2 cm x 0.5 cm.Each iron sample was mechanically polished with a Stuers Abramin polishing machine withan applied force of 10 kN. The iron surfaces were abraded successively with 500 and 800 gridSiC paper, each for one minute, and then polished with 1200 and 2400 grid SiC paper, each fortwo minutes. Then, they were diamond polished down sequentially to 3 and 1 µm, each fortwo minutes, and finally 0.25 µm for four minutes. Prior to each polishing, the samples werecleaned with distilled water, and dried by blowing with compressed air in order to removepolishing impurities. The polishing of the iron surfaces was concluded by an ethanol rinse andsonication for 15 minutes. After polishing treatment, the iron substrates were dried by blowingwith nitrogen (purity 5.0) and stored in a vacuum desiccator with silica gel at room tempera-ture. The surface roughness was measured about less than 2 nm as determined by non-contactatomic force microscopy (experimental analysis done by Rodrigo Pérez-García, Max Planck In-stitute of Colloids and Interfaces, Potsdam).
Corrosion experiments were also conducted with pieces of single-sided polished siliconwafers with naturally oxidized surfaces. They were presented in the previous part (see II.1.2).In the present study silicon wafers were selected as substrate references because of their corro-sion resistance.
Cleaning procedure
To avoid/minimize contamination by dust or any remaining chemical product, a precise andconscientious cleaning was done for the substrates, the syringe/needle and also the vessel.The cleaning procedure for the silicon wafers, the syringe and the glassware were presented indetail in the previous part (see II.1.2).
All corrosion experiments were performed with freshly polished iron surfaces, i.e., storedno more than 48 hours in the vacuum desiccator after polishing. Before further usage, theiron substrates were ultrasonically cleaned with a mixed solution of ethanol (purity > 99.8%,Sigma Aldrich) and acetone (purity > 99.5%, Baker Analyzed) at a volume fraction of 1:1, for15 minutes. Then, they were dried in a flow of pure nitrogen and immediately used [26].
After exposure under sessile droplets from aqueous saline solutions, the iron surfaces werecovered with corrosion products and also unreacted and soluble salt. They were first removedby sonicating the iron samples in milli-q water for 1-3 minutes and then in ethanol for 15minutes [122, 123]. Sometimes few deposits remained on the iron surfaces. They were removedby cleaning the iron surfaces with a nylon brush and then the cleaning procedure was repeated.
70 1.3. Data analysis of corrosion experiments
The iron samples were dried by blowing with pure nitrogen and then, stored in a vacuumdesiccator.
1.3 Data analysis of corrosion experiments
In a typical corrosion experiment, the exposure effect of sessile droplets from aqueous salinesolutions on iron samples was quantitatively measured. Most relevant was the time evolutionof the weight loss of the iron substrates. The weight loss of the iron samples was derivedfrom the weigh difference before and after exposure measured using an analytical microbal-ance with a precision of 12.5 µg (Mettler Toledo), in an air-conditioned room (T = 20± 2C).Prior to weighing, the samples were stored in an air-conditioned balance room for two hoursin order to achieve a thermal equilibrium of the iron substrates.
The iron samples were weighed after polishing treatment and before cleaning with anethanol/acetone mixture. Their initial weight m0 was about 4.55 ± 0.10 g. Selected sampleswere weighted again immediately after polishing or after 48 hours-exposure in a vacuum des-iccator to assure that the contribution from reversible adsorbed water was insignificant. Thedifference in mass gain was less than 1% before and after exposure in the desiccator. Similarfluctuations were determined before and after cleaning of the iron substrates.
At the end of the corrosion experiment, after a time exposure t, the remaining liquid withinthe sessile droplet was sucked up into the syringe. Immediately after that the samples werestored in a desiccator for 24 hours, and then weighted and imaged with a camera. After com-pletion of the corrosion experiment, selected samples were dried in a flow of pure nitrogenin one direction only in order to verify that the presence of the observed structures was notinfluenced by the drying phase. Remaining liquid did not spread over the iron sample duringthe drying phase. Thereafter, the iron samples were cleaned to remove the "corrosion" productsand then further imaged and weighed to determine their final weight mF.
After a time exposure t to sessile salty droplets, the weight loss of the iron sample ∆m wascalculated from the measured weights m0 and mF:
∆m(t) = m0 −mF(t) (1.1)
All iron samples were exposed to sessile droplets of saline solutions for different time periodst: from 1 day to 1 month. The uncertainties of the weight loss of iron samples were determinedby the repeatability of the corrosion experiment for each exposure time period. For all aqueoussaline solutions and for each exposure time period, the corrosion experiments were repeatedabout three times, with consistent and reproducible results. Typical variations of the weightloss were smaller than 5%.
2Corrosion of Iron under Sodium
Chloride Sessile Droplet
In marine environment, chloride is the main stimulator of corrosion, since oceans provide asource of chlorine, mainly NaCl. A substantial amount of research on NaCl-induced corrosionhas been done by increasing the environmental relative humidity in order to "wet" the metalsurface [123–127]. The bulk phase transformation whereby a solid salt (particle) absorbs wa-ter to form an aqueous electrolyte, a process well-known as deliquescence, occurs when therelative humidity of the vapour gas phase of the environment is higher than the equilibrium(deliquescence) point of a salt. In atmospheric conditions, this critical humidity threshold de-lineates a surface sufficiently wet for considerable corrosion to take place from a relatively drysurface, for which corrosion is insignificant [128, 129].
However, regarding atmospheric corrosion, sessile droplets from sea salt (i.e., containing atypical realistic chloride level of about 0.5M) may be formed on metal surfaces. In the litera-ture, under-droplet corrosion experiments are always performed in constant low or high rel-ative humidity environment [20–25], but to the best of our knowledge, not at the equilibrium(deliquescence) relative humidity, where literally, the sessile droplet is in dynamic equilibriumwith its surrounding environment. This macroscopic equilibrium condition assumes the steadystate system encountered in the Evans droplet model [18] (see I.4.2).
In this chapter we investigated the corrosion phenomenon of a model metal substrate, i.e.,iron surface with a sea salt sessile droplet deposited and containing 0.5M NaCl. In the presentstudy, metal samples were subjected to isohumidity exposure, at the equilibrium relative hu-midity. The aim of this chapter was to apprehend the classical under-droplet corrosion model,well-known as Evans drop experiment [18]. Our experimental study revealed that refinementof the traditional understanding of the corrosion processes were necessary. In particular, ascenario was developed to interpret the localisation of the anodic and cathodic activities.
71
72 2.1. Observation of Deposits Outside of the Sessile Droplet
2.1 Observation of Deposits Outside of the Sessile Droplet
Iron samples, onto which aqueous sessile droplets from 0.5M NaCl solutions were deposited,were exposed to air with a relative humidity RH of 98% at T = 20C. Figure 2.1 shows a mi-croscopy image of a dried iron surface, on which a 0.5M NaCl sessile droplet was deposited,after 1 day of exposure to humid air with 98% RH. Immediately after the experiment, remain-ing liquid was removed from the iron sample, which was then dried in a vacuum desiccator inorder to stop the on-going corrosion process.
Figure 2.1 – Microscopy image of a dried iron surface, onto which an aqueous sessile droplet from 0.5M NaCl wasdeposited, after 1 day of exposure to air with a relative humidity RH of 98% at T = 20C. Two distinct regionson the iron substrate were identified: the footprint region of the initially deposited droplet (labelled area I) and thecircular peripheral region around the main droplet (labelled area II) as schematically illustrated at the bottom ofthe microscopy image. The three insets show SEM micrographs of three different locations on iron corroded under0.5M NaCl sessile droplets: A. in the main droplet center, B. at the main droplet edge, and C. at the main dropletperiphery. SEM analysis was carried out on dried iron surfaces after experiment and after removing of the productsformed.
Figure 2.1 shows two distinct regions on a typical iron surface corroded under aqueoussessile droplets from 0.5M NaCl: the droplet footprint region and a peripheral region aroundthe main droplet. The morphological spatial distribution over the iron surface is schematicallyillustrated in Figure 2.1. Area I almost depicts the footprint region of the main droplet initiallydeposited onto the iron substrate. Its diameter is about 6 mm. The primary droplet area ap-pears yellowish/dark brown after 1 day of exposure to humid air with 98% RH, indicating theformation of rust phases through the corrosion process [18, 102, 127]. Area II is the peripheralregion around the initially deposited main droplet. The formation of this area outside of themain droplet is closely related to the occurrence of corrosion induced by sessile salty droplets.The peripheral region formed around the primary droplet appears as a circular ring of whiteprecipitates, over a distance of about 5.4 ± 0.8 mm from the edge of the main droplet. The
Chapter 2. Corrosion of Iron under Sodium Chloride Sessile Droplet 73
drying phase of the iron substrate after the corrosion experiment, either occurring in a vac-uum desiccator or in a flow of pure nitrogen, caused the peripheral region to precipitate intoislands. Within one day, the width of the peripheral region (i.e., the distance from the dropletedge region to the perimeter of the peripheral region) achieved a value of 2 times that of theradius of the original droplet.
Morphological analysis of the products formed on iron under aqueous sessile droplets from0.5M NaCl was carried out through SEM for the different observed areas. The three insets inFigure 2.1 show the resultant morphologies, after 1 day of exposure, before and after cleaningof the different products formed, at three different locations on the iron surface: in the maindroplet center (Figure 2.1. A), at the main droplet edge (Figure 2.1. B) and at the main dropletperiphery (Figure 2.1. C). In the central area of the main droplet, we observe a prolific flowery-like structure as presented in Figure 2.1. A. This is the characteristic pattern of lepidocrocite[130, 131], an iron hydroxide originating from the reaction between the ferrous ions and thedissolved oxygen [127, 132, 133]. After cleaning of the corrosion products, SEM analysis showsnumerous pits (i.e., small holes in the iron surface) with a diameter of few microns over thedroplet center region (Figure 2.1. A). At the inner edge of the main droplet, similar morpholo-gies on a dried iron surface after the experiment and cleaning are observed as depicted inFigure 2.1. B. A ring of ferrous hydroxide, most likely lepidocrocite, was formed at the dropletedge. The cleaning of this corrosion ring revealed also the presence of few pits in the ironsurface, but only under the initially deposited sessile droplet. The edge of the footprint dropletarea on the cleaned iron surface is depicted in Figure 2.1. B with a dotted line. At the vicinity ofthe droplet outer edge, the observed morphology is different. SEM analysis shows needle-likespecies over the entire peripheral droplet region as illustrated in Figure 2.1. C. After cleaning,any pits were observed in this iron surface region.
Sessile droplets from 0.5M NaCl solutions deposited onto iron surfaces induced pittingcorrosion of the metal over the entire footprint of the initially deposited droplet. Two dif-ferent corrosion products have been identified on the iron surface corroded under aqueoussessile droplets from 0.5M NaCl. The main product identified in the droplet region was ironhydroxide, most likely lepidocrocite. In the peripheral region of the primary droplet, the ma-jor identified compound presented a different structure. This observation may indicate somecompositional differences between the droplet area and the peripheral region.
2.2 Composition of the Peripheral Part of the Sessile Droplet
The compositional spatial distribution over the dried iron surface corroded under aqueous ses-sile droplets from 0.5M NaCl, after 1 day of exposure to humid air with 98% RH at T = 20Cwas investigated using SEM/EDS. Figure 2.2 illustrates the distribution of four different ele-ments: iron, oxygen, chloride and sodium on a selective surface area showing the droplet edgeregion (on the left) and some peripheral deposits around the main droplet (on the right). Thebackscatter secondary electron image was included to allow direct comparison and to associateelement distribution with the different compounds identified in the pattern as explained in theprevious section.
The elemental map of iron shown in Figure 2.2.a indicates that this element extends overthe entire selective surface area: in the droplet area, in the peripheral deposits and of course,on the unaffected and "naked" iron surface. As presented in Figure 2.2.b, the regions whereoxygen element is concentrated are preferentially the main droplet but also in the peripheralspecies. The spatial distribution of chloride and sodium elements, respectively depicted in 2.2.c
74 2.3. Temporal Evolution of the Peripheral Droplet Region
Figure 2.2 – Identification of chemical composition over a dried iron surface obtained after 1 day of exposure toaqueous sessile droplets from 0.5M NaCl, in humidified air with 98% RH at T = 20C. Elemental mapping resultsusing SEM/EDS on a selective surface area showing the droplet edge region (on the left) and some peripheral depositsaround the main droplet (on the right) corresponding to the distribution of: a. iron (in grey), b. oxygen (in red),c. chloride (in blue) and d. sodium (in green), associated with the different compounds in the pattern, with thebackscatter secondary electron image included.
and 2.2.d, is the most obvious and interesting features of the corrosion phenomenon inducedby sessile droplets from 0.5M NaCl. The chloride element is only concentrated in the initiallydeposited droplet. On contrary the sodium element is detected not only at the droplet edge re-gion but also in the peripheral deposits. Therefore oxygen element is predominantly combinedwith sodium in the peripheral deposits whereas with chloride in the main droplet area, whileiron, which is the chemical element of the substrate, may be combined with these elements.Thus SEM/EDS analysis is in accordance with the main droplet area mainly composed of fer-rous hydroxide resulting from the reaction of ferrous ions with dissolved oxygen. It also revealsthat chloride element is mainly distributed in the primary droplet area, which is immediatelysurrounding by concentrated sodium element regions. As a result sodium element which wasinitially only concentrated in the main deposited droplet, migrated from its edge region.
Based on the morphological and compositional spatial distribution of the different iden-tified compounds on the corroded iron surface, it was reasonable to assume the occurrenceof a film, with a considerable thickness to support the cation migration, emanating from thethree-phase contact line of the main droplet. After one day of exposure, the peripheral regionsurrounding the initially deposited droplet had covered a large area (estimated to about twotimes the droplet radius from Figure 2.1). Slivers of pH indicator paper were used to estimatepH value of the solution within this peripheral droplet region and also in the main droplet. Inthe peripheral droplet area, they changed in color to blue (i.e., pH of about 10), indicating analkaline environment whereas for the primary droplet solution, they turned into red (i.e., pHof about 3-4), revealing an acidified solution. Initially the aqueous saline solution containing inthe sessile droplet had a pH of about 6.
2.3 Temporal Evolution of the Peripheral Droplet Region
The initial development of the peripheral droplet region was investigated by observing thetemporal evolution of the top aspect of the iron surface onto which a sessile droplet from aque-ous saline solution was deposited. The detailed experimental procedure was described in theprevious chapter (see III.4.1). Figure 2.3 shows the initiation of the corrosion process inducedwith a sessile droplet from 0.5M NaCl, in humid air with 98% RH at T = 20C. To better reveal
Chapter 2. Corrosion of Iron under Sodium Chloride Sessile Droplet 75
the formation and growth of the peripheral droplet region, the iron substrate background im-age (obtained before starting the corrosion experiment) was subtracted from the observed topaspect imaging. In addition the image contrast was specifically focused on this peripheral area.Originally bright, the main droplet appears from now dark. The corrosion product formation,which appeared within the sessile droplet as dark dots or areas, was deliberately not shown inFigure 2.3.
Figure 2.3 – Initiation of the corrosion process induced with a sessile droplet from 0.5M NaCl (with an initialvolume of 10 µl and contact angle of 17), in humidified air with 98% RH at T = 20C. For better contrast theiron substrate background image was subtracted and the focus was done on the peripheral region with the maindroplet appearing in dark. The sequence of frames shows a time span of 3 hours starting 1 minute after the dropletdeposition. The main part of the images depicts a top view of the iron surface onto which the sessile droplet wasdeposited. The inset magnifies the same area at the droplet edge/periphery region.
Figure 2.3 presents a sequence of four frames showing a time span of 3 hours. It wasrecorded 1 minute after droplet deposition, i.e., long after the droplet had initially spread toits final perimeter and the three-contact line was pinned in this position. The main part of eachimage displays the top aspect of the iron surface onto which the sessile droplet with an initialvolume of 10 µl and contact angle of 17 was deposited. The dashed line indicates the positionof the perimeter of the observed peripheral droplet region. As indicated, the inset in each ofthe four frames magnifies the same area at the droplet edge/periphery region.
Figure 2.3 reveals the formation and growth of a film radiating outwards from the edgeof the initially deposited droplet. The position of the main droplet does not change over thecorrosion process, i.e., there is no macroscopic contact line motion of the initially pinned sessiledroplet on the iron substrate. Few minutes after the sessile droplet was deposited, we observethe formation of a halo in the vicinity of the main droplet edge. The aspect of the film becomesmore precise in the course of the corrosion experiment. Micro-pools with an approximatelyhemispherical shape appear initially nearby the edge of the primary droplet and then over theentire peripheral film. They seem to grow up with time. Additionally the covered area of theperipheral film emanating from the main droplet edge region increases with time. The top viewimages depicted in Figure 2.3 (and also the optical image presented in Figure 2.1) reveal thatthe peripheral droplet region is reasonably circular in shape. The symmetry of the peripheralarea on both sides of the main droplet is not always achieved, resulting in fluctuations of itsmeasured front position smaller than 15%. Thus an averaged peripheral film width (i.e., thedistance from the droplet edge region to the perimeter of the peripheral region) is measured.After three hours of exposure, the width of the peripheral film is about 2± 0.3 mm.
Figure 2.4 shows the evolution of the width of the peripheral film as a function of thesquare root of the experimental time. The expanding perimeter of the film was determinedfor all corrosion experiments conducted either in the environmental container (Figure 2.1) or
76 2.3. Temporal Evolution of the Peripheral Droplet Region
in the experimental evaporation setup (Figure 2.3). This allowed to acquire data on the radialdisplacement of the peripheral droplet region on short- and long-time period. For the corro-sion experiments conducted in the experimental setup, the film width was determined fromthe top view imaging of the iron surface each hour over a time period of 12 hours. On contraryfor the corrosion experiments conducted in the environmental container, the film width wasdeduced from the front position of the peripheral deposits area, observed after drying of theiron sample. The perimeter of the peripheral droplet region was measured using a microscopyimage of the dried iron sample, obtained with a camera and SEM micrographs. The width ofthe peripheral film was measured over a time period of 2 days.
0 1 0 0 2 0 0 3 0 0 4 0 0 5 0 00
2
4
6
8
1 0E x p e r i m e n t s c o n d u c t e d i n :
E n v i r o n m e n t a l c h a m b e r E n v i r o n m e n t a l c o n t a i n e r
Width
of th
e peri
phera
l film
W [m
m]
T i m e t 1 / 2 [ s 1 / 2 ]Figure 2.4 – Evolution of the peripheral film width W (i.e., the distance from the droplet edge to the perimeterof the peripheral region) as function of the square root of the experimental time t. The corrosion experiments wereperformed with a sessile droplet from 0.5M NaCl deposited onto an iron substrate, in humidified air with 98% RHat T = 20C. The radial displacement of the peripheral droplet region was measured for all corrosion experimentseither conducted in an environmental container or a chamber in the experimental evaporation setup. The linearincrease of the film width with the square root of time reveals a "diffusive" phenomenon.
As shown in Figure 2.4, the averaged peripheral film width measured from both corro-sion experiments increases in proportion to the square root of time. Thus, the width of theperipheral region increased "diffusively". We can introduce a simple equation describing thecharacteristic diffusion length scale1 of the peripheral film width W as function of time t:
W(t) =√
Dp t (2.1)
with√
Dp as the slope of the curve W-versus-t1/2. Dp has the physical dimension of a dif-fusion coefficient and will be defined as a growth diffusion coefficient. For an iron surfacecorroded under an aqueous sessile droplet containing 0.5M NaCl in humid air with 98% RHat T = 20C, the growth diffusion coefficient Dp of the solution within the peripheral film inair was about 2.3± 0.2 x 10⁻¹⁰ m2.s−1.
1The dimensionality d of the characteristic length scale for diffusion is sometimes included where a coefficient of√d is added. In the present case, Equation 2.1 is reduced to one direction.
Chapter 2. Corrosion of Iron under Sodium Chloride Sessile Droplet 77
Since the cations are considered to migrate through the peripheral film from the dropletedge region, the thickness of the film can be estimated to be in order of the micron scale. Ifsuch a thick film is illuminated with monochromatic light falling on it normally, concentricbright and dark circular fringes are formed due to the constructive and destructive interfer-ences of light reflected from the upper and lower surfaces of the film [134–136]. Newton’srings experiments can be performed with the experimental evaporation setup by focusing theobservation on a selective area covering the droplet edge and its close vicinity. The experimen-tal evaporation setup illuminates this selective area with a monochromatic and parallel lightsource (with a wavelength λ of about 550 nm) as described in the previous part (see II.1 formore detailed information). Figure 2.5 shows a Newton interference pattern observed on amicro-pool located nearby the edge of a sessile droplet from 0.5M NaCl deposited onto an ironsubstrate, after 3 hours in humid air with 98% RH.
Figure 2.5 – Newton interference pattern observed on a micro-pool located nearby the edge of a sessile droplet from0.5M NaCl deposited onto an iron substrate, after 3 hours in humid air with 98% RH at T = 20C. The insetmagnifies the selective area covering the droplet edge and its vicinity, on which Newton’s rings experiments wereperformed with the experimental evaporation setup.
Knowing the exact number n of destructive interferences (i.e., the number of dark fringes),the thickness of the film t, illuminates with a parallel beam of light with a wavelength λ, isgiven by [136]:
2 t +λ
2= (2 n + 1)
λ
2(2.2)
The number of dark fringes n observed in Figure 2.5 is estimated at 6-7. Using Equation 2.2 wefound a thickness value for the micro-pool region of about 1.5-2 µm. Most likely, the thicknessof the peripheral film may be estimated to be less than 2 microns, with the exception of regionswhich have formed micro-pools.
In order to have a better understanding on the main ingredients causing the observationof the peripheral droplet region, the influence of two main physico-chemical factors was stud-ied: the nature of the ambient environment surrounding the sessile droplet and the nature ofthe substrate. In humidified high-purity nitrogen environment with 98% RH at T = 20C, theobservation of a peripheral droplet region did not occur, if an aqueous sessile droplet contain-ing 0.5M NaCl was deposited onto an iron substrate. Otherwise, any corrosion was observedin these experimental conditions. Similar results were obtained, if the sessile droplet was de-posited onto a silicon wafer in humidified air. It is also interesting to notice that the sessiledroplet deposited either onto silicon wafers or iron substrates was kept for months withoutevaporating or condensing in this high-humidity environment. As a result, the occurrence of
78 2.4. Discussion
the peripheral droplet region was sensitive to the air environment surrounding the sessiledroplet and also to the corrosion resistivity of the substrate.
2.4 Discussion
Here we investigated the corrosion phenomenon of planar iron under aqueous sessile dropletscontaining 0.5M NaCl. The sessile droplets were in dynamic equilibrium with their surround-ing air environment. The contact of a macroscopic and stationary aqueous electrolyte dropletwith a metal surface creates a localized electrochemical cell known as "Evans droplet"2 [18]. Inthe classical Evans droplet model, the oxygen O2 reduction, which results in the productionof hydroxyl ions OH−, occurs mainly at the droplet edge at the substrate-solution interface,because the diffusion path of oxygen from the environmental vapour phase to the substrate-solution is shortest at the contact line region. Thus a cathode is formed at the perimeter of thedroplet as depicted in Figure 2.6.a.
O2(dis) + 4 e− + 2 H2O→ 4 OH−(aq) (2.3)
The corresponding anode is established at the substrate-solution interface where oxygen isdeficient (i.e., away from the contact line). There ferrous ions Fe2+ generated from the metalare released into the droplet solution. This reaction forms pits in the iron surface somewhereclose(r) to the droplet center as illustrated in Figure 2.6.a. via:
Fe(s) → Fe2+(aq) + 2 e− (2.4)
Classically, the anodic and cathodic products will interact with the electrolyte solution to givefor instance, ferrous chloride, FeCl2, which will generally precipitate into the pit solution[102, 127] and also together to form a ring of rust in an intermediate zone located betweenthe perimeter and the center of the sessile droplet [18, 19]. The ring rust comes from the oxida-tion of the initially formed ferrous hydroxide3 Fe(OH)2 [102, 103] or arises from the reactionbetween the dissolved oxygen and the ferrous ions, leading to the formation of lepidocrociteγ-FeOOH:
2 Fe2+(aq) +
12
O2(dis) + 3 H2O→ 2 γ-FeOOH(s) + 4 H+(aq) (2.5)
In both cases, the rust formation induces an acidification of the surrounding solution, i.e., inthe droplet center. On contrary the oxygen reduction causes high pH values at the dropletperimeter.
Figure 2.1 supports the general mechanism involved in the Evans droplet model, since for-mation of rust, preferably lepidocrocite, at the substrate-solution interface and pits in the ironsurface occurs in the droplet center, but not exclusively. They are widespread across the entiresurface covered by the main droplet as depicted in Figure 2.1. Besides an unexpected periph-eral film radiating outwards the initially deposited droplet is observed as illustrated in Figures2.1 and 2.3. These different observations foreshadow that the Evans droplet model does notdescribe entirely/exactly the observed corrosion phenomenon induced under an aqueous ses-
2The Evans droplet model describes an iron surface corroded under a sessile droplet containing a jelly electrolytesolution, a mixture of agar-agar and sodium chloride solution in order to demonstrate the electro-chemical mechanismof aqueous corrosion and particularly the natural distribution of anodic and cathodic reactions within the sessiledroplet [18, 103] (see I.4.2).
3Nonstable in oxygenated aqueous media, the ferrous hydroxide Fe(OH)2, originating from the reaction betweenthe ferrous ions Fe2+ and the hydroxyl ions OH−, further reacted to form other iron oxides or oxy-hydroxides such aslepidocrocite.
Chapter 2. Corrosion of Iron under Sodium Chloride Sessile Droplet 79
sile droplet from 0.5M NaCl, deposited onto an iron surface. Our experimental observationsaroused considerable interest on the main reasons for why the peripheral film was formed andby what mechanisms it evolved.
The microscopically film ahead of the macroscopic contact line as schematically shown inthe inset of Figure 2.6.a appeared to be initiated by the corrosion phenomenon itself and moreprecisely by the localised cathodic reaction occurring at the droplet perimeter. A corrosion-resistant substrate (silicon wafer) or a free oxygen (high-purity nitrogen) environment sur-rounding the deposited droplet on the iron surface prevented the observation of a peripheralfilm nearby the droplet edge. Most likely the peripheral film was emanating from the three-phase contact line region of the main droplet. But its thickness, estimated to less than 2 microns(Figure 2.5), was rather thick to explain its origin from a "classical" molecularly (nanometer)thin precursor film [36] (see I.1.1) or from adsorbed water layers on the iron surface (for arelative humidity of 98%, the water layer thickness is about 1.7 nm) [94, 95] (see I.4.1).
The origin of the peripheral film was the three-phase contact line. At the droplet edge,hydroxide ions were generated by oxygen reduction. This created a highly localised alkalineenvironment in this droplet perimeter region. As a consequence, cations migrated towardsthe droplet edge to maintain electroneutrality. This cation displacement towards the dropletcontact line provoked changes in the ionic composition of the liquid in this region. Thus inthe three-phase contact line region, there were surface tension changes along the peripheraldroplet surface, which led to a Marangoni flow [76]. The three-phase contact line was desta-bilized by surface tension gradients, induced by ionic composition changes during the courseof the cathodic reaction and migration of cations towards the droplet perimeter. Most unlikely,the surface tension gradients may arise from a pH gradient within the entire droplet. Someauthors [137] considered that the surface tension of water is independent of the pH of the solu-tion. Thus, we can consider that for water-based solution such as aqueous saline solution, thepH of the solution does not impact the surface tension of the salt solution.
Figure 2.3 and Figure 2.4 demonstrate that once the peripheral film was formed (i.e., it wasobserved few seconds after the sessile droplet was deposited onto iron substrate), its widthwas expanding "diffusively" with time. At the peripheral part of the sessile droplet (either thedroplet edge or the resulting peripheral film), extensive oxygen reduction occurred since thediffusion path length of oxygen from the environmental vapour phase to the substrate/solutionwas more and more shortest along this peripheral region. This led to a highly localised alka-line peripheral film, mainly composed of hydroxyl ions resulting from the preferential oxygenreduction in this droplet area. As a consequence, the cathodic activity of the electrochemicalcell was developed along this peripheral film emanating from the three-phase contact line ofthe main droplet (Figure 2.6.b). On contrary, the corresponding anode was established andlimited at the interface of the initially deposited sessile droplet with the iron substrate. It couldbe added that the rust formation led to the generation of protons (Equation 2.5) and as a con-sequence, anions like chlorides migrated towards the anodic area. The localization of the an-odic and cathodic activities across the substrate-solution interface was confirmed by pH valuechanges of the initially deposited solution. The observed corrosion products and pits underthe main droplet as shown in Figure 2.1 were consistent with the anode/cathode separation atthe droplet edge, with anodic attack of the iron surface at the primary droplet supported bycathodic regions at the peripheral part of the droplet.
In order to balance the negative electrical charges concentrated in the cathodic peripheralfilm, the cations mainly the sodium ions4 originating from the sessile droplet solution, mi-
4In highly alkaline environment, the solubility of ferrous Fe2+ or ferric ions Fe3+ is too low (smaller than 10−6M)[138] to allow the migration of these ions towards the highly alkaline peripheral film.
80 2.4. Discussion
Figure 2.6 – a. The classic Evans droplet model under an electrolyte droplet: the oxygen is reduced at the dropletedge, acting as the cathode whereas the iron dissolution occurs in the droplet center acting as the correspondinganode. The inset shows the occurrence of a microscopically film ahead of the macroscopic contact line. b. Expansionof the alkaline thick film by sodium ion displacement compensating the electroneutrality within the droplet and watermovement induced by a concentration gradient for a sessile droplet of aqueous NaCl solution deposited onto an ironsurface.
grated towards the peripheral film (Figure2.6.b). This selective ion distribution resulting fromthe large-scale anode/cathode separation was confirmed by SEM/EDS analysis performed ona dried iron sample as depicted in Figure 2.2. Most chlorides are found in the footprint area ofthe main droplet, which contained the iron corrosion products. The cations, on the other hand,are concentrated around the droplet, at the peripheral film (cathode) area.
As a result, a concentrated cation-hydroxyl solution was formed in the peripheral film (cath-ode) region. Therefore there was a concentration gradient between the peripheral film and thedroplet bulk. This caused a water movement from the droplet bulk towards its edge (Figure2.6.b). This water displacement originating from a concentration gradient may arise from asolutal Marangoni effect along the droplet surface [76]. Finally, since oxygen reduction prefer-entially occurred at the peripheral part of the droplet, the expansion of the peripheral film wascontrolled by the cation displacement and water movement through it as illustrated in Figure2.6.b.
During the development of the peripheral film localised micro-pools, or regions of the film,which were slightly thicker than other ones (Figures 2.3 and 2.5), were observed. The observa-tion of these micro-pools on a metal substrate was not unexpected and has been observed be-fore. Numerous studies [22, 28, 124–126, 135, 139, 140] report the formation of "micro-droplets"around the edge of the main droplet formed by deliquescence of salt particles deposited ontometals in humid atmosphere, i.e., above a relative humidity of 80%. This additional wetting ofthe metal surface around the edge of the electrolyte droplet, called "secondary spreading" was
Chapter 2. Corrosion of Iron under Sodium Chloride Sessile Droplet 81
firstly reported by Neufeld et al.[124] who studied the deliquescence of NaCl particles on zinc.However, why these micro-droplets are formed and grow with time is not obvious. One groupof researchers suggest that the formation of the secondary spreading [124–126, 135, 139, 140]is the result of moisture absorption from the surrounding environment, while other groupsassociate this phenomenon with formation of particulate gel formed at the edge of the maindroplet, which may lead to the formation of a membrane-like barrier that allowed pH gradientsto be established between the central droplet and the secondary spread area [22, 28]. Thus theoccurrence of localised thicker micro-pools along the peripheral film remains an open issue.We propose the following scenario controlling the micro-droplets process: in the course of theperipheral film formation, reservoirs of cations are formed locally. Due to the high-humidityenvironment surrounding the droplet, the latter adsorb water and form water clusters. Theobserved peripheral deposits in the shape of "islands" may arise from these micro-pools afterdrying of the exposed iron sample (Figures 2.1 and 2.2). To better elucidate the role of the en-vironmental relative humidity, the formation of these water clusters during the peripheral filmdevelopment deserves more detailed investigation. It will be interesting to measure the widthof the peripheral film, or more precisely the thickness of a water cluster over the experimentaltime. To gain insight into the environmental effect, this study should be widened at differentrelative humidities (by changing the salt solution inside the droplet bulk to consider the macro-scopic equilibrium system) to include information on the impact of RH on the peripheral filmformation and particularly on its thickness.
To conclude we demonstrated in this chapter an extension of the classical Evans droplet sce-nario describing the contact of a macroscopic and stationary aqueous electrolyte droplet (i.e.,the droplet was in equilibrium with its environment) with a metal surface. We found that thecathodic site was established along a peripheral film emanating from the three-phase contactline of the initially deposited sessile droplet. Its expansion was related to the cathodic reactionand the cation displacement from the droplet bulk through it.
3Influence of Chloride
Concentration and Droplet Size
Effect on Corrosion of Iron
under Sessile Droplets from
Aqueous Saline Solutions
In the previous chapter considerable attention has been paid to the corrosion process whichtook place, when sea salt sessile droplets (i.e., containing 0.5M NaCl) were deposited onto ironsurfaces.
In this chapter we expanded the study of the under-droplet corrosion experiments on ironsurfaces to different aqueous saline solutions. The bulk solution within the initially depositedsessile droplet consisted of various aqueous chloride electrolytes of different counter-cations(sodium NaCl, potassium KCl, lithium LiCl and magnesium MgCl2) with an initial chlorideconcentration c0 ranging from 0.5 to 11.4M and equilibrium relative humidities RHeq between10.5 and 99% (Table 1.1). The aim of this chapter was to analyze quantitatively the under-droplet corrosion process and in particular, the peripheral film phenomenon. Our experimentalstudy revealed the main influence of certain parameters on the peripheral film formation.
83
84 3.1. Towards a General Peripheral Film Phenomenon
3.1 Towards a General Peripheral Film Phenomenon
Iron samples, onto which sessile droplets from aqueous saline solutions were deposited, wereexposed to isohumid air environment at T = 20± 2C. Experiments were performed with dif-ferent chloride-based salts (NaCl, KCl, LiCl and MgCl2) and for a wide range of initial chlorideconcentration c0, i.e., from 0.5 to 11.7M. As explained in the experimental procedure (see II.4.2),the imposed relative humidity in the surrounding air environment, in which under-droplet cor-rosion experiments were conducted, was dependent on the bulk solution droplet in order toachieve a dynamic equilibrium of the sessile droplet with its atmosphere and therefore avoidsignificant evaporation/condensation. As a consequence, the iron samples were exposed to airwith different relative humidities RHs ranging from 10.5 to 99% as function of the nature andcomposition of the sessile droplet solution. Figure 3.1 shows microscopy images of dried ironsurfaces, on which sessile droplets from 4.6M KCl, 6.1M NaCl, 10.5M LiCl and 5.7M MgCl2were deposited, after 1 day of exposure to humid air with 85.1%, 75.4%, 33% and 10.5%, re-spectively.
Figure 3.1 – Microscopy images of a dried iron surface, onto which an aqueous sessile droplet, initially containinga chloride concentration c0, from 4.6M KCl, 6.1M NaCl, 10.5M LiCl and 5.7M MgCl2 (from the left to the right)was deposited with an initial volume of 10µl, after 1 day of exposure to air with a relative humidity RH of 85.1%,75.4%, 33% and 10.5%, respectively at T = 20C. The insets in all four images show SEM micrographs of thedroplet edge/peripheral region.
Figure 3.1 shows two distinct regions on an iron surface corroded under sessile dropletsfrom chloride solutions: the droplet footprint area and its peripheral region. These two charac-teristic areas were typically observed on an iron surface corroded under sea salt sessile dropletsas depicted in Figure 2.1. The initially deposited droplet area appears yellowish/dark brown,indicating the formation of rust phases through the corrosion process. In the main microscopyimages shown in Figure 3.1, the peripheral droplet region appears as a circular white ringaround the reddish primary droplet 1. Figure 3.1 reveals that after 1 day of exposure, the widthof the peripheral region (i.e., the distance from the droplet edge region to the perimeter of the
1Since the iron samples were imaged with the same magnification on the camera the peripheral region formed onan iron surface under a 5.7M MgCl2 sessile droplet did not appear clearly on the microscopy image.
Chapter 3. Influence of Chloride Concentration and Droplet Size Effect 85
peripheral region) decreases as the initial chloride concentration c0 within the sessile dropletincreases.
A morphological SEM analysis was carried out on the different iron samples presented inFigure 3.1. It revealed the formation of lepidocrocite across the entire droplet area and a cor-roded (pitted) iron surface under the main droplet, as observed and described in the previouschapter. The acidic environment induced by the ferrous hydroxide formation (originating fromthe reaction between the ferrous and hydroxyl ions) promoted pit initiation and growth in thedroplet region, resulting in the large (droplet) surface area of the anodic attack. The inset ofeach dried iron image in Figure 3.1 shows the resulting morphologies of the peripheral depositsformed in the vicinity of the droplet edge region, after 1 day of exposure and drying of theiron surface. Depending on the chloride cation type, the peripheral deposits present differentstructures. This structural diversity arose from the characteristic composition of the peripheralregion, mainly composed of iron, oxygen and cation (either potassium or sodium or lithium ormagnesium) as illustrated in Figure 2.2.
As a result, irrespective of the type and composition of the chloride solution within thesessile droplet, the corrosion process which took place when a sessile droplet was depositedonto an iron surface, provoked the formation of a peripheral film. For each studied chloridesolution, the temporal evolution of the peripheral film was also investigated with confidenceover a maximum exposure time period of eight days 2. Figure 3.2.a shows the evolution of theaveraged peripheral film width W as a function of the square root of the experimental timet. As explained in the previous chapter (see III.5.3), the radial displacement of the peripheraldroplet region on long-time (day) period was deduced from the circular front position of theperipheral deposits area, observed after drying of the iron sample (Figure 3.1). For shortest timeperiod, i.e., t < 12 hours, the peripheral film width was determined from the top view imaging,observed, when the corrosion experiment was performed in the environmental chamber in theexperimental evaporation setup. The determination of W from both corrosion experiments (ei-ther conducted in the environmental chamber or container) showed consistent results betweenthe two experimental methods.
Over the corrosion process, the peripheral film width W increases linearly with the squareroot of the experimental time t, as depicted by the dotted lines in Figure 3.2.a. This linear in-crease is observed for each formed peripheral film, immediately obtained after deposition ofthe sessile droplet from different aqueous chloride solutions onto iron substrates. Figure 3.2.areveals a "diffusive" increase of the peripheral film width, irrespective of the type and composi-tion of the chloride solution within the deposited sessile droplet. It also confirms, that at a giventime, the peripheral film perimeter increases, as c0 within the main droplet decreases. UsingEquation 2.1 a growth diffusion coefficient Dp of the solution within the peripheral film (i.e.,the square of the slope of the W-versus-t1/2 curve, presented in Figure 3.2.a) was determinedfor each initial concentration of cation of the chloride solution droplet as illustrated in Figure3.2.b. Since we demonstrate in the previous chapter that cations migrate towards the dropletperiphery, Dp stands for the diffusion coefficient of cation in the peripheral film. Figure 3.2.bshows that Dp decreases with increasing the salt concentration (e.g., NaCl) but also decreases,if the valence of the cation increases for a given cation concentration (e.g., at 3M). These ob-served trends for the diffusion coefficient are in accordance with the literature [141, 142]. In ageneral way the diffusion coefficient is slightly affected by the nature (i.e, the size, the charge)of the ion and also by the nature and composition of the electrolyte solution [142]. The relativesensitivity of the diffusion coefficient with the cation suggest that there is no major influence
2Since the iron sample was 2 cm and the droplet diameter was about less than 6 mm, the droplet peripheral regionwas determined with accuracy when the latter did not exceed 7 mm.
86 3.1. Towards a General Peripheral Film Phenomenon
Figure 3.2 – a. Evolution of the peripheral film width W (i.e., the distance from the droplet edge to the perimeterof the peripheral region) as function of the square root of the experimental time t. The corrosion experiments wereperformed with a sessile droplet from chloride solution deposited onto an iron surface, in humidified air with RHeqat T = 20C. The radial displacement of the peripheral droplet region was measured for a short-time period (t < 12hours) and long-time period (t > 1 day) from corrosion experiments, respectively, conducted in the environmentalchamber or container. The linear increase of the film width with the square root of time depicted with a dottedline reveals a "diffusive" phenomenon. b. The growth diffusion coefficient Dp of the (cation) solution within theperipheral film, corresponding to the square of the W-versus-t1/2 slope curve (Equation 2.1) as function of theinitial cation concentration within the initially deposited sessile droplet onto iron surface.
of the cation itself. However, the measured values for Dp are much (about 10-100 times) lowerthan the diffusion coefficient of the cation in water or in salt solution. Just to give an order ofmagnitude, in comparison, for 0.5M NaCl solutions, the self-diffusion coefficient of sodium ionD in the same concentrated sodium chloride solution at T = 20C is about 1.4 x 10⁻⁹ m2.s−1)[141].
Our experimental results shows that, when a sessile droplet from aqueous chloride solu-tion was deposited onto an iron surface, a "diffusive" peripheral film emanated from the dropletedge region, at the three-phase contact line. The most obvious and interesting feature of thisgeneral peripheral film phenomenon was the change of its width, at a given time, dependingon the nature and composition of the chloride solution within the initially deposited sessiledroplet. Different parameters may explain the origin of this observed discrepancy:
• the relative humidity RH in the surrounding air environment in which the under-dropletcorrosion experiment was performed. Its value varied from 10.5 to 99%;
• the salt solution itself: e.g., its initial concentration ranging from 0.5 to 5.7M and itsviscosity η0; and,
• the droplet parameters such as its size, and more particularly, the three-phase contact linetopology characterized by the surface tension of the liquid-vapour interface.
The influence of these parameters on the corrosion process have been assessed by determiningthe rate of iron corrosion under sessile droplets from aqueous chloride solutions.
Chapter 3. Influence of Chloride Concentration and Droplet Size Effect 87
3.1.1 Corrosion Rate Determination
The corrosive effects of chloride under-droplet deposition on iron have been quantified byperforming weight loss measurements at different exposure times t. At a given exposure timet, the weight loss of iron samples ∆m(t) was calculated from the measured weights m0, theinitial (before experiment) weight and, mF(t), the final (after experiment and cleaning of the"corrosion" products) weight using Equation 1.1 (see III.4.3 for more detailed information).Figure 3.3 presents the measured weight loss of iron substrates, onto which sessile dropletsfrom aqueous chloride solutions were deposited, over the corrosion process, at several exposuretimes ranging from 1 day to 1 month.
0 5 1 0 1 5 2 0 2 5 3 002468
1 01 21 41 61 82 0
5 . 7 M M g C l 21 0 . 5 M L i C l
3 M M g C l 2
4 . 6 M K C l
6 . 1 M N a C l
3 M N a C l1 M N a C l
0 . 5 M N a C l 1 M N a C l 3 M N a C l 6 . 1 M N a C l 3 M M g C l 2 5 . 7 M M g C l 2 4 . 6 M K C l 1 0 . 5 M L i C l
∆m [m
g]
T i m e t [ d a y s ]
0 . 5 M N a C l
0 5 1 0 1 5 2 0 2 5 3 00 . 00 . 20 . 40 . 60 . 8
Figure 3.3 – Weight loss of the iron substrate ∆m, onto which sessile droplets containing different aqueous chloridesolutions were deposited, as function of the exposure time t. Over the corrosion process, ∆m(t) was calculated fromthe measured initial weight m0 and the final weight mF using Equation 1.1. The linear increase of ∆m betweent = 1 day and 1 month was used to determine the corrosion rate Vcorr.
Figure 3.3 shows that the weight loss of iron samples increases over the whole corrosionprocess. A temporal increase of ∆m is observed for the different studied chloride solutionswithin the initially sessile droplets deposited onto iron substrates. Between t = 1 and 30 days,the weight loss increase is linear with time as depicted by the dotted lines in Figure 3.3. Thus aweight loss rate (i.e., a change of the weight loss of the iron sample per time unit: ∆m
t ) is ratherwell defined and can be measured in this exposure time interval.
The rate of the corrosion process, which took place when sessile droplets from aqueouschloride solutions were deposited onto iron, was evaluated as the weight loss rate per areaunit. The surface covered by the initially deposited sessile droplet on the iron substrate Sdrop
was considered as exposed area for the corrosion rate determination since the corrosive effectson iron (i.e., in the present case, the pitting corrosion in the metal) was solely observed underthe main droplet area as illustrated in Figure 2.1. Thus the corrosion rate Vcorr, the change ofthe weight loss of the iron sample ∆m per time unit t and per area unit Sdrop, corresponding to
88 3.1. Towards a General Peripheral Film Phenomenon
the contact area of the initially deposited sessile droplet from aqueous chloride solution withthe iron substrate, was given by:
Vcorr =∆m
t1
Sdrop≈ constant (3.1)
All the parameters involved in Equation 3.1 can be assumed as constant. The weight loss pertime unit ∆m
t can be considered as constant from the experimental determination/measurement(Figure 3.3). Over the corrosion process we observed that the initial contact area of the de-posited sessile droplet with the substrate remained approximately constant as depicted in Fig-ure 2.3. The formation of the peripheral film from the droplet edge region did not alter thefootprint diameter of the initially deposited sessile droplet. As a consequence, we can assumethat the corrosion rate Vcorr was constant for a given salt solution. Thus we found an uniquevalue of Vcorr for each of the eight studied under-droplet corrosion experiments. Vcorr is on theorder of hundreds of mg.cm−2.an−1, i.e., about 1-6 µm.an−1. Comparing to corrosion rates ofiron in marine atmospheric environments, which are about 10-100 µm.an−1 [143], exposures tosessile droplets from saline solutions exhibit lower corrosion rates.
3.1.2 Peripheral Film Growth
In aqueous chloride systems, corrosion is the result of the coupling of at least one anodic(dissolution) reaction (Equation 2.4) with at least one cathodic (reduction) process (Equation2.3). Anodic and cathodic reactions proceed in step with each other, but the overall rate of theelectrochemical corrosion is governed by either the anodic or the cathodic reaction. Corrosionof iron under sessile droplets from aqueous chloride solutions induces the spatial separation ofthe anodic and cathodic processes, leading to localized corrosion under the initially depositedmain droplet. The main droplet acts as an anode supporting by cathodic reaction along theperipheral film emanating from the droplet edge region. As a consequence, the governingreaction of the overall corrosion process may be determined by considering the impact ofits surface area on the corrosion rate. The droplet surface (anodic) area barely changed in-dependent of the nature and composition of the chloride solution inside the sessile droplet:Sdrop ≈ 0.24± 0.06 cm2. Otherwise, the initial footprint area of the deposited sessile dropletwas not altered over the corrosion process. On contrary, the surface area of the cathodic processSC, which is proportional to the peripheral film width W 3, increased over time as depicted inFigure 3.2, and also differently depending on the type of chloride solution. Therefore, if thecathode surface area is the peripheral part of the droplet (i.e., the droplet edge and the resultingperipheral film), SC will not be constant over the corrosion process and by extension, the rateof the overall corrosion process Vcorr will increase with time. This was not the experimentallyobserved case: Vcorr was determined as constant for a given salt solution (Equation 3.1). Thus,we can assume that the effective cathodic surface area, which contributes significantly to theoverall kinetics, is essentially limited to the three-phase contact line region.
However, the Vcorr value varied from one system to the next by changing the type andcomposition of the chloride solution within the sessile droplet. Figure 3.4 shows the rateof the overall corrosion process Vcorr as function of the square root of the growth diffusioncoefficient Dp (Equation 2.1). Dp was experimentally determined for each salt solution fromthe measurement of the peripheral film width with time (Figure 3.2).
3SC = (r + W)2 π − Sdrop = 2 r W + W2 with r as the radius of the initially deposited sessile droplet and Sdrop asthe droplet surface area. Since W2 is negligible compared to the first term, the surface area of the cathodic process SCcan be approximated by 2 r W.
Chapter 3. Influence of Chloride Concentration and Droplet Size Effect 89
0 5 . 0 x 1 0 - 6 1 . 0 x 1 0 - 5 1 . 5 x 1 0 - 50
1 0 0
2 0 0
3 0 0
4 0 0
5 0 0
6 0 0Co
rrosio
n rate
V corr [m
g.cm-2 .an
-1 ]
G r o w t h D i f f u s i o n C o e f f i c i e n t D 1 / 2 [ m . s - 1 / 2 ]
0 . 5 M N a C l 1 M N a C l 3 M N a C l 4 . 6 M K C l 3 M M g C l 2 6 . 1 M N a C l 1 0 . 5 M L i C l 5 . 7 M M g C l 2
pFigure 3.4 – The rate of the corrosion process induced when a sessile droplet from aqueous chloride solution wasdeposited onto an iron substrate Vcorr (Equation 3.1) as a function of the square root of the growth diffusioncoefficient Dp (Equation 2.1). The corrosion experiments were performed in humidified air with RHeq at T = 20C.
The rate of the overall corrosion process Vcorr increases as the square root of the growthdiffusion coefficient Dp increases. More precisely, we observed a linear increase of Vcorr with√
Dp as depicted by a dotted line in Figure 3.4. Figure 3.4 reveals that the rate of iron corrosionunder sessile droplets from aqueous chloride solutions, and by extension the overall dropletinduced-corrosion process, is governed by the ion (cation) transport from the droplet bulkthrough the peripheral film, which emanates from the (cathodic) three-phase contact line. Asthe displacement of cations towards the droplet edge is enhanced or facilitated, the corrosionprocess is accelerated considerably.
In the following sections, the corrosion rate Vcorr (Equation 3.1) will be determined asfunction of each experimental parameter: the relative humidity RH, the initial chloride con-centration c0 and the initial droplet volume V0.
3.2 Relative Humidity dependence
The relative humidity RH in the surrounding air environment, in which corrosion experimentsunder sessile droplets from aqueous chloride solutions were performed, was adjusted vary-ing the equilibrium relative humidityRHeq from 10.5 to 99% as function of the bulk solutiondroplet. Figure 3.5 presents the evolution of the rate of the corrosion process induced when asessile droplet from aqueous chloride solution was deposited onto an iron substrate as a func-tion of the imposed equilibrium relative humidity in the surrounding air droplet environmentat T = 20C.
90 3.2. Relative Humidity dependence
0 2 0 4 0 6 0 8 0 1 0 00
2 0 0
4 0 0
6 0 0 0 . 5 M N a C l 1 M N a C l 3 M N a C l 4 . 6 M K C l 6 . 1 M N a C l 3 M M g C l 2 5 . 7 M M g C l 2 1 0 . 5 M L i C l
Corro
sion r
ate V
corr [m
g.cm-2 .an
-1 ]
E q u i l i b r i u m r e l a t i v e h u m i d i t y R H e q [ % ]Figure 3.5 – The rate of the corrosion process induced when a sessile droplet from aqueous chloride solution wasdeposited onto an iron substrate Vcorr (Equation 3.1) as a function of the equilibrium relative humidity RHeqimposed in the surrounding air environment at T = 20C.
Figure 3.5 shows that the curve Vcorr-versus-RH has a sigmoidal shape response. Below arelative humidity of 70%, the corrosion rate is less than 100 mg.cm−2.an−1. Between RH = 70and 99%, Vcorr significantly increases: its value augments from 130 to 490 mg.cm−2.an−1. Fig-ure 3.5 illustrates that the moisture content in the atmosphere influences the corrosion rate.
The first evidence of ambient relative humidity-dependent atmospheric corrosion wasdemonstrated by Vernon [96, 97]. He showed a dramatic increase in weight gain in iron sam-ples when the relative humidity exceeded a certain value, called ”critical relative humidity”,in the presence of SO2, a well-known oxidizing gas contaminant in industrial atmosphere [97].Water layers may be adsorbed from the vapour phase environment. The thickness of the waterlayer ranges from less than one to tens of monolayers and depends primarily on the relativehumidity [89, 144] and the surface of the substrate material such as its roughness or its wet-ting properties [95]. At 20% RH, approximately one monolayer exists on average, whereas at75% RH, the thickness increases to about five monolayers [89, 144]. The corrosion rate is afunction of the thickness of the adsorbed water layer and therefore the relative humidity (seeI.4.1). Figure 3.5 is representative of the Vcorr-versus-RH curve usually observed for most met-als. Typically the critical humidity level above which the corrosion rate drastically increasesis more than 50% and is thought to be the relative humidity at which at least three mono-layers of water exist. In general if the RH is lower than the critical level, the corrosion rateis minimal and the reaction process is essentially dry (requiring a direct gas-metal ambient-temperature interaction) [144]. Above this critical relative humidity, the adsorbed water phasebecomes ”quasi-aqueous” and can support faster electrochemical charge transfer reactions [89].The final important water-adsorption aspect is associated with the chemical and physical prop-erties of the products, deposited or formed by corrosion, on the metal surface. These surface
Chapter 3. Influence of Chloride Concentration and Droplet Size Effect 91
(hygroscopic) contaminants may absorb water from the vapour phase of the atmosphere andcan give rise to a drastic increase of the corrosion rate [89, 145]. As a consequence the corrosionrate is directly related to the amount of water present on the corroding surface.
The rate of iron corrosion under sessile droplets from aqueous chloride solutions was af-fected by the surrounding environment humidity. However, the peripheral film formation fromthe droplet edge was observed even in low-humidity environment. The relative humidity havean impact on the corrosion process once the peripheral film is obtained. This will be discussedin detail in the discussion section. Moreover, it is interesting to notice that in low-humidityenvironment (RH < 40%), the corrosion rate was not negligible and in particular, was higherat 10.5% (10.5M LiCl) than 33% (5.7M MgCl2). This suggests that the electrolyte solution withinthe sessile droplet may have an influence on the corrosion process.
3.3 Influence of Chloride Concentration
Different nature and composition of electrolyte solutions within the initially deposited sessiledroplet onto iron samples were investigated. In particular, the influence of the initial chlorideconcentration c0 on the corrosion rate Vcorr (Equation 3.1) was studied as depicted in Figure3.6.a.
0 2 4 6 8 1 0 1 20
1 0 0
2 0 0
3 0 0
4 0 0
5 0 0
6 0 0 Dynamic viscosity [Pa.s]
0 . 5 M N a C l 1 M N a C l 3 M N a C l 4 . 6 M K C l 3 M M g C l 2 6 . 1 M N a C l 1 0 . 5 M L i C l 5 . 7 M M g C l 2
0 . 5 M N a C l 1 M N a C l 3 M N a C l 4 . 6 M K C l 3 M M g C l 2 6 . 1 M N a C l 1 0 . 5 M L i C l 5 . 7 M M g C l 2
Corro
sion r
ate V co
rr [mg.c
m-2 .an-1 ]
I n i t i a l C h l o r i d e C o n c e n t r a t i o n c 0 [ M ]
a
0 2 4 6 8 1 0 1 20
2 0 0 0
4 0 0 0
6 0 0 0
8 0 0 0b
I n i t i a l C h l o r i d e C o n c e n t r a t i o n c 0 [ M ]Figure 3.6 – a. Corrosion rate Vcorr (Equation 3.1) as function of the initial chloride concentration c0 of the aqueouselectrolyte solution in the sessile droplet deposited onto iron surfaces. The corrosion experiments were performed inair environment with RHeq at T = 20C. b. The influence of c0 on the dynamic viscosity η0 of the droplet bulksalty solution. As dynamic viscosity η0 we assumed the literature values corresponding to initial inweight chlorideconcentration c0 within the initially sessile droplet deposited onto iron samples, at T = 20C [119, 120, 146, 147].
Figure 3.6.a reveals that Vcorr decreases as c0 increases from 0.5 to 11.4M. This experimentalresult is really surprising and counter-intuitive, since it is not consistent with the currentunderstanding, that the corrosion behaviour of metal in aqueous chloride solutions and un-der sessile chloride droplets increases with higher chloride ion concentrations [20, 25]. Thegeneral thinking is that chloride ions influence the corrosion rate by virtue of the type ofmetal-chloride ion complex (compound) that is formed. Thus solutions of chloride ions wouldform a FeClx (x = 2, 3) complex which would readily dissociate and have the net effect ofcarrying Fe2+ away from the surface, within the droplet solution [148]. This would imply thatchloride ions are involved in the anodic process. Increasing the chloride concentration withinthe sessile droplet will increase the anodic kinetics. Therefore an augmentation in chloride
92 3.4. Droplet size effect
ion concentration should accelerate considerably the corrosion process if the anodic reactioncontributed significantly to the overall kinetics [148]. This is completely the opposite of whatis observed in Figure 3.6.a. As a result, Figure 3.6.a supports that the corrosion process is notcontrolled by the anodic reaction but rather influenced by the cathodic reaction occurring atthe droplet perimeter, and more particularly by the oxygen uptake at the droplet edge region.Since an increase in salt concentration in the droplet bulk reduces the solubility of oxygen atthe electrolyte-metal interface near the contact line region [149, 150], the corrosion rate Vcorr
shifts to less positive values, as the droplet aqueous solution is more concentrated in salt(chloride).
Otherwise the nature and composition of the electrolyte may also influence the intrinsicparameters of the solution inside the initially sessile droplet deposited onto iron surfaces.Since we demonstrated that the diffusive ion transport towards the droplet edge influencesthe under-droplet corrosion process (Figure 3.4) and we also showed that the growth dif-fusion coefficient Dp changes by two orders of magnitude (Figure 3.2.b), viscous stresses atthe electrolyte-air interface may slow down the corrosion process. Figure 3.6.b presents theinitial dynamic viscosity η0 of the salt solution within the sessile droplet as function of theinitial chloride concentration c0. As dynamic viscosity η0 we assumed the literature valuescorresponding to initial inweight chloride concentration c0 within the initially sessile dropletdeposited onto iron samples, at T = 20C [119, 120, 146, 147]. Figure 3.6.b shows that η0
increases with increasing c0 for a given salt (e.g., NaCl), but also in a general way for all thestudied range of aqueous chloride solutions. For an approximately constant c0 (e.g., at 3M), theinitial viscosity properties of the magnesium and sodium chloride solutions differ obviously:η0 (3M MgCl2) ≈ 2 · η0 (6.1M NaCl) [119, 120]. However, Figure 3.6.a depicts that the corrosionrate of these two different systems is only slightly different. This slight variation in Vcorr atconstant c0 suggests that the effect of viscous forces on the corrosion process, and particularlyon the diffusion limiting transport of cations in the peripheral film, is relatively unimportant.
In the previous chapter, our scenario of the extended Evans droplet model included theoccurrence of interfacial forces in the three-phase contact line region, induced by ionic compo-sition changes during the course of the cathodic reaction and migration of cations towards thedroplet perimeter. Depending on the nature and composition of initial chloride solutions insidethe sessile droplet, the surface tension γ varied between 73.8 and 92.8 mN.m−1 at T = 20C[44] (Table 1.1). Figure 3.7 shows the effect of the surface tension (at the interface air-liquid) γ
of the aqueous chloride solution on the corrosion rate Vcorr (Equation 3.1) placed under sessiledroplets in air with RHeq at T = 20C.
Figure 3.7 reveals that Vcorr decreases as γ increases. Between γ = 73.8 and 92.8 mN.m−1,the corrosion rate is linear with the surface tension of the aqueous electrolyte solution as de-picted by the dotted line in Figure 3.7, in the course of the formation of the peripheral film.The latter confirms some peripheral/radial flow/transport which is influenced by (peripheral)surface tension gradients. This will be discussed in greater detail in Discussion.
3.4 Droplet size effect
The droplet size effect on the corrosion process induced when a sessile droplet from chloridesolution was deposited onto iron samples was investigated. For this purpose, we focused ourstudy only on sessile droplets from aqueous 6.1M NaCl solution exposed to air environment
Chapter 3. Influence of Chloride Concentration and Droplet Size Effect 93
7 0 7 5 8 0 8 5 9 0 9 50
2 0 0
4 0 0
6 0 0 0 . 5 M N a C l 1 M N a C l 3 M N a C l 4 . 6 M K C l 6 . 1 M N a C l 3 M M g C l 2 5 . 7 M M g C l 2 1 0 . 5 M L i C l
Corro
sion r
ate V
corr [m
g.cm-2 .an
-1 ]
S u r f a c e t e n s i o n [ m N . m - 1 ]Figure 3.7 – Corrosion rate Vcorr (Equation 3.1) as function of the surface tension γ of the aqueous electrolytesolution in the sessile droplet initially deposited onto iron surfaces. The corrosion experiments were performed in airenvironment with RHeq at T = 20C
with RHeq 75.4% at T = 20C. The initial droplet volume V0 varied between 5 and 60 µl, induc-ing a change of the sessile droplet radius r from 0.22 to 0.60± 0.02 cm.
Irrespective of the size of the initially deposited sessile droplet, a peripheral film was ob-served ahead of its macroscopic contact line. The peripheral film development depicted in thefirst section of this chapter (Figure 3.1) and its consequences on the morphological and com-positional spatial distribution of the ”corrosion” products over the dried iron surface (Figures2.1 and 2.2) are representative for all corrosion experiments obtained with sessile droplets from6.1M NaCl with various sizes (initial volumes). An example of the microscopy images of driediron surfaces, onto which an aqueous sessile droplet from 6.1M NaCl with different sizes wasdeposited, is illustrated in Appendix B.
Figure 3.8.a. presents the temporal evolution of the width of the peripheral film W for dif-ferent sizes of the initially deposited sessile droplet from 6.1M NaCl over an exposure timeperiod of eight days. As usually observed for all under-droplet corrosion experiments pre-sented in this chapter (Figure 3.2.a), the peripheral film width W increases linearly with thesquare root of the experimental time t as depicted by the dotted line in Figure 3.8.a. The size-independent temporal increase of the peripheral film width was the most interesting feature ofthe corrosion phenomenon induced by sessile droplets from 6.1M NaCl with different V0. Theperipheral film expansion over the corrosion process did not depend on the droplet radius r ofthe initially deposited sessile droplet.
However, the temporal weight loss of the iron substrate ∆m increases, if the initial size ofthe sessile droplet in contact with the iron substrate increases. The measured ∆m of iron sam-ples, onto which sessile droplets from 6.1M NaCl with different V0 were deposited, over the
D r o p l e t v o l u m e V 0 5 µ l 1 0 µ l 2 0 µ l 4 0 µ l 5 0 µ l 6 0 µ lCo
rrosio
n rate
V corr
[mg.c
m-2 .an-1 ]
D r o p l e t r a d i u s r [ c m ]Figure 3.8 – a. Evolution of the peripheral film width W (i.e., the distance from the droplet edge to the perimeterof the peripheral region) as function of the square root of the experimental time t. The corrosion experiments wereperformed with a sessile droplet from 6.1M NaCl deposited onto an iron surface, in humidified air with RHeq 75.4%at T = 20C, for different initial droplet volumes V0: 5, 10, 20, 40, 50 and 60 µl. b. Weight loss of the iron substrate∆m (Equation 1.1) as function of the square of the droplet radius r. ∆m was calculated after 8 days of exposure ofthe sessile droplets on the iron surface. c. The corrosion rate Vcorr (Equation 3.1) is independent of the droplet radiusr.
corrosion process (i.e., at several exposure times ranging from 1 day to 1 month) is presentedin Appendix B. Figure 3.8.b shows the measured ∆m of iron samples after 8 days of exposureto a 6.1M-concentrated sessile droplet with different V0 as function of the square of the dropletradius r. ∆m at a given time linearly increases with r2. A similar trend was observed, when weconsidered the weight loss of the iron substrate for shorter or longer exposure time periods.Therefore, the weight loss of the iron substrate, onto which differently sized-sessile dropletsfrom 6.1M NaCl were deposited, depends on the droplet surface area Sdrop. The corrosion rateVcorr was determined from the temporal weight loss of the iron substrate using Equation 3.1.As shown in Figure 3.8.c., the corrosion rate remains unchanged independent of the dropletradius: Vcorr ≈ 130 ± 30 mg.cm−1.an−1. Neither of these trends is surprising, since in thestudied range of initial droplet sizes, larger "Evans" droplets have a larger electrolyte-coveredarea on the iron substrate to induce more severe pitting corrosion in the metal [20, 25]. Oncethe footprint area of the initially deposited sessile droplet is accounted for as it is done in thedetermination of the corrosion rate (Equation 3.1), we confirmed that the droplet size had noinfluence on the overall corrosion kinetics. Therefore, as revealed in Figure 3.8, the corrosionprocess is not controlled by the anodic reaction itself occurring under the droplet diameter
Chapter 3. Influence of Chloride Concentration and Droplet Size Effect 95
but rather depends on the cathodic reaction near the droplet edge region, where ion transportoccurs towards the peripheral film induced by ionic composition (surface tension) changes atthe three-phase contact line.
3.5 Discussion and Outlook
Here we investigated the corrosion phenomenon induced when a sessile droplet from aqueoussaline solutions was placed on a planar iron substrate. The bulk solution within the sessiledroplet consisted of various aqueous chloride electrolytes of different counter-cations (sodium,potassium, lithium and magnesium) with initial chloride concentrations c0 ranging from 0.5 to11.4M, equilibrium relative humidities RHeq between 10.5 and 99%, and surface tensions γ from73.8 to 90.7 mN.m−1. Within the limits of our parameter variations, we found the formation ofa peripheral film ahead of the macroscopic contact line of the main sessile droplet depositedonto iron surfaces, a phenomenon explained in detail in the previous chapter (Figure 3.1). Inthe literature, the secondary spreading phenomenon [124] was not experimentally observedfor MgCl2 droplets at RH 90% [135]. The authors claimed that the precipitation of hydroxidesprevented the formation of a micro-droplets’area at the droplet edge [135].
Quantitative analysis on the peripheral film phenomenon was performed by determiningthe dependence of the corrosion rate Vcorr (i.e., the rate of weight loss of the iron substrateper droplet unit area) on various parameters. The experimental results prompt two questions:(1) Why does the diffusive ion transport occurring at the three-phase contact line govern theunder-droplet corrosion process at RHeq? (2) Why does the corrosion rate depend mainly onthe initial chloride concentration and the surface tension, but only weakly on other parameters?According to the Bulter-Volmer model[151], the corrosion potential Ecorr, at which the rate ofoxygen reduction is equal to the rate of iron oxidation, is given by:
Ecorr = K +2.3 R TαA + αC
log(
SC kC cO2
SA kA
)(3.2)
with R as the gas constant, T as the temperature, αA and αC as the transfer coefficient for theanodic and cathodic processes, SA and SC as the surface area of the anode and cathode, kA
and kC as the standard rate constant of the anodic and cathodic reactions, cO2 as the interfa-cial concentration of dioxygen and K as a constant involving the standard potentials and thenumber of electrons transferred for the anodic and cathodic reactions. Note that the rate of thecathodic reaction at Ecorr is called corrosion current (density) Icorr, which corresponds to thecorrosion rate Vcorr. Therefore, any process that increases either the surface area of the cathodicreaction SC or the interfacial concentration of oxygen cO2 , or decreases the surface area of theanodic reaction SA will lead to increased Ecorr (Equation 3.2), resulting in an augmentationof Vcorr. Thus, since SA and SC remained almost limited to the droplet footprint area and thethree-phase contact line region, respectively, over the corrosion process (Figure 3.4), an increasein the interfacial concentration of oxygen for the most part at the droplet perimeter will inducea shift of Ecorr to more positive values. This dependence is in agreement with the experimentalobservations regarding the effect of the initial chloride concentration c0 within the depositedsessile droplet on the corrosion rate (Figure 3.6). The oxygen uptake influence or more gener-ally the cathodic control nearby the droplet contact line region on the under-droplet corrosionprocess eliminates the dependence of the corrosion rate on the droplet (anodic) size (Figure3.8), but points out the rate-determining influence of the diffusive ion transport occurring atthis droplet peripheral part (Figure 3.4).
96 3.5. Discussion and Outlook
However, the corrosion rate is affected by the relative humidity RH in the surroundingenvironment (Figure 3.5) and a linear dependence has been measured between Vcorr and thesurface tension of the electrolyte solution γ (Figure 3.7). It appears most likely that Figure 3.5reflects the formation of localised thicker micro-pools, observed in the course of the peripheralfilm (Figure 2.3). The hygroscopic cations concentrated along the ongoing peripheral film mayadsorb water and create water clusters, which will increase locally the thickness of the film[144]. Therefore the vapour density may impact the thickness of the peripheral film by produc-ing bulk-like localized aqueous conditions along the peripheral film. The film thickness mayalso be related to the disjoining pressure: a liquid thin film is subject to forces acting perpen-dicular to the plane of the film as introduced by Derjaguin [37]. As a consequence, the effect ofrestrictive diffusion of cations into the peripheral film may significantly decrease the diffusioncoefficient D usually determined in bulk solution. As a result, an effective growth diffusioncoefficient Dp in the peripheral film solution was measured (Figure 3.2).
Nevertheless the thickness of the resulting peripheral film e (estimated to less than 2 µm,Figure 2.5) is negligible compared to its millimeter width W, which suggests that the driv-ing force for the corrosion process is related to some radial peripheral transport. Figure 3.7demonstrates that Vcorr is inversely proportional to the surface tension of the electrolyte so-lution within the initially deposited sessile droplet. Therefore, it can be assumed that theperipheral film phenomenon, as described in this thesis part, is predominantly caused by aperipheral surface tension gradient and the resulting Marangoni flow. The three-phase contactline is destabilized by the radial flow induced by ionic composition changes during the courseof the cathodic reaction and migration of cations towards the droplet perimeter.
To conclude, we demonstrated in this chapter the origin of the peripheral film behaviour onthe under-droplet corrosion process. As shown in this chapter, the dependence of the corrosionrate Vcorr on various parameters is a powerful method for characterizing the rate-determiningprocesses resulting in the peripheral film phenomenon. We found that the peripheral film be-haviour barely depends on the droplet size. The dependence on the surface tension of theelectrolyte solution and the initial chloride concentration within the deposited sessile dropletagrees with the scenario proposed in the previous chapter. As a result, the peripheral film phe-nomenon comes down to diffusion of cations from the droplet edge region into the thin filmand diffusion of oxygen occurring essentially at the three-phase contact line.
To better elucidate the role of the environmental conditions, further experiments will in-clude mixtures of oxygen and nitrogen gases. For a better understanding of the peripheral filmformation, further experiments should include systematic studies of salt mixtures, which willhave different surface tensions of the liquid-vapour interface. From a corrosion viewpoint, itwill be interesting to transpose the under-droplet corrosion experiments to other metal sub-strates as stainless steel and also to investigate the possible influence of the roughness of themetal surface.
IVCorrosion of Iron under Evaporating SessileDroplets from Sodium Chloride Solutions
Part IV: Corrosion of Iron under Evaporating Sessile Droplets from Sodium Chloride Solutions 101
In marine atmospheres, the presence of natural chlorides deposited on metal surfaces assprayed droplets carried by the wind from the sea, distinctly arises and supports corrosioncells. A prominent example is the so-called "Evans droplet" experiment [18], where the differ-ential dissolved oxygen concentration along the air-electrolyte interface induces a spatial sep-aration of the anodic and cathodic areas on the salty droplet surface (I.4.2). The Evans dropletexperiment has been studied so far using different approaches: electrochemical methods (e.g.,electrochemical impedance spectroscopy or scanning Kelvin probe) [19, 24, 25, 127], Ramanspectroscopy [28, 102, 127], and microscopy characterization (e.g., SEM or AFM) [28–30]. Inthese experiments, the droplet characteristics such as its size and its composition, as well asthe nature of the rust were investigated. Few studies have been extended to evaporating sessiledroplets [20, 26, 152, 153]. None of them took into account the hydrodynamics inside dropletsduring the evaporation process, which is generic to drying sessile droplets [1].
As mentioned in I.2.2, for small contact angles (θ 90), the evaporative flux from the freesurface of the liquid to the surrounding air diverges in the vicinity of the droplet edge [7, 8, 11].As observed in the second part of this thesis, with the presence of non-volatile and soluble so-lutes such as salt within the sessile droplet, the spatially nonuniform evaporative flux leads to aflow field pattern resulting in inhomogeneous salt deposition/precipitation within the dryingdroplet [12, 83, 117, 118]. Therefore the evaporating version of the Evans droplet experimentillustrates factors not included in the classical model, i.e., the variation in electrolyte thickness,the impact of salt and its concentration increase over the evaporation exposure.
Although this has received little or no attention so far, corrosion has been observed underevaporating sessile droplets from aqueous saline solutions. In this last PhD part, we investi-gated the pitting corrosion phenomenon induced by the evaporation of sessile droplets fromaqueous sodium chloride solutions on planar iron surfaces. We explored the influence of thesalt initial concentration, its distribution and change within the evaporating sessile droplet andfocused on the salt-induced mechanism and the subsequent anode/cathode localisation at theelectrolyte-metal interface.
102 1. Evaporation of Sessile Droplets from Sodium Chloride onto Iron
1 Evaporation of Sessile Droplets from Sodium Chloride onto
Iron
We investigated the evaporation behaviour of sessile droplets from aqueous sodium chloridesolutions on planar solid surfaces as function of the relative humidity. Most of this has beenstudied in detail for this naturally ubiquitous system on inert surfaces, i.e., silicon wafers,in the second part of this thesis. Henceforth, we focused essentially on metallic surfaces. Weextended the experimental and theoretical description of the evaporation behaviour of saltysessile droplets on silicon wafers to pure iron surfaces. We examined particularly the sur-face influence and the impact of the gas environment. The gaseous phase surrounding theevaporating sessile droplets was a dry or wet mixture of high-purity nitrogen or synthetic air(standard gas mixture of N2 (79.5% vol.) with O2 (20.5% vol.), Air FID, Messer). This quantita-tive experimental study was performed in the setup for evaporation experiments presented inII.1.
Figure 5 presents the time evolution of the normalized droplet volume v (Equation 2.1)during the evaporation of sessile droplets containing a 10−3M NaCl-concentrated aqueoussolution deposited either on silicon wafers or pure iron surfaces in two different gaseousenvironments: N2 and air with a relative humidity RH 0% at T = 23C. The initially depositedvolume V0, according to the readout of the syringe, was 10 µl.
5 0 s
0 5 0 0 1 0 0 0 1 5 0 0 2 0 0 00 . 0
0 . 2
0 . 4
0 . 6
0 . 8
1 . 0
I r o n
I r o nI r o n
5 0 s A I R
I r o nA i r
I r o nN 2
N 2
5 0
v
T i m e t [ s ]
Transi
ent tim
e
L a t e r a l r e s o l u t i o n l i m i t
3 0 0
S i d e v i e w
θ
~ 3 . 2 m m ~ 3 . 2 m m
5 0 sT o p v i e w
S i l i c o nN 2
- 4 - 2 0 2 40 . 0
0 . 2
0 . 4
0 . 6 N 2 A i r
Heigh
t [mm]
x [ m m ]
5 0 s
3 0 0 s
Figure 5 – Evaporation of sessile droplets from 10−3M NaCl deposited onto silicon wafers or iron substrates in ahigh-purity nitrogen or synthetic air environment with a relative humidity RH 0% at T = 23C (V0 = 10 µl).The inset plot shows the height profile at two different evaporation times: 50 and 300 s. The other inset shows topview imaging 50 s after droplet deposition.The two insets are only depicted for the sessile droplets deposited on ironsurfaces under N2 or air gaseous phases. The silicon wafers’ case has been presented in detail in Figure 3.1.
In all cases, Figure 5 shows a linear temporal decrease of the measured and normalized
Part IV: Corrosion of Iron under Evaporating Sessile Droplets from Sodium Chloride Solutions 103
droplet volume (from top and side aspects) over the studied evaporation time range, i.e., fromthe transient to the lateral times (see II.3.1 for more detail information about the time window).Further, the height profiles depicted in Figures 5 (iron substrates) and 3.1 (silicon wafer) testifythat the deposited salty sessile droplets evaporated in pinned, constant contact area mode.Since the three-phase contact line is anchored on the surface (see I.2.3) after sessile dropletdeposition (t = 0 s) and spreading (t < 50 s), the radii remained constant (r ∼ 3.2 mm for ironsamples) while the contact angles θ decreased between t = 50 and 300 s as illustrated in theside aspects profiles. Therefore, there is no influence of the surrounding gaseous phase and nosurface impact on the evaporation behaviour (i.e., the time evolution of the droplet shape) ofsessile droplets from 10−3M NaCl.
However, Figure 5 reveals a variation of the evaporation kinetics between the differentstudied droplet/substrate/gas systems. Under high-purity nitrogen environment, the metallicsurface, onto which the sessile droplet is placed, induced a (expected) decrease in the evap-oration rate dv
dt (i.e., the normalized droplet volume per time unit) in comparison to siliconwafers. Although particular attention has been paid to obtain for these two substrates a quitesimilar surface condition, in particular surface roughness (1-2 nm, see II.1.2 and III.4.2), metalsexhibit usually a less hydrophilic surface than silicon wafers, providing a lower wettability[31, 154–156]. Experimentally we noticed that the equilibrium contact angle θe at t = 50 sevolved from 2 ± 0.5 to 10.3 ± 1.5, if the silicon wafer turned into an iron sample. Thequestion is whether the contact angle is the only differentiating parameter between siliconwafers and iron substrates relative to the evaporation rate measured when a sessile dropletfrom aqueous saline solution evaporates in high-purity nitrogen environment. We will answerthis question by determining and analyzing in the following the normalized evaporation ratesQi (Equation 3.9).
Moreover, with iron samples, the surrounding gaseous phase has a significant influenceon dv
dt as presented in Figure 5. Note that experiments performed with salty sessile dropletsdeposited on silicon wafers in air (data not presented in Figure 5) matched quantitatively aswell as qualitatively the evaporation under nitrogen environment as depicted in Figure 5. Thelarge evaporation rate disparity observed for only iron substrates between the two differentgaseous environments is surprising. Since the saturation vapour pressure Psat at/above thesessile droplet surface (for a salt concentration c0) can be assumed constant in all our cases,the evaporation should simply result in a single curve. This is not what we observed experi-mentally with iron samples.
The influence of the initial salt concentration and the relative humidity on the evaporationbehaviour was investigated with droplets containing different (characteristic) NaCl concen-trations from 10−6 to 6.1M (the saturation limit). For the various salt solutions RH variedbetween 0 and 60%. Within theses ranges of c0 and RH, the evaporation on iron surfaces wasnot qualitatively different in N2 environment or in air. The characteristic temporal patterns ofpinned evaporating sessile droplets were observed: (a) v decreased linearly with time withinthe ”initial” evaporation range (we defined ”initial” as covering the time span between t = 50and 100 s) and for times much longer, (b) the contact area of the droplet remained constantand (c) the contact angle decreased over the lifetime of the drying droplet. An example of thetime evolution of the normalized volume and shape (from top and side aspects) of the sessiledroplet at 1M NaCl is shown in detail in Appendix C.1. In addition, with high-humidity en-vironments for pinned sessile droplets deposited on iron substrates and containing initial saltconcentration ≥ 10−6M, we found a decreasing evaporation kinetics. Equivalent results withlower dv
dt with increasing RH were also obtained for silicon wafers (see II.3). Nevertheless, we
104 1. Evaporation of Sessile Droplets from Sodium Chloride onto Iron
demonstrated on silicon wafers that the environmental relative humidity had no quantitativeinfluence on the evaporation of salty sessile droplets (Figure 3.7) insofar as the droplet volumeV and the time t were correctly normalized (Equations 2.1 and 3.4). Because each parameterused in the volume or time scaling (i.e., the initially deposited volume V0, the saturated vapourpressure of water PH2O
sat and the droplet size factor r1) can be assumed constant in all cases, theresult of the relative humidity on the scaled evaporation rate will remain the same with ironsamples. This is the experimental case, directly confirmed by Figure C. 1 (see Appendix C.2)and demonstrated in the following (Figure 6).
The experimental study on the evaporation of sessile droplets from aqueous sodium chlo-ride solutions described in this section resulted in a variety of different substrates, environ-mental gaseous phases, relative humidities and initial salt concentrations. The resulting, unit-free and universal normalized evaporation rate Qi (Equation 3.9) allows a convenient evalua-tion/comparison of the evaporation behaviour of such diversified systems. In all cases, the nor-malized evaporation rates experimentally determined from the linear decrease of the dropletnormalized volume v with the scaled time t during the initial drying period should result in avalue of 1. The main assumptions for the determination of Qi were the correct normalization ofthe volume (Equation 2.1) and time (Equation 3.4), and a homogeneous salt distribution withinthe droplet and in particular at the droplet surface (see II.3.4 for further explanation about Qi).
Figure 6 shows the experimentally observed normalized evaporation rates Qi as functionof the initial NaCl concentration c0. The evaporation experiments were performed with 10-µlsessile droplets deposited either on silicon wafers or iron substrates. The gaseous phase in theenvironment chamber was high-purity nitrogen or synthetic air with RH varying from 0 to60% at T = 23C. The dashed line depicts the theoretically expected normalized evaporationrate, scaled to a value of 1 according to Equation 3.9.
With silicon wafers, the variation of the experimental Qi as function of c0 and θ in com-parison with the theory as well as the origin of its discrepancy with the latter for c0 ≥ 0.5MNaCl and θ ≤ 30 was fully described in the second part of this thesis. The main reason forthe significant deviations between theory and experiment was explained by Marangoni flowsthat are (self-)induced by the peripheral salt enrichment, itself promoted by the locally nonuni-form evaporative flux and the subsequent capillary flows, that are generic for sessile droplets.The data presented in Figure 6 indicate that the difference of contact angle values betweennaturally oxidized silicon wafers (1 ≤ θ ≤ 10) and pure iron substrates (10 ≤ θ ≤ 20) isthe main parameter that governs the droplet evaporation profile in nitrogen environment. Inthis surrounding gaseous phase, the measured normalized evaporation rates Qi for iron sub-strates agreed quite well with the ones for thermally oxidized silicon wafers having a similarcontact angle range values. As a consequence, the change of evaporation rate illustrated inFigure 5 is independent from the surface composition (silicon wafers or metallic substrates)but derives from wettability. Therefore, the general behaviour for drying sessile droplets fromaqueous chloride solution on iron surfaces, e.g., the flow field and the deposit morphology asresult of the evaporation process, will be identical to that on silicon wafers. This is confirmedby Figure 7. It shows top views of the deposition pattern obtained after complete evaporationof sessile droplets containing aqueous NaCl solutions at different initial concentrations rang-ing from 10−6 to 6.1M in high-purity nitrogen environment with RH 0%. Figure 7 presentsthe same three different NaCl concentration-dependent morphologies as identified on silicon
1Irrespective of the relative humidity and also the surrounding gaseous phase, the geometrical parameters (i.e., thedroplet radius r and contact angle θe) values at t = 50 s can be assumed as constant for each substrate (as presentede.g., in Figure 5 for iron substrates). With Equation 3.3 this means r ≈ constant.
Part IV: Corrosion of Iron under Evaporating Sessile Droplets from Sodium Chloride Solutions 105
Figure 6 – Experimentally observed normalized evaporation rates Qi as function of the initial NaCl concentrationc0 for sessile droplets deposited on silicon wafers or iron substrates. The contact angle θ was varied from 1 to 50
on silicon wafers whereas on iron samples its value range was between 10 and 20. The evaporation experimentswere performed with 10 µl-sessile droplets in high-purity nitrogen environment with RH 0% or in synthetic airat different RHs of 0, 20, 40 and 60% at T = 23C. The dashed line depicts the theoretically expected normalizedevaporation rate according to Equation 3.9 with the assumption of the (inweight) salt concentration distributeduniformly inside the droplet.
wafers (Figure 3.2) for dried sessile droplets initially deposited on iron substrates in nitrogenenvironment. Up to a NaCl concentration of 10−3M, the final dried structure exhibited theclassic "coffee-ring" deposition mainly induced by outward capillary flows compensating fromthe local evaporative losses at the droplet edge region. Above a concentration of 10−3M NaCl,a more uniform salt deposit or a wider salt-ring at the droplet periphery is observed sinceMarangoni and capillary flows led to circulating flows inside the drying sessile droplet.
The different gas environments, in which evaporate sessile salty droplets show similar butdistinct normalized evaporation curves as presented in Figure 6. The measured normalizedevaporation rates Qi remain constant with c0 varying between 10−6 and 0.5M NaCl. Thisplateau is followed by a pronounced deviation of the experimental findings for higher ini-tial salt concentrations. This holds for nitrogen and air environments. However, the syntheticair environment induces a shift of Qi to lower values for the entire studied range of c0 as de-picted in Figure 6. It is interesting to notice that the experimental measurements of Qi in airare independent of the relative humidity. The independence of the relative humidity from thenormalized evaporation rate, initially demonstrated for silicon wafers, was theoretically pre-dicted on iron surfaces above.
An analysis of the approach and assumptions for the determination/measurement of thenormalized evaporation rates Qi suggested that during the droplet evaporation in air on iron
106 1. Evaporation of Sessile Droplets from Sodium Chloride onto Iron
samples there were most likely: (1) as in high-purity nitrogen environment, a peripheral saltenrichment (promoted by capillary and Marangoni flows), which will decrease in the dropletedge region, the water vapor pressure in the c-concentrated aqueous NaCl solution Psat(c)above/at the droplet surface and hence diminish the peripheral evaporative losses, and conse-quently, the overall evaporation rate, particularly for c0 higher than 0.5M NaCl, and in addition,(2) local surface reactions at the solution-iron interface induced by the air environment in aque-ous systems, which can lead to corrosion. If corrosion occurs, there will be local changes in theliquid composition within the sessile droplet (and also at the droplet surface): e.g. formationof hydroxide ions generated by oxygen reduction (Equation 2.3) and/or partial reaction ofwater with the oxidation and reduction products to form rust (Equation 2.5). Therefore thefirst assumption2 that the evaporation of sessile droplets on metallic surfaces in synthetic airis described by Equation 3.2 [3] is not strictly valid. Thus, this scenario predicts that the cor-rosion process within the evaporating sessile droplet will alter (slow down) the evaporationprofile, in addition to Marangoni flows at high salt concentrations. To a first approximation, thedescribed scenario is validated by Figure 7. The three different characteristic final structuresat the end of the evaporation of sessile droplets from aqueous sodium chloride solutions arepreserved in air environment with RH 0%. This confirms the occurrence of Marangoni flowscenario in evaporating salty droplets deposited on iron substrates. Additionally the differentmorphologies developed reddish-yellowish patterns, which usually characterize the corrosioneffect [18, 102, 127]. This assumption has been investigated experimentally by visual exam-ination of the evaporating sessile droplets initially deposited onto iron substrates in air, asdescribed in the following section.
Figure 7 – Morphologies of the deposit resulting from the evaporation of sessile droplets containing aqueous NaClsolutions at different initial salt concentrations from 10−6 to 6.1M. The evaporation experiments were performedwith 10µl-sessile droplets placed on iron substrates in high-purity nitrogen or air environment with relative humid-ity RH of 0%.
2The different assumptions used for the determination/measurement of Qi are presented in detail in the secondpart of this thesis, see II.3.4.
Part IV: Corrosion of Iron under Evaporating Sessile Droplets from Sodium Chloride Solutions 107
2 Evaporating Sessile Droplets from NaCl Solutions induced
Iron Corrosion
Iron samples, onto which aqueous sessile droplets from NaCl solutions were initially de-posited, were exposed to air with a relative humidity RH of 40% at T = 23C. Figures 8 and9 show a microscopy image of an iron surface after complete evaporation of a sessile dropletfrom 10−3M NaCl (Figure 8) and 1M NaCl (Figure 9) with an initial volume of 10 µl. Wedeliberately decided to focus the evaporation study on these two extreme salt concentrationsrepresentative of the two distinctive NaCl deposit regimes as depicted in Figure 7.
Figure 8 shows that the final deposit obtained after complete evaporation of an initially10−3M NaCl-concentrated sessile droplet exhibits the classic "coffee-ring" deposition. Most ofthe precipitates was concentrated close to the droplet edge region. In this peripheral dropletarea we observed some yellowish/dark brown spots or areas (Figure 8), indicating the for-mation of rust phases through the corrosion process [18, 102, 127]. On contrary, at higherinitial NaCl concentrations, the final pattern exhibited a more uniform deposition over thecomplete footprint droplet area, as illustrated in Figure 9. We observed a pronounced salt-ringat the droplet edge as well as many NaCl crystals in the droplet center. In addition, the entirefootprint region of the initially deposited droplet appeared yellowish/dark brown (Figure9), revealing the occurrence of corrosion under the evaporating salty sessile droplet. It isinteresting to notice that increasing the relative humidity from 0 to 40% has a minor impacton the final structures obtained at the very last stage of evaporation (Figure 7). Even if froma droplet science viewpoint, the environmental relative humidity had no influence on thenormalized evaporation rate (Figure 6), from a corrosion viewpoint, one must remember thata high-humidity environment leads to an increase of the exposure time of a sessile droplet onthe iron substrate.
Figure 8 – Microscopy image of an iron surface, onto which an aqueous sessile droplet from 10−3M NaCl wasdeposited (V0 = 10µl, θ0 = 10.5), after complete evaporation with a relative humidity RH of 40% at T = 23C.The two insets show SEM micrographs of two different locations on iron corroded under evaporating 10−3M NaClsessile droplets: A. at the droplet edge and B. in the droplet center. SEM analysis was carried out on dried ironsurfaces after experiment and after removing of the products formed.
Morphological analysis of the products formed on iron under evaporating sessile dropletsfrom aqueous NaCl solutions was carried out through SEM for the different observed dropletareas. The two insets in Figures 8 and 9 show the resulting morphologies, after complete evap-oration, before and after removal of the different products formed, at two different locationson the iron surface: at the droplet edge and in the droplet center. As presented in Figure8.A, we observed at the droplet edge circular clusters made of a prolific flowery-like structuresurrounded with similar patterned deposits. As mentioned in the third part of this thesis(see III.2.1), this is the characteristic morphology of lepidocrocite [130, 131], an iron hydroxideoriginating from the reaction between the ferrous ions and the dissolved oxygen [127, 132, 133].
108 2. Evaporating Sessile Droplets from NaCl Solutions induced Iron Corrosion
After removal of the corrosion products, SEM analysis shows some pits with a diameter of atleast 10-microns over the droplet edge region. In the central area of the droplet, no corrosionproducts or pits were observed.
Figure 9 – Microscopy image of an iron surface, onto which an aqueous sessile droplet from 1M NaCl was deposited(V0 = 10µl, θ0 = 15.2), after complete evaporation with a relative humidity RH of 40% at T = 23C. The two insetsshow SEM micrographs of two different locations on iron corroded under evaporating 1M NaCl sessile droplets: A.at the droplet edge and B. in the droplet center. SEM analysis was carried out on dried iron surfaces after experimentand after removal of the products formed.
Figure 9 reveals that the resulting morphologies after complete evaporation of a sessiledroplet from 1M NaCl on an iron sample in air is the same over the complete footprint dropletarea. SEM analysis shows NaCl crystals enclosed by rust phase, most likely lepidocrocite,as well as circular clusters of ferrous hydroxide, that we have already observed at low NaClconcentrations on iron surfaces (Figure 8.A). The edge of the footprint droplet area is depictedin Figure 9.A with a dotted line. After cleaning we observed the presence of several pits inthe iron surface with a diameter of at least 20-microns over the entire footprint region ofthe initially deposited sessile droplet. It is interesting to note, that compared to the roundedpits formed under stationary sessile salty droplets, we observed elongated pits in the case ofdroplet evaporation. This may arise from the rolling of the iron surface or from the presenceof a flow field inside the evaporating droplet (see IV.1) [18, 157, 158].
The evaporation of sessile droplets from aqueous NaCl solutions initially deposited ontoiron surfaces in synthetic air environment induced pitting corrosion of the metal. The locali-sation of the pits strongly depends on the initial NaCl concentration within the sessile saltydroplet. They were observed in the vicinity of the droplet edge at low salt concentrations,but over the entire footprint of the initially deposited droplet for higher salt concentrations.Experiments performed with droplets with different sizes (droplet radius ranging between 25and 58 mm) or at different relative humidities RHs from 0 to 60% (Figure 7) in the surroundingair droplet environment confirmed the spatial distribution of the different corrosion and saltproducts as well as pits over the iron sample. Our observations indicate a strong influence ofNaCl concentration on the observed corrosion phenomenon.
The initial (and visual) development of the corrosion phenomenon was investigated by ob-serving the temporal evolution of the top and side aspects of a sessile droplet from aqueoussaline solution during its evaporation on iron surface. Figures 10 and 11 show the (visual) ini-tiation of the corrosion process induced, if a sessile droplet from 10−3M NaCl (Figure 10) and1M NaCl (Figure 11) is evaporated on iron samples, in humid air with RH 40% at T = 23C.
A sequence of four frames are presented in each figure. Figure 10 shows a time span of2000 s. It was recorded 50 s after the droplet deposition, i.e., long after the droplet had initiallyspread to its final perimeter and the three-phase contact line was pinned in this position. Oncontrary Figure 11 shows a time span of 1500 s. At the right of each sequence of Figures 10 and
Part IV: Corrosion of Iron under Evaporating Sessile Droplets from Sodium Chloride Solutions 109
11 is depicted the sessile droplet height profile as it was recorded from the side view camera(and also used for the determination of the droplet shape for its volume measurement). Themain part of each image shows the simultaneous top view image of the evaporating sessiledroplet. In the top view image, changes in the brightness between the droplet perimeter andits central parts occur inevitably according to ray optics, when the evaporation experiment isperformed in the experimental setup (see II.1.1). The droplet perimeter appears dark, since thelight is diffracted out of the optical path, whereas the central parts appear brighter due to thedirect reflection off the liquid-vapour interface. These changes in brightness can be translatedinto local surface inclination. As the contact angle decreases during the pinned droplet evapo-ration, the changes in brightness in the top aspect over the footprint droplet area are reduced.In addition the dark dots or areas appearing within the evaporating sessile droplet in the topview imaging reflect the formed corrosion products. In each figure, the first observed corrosionphenomenon inside the drying droplet is marked with red circles.
Figure 10 – Visual observation of the corrosion process induced, when a sessile droplet from 10−3M NaCl (with aninitial volume of 10µl and contact angle of 10.5) evaporates on an iron surface, in humidified air with 40% RH atT = 23C. The sequence of frames shows a time span of 2000 s starting 50 s after the droplet deposition. The mainpart of the images depicts a top view of the evaporating sessile droplet. The corrosion products show up as dark dotsor areas within the drying droplet. The red circle identifies the first observed corrosion phenomenon. At the right ofthe sequence is illustrated the simultaneous droplet height profile.
Figure 10 reveals the first formation of corrosion products and most likely visible and stablepits 1500 s after the deposition of the sessile droplet initially containing 10−3M NaCl. As illus-trated in the second image, at this given evaporation time, the corrosion products and hencethe pits appeared at the three-phase contact line region. In the third image, i.e., t = 1750 safter droplet deposition, other dark dots show up in the vicinity of the droplet edge region andappear clearly at the end of the evaporation process, in the last image. Over the evaporationprocess, the droplet height, and by extrapolation its volume decrease as illustrated in the sideview inset in Figure 10. This induces a global salt enrichment within the evaporating sessiledroplet. We determined the critical global salt concentration c∗ at which the first stable andvisible pits appeared in the iron surface as follows:
c∗ =c0 V0
V∗ (1)
with V∗ the sessile droplet volume at which a visible corrosion phenomenon starts under anevaporating sessile droplet containing an initial NaCl concentration c0 and with an initial vol-ume V0. We found an unique value of the critical global salt concentration for all evaporationsof sessile droplets from 10−3M NaCl on iron samples in synthetic air environment at different
110 3. Discussion and Outlook
relative humidities and for larger droplet sizes: c∗ = 7.5± 0.2 · 10−3M NaCl. The changes inbrightness in the top aspect of the sessile droplet may alter the precise determination of c∗.Nevertheless, the c∗ value that we determined is in good agreement with the literature wherethis parameter, well-known as critical chloride concentration, ranges from 10−4 to 3·10−3M forpure iron in similar experimental conditions (i.e., pH ≈ 5-6 and T = 20C) [159, 160]. In theend, when a sessile droplet initially containing 10−3M NaCl evaporates, pitting corrosion startsnear the contact line as soon as the critical global salt concentration c∗ is reached (Figure 10.
When the initial NaCl concentration is higher, c0 = 1M NaCl, the observed corrosion phe-nomenon appears within the evaporating sessile droplet deposited on iron samples about lessthan 1 minute after its deposition, as illustrated in the first frame in Figure 11. Because c0 ishigher than the experimental value of c∗, this prompt corrosion initiation is not surprising. Sev-eral control experiments have been performed with salt concentrations between 10−3 and 1MNaCl, they validated that pitting corrosion is initiated as soon as the initial global concentrationis superior than c∗. The first visible dark dot showed up in the central area of the droplet. How-ever, the local surface inclination of the droplet can alter the precise determination of the firstlocation of the observed corrosion phenomenon. As the evaporation process occurred betweent = 50 and 1500 s, the formation of corrosion products over the entire footprint droplet area isenhanced: the central parts of the droplet became darker with time. Thus stable and visible pitswithin the drying droplet are formed in the iron surface for a global salt concentration higherthan c∗. As a consequence, salt concentration had an impact on the initiation of the observedpitting corrosion induced by the evaporation of sessile droplets from aqueous saline solution.This will be explained in the discussion section.
Figure 11 – Visual observation of the corrosion process induced when a sessile droplet from 1M NaCl (with aninitial volume of 10µl and contact angle of 15.2) evaporates on an iron sample, in humidified air with 40% RH atT = 23C. The sequence of frames shows a time span of 1500 s starting 50 s after the droplet deposition. The mainpart of the images depicts a top view of the evaporating sessile droplet. The corrosion products show up as dark dotsor areas within the drying droplet. The red circle identifies the first observed corrosion phenomenon. At the right ofthe sequence is illustrated the simultaneous droplet height profile.
3 Discussion and Outlook
Here we investigated the evaporation of sessile droplets from aqueous sodium chloride so-lutions on planar and horizontal iron surfaces. The evaporation experiments were performedover six decades of initial NaCl concentrations, with various surrounding gaseous phase en-vironments (high-purity nitrogen and air) and at different relative humidities varying from 0to 60%. Within the limit of our parameters variations, we found that (oxygenated) air environ-
Part IV: Corrosion of Iron under Evaporating Sessile Droplets from Sodium Chloride Solutions 111
ment (Figure 7) and a quite low (global) salt concentration are the main ingredients to observecorrosion under evaporating sessile droplets from aqueous NaCl solutions. An oxygen freeenvironment prevented the corrosion process (Figure 7). The environmental condition did notalter the occurrence of the corrosion process (Figures 7, 8 and 9) as well as the critical chlorideconcentration value c∗.
Quantitative and qualitative analysis on the evaporation experiments on iron samples wasperformed by determining the evaporation behaviour, the compositional evolution and the pin-ning behaviour of sessile salty droplets, and by characterizing the observed corrosion process.Our experimental results prompt one main question: how does the initial salt concentrationinfluence the formation and distribution of the corrosion phenomenon induced on iron sur-faces exposed to evaporating sessile droplets from aqueous NaCl solutions? In contrast to thesimple, generally accepted Evans droplet model (Figure 12.a), the evaporation of pinned saltydroplets (Figure 5) causes a local salt enrichment inside the drying droplet. The local NaClenrichment/precipitation on the metal surface reduces the solubility of oxygen in the transientconcentrated electrolyte solution, as an increase in NaCl concentration leads to a substantialdecrease in oxygen solubility. The solubility of oxygen in saturated sodium chloride solution(6.1M NaCl) is about 0.3x10⁻³M compared to 1.4x10⁻³M for low concentration (≥ 0.1M) NaClsolution at T = 22C [149]. Therefore, as the sessile salty droplet evaporates, the transient andlocal salt enrichment enhances there the depletion of oxygen at the electrolyte-metal interface.
The local chloride ion (salt) enrichment within the evaporating sessile droplet will promotethe initiation of corrosion. Figures 8 and 9 reveal that the location of the observed corrosionprocess (i.e., the observed corrosion products and pits formed) after complete evaporation iscorrelated to the structure of the drying stains as depicted in Figure 7. The compositional evo-lution inside the drying salty droplets as well as the properties of the deposits are the result ofthe evaporation-induced Marangoni and capillary flows inside the sessile salty droplet placedon iron samples (Figures 12.b and c.). The general evaporation behaviour, the resulting flowpattern and the subsequent local deposition/precipitation of salt for sessile salty droplets oniron surfaces, is identical to that on silicon wafers, fully described in the second part of thisthesis (Figure 6). Therefore the spatial distribution of the salt within the drying sessile dropletsfrom NaCl solutions governs the localisation of the anodic and cathodic activities over the ini-tially footprint droplet area.
At low initial NaCl concentrations, c0 = 10−3M NaCl, pitting corrosion starts near thecontact line as soon as the critical global chloride concentration is reached (Figure 8) The pe-ripheral evaporative salt enrichment provides localisation of the anodic (pits) reactions andcathodic protection to the rest of the droplet surface and in particular, in the central part of thedroplet over the evaporation process. As a consequence, during the evaporation exposure ofsessile droplets from low concentrated NaCl solution, an inversion of the classical stationaryEvans droplet scenario occurs as illustrated in Figure 12.c. On contrary, at high initial NaClconcentrations, c0 = 1M NaCl, there is not a distinctive localisation of anode and cathode atthe electrolyte-metal interface as promoted by the Evans droplet model [18], since c0 is abovethe critical pitting chloride concentration and the evaporation leads a more uniform salt en-richment over the footprint area of the droplet on the iron surface (Figure 7). Thus, anodicdissolution and cathodic reduction occur regardless of where it is positioned within the evap-orating sessile droplet. Principally, where local variations in chloride ions concentration occurinside the drying NaCl droplet, pitting dissolution is established, while cathodic reactions takeplace in areas surrounding this anodic activity as schematically illustrated in Figure 12.c. Thissuggests that in the case of evaporating sessile salty droplets, oxygen depletion is not the pri-mary determining corrosion-step for the localisation of anodic and cathodic areas but for the
112 3. Discussion and Outlook
initiation of the anodic process, when a critical chloride concentration is obtained to initiateiron corrosion. As a result, the spatial distribution of the salt inside the evaporating sessiledroplet, which is influenced by the initial salt concentration in the droplet bulk, is correlatedto the localisation of the anodic and cathodic reactions at the electrolyte-metal interface, overthe footprint droplet area.
Figure 12 – Schematic side views of the sessile droplet from NaCl aqueous solution deposited on an iron substratein air. a. The classical Evans droplet model under a sessile droplet from NaCl solution: the oxygen is reduced atthe droplet edge, acting as the cathode whereas the iron dissolution occurs in the droplet center acting as the anode.b. At a low initial salt concentration, c0 = 10−3M NaCl, the peripheral enrichment promoted by the evaporation-induced capillary and Marangoni flows causes an inversion of the Evans droplet model as soon as the critical globalsalt concentration c∗ is reached: the anode is established near the contact line providing cathodic protection in thecentral part of the drying sessile droplet. c. On contrary, at a higher initial NaCl concentration, c0 = 1M, which isby above to the experimental value of c∗, the local variations in chloride ion concentration promoted by circulatingevaporation-induced capillary and Marangoni flows, induces the occurrence of locally anodic and cathodic activitiesall over the iron surface at the metal-electrolyte interface.
Another remarkable result of this experimental study of the corrosion process under evap-orating sessile droplets from NaCl solutions is the observed critical global salt concentrationc∗, at which visible and stable pits were formed. It is interesting though that the formationof visible and stable pits occurs already at quite low global salt concentration. This chloridethreshold value indicates that the corrosion potential Ecorr, at which the rate of oxygen re-duction is equal to the rate of iron dissolution (see II.3.5), is higher than the pitting potentialEpit at which stable pits can form. Epit is a linear function of the logarithm of the chlorideion concentration c: it decreases as c increases [44]. Therefore, assuming in first approximationthat Ecorr is almost constant in our studied case, when the salt concentration within the drying
Part IV: Corrosion of Iron under Evaporating Sessile Droplets from Sodium Chloride Solutions 113
NaCl droplet reaches c∗, stable pitting corrosion occurs. It is worth noting that Epit is not onlydependent on the chloride concentration but also on other factors such as pH or temperature.
To conclude, we demonstrated in this part that the evaporation behaviour of sessile dropletsfrom aqueous NaCl solutions on iron samples is quite complex. It is less straightforward thanwith silicon wafers since in air corrosion alters in addition the overall evaporation profile. Thespatial distribution of the salt over the footprint droplet area as well as its global concentra-tion within the evaporating droplet have an impact on the location of the anodic and cathodicactivities. These processes are independent of the relative humidity in the surrounding air en-vironment.
To better elucidate the "necessary" conditions to induce corrosion of iron exposed to evap-orating sessile droplets from aqueous saline solutions, further experiments should include amore detailed investigation on the influence of (initial) salt concentration inside the droplet,and particularly the spatial-temporal evolution of the localized NaCl concentration. This willallow to gain insight into the critical chloride concentration value. The role of the gaseousphase environment should be investigated with mixtures of oxygen and nitrogen. From anevaporation viewpoint, it will be interesting to figure out the (universal) evaporation equationfor sessile salty droplets deposited on "reactive" surfaces.
Summary and Conclusion
When a sessile droplet from an aqueous saline solution evaporates on an inert surface, itleaves behind a stain of salt. In order to either prevent or to be able to control and use thepatterns formed by such naturally ubiquitous drying droplets, one needs to understand thebasic physics and chemistry of evaporating sessile salty droplets and their internal flow.In the second part of this thesis, we focused on the fundamentals of droplet evaporation,evaporation-driven flows inside the drying droplet, and the subsequent particle transport anddeposition/precipitation.
In Chapter 2 we studied the evaporation of pure water droplets on silicon wafers. On thesesubstrates, the pure water droplet retains a constant shape with a decreasing footprint area.Hence the evaporation can occur in the unpinned, constant contact angle mode. We found thatthe evolution of the rate of droplet (normalized) volume change is accurately described bya quasi-static, diffusion-driven evaporation model from Picknett and Bexon [3] for the entirerange of relative humidities (0-80%), contact angles (1-40) and initial droplet volumes (1-10µl). Therefore, the evaporation of macroscopic droplets from pure water is controlled by thediffusion of the water vapour phase in the surrounding atmosphere.
In Chapter 3 we presented a detailed study on the evaporation behaviour of sessile dropletsof aqueous sodium chloride (NaCl) solutions on inert surfaces. Quantitative evaporation ex-periments were performed over eight decades of initial NaCl concentrations, with variouscontact angles between nearly complete wetting and about 50, with various initial dropletvolumes ranging from 1 to 10 µl and at different relative environmental humidities varyingfrom 0 to 60%. We have shown that already very low salt concentrations lead to a pinning ofthe three-phase contact line within the limits of our parameter variations. Whereas dropletswith initial concentration ≥ 10−6M NaCl are pinned as soon as evaporation starts, dropletswith lower salt concentration do evaporate in constant contact angle mode.
In addition, we analysed the influence of each experimental parameter on the evaporationrate following the well-accepted theoretical description of the diffusion-controlled evaporationof sessile droplets from pure water. To this end step-by-step the experimentally measuredobserved droplet geometries (volume, contact angle) and the liquid composition were scaledaccording to the theoretical approach such, that all the (normalized) data should result in asingle, universal, unit-free initial volume evaporation rate. For the influence of the salt concen-tration on the vapour saturation pressure a uniform salt distribution within the droplet wasassumed.
We have shown that at low salt concentrations or for high contact angles, the evaporationof sessile droplets from aqueous saline solutions occurs in a universal way based on the knownscenario of a non-uniformity along the droplet surface of the evaporative flux diffusing fromthe free droplet surface into the surrounding environment. The singularity of the evaporativeflux at the droplet edge drives an outward capillary (volume) flow towards the contact line [1]which leads to salt enrichment in this peripheral region.
For initial salt concentrations higher than 0.5M NaCl and contact angles smaller than20, the universal evaporation rate can no longer be applied and the flow structure becomes
115
116 Summary and Conclusion
more complicated. We observed convection rolls near the droplet periphery. The evaporation-induced constitutional gradients resulting from the locally non-uniform evaporative flux fromthe droplet surface induces surface tension gradients on the liquid-air interface, generatingMarangoni stresses. In the case of NaCl solutions the resulting Marangoni flow adds tothe evaporation-driven flow and causes an additional salt enrichment near the contact line.Ultimately the capillary pressure increases near the contact line, provoking henceforth anadditional compensating capillary flow from the droplet edge to its center. This means thatthe Marangoni effect significantly alters the flow field inside the drying droplet that in turnchanges the evaporation behaviour of the sessile salty droplet.
The nature of the flow field inside the evaporating droplet also determined the patterns ofthe salty stains/deposits, that is formed during the drying and appear at the end of the waterevaporation. We identified three different regimes of crystal depositions within the range ofover six orders of magnitude of initial salt concentrations that were investigated.
In the particular case the sessile droplet of salt solution is deposited on planar iron sur-faces under atmospheric conditions, the electrolyte solution within the droplet reacts with thesurface, leading to differential aeration corrosion phenomenon. In the classical Evans dropletmodel [18], the cathodic reaction occurs at the droplet edge since there the diffusion pathlength of oxygen from the environmental vapour phase to the iron-saline solution interface isthe shortest. The corresponding anode is established at the iron-electrolyte solution interface,close to the droplet center, where oxygen is deficient. In Part III we considered the spatial-temporal evolution of sessile droplets from aqueous saline solutions on iron surfaces, whichwere subjected to isohumidity exposure, at the equilibrium (deliquescence) relative humidityof the salt solution. In our experiments, in contrast to this simple, generally accepted Evansdroplet model, we observed the formation and expansion of a peripheral film ahead of themacroscopic contact line.
Instead in Chapter 5 we found that the preferential oxygen reduction at the three-phasecontact line gives rise to a cation displacement from the sessile salty droplet bulk through the"diffusive" peripheral film. The formation of this peripheral film and the corrosion behaviourhave been investigated for various salt concentrations and ion species in Chapter 6. We foundthat the corrosion rate (i.e., the rate of weight loss of iron substrate per droplet area unit)strongly depends on the initial chloride concentration within the sessile droplet but barely onits size. However, we demonstrated that the corrosion behaviour is mainly governed by thesurface tension of the electrolyte solution. This suggests that the simple Evans droplet modelhas to be modified significantly by taking into account a much more sophisticated contourof the droplet (liquid) surface in the droplet contact line region (peripheral film) and surfacetension related transport processes. Most likely, the peripheral film phenomenon is predom-inantly caused by the peripheral surface tension gradient and the resulting Marangoni flow.The three-phase contact line should be destabilized by surface tension (salt) gradients inducedby ionic composition changes during the course of the cathodic reaction and migration ofcations towards the droplet perimeter. At present, the details of the dynamical process are notyet entirely understood.
In the fourth part of this thesis, we considered an evaporating droplet of sodium chloridesolutions on iron. The evaporation experiments were performed over six decades of initialNaCl concentrations, with two different surrounding gaseous phase environments (i.e., inerthigh-purity nitrogen and synthetic air) and at different relative environmental humiditiesbetween 0 and 60%. A quite low (global) salt concentration within the drying droplet and
Summary and Conclusion 117
(oxygenated) air environment are the main ingredients to observe the corrosion phenomenonunder evaporating droplets of aqueous NaCl solutions. Similar to the evaporation on inertsurfaces studied in Chapter 3, we found that the evaporation shows a strong dependence oninitial salt concentration inside the drying droplet. By comparing our experimental evapora-tion study in inert gas to air environment, we identified and considered the salt-dependentevaporation-driven flow field within the drying sessile NaCl droplets.
We have shown that the observed corrosion phenomenon and in particular, the localisa-tion of the anodic and cathodic activities over the initial footprint droplet area is correlatedto the spatial distribution of the salt inside the evaporating sessile droplet. This process isindependent of the relative humidity in the surrounding air environment. For a low initialNaCl concentration, the evaporative peripheral salt enrichment induces an inversion of theclassical stationary Evans droplet experiment. As a critical chloride concentration is reachedin the three-phase contact line region, the anode is established at the droplet edge whilst thecathodic reaction occurs away from the peripheral droplet area. On contrary, at higher initialNaCl concentration, the evaporative "uniform" salt enrichment leads to locally anodic andcathodic areas all over the iron surface under the drying droplet. Therefore by controlling theevaporation rate with the salt concentration but certainly also the droplet shape and size, andhence the internal flow, one can predict the localisation of the metal (pitting) corrosion underevaporating sessile salty droplets.
In the present work, we have shown that salt concentration gradients inside sessile dropletscontrol the evaporation rate, the internal fluid flow, the subsequent deposition patterns formedat the end of the evaporation but also the corrosion behaviour under "stationary" and evap-orating sessile salty droplets and the subsequent anode/cathode localisation at the salinesolution-metal interface. In this thesis, we have mainly been concerned with evaporating sessiledroplets. An interesting direction for future research is to study repetitive humidity cycles, i.e.,evaporation-condensation, of the sessile droplet, distinctive feature of the atmospheric diurnalconditions (i.e., day/night alternating): hoes do evolve the salt concentration gradients withinthe sessile droplet subject to climatic changes?
Bibliography
[1] R. D. Deegan, O. Bakajin, T. F. Dupont, G. Huber, S. R. Nagel, and T. A. Witten. Capillaryflow as the cause of ring stains from dried liquid drops. Nature, 389:827–829, 1997.
[2] J. C. Maxwell. Diffusion. In W.D. Niven, editor, The Scientific Papers of James Clark Maxwell.Cambridge University Press, 1980.
[3] R. G. Picknett and R. Bexon. The Evaporation of Sessile or Pendant Drops in Still Air.Journal of Colloid and Interface Science, 61:336–350, 1977.
[4] S. M. Rowan, M. I. Newton, and G. McHale. Evaporation of Microdroplets and theWetting of Solid Surfaces. The Journal of Physical Chemistry, 99:13268–13271, 1995.
[5] J. Eggers and L. M. Pismen. Nonlocal description of evaporating drops. Physics of Fluids,22:112101, 2010.
[6] G. J. Dunn, S. K. Wilson, B. R. Duffy, S. David, and K. Sefiane. A mathematical modelfor the evaporation of a thin sessile liquid droplet: Comparison between experiment andtheory. Colloids and Surfaces A: Physicochemical and Engineering Aspects, 323:50–55, 2008.
[7] H. Hu and R. G. Larson. Evaporation of a sessile droplet on a substrate. Journal of PhysicalChemistry B, 106:1334–1344, 2002.
[8] H. Hu and R. G. Larson. Analysis of the Effects of Marangoni Stresses on the Microflowin an Evaporating Sessile Droplet. Langmuir, 21:3972–3980, 2005.
[9] Y. O. Popov. Evaporative deposition patterns: Spatial dimensions of the deposit. PhysicalReview E, 71:036313, 2005.
[10] R. D. Deegan, O. Bakajin, T. F. Dupont, G. Huber, S. R. Nagel, and T. A. Witten. Contactlines deposits in an evaporating drop. Physical Review E, 62:756–765, 2000.
[11] H. Gelderblom, O. Bloemen, and J. H. Snoeijer. Stokes flow near the contact line of anevaporating drop. Journal of the Fluid Mechanics, 709:69–84, 2012.
[12] E. Bormashenko, Y. Bormashenko, R. Pogreb, O. Stanevsky, and G. Whyman. Dropletbehavior on flat and textured surfaces: Co-occurence of Deegan outward flow withMarangoni solute instability. Journal of Colloid and Interface Science, 306:128–132, 2007.
[13] T. Still, P. J. Yunker, and A. G. Yodh. Surfactant-Induced Marangoni Eddies Alter theCoffee-Rings of Evaporating Colloidal Drops. Langmuir, 28:4984–4988, 2012.
[14] W. Sempels, R. De Dier, H. Mizuno, J. Hofkens, and J. Vermant. Auto-production ofbiosurfactants reverses the coffee ring effect in a bacterial system. Nature Communications,4:1757, 2013.
[15] E. Senses, M. Black, T. Cunningham, S. A. Sukhishvili, and P. Akcora. Spatial Orderingof Colloids in a Drying Aqueous Polymer Droplet. Langmuir, 29:2588–2594, 2013.
119
120 Bibliography
[16] T. A. H. Nguyen, M. A. Hampton, and A. V. Nguyen. Evaporation of NanoparticleDroplets on Smooth Hydrophobic Surfaces: The Inner Coffee Ring Deposits. The Journalof Physical Chemistry C, 117:4707–4716, 2013.
[17] S. Semenov, A. Trybala, H. Agogo, N. Kovalchuk, F. Ortega, R. G. Rubio, V. M. Starov, andVelarde M. G. Evaporation of Droplets of Surfactant Solutions. Langmuir, 29:10028–10036,2013.
[18] U. R. Evans. The Ferroxyl Indicator in Corrosion Research, With Special Reference to theControversy Regarding the Cause of Pitting. The Metal Industry, 11:481–508, 1926.
[19] C. Chen and F. Mansfeld. Potential Distribution in the Evans Drop Experiment. CorrosionScience, 39:409–413, 1997.
[20] B. Maier and G. S. Frankel. Pitting Corrosion of Bare Stainless Steel 304 under ChlorideSolution Droplets. Journal of the Electrochemical Society, 157:C302–C312, 2010.
[21] Y. Tsutsumi, A. Nishikata, and T. Tsuru. Pitting corrosion mechanism of Type 304 stain-less steel under a droplet of chloride solutions. Corrosion Science, 49:1394–1407, 2007.
[22] I. S. Cole, T. H. Muster, S. A. Furman, N. Wright, and A. Bradbury. Products Formedduring the Interaction of Seawater Droplets with Zinc Surfaces: I. Results from 1- and 2.5Day Exposures. Journal of the Electrochemical Society, 155:C244–C255, 2008.
[23] J. F. Li, B. Maier, and G. S. Frankel. Corrosion of an Al-Mg-Si alloy under MgCl2 solutiondroplets. Corrosion Science, 53:2142–2151, 2011.
[24] Y. Wang, W. Wang, Y. Liu, L. Zhong, and J. Wang. Study of localized corrosion of 304
stainless steel under chloride solution droplets using the wire beam electrode. CorrosionScience, 53:2963–2968, 2011.
[25] T. H. Muster, A. Bradbury, A. Trinchi, I. S. Cole, D. Lau, S. Dligatch, A. Bendavid, andP. Martin. The atmospheric corrosion of zinc: The effects of salt concentration, dropletsize and droplet shape. Electrochimica Acta, 56:1866–1873, 2011.
[26] S. C. Morton and G. S. Frankel. Atmospheric pitting corrosion of AA7075-T6 underevaporating droplets with and without inhibitors. Materials and Corrosion, 65:351–361,2014.
[27] G. El-Mahdy, M. Abdel-Reheem, O. M. El-Roudi, A. M. Atta, Z. Issa, and H. A. Al-Lohedan. Assessment of Salt and Acid Droplets Evaporations on the Corrosion Mecha-nism of Aluminum. International Journal of Electrochemical Science, 10:6392–6404, 2015.
[28] N. S. Azmat, K. D. Ralston, B. C. Muddle, and I. S. Cole. Corrosion of Zn under acidifiedmarine droplets. Corrosion Science, 53:1604–1615, 2011.
[29] R. Wang and M. Kido. Corrosion Behavior of Pure Iron by Different Droplet Volume ofSulfuric Acid Solution. Materials Transactions, 48:1451–1457, 2007.
[30] S. Thomas, I. S. Cole, and N. Birbilis. Compact Oxides Formed on Zinc during Exposureto a Single Sea-Water Droplet. Journal of the Electrochemical Society, 160:C59–C63, 2013.
[31] P.-G. De Gennes. Wetting: Statics and Dynamics. Reviews of Modern Physics, 57:827–863,1985.
Bibliography 121
[32] P.-G. De Gennes, F. Brochart-Wyart, and D. Quéré. Capillary and Wetting Phenomrisena:Drops, Bubbles, Pearls, Waves. Springer, 2003.
[33] T. Young. An essay on the Cohesion of Fluids. Philosophical Transactions of the Royal Societyof London, 95:65–86, 1805.
[34] A. M. Cazabat, N. Fraysse, and F. Heslot. Thin wetting films. Colloids and Surfaces, 52:1–8,1991.
[35] D. Bonn, J. Eggers, J. Indekeu, J. Meunier, and E. Rolley. Wetting and spreading. Reviewof Modern Physics, 81:307–313, 2009.
[36] M. N. Popescu, G. Oshanin, S. Dietrich, and A.-M. Cazabat. Precursor films in wettingphenomena. Journal of Physics: Condensed Matter, 24:243102, 2012.
[37] B. V. Derjaguin. Disjoining Pressure. In N. V. Churaev, B. V. Derjaguin, and V. M. Muller,editors, Surface Forces. Springer, 1987.
[38] J. N. Israelachvili. Intermolecular and Surface Forces. Academic Press, 2011.
[39] G. Jones and W. A. Ray. The Surface Tensions of Solutions of Electrolytes as a Functionof the Concentration. I. A Differential Method for Measuring Relative Surface Tension.Journal of the American Chemical Society, 59:187–198, 1937.
[40] G. Jones and W. A. Ray. The Surface Tensions of Solutions of Electrolytes as a Functionof the Concentration. II. Journal of the American Chemical Society, 63:288–294, 1941.
[41] K. D. Collins and M. W. Washabaugh. The Hofmeister effect and the behavior of waterat interfaces. Quaterly Reviews of Biophysics, 18:323–422, 1985.
[42] P. K. Weissenborn and R. J. Pugh. Surface Tension and Bubble Coalescence Phenomenaof Aqueous Solutions of Electrolytes. Langmuir, 11:1422–1426, 1995.
[43] W. Kunz. Specific Ion Effects. World Scientific Publishing, 2009.
[44] Y. Marcus. Surface Tension of Aqueous Electrolytes and Ions. Journal of Chemical &Engineering Data, 55:3641–3644, 2010.
[45] R. L. Baldwin. How Hofmeister ion interactions affect protein stability. Biophysical Journal,71:2056–2063, 1996.
[46] T. Arakawa and S. N. Timasheff. Mechanism of protein salting in and salting out bydivalent cation salts: balance between hydratation and salt binding. Biochemistry, 23:5912–5923, 1984.
[47] T. Arakawa. Thermodynamic analysis of the effect of concentrated salts on protein in-teraction with hydrophobic and polysaccharide columns. Archives of Biochemistry andBiophysics, 248:101–105, 1986.
[48] Ulrich J. Curtis, R. A., J. M. Prausnitz, and H. W. Blanch. Protein-Protein Interactions inConcentrated Electrolyte Solutions - Hofmeister Series Effects. Biotechnology and Bioengi-neering, 79:367–380, 2002.
[49] W. M. Cox and J. H. Wolfenden. Viscosity of strong electrolytes measured by a differentialmethod. Proceedings of the Royal Society of London A., 145:475–488, 1934.
122 Bibliography
[50] G. W. J. Stewart. The Variation in the Structure of Water in Ionic Solutions. The Journal ofChemical Physics, 7:869–877, 1939.
[51] H. S. Franck and M. W. J. Evans. Free volume and entropy in condensed systems. TheJournal of Chemical Physics, 13:507–532, 1945.
[52] R. Zangi. Can Salting-In/Salting-Out Ions be Classified as Chaotropes/Kosmotropes?The Journal of Physical Chemistry B, 114:643–650, 2010.
[53] A. M. Cazabat and G. Guéna. Evaporation of macroscopic sessile droplets. Soft Matter,6:2591–2612, 2010.
[54] N. Murisic and L. Kondic. On evaporation of sessile drops with moving contact lines.Journal of Fluid Mechanics, 679:219–246, 2011.
[55] H. Hu and R. G. Larson. Drying a sessile droplet: Imaging and analysis of transportand deposition patterns. In Z. Lin, editor, Evaporative Self-Assembly of Ordered ComplexStructures. World Scientific Publishing Company, 2012.
[56] N. A. Fuchs. Evaporation and Droplet Growth in Gaseous Media. Pergamon Press, 1959.
[57] C. Bourges-Monnier and M. E. R. Shanahan. Influence of evaporation on contact angle.Langmuir, 11:2820–2829, 1995.
[58] G. McHale, S. M. Rowan, M. I. Newton, and M. K. Banerjee. Evaporation and the Wettingof a Low-Energy Solid Surface. Journal of Physical Chemistry B, 102:1964–1967, 1998.
[59] H. Song, Y. Lee, S. Jin, H.-Y. Kim, and J. Y. Yoo. Prediction of sessile drop evaporationconsidering surface wettability. Microelectronic Engineering, 88:3249–3255, 2011.
[60] K. S. Birdi, D. T. Vu, and A. A. Winter. A Study of the Evaporation Rates of Small WaterDrops Placed on a Solid Surface. The Journal of Physical Chemistry, 93:3702–3703, 1989.
[61] H. Y. Erbil. Determination of the Peripheral Contact Angle of Sessile Drops on Solidsfrom the Rate of Drop Evaporation. The Journal of Physical Chemistry B, 102:9234–9238,1998.
[62] H.-Z. Yu, D. M. Soolaman, A. W. Rowe, and J. T. Banks. Evaporation of Water Micro-droplets on Self-Assembled Monolayers: From Pinning to Shrinking. A European Journalof Chemical Physics and Physical Chemistry, 5:1035–1038, 2004.
[63] X. Fang, B. Li, E. Petersen, Y. Ji, J. C. Sokolov, and M. H. Rafailovich. Factors Controllingthe Drop Evaporation Constant. The Journal of Physical Chemistry B, 109:20554–20557,2005.
[64] R. W. Coutant and E. C. Penski. Experimental Evaluation of Mass Transfer from SessileDrops. Industrial & Engineering Chemistry Fundamentals, 21:250–254, 1982.
[65] H. Y. Erbil, G. McHale, and M. I. Newton. Drop Evaporation on Solid Surfaces: ConstantConstant Angle Mode. Langmuir, 18:2636–2641, 2002.
[66] C. Liu, E. Bonaccurso, and H.-J. Butt. Evaporation of sessile water/ethanol drops in acontrolled environment. Physical Chemistry Chemical Physics, 10:7150–7157, 2008.
Bibliography 123
[67] S. David, K. Sefiane, and L. Tardiest. Experimental investigation of the effect of thermalproperties of the substrate in the wetting and evaporation of sessile drops. Colloids andSurfaces A: Physicochemical and Engineering Aspects, 298:108–114, 2007.
[68] G. J. Dunn, S. K. Wilson, B. R. Duffy, S. David, and K. Sefiane. The strong influence ofsubstrate conductivity on droplet evaporation. Journal of Fluid Mechanics, 623:329–351,2009.
[69] N. Shahidzadeh-Bonn, S. Rafai, A. Azouni, and D. Bonn. Evaporating droplets. Journalof Fluid Mechanics, 549:307–313, 2006.
[70] G. Guéna, C. Poulard, and A. M. Cazabat. The leading edge of evaporating droplets.Journal of Colloid and Interface Science, 312:164–171, 2007.
[71] V. A. Kaya, D.and Belyi and M. Muthukumar. Pattern formation in drying droplets ofpolyelectrolyte and salt. The Journal of Chemical Physics, 133:114905, 2010.
[72] D. Brutin, B. Sobac, B. ans Loquet, and J. Sampol. Pattern formation in drying drops ofblood. Journal of Fluid Mechanics, 667:85–95, 2011.
[73] R. D. Deegan. Pattern formation in drying drops. Physical Review E, 61:475–485, 2000.
[74] P. J. Yunker, T. Still, M. A. Lohr, and A. G. Yodh. Suppression of the coffee-ring effect byshape-dependent capillary interactions. Nature, 476:308–311, 2011.
[75] H. B. Eral, D. M. Augustine, M. H. G. Duits, and F. Mugele. Suppressing the coffee staineffect: how to control colloidal self-assembly in evaporating drops using electrowetting.Soft Matter, 7:1–5, 2011.
[76] L. E. Scriven and C. V. Sternling. The Marangoni Effects. Nature, 187:186–188, 1960.
[77] J. Thomson. On certain curious Motions observable at the Surface of Wine and otherAlcoholic liquors. Philosophical Magazine, 10:330–333, 1855.
[78] H. Hu and R. G. Larson. Marangoni Effect Reverses Coffee-Ring Depositions. The Journalof Physical Chemistry B, 110:7090–7094, 2006.
[79] W. D. Ristenpart, P. G. Kim, C. Domingues, J. Wan, and H. A. Stone. Influence of sub-strate conductivity on circulation reversal in evaporating drops. Physical Review Letter,99:234502, 2007.
[80] J. R. Trantum, Z. E. Eagleton, C. A. Patil, J. M. Tucker-Schwartz, M. L. Baglia, M. C. Skala,and F. R. Haselton. Cross-Sectional Tracking of Particle Motion in Evaporating Drops:Flow Fields and Interfacial Accumulation. Langmuir, 29:6221–6231, 2013.
[81] M. Majumber, C. S. Rendall, J. A. Eukel, J. Y. L. Wang, N Behabtu, C. L. Pint, T.-YLiu, A. W. Orbaek, F. Mirri, J. Nam, A. R. Barron, R. H. Hauge, H. K. Schmidt, andM. Pasquali. Overcoming the ”Coffee-Stain” Effect by Compositional Marangoni-Flow-Assisted Drop-Drying. The Journal of Physical Chemistry B, 116:6536–6542, 2012.
[82] F. Girard, M. Antoni, and K. Sefiane. On the Effect of Marangoni Flow on EvaporationRates of Heated Water Drops. Langmuir, 24:9207–9210, 2008.
[83] P. Takhistov and H.-C. Chang. Complex Stain Morphologies. Industrial & EngineeringChemistry Research, 41:6256–6269, 2002.
124 Bibliography
[84] M. Cachile, O. Benichou, and A. M Cazabat. Evaporating Droplets of Completely WettingLiquids. Langmuir, 18:7985–7990, 2002.
[85] M. Cachile, O. Benichou, C. Poulard, and A. M Cazabat. Evaporating Droplets. Langmuir,18:8070–8078, 2002.
[86] H. Bodiguel and J. Leng. Imaging the drying of a colloidal suspension. Soft Matter,6:5451–5460, 2010.
[87] D. Landolt. Corrosion et chimie de surfaces des métaux. Presses Polytechniques et Universi-taires Romandes, 1993.
[88] W. H. Ailor. Atmospheric Corrosion. John Wiley and Sons, 1982.
[89] P. A. Schweitzer. Fundamentals of Corrosion: Mechanisms, Causes, and Preventative Methods.CRC Press, 2010.
[90] Y. Tsutsumi, A. Nishikata, and T. Tsuru. Initial Stage of Pitting Corrosion of Type 304
Stainless Steel under Thin Electrolyte Layers Containing Chloride Ions. Journal of TheElectrochemical Society, 152:B358–B363, 2005.
[91] S. Hastuty, A. Nishikata, and T. Tsuru. Pitting corrosion of Type 430 stainless steel underchloride solution droplet. Corrosion Science, 52:2035–2043, 2010.
[92] N. D. Tomashov. Development of the Electrochemical Theory of Metallic Corrosion.Corrosion, 76:7t–14t, 1964.
[93] A. Nishikata, Y. Ichihara, Y. Hayashi, and T. Tsuru. Influence of Electrolyte Layer Thick-ness and pH on the Initial Stage of the Atmospheric Corrosion of Iron. Journal of TheElectrochemical Society, 144:1244–1252, 1997.
[94] P. B. Phipps and W. D. Rice. The Role of Water in Atmospheric Corrosion. In G. R.Brubaker and P. B. Phipps, editors, Corrosion Chemistry. American Chemical Society, 1979.
[95] L. Q. Guo, X. M. Zhao, Y. Bai, and L. J. Qiao. Water adsorption behavior on metalsurface and its influence on surface potential study by in situ SPM. Applied Surface Science,258:9087–9091, 2012.
[96] W. H. J. Vernon. A laboratory study of the atmospheric corrosion of metals. Part I.-The Corrosion of copper in certain synthetic atmospheres, with particular reference tothe influence of sulphur dioxide in air of various relative humidities. Transactions of theFaraday Society, 27:255–277, 1931.
[97] W. H. J. Vernon. A laboratory study of the atmospheric corrosion of metals. Part II.-Iron:the primary oxide film. Part III.-The secondary product or rust (influence of sulphurdioxide, carbon dioxide, and suspended particles on the rusting of iron). Transactions ofthe Faraday Society, 31:1668–1700, 1935.
[98] E. Schindelholz, B. E. Risteen, and R. G. Kelly. Effect of Relative Humidity on Corrosionof Steel under Sea Salt Aerosol Proxies. I. NaCl. Journal of the Electrochemical Society,161:C450–C459, 2014.
[99] E. Schindelholz, B. E. Risteen, and R. G. Kelly. Effect of Relative Humidity on Corro-sion of Steel under Sea Salt Aerosol Proxies. II. MgCl2, Artificial Seawater. Journal of theElectrochemical Society, 161:C460–C470, 2014.
Bibliography 125
[100] R. P. V. Cruz, A. Nishikata, and T. Tsuru. Pitting corrosion mechanism of stainless steelsunder wet-dry exposure in chloride-containing environments. Corrosion Science, 40:125–139, 1998.
[101] U. R. Evans. An Introduction to Metallic Corrosion. Edward Arnold, 1963.
[102] S. Li and L. H. Hihara. In situ Raman Spectroscopic Study of NaCl Particle-InducedMarine Atmospheric Corrosion of Carbon Steel. Journal of The Electrochemical Society,159:C147–C154, 2012.
[103] U. R. Evans and C. A. J. Taylor. Mechanism of atmospheric rusting. Corrosion Science,12:227–246, 1972.
[104] S. Karpitschka and H. Riegler. Quantitative Experimental Study on the Transition be-tween Fast and Delayed Coalescence of Sessile Droplets with Different but CompletelyMiscible Liquids. Langmuir, 26:11823–11829, 2010.
[105] S. Karpitschka and H. Riegler. Noncoalescence of droplets with different miscible liq-uids: Hydrodynamic analysis of the twin drop contour as self-stabilizing travelling wave.Physical Review Letter, 106:066103, 2012.
[106] S. Karpitschka and H. Riegler. Sharp transition between coalescence and non-coalescenceof sessile drops. Journal of Fluid Mechanics, 743:R1, 2014.
[107] S. Karpitschka, C. Hanske, A. Fery, and H. Riegler. Coalescence and noncoalescence ofsessile drops: impact of surface forces. Langmuir, 30:6826–6830, 2014.
[108] S. P. Pinho and E. A. Macedo. Solubility of NaCl, NaBr, and KCl in Water, Methanol,Ethanol, and Their Mixed Solvents. Journal of Chemical & Engineering Data, 50:29–32, 2005.
[109] E. B. Millard. The Vapor Pressure of Water and of Aqueous Solutions of Magnesium Sulphate,Magnesium Chloride and Sodium Chloride. Nabu Press, 2010.
[110] L. T. Zhuravlev. The surface chemistry of amorphous silica. Zhuravlev model. Colloidsand Surfaces A: Physicochemical and Engineering Aspects, 173:1–38, 2000.
[111] L. Greenspan. Humidity fixed points of binary saturated aqueous solutions. Journal ofResearch of the National Bureau of Standards, 81:89–96, 1977.
[112] N. H. Chen and D. F. Othmer. New Generalized Equation for Gas Diffusion Coefficient.Journal of Chemical & Engineering Data, 7:37–41, 1962.
[113] C. Bourgés-Monnier and M. E. R. Shanahan. Influence of Evaporation on Contact Angle.Langmuir, 18:2820–2829, 1995.
[114] D. S. Golovko, H.-J. Butt, and E. Bonaccurso. Transition in the Evaporation Kinetics ofWater Microdrops on Hydrophilic Surfaces. Langmuir, 18:75–78, 2009.
[115] S. M. Rowan, M. I. Newton, and G. McHale. Evaporation of Pure Liquid Sessile andSpherical suspended drops: A review. Advances in Colloid and Interface Science, 170:67–86,2012.
[116] J. I. Partanen and A. K. Covington. Re-Evaluation of the Thermodynamic Activity Quan-tities in Aqueous Sodium and Potassium Chloride Solutions at 25
c. Journal of ChemicalEngineering Data, 54:208–219, 2009.
126 Bibliography
[117] N. Shahidzadeh-Bonn, S. Rafaï, D. Bonn, and G. Wegdam. Salt Crystallization duringEvaporation: Impact of Interfacial Properties. Langmuir, 24:8599–8605, 2008.
[118] J. Desarnaud and N. Shahidzadeh-Bonn. Salt crystal purification by deliques-cence/crystallization cycling. A Letters Journal Exploring the Frontiers of Physics, 95:48002,2011.
[119] J. Kestin, E. Khalifa, and R. J. Correia. Tables of the Dynamic and Kinematic Viscosityof Aqueous NaCl Solutions in the Temperature Range 20-150
c and the Pressure Range0.1-35 MPa. Journal of Physical and Chemical Reference Data, 10:71–87, 1981.
[120] W. M. Haynes, editor. Handbook of Chemistry and Physics 93rd Edition. CRC Press, 2012.
[121] A. Apelblat. The vapour pressures of saturated aqueous lithium chloride, sodium bro-mide, sodium nitrate, ammonium nitrate, and ammonium chloride at temperatures from283 K to 313 K. The Journal of Chemical Thermodynamics, 25:63–71, 1993.
[122] R. Lindstrom, J.-E. Svensson, and L.-G. Johansson. The Atmospheric Corrosion of Zincin the Presence of NaCl. the Influence of Carbon Dioxide and Temperature. Journal of theElectrochemical Society, 147:1751–1757, 2000.
[123] R. Lindstrom, J.-E. Svensson, and L.-G. Johansson. The Influence of Salt Deposits on theAtmospheric Corrosion of Zinc. Journal of the Electrochemical Society, 149:B57–B64, 2002.
[124] A. K. Neufeld, I. S. Cole, A. M. Bond, and S. A. Furman. The initiation mechanism ofcorrosion of zinc by sodium chloride particle deposition. Corrosion Science, 44:555–572,2002.
[125] Z. Y. Chen, S. Zakipour, D. Persson, and C. Leygraf. Effect of Sodium Chloride Particleson the Atmospheric Corrosion of Pure Copper. Corrosion Science, 60:479–491, 2004.
[126] S. X. Li and L. H. Hihara. Atmospheric corrosion initiation on steel from predepositedNaCl salt particles in high humidity environment. Corrosion Engineering, Science andTechnology, 45:49–56, 2010.
[127] S. Li and L. H. Hihara. In situ Raman spectroscopic identification of rust formation inEvans’ droplet experiments. Electrochemistry Communications, 18:48–50, 2012.
[128] E. Schindelholz, B. E. Risteen, and R. G. Kelly. Effect of Relative Humidity on Corrosionof Steel under Sea Salt Aerosol Proxies. I. NaCl. Journal of the Electrochemical Society,161:C450–C459, 2014.
[129] E. Schindelholz and R. G. Kelly. Wetting phenomena and time of wetness in atmosphericcorrosion: a review. Corrosion Reviews, 30:135–170, 2012.
[130] R. M. Cornell and U. Schwertmann. The Iron Oxides Structure, Properties, Reactions, Oc-curences and Uses. Wiley-VCH, 2003.
[131] R. A. Antunes, I. Costa, and D. L. A. Faria. Characterization of corrosion products formedon steels in the first months of atmospheric exposure. Materials Research, 6:403–408, 2003.
[132] M. Stratmann, K. Bohnenkamp, and H.-J. Engell. An electrochemical study of phase-transitions in rust layers. Corrosion Science, 23:969–985, 1983.
[133] M. Stratmann and J. Muller. The mechanism of the oxygen reduction on rust-coveredmetal substrates. Corrosion Science, 36:327–359, 1994.
Bibliography 127
[134] I. Newton. Opticks: Or, A Treatise of the Reflexions, Refractions, Inflexions and Colours ofLight. Also Two Treatises of the Species and Magnitude of Curvilinear Figures. Royal Societyof London, 1704.
[135] T. Tsuru, K.-I. Tamiya, and A. Nishikata. Formation and growth of micro-droplets duringthe initial stage of atmospheric corrosion. Electrochimica Acta, 149:2709–2715, 2004.
[136] K. H. Raveesha, V. H. Doddamani, and B. K. Prasad. On a method to employ Newton’sRings concept to determine thickness of thin films. International Letters of Chemistry,Physics and Astronomy, 22:1–7, 2014.
[137] J. K. Beattie, A. M. Djerdjev, A. Gray-Weale, N. Kallay, J. Lutzenkirchen, T. Preocanin, andA. Selmani. pH and the surface tension of water. Journal of Colloid and Interface Science,422:54–57, 2014.
[138] M. Pourbaix. Atlas d’Equilibres Electrochimiques. Gauthier-Villars, 1963.
[139] J. Zhang, J. Wang, and Y. Wang. Micro-Droplets Formation During the Deliquescence ofSalt Particles in Atmosphere. Corrosion Science, 61:1167–1172, 2005.
[140] J. Zhang, J. Wang, and Y. Wang. Electrochemical investigations of micro-droplets formedon metals during the deliquescence of salt particles in atmosphere. Electrochemistry Com-munications, 7:443–448, 2005.
[141] R. Mills. A Remeasurement of the Self-diffusion Coefficients of Sodium Ion in AqueousSodium Chloride Solutions. Journal of the American Chemical Society, 77:6116–6119, 1955.
[142] R. Mills and V. M. M. Lobo. Self-diffusion in Electrolyte Solutions: A Critical Examination ofDat a Ccompiled from the Literature. Wiley-Blackwell, 2000.
[143] C. Leygraf and T. Graedel. Atmospheric Corrosion. Wiley-Blackwell, 2000.
[144] G. S. Frankel and J. W. Braithwaite. Corrosion of Microelectronic and Magnetic Data-Storage Devices. In P. Marcus, editor, Corrosion Mechanism in Theory and Practice. CRCPress, 2012.
[145] W. H. J. Vernon. Adsorption of Water Vapour on Solid Surfaces. Nature, 167:1037–1038,1951.
[146] J. Kestin, E. Khalifa, and R. J. Correia. Tables of the Dynamic and Kinematic Viscosityof Aqueous KCl Solutions in the Temperature Range 20-150
c and the Pressure Range0.1-35 MPa. Journal of Physical and Chemical Reference Data, 10:57–70, 1981.
[147] J. M. Wimby and T. S. Berntsson. Viscosity and density of aqueous solutions of lithiumbromide, lithium chloride, zinc bromide, calcium chloride and lithium nitrate. 1. Singlesalt solutions. Journal of Chemical & Engineering Data, 39:68–72, 1994.
[148] S. E. Traubenberg and R. T. Foley. The Influence of Chloride and Sulfate Ions on theCorrosion of Iron in Sulfuric Acid. Journal of the Electrochemical Society, 118:1066–1070,1971.
[149] E. Janata, M. Kelm, and B. G. Ershov. Solubility of oxygen and nitrous oxide in aqueoussolutions of NaCl: a pulse radiolysis study. Radiation Physics and Chemistry, 63:157–160,2002.
128 Bibliography
[150] F. J. Millero and F. Huang. Solubility of Oxygen in Aqueous Solutions of KCl, K2SO4, andCaCl2 as a Function of Concentration and Temperature. Journal of Chemical EngineeringData, 48:1050–1054, 2003.
[151] F. King. General corrosion in nuclear reactor components and nuclear water disposal sys-tems. In D. Feron, editor, Nuclear corrosion science and engineering. Woodhead PublishingLimited, 2012.
[152] E. Dubuisson, P. Lavie, F. Dalard, J.-P. Caire, and S. Szunerits. Study of the atmophericcorrosion of galvanised steel in a micrometrical electrolytic droplet. Electrochemistry Com-munications, 8:911–915, 2006.
[153] E. Dubuisson, P. Lavie, F. Dalard, J.-P. Caire, and S. Szunerits. Corrosion of galvanisedsteel under an electrolytic drop. Corrosion Science, 49:910–919, 2007.
[154] M. Humenik and W. D. Kingery. Metal-Ceramic Interactions: III, Surface Tension andWettability of Metal-Ceramic Systems. Journal of The American Ceramic Society, 37:18–23,1954.
[155] L. Boulange-Petermann, B. Baroux, and M.-N. Bellon-Fontaine. The influence of metallicsurface wettability on bacterial adhesion. Journal of Adhesion Science and Technology, 7:221–230, 1993.
[156] X. M. Yang, Z. W. Zhong, E. M. Diallo, Z. H. Wang, and W. S. Yue. Silicon wafer wet-tability ang aging behaviors: Impact on gold thin-film morphology. Materials Science inSemiconductor Processing, 26:25–32, 2014.
[157] D. Landolt. Corrosion and Surface Chemistry of Metals. CRC Press, 2007.
[158] M.N. Illman. Analysis of internal corrosion in subsea oil pipeline. Case Studies in Engi-neering Failure Analysis, 2:1–8, 2014.
[159] J. R. Galvele. Transport Processes and the Mechanism of Pitting of Metals. Journal of theElectrochemical Society, 123:464–474, 1976.
[160] H.-H. Strehblow. Nucleation and Repassivation of Corrosion Pits for Pitting on Iron andNnickel. Werkstoffe und Korrosion, 27:792–799, 1976.
VAppendix
AEvaporation of Sessile Droplets
A. 1 Evaporation of Sessile Droplets from Pure Water
The evaporation of sessile droplets from pure water was investigated at different relative hu-midities RHs (ranging from 0 to 80%), for different contact angles θ (ranging from 1 to 40),and for different droplet volumes V0 (ranging from 1 to 10 µl).
Sessile droplets from pure water evaporated in the unpinned, constant contact angle modeirrespective of the relative humidity, the contact angle or the droplet size. All the evaporationcurves (i.e., the time evolution of the droplet volume during its evaporation) presented the char-acteristic patterns of an evaporating sessile droplet from pure liquids. Figure 2.1 illustrates asan example the typical evaporation behaviour of sessile droplets from pure water. At the initialstage of the evaporation, the loss of the droplet volume was linear with time and then deviatedfrom its temporal linear change to a slower decrease with time until the sessile droplet totallyevaporated. This characteristic evaporation behaviour was confirmed by the top and side viewimagings of the sessile droplet at three different evaporation times. The footprint of the dropletcontact area with the substrate decreased with time. Meanwhile the contact angle remainedconstant over the whole evaporation process.
In this appendix, we present only the evaporation curves of sessile droplets containing purewater at a higher relative humidity (RH of 40%, Figure 1), with a higher contact angle (θ '30, Figure 2) and with a smaller droplet volume (V0 ' 1 µl, Figure 3). It is interesting to noticethat the constant contact angle adopted by the sessile droplet containing pure water on thesubstrate was approximately identical (θ = 1 ± 0.5) for all the evaporation experiments, i.e.,with different relative humidities and various droplet sizes.
133
134 A. 1. Evaporation of Sessile Droplets from Pure Water
Effect of the Relative Humidity on the Evaporation Behaviour
Figure 1 shows the time evolution of the droplet volume and shape (from top and side aspects)during the evaporation of a sessile droplet containing pure water at a relative humidity RH of40%.
0 4 0 0 5 0 0 6 0 0 7 0 0 8 0 0 9 0 0 1 0 0 00
2
4
6
8
1 0
1 5 0 s
~ 5 . 8 m m
5 0 s
3 0 0 s
T o p v i e w
S i d e v i e w
3 0 0
Volum
e V [µ
l]
T i m e t [ s ]
Trans
ient tim
e
L a t e r a l r e s o l u t i o n l i m i t
5 0 1 5 0
5 0 s 3 0 0 s1 5 0 s
θ
~ 6 . 7 m m ~ 6 . 4 m m
V 0
- 6 - 4 - 2 0 2 4 60 . 0
0 . 1
0 . 2
Heigh
t [mm]
x [ m m ]
Figure 1 – Evaporation of a sessile droplet from pure water at a relative humidity RH of 40%. The insets show thesimultaneous height profile and top view images at three different evaporation times: 50, 150 and 300 s. The straightline depicts the linear decrease of the droplet volume with time experimentally observed at the initial stage of theevaporation (i.e., between t = 50 and 400 s). The extrapolation of this linear volume change yielded at t = 0 s theinitially deposited volume V0.
Appendix A: Evaporation of Sessile Droplets 135
Effect of the Contact Angle on the Evaporation Behaviour
Figure 2 shows the time evolution of the droplet volume and shape (from top and side aspects)during the evaporation of a sessile droplet containing pure water with a contact angle θ of 30
at a relative humidity RH of 0%.
0 5 0 0 1 0 0 00
2
4
6
8
1 0
1 5 0 s
~ 2 . 3 m m~ 2 . 7 m m
5 0 s
3 0 0 s
T o p v i e w
S i d e v i e w
3 0 0
Volum
e V [µ
l]
T i m e t [ s ]
Trans
ient tim
e
L a t e r a l r e s o l u t i o n l i m i t
5 0 1 5 0
5 0 s 3 0 0 s1 5 0 s
θ
~ 2 . 5 m m
V 0
- 4 - 2 0 2 40 . 00 . 20 . 40 . 60 . 81 . 0
Heigh
t [mm]
x [ m m ]
Figure 2 – Evaporation of a sessile droplet from pure water with a contact angle θ of 30 at a relative humidity RHof 0% . The insets show the simultaneous height profile and top view images at three different evaporation times: 50,150 and 300 s. The straight line depicts the linear decrease of the droplet volume with time experimentally observedat the initial stage of the evaporation (i.e., between t = 50 and 600 s). The extrapolation of this linear volume changeyielded at t = 0 s the initially deposited volume V0.
136 A. 1. Evaporation of Sessile Droplets from Pure Water
Effect of the Droplet Volume on the Evaporation Behaviour
Figure 3 shows the time evolution of the droplet volume and shape (from top and side aspects)during the evaporation of a 1 µl-sessile droplet containing pure water at a relative humidityRH of 0%.
0 1 5 00 . 0
0 . 2
0 . 4
0 . 6
0 . 8
1 . 0
1 0 0 s
~ 2 m m
5 0 s
S i d e v i e w
Volum
e V [µ
l]
T i m e t [ s ]
T r a n s i e n t t i m e
L a t e r a l r e s o l u t i o n l i m i t
5 0 1 0 0
5 0 s 1 0 0 s
θ
~ 1 . 8 m m
V 0T o p v i e w
- 2 0 20 . 0
0 . 1
0 . 2
Heigh
t [mm]
x [ m m ]
Figure 3 – Evaporation of a 1 µl-sessile droplet from pure water at a relative humidity RH of 0% . The insets showthe simultaneous height profile and top view images at two different evaporation times: 50 and 100 s. The straightline depicts the linear decrease of the droplet volume with time experimentally observed at the initial stage of theevaporation (i.e., between t = 50 and 100 s). The extrapolation of this linear volume change yielded at t = 0 s theinitially deposited volume V0.
Appendix A: Evaporation of Sessile Droplets 137
A. 2 Evaporation of Sessile Droplets from NaCl Solutions
The evaporation of sessile droplets from aqueous saline solutions were performed over eightdecades of initial sodium chloride concentrations from 10−8 to 6.1M NaCl, at different relativehumidities from 0 to 60%, with various contact angles ranging from 2 to 50 and at differentdroplet volumes from 1 to 10 µl. Above a concentration of 10−6M NaCl, the sessile dropletsfrom NaCl solutions evaporated in pinned constant contact area mode irrespective of the rel-ative humidity, the droplet contact angle and size. All the evaporation curves presented thesame characteristics patterns. The droplet volume decreased linearly with time over the wholestudied evaporation. This typical evaporation behaviour was confirmed by the top and sideview imagings of the sessile droplet at three different evaporation times. The footprint of thedroplet area with the substrate remained constant during the complete evaporation. Mean-while the contact angle decreased with time.
In this appendix we present a selection of evaporation curves of sessile droplets containingNaCl solutions at different representatives sodium chloride concentrations: 10−6M (in somecases), 10−3M, 1M, 3M (in some cases) and 6.1M NaCl. Aqueous solutions containing 10−3,1 and 6.1M NaCl are illustrative of the three different regimes of pattern formation obtainedafter complete evaporation of the sessile droplet (Figure 3.2).
138 A. 2. Evaporation of Sessile Droplets from NaCl Solutions
A. 2.1 Evaporation Behaviour of Sessile Droplets at different NaCl concentrations
Figure A. 4 shows the time evolution of the droplet volume and shape (from top and sideaspects) during the evaporation of a sessile droplet containing different NaCl concentrations:(A) 10−6M, (B) 1M, (C) 3M and (D) 6.1M NaCl at a relative humidity RH of 0%.
Figure A. 4 – Evaporation of a sessile droplet from aqueous NaCl solutions at different representative NaCl con-centrations: A. 10−6M, B. 1M, C. 3M and D. 6.1M NaCl at a relative humidity RH of 0%. The inset plot showthe height profile at three different evaporation times: 50, 150 and 300 s. The other inset shows top view image 50 safter droplet deposition. The straight line depicts the linear decrease of the droplet volume with time experimentallyobserved. The extrapolation of this linear volume change yielded at t = 0 s the initially deposited volume V0.
Appendix A: Evaporation of Sessile Droplets 139
A. 2.2 Impact of the Relative Humidity on Evaporation
A. 2.2.1 Evaporation Behaviour at Higher Relative Humidity
Figure A. 5 shows the time evolution of the droplet volume and shape (from top and sideaspects) during the evaporation of a sessile droplet containing initially 10−3M NaCl at a relativehumidity RH of 40%.
0 1 0 0 2 0 0 4 0 0 5 0 0 6 0 0 7 0 0 8 0 00
2
4
6
8
1 05 0 s
5 0
T o p v i e w
3 0 0
3 0 0 s1 5 0 s5 0 s
Volum
e V [µ
l]
T i m e t [ s ]
Trans
ient tim
e
L a t e r a l r e s o l u t i o n l i m i t
1 5 0
S i d e v i e w
θ
~ 6 m m
V 0
- 6 - 4 - 2 0 2 4 60 . 0
0 . 1
0 . 2
Heigh
t [mm]
x [ m m ]
Figure A. 5 – Evaporation of a sessile droplet from 10−3M NaCl at a relative humidity RH of 40%. The insetplot show the height profile at three different evaporation times: 50, 150 and 300 s. The other inset shows top viewimage 50 s after droplet deposition. The straight line depicts the linear decrease of the droplet volume with timeexperimentally observed. The extrapolation of this linear volume change yielded at t = 0 s the initially depositedvolume V0.
140 A. 2. Evaporation of Sessile Droplets from NaCl Solutions
A. 2.2.2 Salt Concentration Influence
Figures A. 6 and A. 7 show the evolution of the normalized droplet volume v (Equation 2.1)as a function of (A) the time t and (B) the scaled time with the normalized relative vapourpressure tRH (Equation 3.1). The experiments were performed with sessile droplets containingan initial NaCl concentration of 1M NaCl (Figure A. 6) and 6.1M NaCl (Figure A. 7) at differentrelative humidities of 0, 20, 40 and 60%.
0 1 0 0 0 2 0 0 01 0 00 . 0
0 . 2
0 . 4
0 . 6
0 . 8
1 . 0
9 6 . 7
R e l a t i v e h u m i d i t y R H 0 % R H 2 0 % R H 4 0 % R H 6 0 %
R e l a t i v e h u m i d i t y R H 0 % R H 2 0 % R H 4 0 % R H 6 0 %
v
T i m e t [ s ]0 1 0 0 0 2 0 0 0
0 . 0
0 . 2
0 . 4
0 . 6
0 . 8
1 . 0B
v
t R H [ s ]
A
0 2 0 4 0 6 0 8 00
- 1 x 1 0 - 3
- 2 x 1 0 - 3
dv/dt
[s-1 ]
R H [ % ]
Figure A. 6 – Normalized droplet volume v (Equation 2.1) as a function of A. the time t and B. the scaled timewith the normalized relative vapour pressure tRH (Equation 3.1). The experiments were performed with 10 µl-sessiledroplets containing an initial NaCl concentration of 1M NaCl at different relative humidities of 0, 20, 40 and 60%.The decrease of the normalized volume between t = 50 and 100 s (marked in grey) was used to derive the evaporationrate. The inset shows the variation of the evaporation rate dv
dt as a function of the relative humidity.
0 1 0 0 0 2 0 0 01 0 00 . 0
0 . 2
0 . 4
0 . 6
0 . 8
1 . 0
R e l a t i v e h u m i d i t y R H 0 % R H 2 0 % R H 4 0 % R H 6 0 %
7 5 . 4
R e l a t i v e h u m i d i t y R H 0 % R H 2 0 % R H 4 0 % R H 6 0 %
v
T i m e t [ s ]0 1 0 0 0 2 0 0 0
0 . 0
0 . 2
0 . 4
0 . 6
0 . 8
1 . 0B
v
t R H [ s ]
A
0 2 0 4 0 6 0 1 0 00
- 1 x 1 0 - 3
dv/dt
[s-1 ]
R H [ % ]
Figure A. 7 – Normalized droplet volume v (Equation 2.1) as a function of A. the time t and B. the scaled time withthe normalized relative vapour pressure tRH (Equation 3.1). The experiments were performed with sessile dropletscontaining an initial NaCl concentration of 6.1M NaCl at different relative humidities of 0, 20, 40 and 60%.Thedecrease of the normalized volume between t = 50 and 100 s (marked in grey) was used to derive the evaporationrate. The inset shows the variation of the evaporation rate dv
dt as a function of the relative humidity.
Appendix A: Evaporation of Sessile Droplets 141
A. 2.3 Impact of Droplet Size and Contact Angle on Evaporation
A. 2.3.1 Evaporation Behaviour at Higher Contact Angle and at Smaller Droplet Volume
Figure A. 8 shows the time evolution of the droplet volume and shape (from top and sideaspects) during the evaporation of a sessile droplet containing initially 10−3M NaCl (A) witha contact angle θ of 30 and (B) with an initial volume V0 of 1 µl at a relative humidity RH of0%.
A. 2.3.2 Salt Concentration Influence
Figure A. 9 and A. 10 shows the normalized droplet volume v (Equation 2.1) as a function of(A) the time t and (B) the scaled time t (Equation 3.4). The experiments were performed withsessile droplets containing an initial NaCl concentration of 1M NaCl (Figure A. 9) and 6.1MNaCl (Figure A. 10) with various contact angles θ and with different initial deposited volumesV0 at a relative humidity RH of 0%.
142 A. 2. Evaporation of Sessile Droplets from NaCl Solutions
0 1 0 0 2 0 0 4 0 0 5 0 0 6 0 0 7 0 0 8 0 00
2
4
6
8
1 0A
5 0 s
5 0
T o p v i e w
3 0 0
3 0 0 s1 5 0 s5 0 s
Vo
lume V
[µl]
T i m e t [ s ]
Trans
ient tim
e
L a t e r a l r e s o l u t i o n l i m i t
1 5 0
S i d e v i e w
θ
~ 2 . 6 m m
V 0
- 4 - 2 0 2 40 . 0
0 . 2
0 . 4
0 . 6
0 . 8
1 . 0
Heigh
t [mm]
x [ m m ]
0 2 0 0 3 0 0 4 0 00 . 0
0 . 2
0 . 4
0 . 6
0 . 8
1 . 0
5 0 s
5 0
T o p v i e w
1 0 0 s
5 0 s
Volum
e V [µ
l]
T i m e t [ s ]
Trans
ient tim
e
L a t e r a l r e s o l u t i o n l i m i t
1 0 0
S i d e v i e w
θ
~ 2 m m
V 0B
- 2 0 20 . 0
0 . 1
0 . 2
Heigh
t [mm]
x [ m m ]
Figure A. 8 – Evaporation of a sessile droplet from 10−3M NaCl A. with a contact angle θ of 30 and B. with aninitial volume V0 of 1 µl at a relative humidity RH of 0%. The inset plot show the height profile at (A) three differentevaporation times: 50, 150 and 300 s or (B) two different evaporation times : 50 and 100 s. The other inset showstop view image 50 s after droplet deposition. The straight line depicts the linear decrease of the droplet volume withtime experimentally observed. The extrapolation of this linear volume change yielded at t = 0 s the initially depositedvolume V0.
Appendix A: Evaporation of Sessile Droplets 143
0 5 0 0 1 0 0 0 1 5 0 0 2 0 0 00 . 0
0 . 2
0 . 4
0 . 6
0 . 8
1 . 0R e l a t i v e h u m i d i t y
0 % 2 0 % 4 0 % 6 0 %C o n t a c t A n g l e
3 ° 1 3 ° 3 3 ° 4 3 °D r o p l e t v o l u m e
1 µ l 5 µ l 1 0 µ l
v
t [ m m . s ]
0 1 0 2 0 3 0 4 0 5 00
1
2
r [mm]
θ0 [ ° ]
Figure A. 9 – Normalized droplet volume v (Equation 2.1) as a function of A. the time t and B. the scaled time t(Equation 3.4). The experiments were performed with sessile droplets containing an initial NaCl concentration of1M NaCl with various contact angles θ (3, 13, 33 and 43) and with different initially deposited volumes V0 (1, 5and 10 µl) at a relative humidity RH of 0%.
0 5 0 0 1 0 0 0 1 5 0 0 2 0 0 00 . 0
0 . 2
0 . 4
0 . 6
0 . 8
1 . 0R e l a t i v e h u m i d i t y
0 % 2 0 % 4 0 % 6 0 %C o n t a c t A n g l e
9 ° 1 9 ° 3 9 ° 4 9 °D r o p l e t v o l u m e
1 µ l 5 µ l 1 0 µ l
v
t [ m m . s ]
0 1 0 2 0 3 0 4 0 5 00
1
2
r [mm]
θ0 [ ° ]
Figure A. 10 – Normalized droplet volume v (Equation 2.1) as a function of A. the time t and B. the scaled timet (Equation 3.4). The experiments were performed with sessile droplets containing an initial NaCl concentration of6.1M NaCl with various contact angles θ (10, 20, 40 and 50) and with different initially deposited volumes V0 (1,5 and 10 µl) at a relative humidity RH of 0%.
BSize-Independent Peripheral Film
Phenomenon
The corrosion phenomenon under sessile droplets from 6.1M NaCl in humid air with RHeq
75.4% was investigated for different initial droplet volumes V0 ranging from 5 to 60 µl. Irrespec-tive of the droplet size, all the iron samples presented the characteristic pattern of the under-droplet corrosion experiments, i.e., the formation of a peripheral film ahead of the macroscopiccontact line of the sessile droplet.
Figure B. 1 shows microscopy images of dried iron surfaces, on which sessile droplets from6.1M NaCl with different V0 were deposited, after 1 day of exposure to humid air with 75.4%at T = 20C.
Figure B. 1 – Microscopy images of dried iron surface, onto which an aqueous sessile droplet from 6.1M NaCl wasdeposited with an initial volume varying from 5 to 20 µl, after 1 day of exposure to humid air with a relative humidityRH of 75.4% at T = 20C. The insets in all three images show SEM micrographs of the droplet edge/peripheralregion.
Figure B. 2 presents the measured weight loss of iron substrates ∆m (Equation 1.1), ontowhich sessile droplets from aqueous 6.1M NaCl solutions with different V0 were deposited,over the corrosion process, at several exposure times ranging from 1 day to 1 month.
Figure B. 2 shows, that the weight loss of iron samples increases over the whole corrosionprocess. A temporal increase of ∆m is observed for the different studied chloride solutions
145
146
0 5 1 0 1 5 2 0 2 5 3 00
2
4
6
8
1 0D r o p l e t V o l u m e V 0
5 µ l 1 0 µ l 2 0 µ l 4 0 µ l 5 0 µ l 6 0 µ l
∆m [m
g]
T i m e t [ d a y s ]Figure B. 2 – Weight loss of the iron substrate ∆m, onto which sessile droplets containing aqueous solutions of6.1M NaCl with different initial volumes V0 from 5 to 60 µl were deposited, as function of the exposure time t. Overthe corrosion process, ∆m(t) was calculated from the measured initial weight m0 and the final weight mF usingEquation 1.1. The linear increase of ∆m between t = 1 day and 1 month was used to determine the corrosion rateVcorr.
within the initially sessile droplets deposited onto iron substrates. Between t = 1 and 30 days,the weight loss increase is nearly linear with time, as depicted by the dotted lines in Figure3.3. Thus a corrosion rate (Equation 3.1) is rather well defined and can be determined in thisexposure time interval.
CEvaporation of Sessile Droplets
on Iron
C. 1 ... with an Higher NaCl Concentration
Figure C. 1 presents the time evolution of the normalized droplet volume v (Equation 2.1)during the evaporation of sessile droplets containing a 1M NaCl-concentrated aqueous solutiondeposited either on silicon wafers or pure iron surfaces in two different gaseous environments:N2 and air with a relative humidity RH 0% at T = 23C. The initially deposited volume V0,according to the readout of the syringe, was 10 µl.
5 0 s
0 5 0 0 1 0 0 0 1 5 0 0 2 0 0 0 2 5 0 00 . 0
0 . 2
0 . 4
0 . 6
0 . 8
1 . 0
S i l i c o nN 2
I r o nN 2
N 25 0 s
I r o n
I r o nA i r
5 0 3 0 0
v
T i m e t [ s ]
L a t e r a l r e s o l u t i o n l i m i t
S i d e v i e w
θ
~ 2 . 8 m m
A I R5 0 s
I r o n
Transi
ent tim
e
~ 2 . 9 m m
T o p v i e w
- 4 - 2 0 2 40 . 0
0 . 2
0 . 4
0 . 6
0 . 8 N 2 A i r
I r o n
Heigh
t [mm]
x [ m m ]
5 0 s
3 0 0 s
Figure C. 1 – Evaporation of sessile droplets from 1M NaCl deposited onto silicon wafers or iron substrates ina high-purity nitrogen or synthetic air environment with a relative humidity RH 0% at T = 23C (V0 10 µl).The inset plot shows the height profile at two different evaporation times: 50 and 300 s. The other inset shows topview imaging 50 s after droplet deposition.The two insets are only depicted for the sessile droplets deposited on ironsurfaces under N2 or air gaseous phases. The silicon wafers’ case has ever been presented in detail in Figure A. 4.
147
148 C. 2. ... at an Higher Relative Humidity in Air
C. 2 ... at an Higher Relative Humidity in Air
Figure C. 2.a shows the temporal change of the normalized volume v (Equation 2.1) duringthe evaporation of sessile droplets placed down on iron substrates and containing 10−3M NaClat different relative humidities RHs of 0, 20, 40 and 60%. Figure C. 2.b presents the measurednormalized droplet volume v (Equation 2.1) as a function of the scaled time t (Equation 3.4)for sessile droplets containing initially a concentration of 10−3M NaCl at different RHs from 0to 60%.
0 500 1000 1500 2000 2500 3000 35000.0
0.2
0.4
0.6
0.8
1.0Relative humidity
RH 0% RH 20% RH 40% RH 60%Relative humidity
RH 0% RH 20% RH 40% RH 60%
v
Time t [s]
a b
0 200 400 600 800 1000 1200 14000.0
0.2
0.4
0.6
0.8
1.0
v
t [mm.s]
Figure C. 2 – Normalized droplet volume v (Equation 2.1) as a function of a. the experimental time t and b. thescaled time t (Equation 3.4). The evaporation experiments were performed with 10 µl-sessile droplets deposited ontoiron substrates and containing an initial NaCl concentration of 10−3M NaCl at different relative humidities RHsof 0, 20, 40 and 60%. The decrease of the normalized volume v between t = 50 and 100 s after the sessile dropletsdeposition (marked in grey) was used to derive the initial evaporation rate.
Title Sessile Droplets of Salt Solutions on Inert and Metallic Surfaces: Influence of SaltConcentration Gradients on Evaporation and Corrosion Behaviour
Abstract In this thesis we investigate the evaporation behaviour of sessile droplets ofaqueous saline solutions on planar inert and metallic surfaces and characterise the corro-sion phenomenon for iron surfaces. First we study the evaporation behaviour of sessilesalty droplets on inert surfaces for a wide range of salt concentrations, relative humidi-ties, droplet sizes and contact angles. Our study reveals the range of validity of thewell-accepted diffusion-controlled evaporation model and highlights the impact of saltconcentration (surface tension) gradients driven Marangoni flows on the evaporationbehaviour and the subsequent salty deposit patterns. Furthermore we study the spatial-temporal evolution of sessile droplets from saline solutions on metallic surfaces. In con-trast to the simple, generally accepted Evans droplet model, we show that the corrosionspreads ahead of the macroscopic contact line with a peripheral film. The three-phasecontact line is destabilized by surface tension gradients induced by ionic compositionchanges during the course of the corrosion process and migration of cations towardsthe droplet perimeter. Finally we investigate the corrosion behaviour under drying saltysessile droplets on metallic surfaces. The corrosion process, in particular the location ofanodic and cathodic activities over the footprint droplet area is correlated to the spatialdistribution of the salt inside the drying droplet.
Titre Gouttes Sessiles de Solutions Salines sur des Surfaces Inertes et Métalliques :Influence des Gradients de Concentration en Sel sur la Dynamique d’Evaporation et leProcessus de Corrosion
Résumé Dans cette thèse, la dynamique d’évaporation de gouttes sessiles de solutionssalines sur des surfaces planes inertes et métalliques a été étudiée et le phénomène decorrosion pour les surfaces ferriques caractérisé. En premier lieu, nous nous sommesintéressés à la dynamique d’évaporation de gouttes sessiles salées sur des surfaces in-ertes pour une large gamme de concentrations en sel, d’humidité relatives, de taillesde goutte et d’angles de contact. Notre étude révèle les domaines de validité du modèleclassique d’évaporation, processus contrôlé par la diffusion de la vapeur dans l’air et meten évidence l’impact de flux (de Marangoni) induits par des gradients de concentration(tension de surface) en sel sur la dynamique d’évaporation et les dépôts salins obtenusaprès évaporation de la goutte. De plus, nous nous sommes consacrés à l’évolutionspatio-temporelle de gouttes sessiles de solutions salines sur des surfaces métalliques.Contrairement au modèle simplifié de la goutte d’Evans, nous avons montré que leprocessus de corrosion s’étend aux abords de la ligne de contact, avec la formationd’un film périphérique. La ligne triple est déstabilisée par des gradients de tension desurface induits par des variations de composition ionique au cours du processus decorrosion et la migration des cations vers la périphérie de la goutte. Enfin nous avonsétudié le phénomène de corrosion du métal induit par l’évaporation de gouttes sessilessalées. Le processus de corrosion, en particulier la localisation des réactions anodiqueset cathodiques sur la surface métallique en contact avec la goutte est corrélée à la distri-bution spatiale du sel au sein de la goutte s’évaporant.