“International Credit Optimization In The Post-Great Recession Financial System” North America Power Credit Organization (NAPCO) Chattanooga, TN September 12, 2013 Jack Malvey, CFA Chief Global Markets Strategist Director of Center for Global Investment & Market Intelligence BNY Mellon Investment Management
Transcript
“International Credit Optimization In
The Post-Great Recession Financial System”
North America Power Credit Organization (NAPCO)
Chattanooga, TN
September 12, 2013
Jack Malvey, CFA
Chief Global Markets Strategist
Director of Center for Global Investment & Market Intelligence
BNY Mellon Investment Management
Information Security Identification: Confidential
Agenda
2
Fifth Anniversary of Great Recession: Causes, Effects, and Aftermath
Current State and Outlook for Global Capital Markets
Big Data/Next Generation Credit Tool
International Credit Optimization
Information Security Identification: Confidential
$380 Trillion as of 8/31/2013: ~$54,000 Per Global Capita**
Estimated $5 Quadrillion as of 12/31/2050: ~$541,000 Per Global Capita**
*Sum of U.S. FRNs, Short-term government/corporate, Pan Euro FRNs, U.S./Canada/Pan-Euro/Asia Pacific/China investment grade corporate, U.S. high-yield FRNs, U.S. high-yield loans, U.S. corporate high-
yield, Pan-Euro high-yield, EM (U.S.-dollar denominated), Pan-Euro EM, and U.S. convertibles – all indices from Barclays
**Population from U.S. Census Bureau World Population Clock; assumed 9 billion world population at year-end 2050; CAGR as shown above based on our historically derived assumptions
1) Barclays Indices data as of August 31, 2013, except U.S. commercial and industrial loans (August 21, 2013), non-agency U.S. MBS (March 29, 2013), and cash and cash-like6 (see below); 2) Global equity
market capitalization per Bloomberg; 3) 2011 private equity global AUM x 2003 to 2011 CAGR estimate of 19% from TheCityUK January 2012 Private Equity report; 4) U.S. data as of March 29, 2013; non-U.S.
real estate estimated from U.S. share of global GDP; 5) BIS data as of June 30, 2012, and may not add up exactly to total due to rounding; 6) Cash and Cash-Like: M2 money supply except for India which
excludes other deposits with Reserve Bank of India (RBI) as defined by RBI; converted to U.S. $ using most recent data and exchange rates as of August 31, 2013 for Brazil, Canada, China, Eurozone, Hong
Kong, India, Japan, Russia, Singapore, U.K., and U.S.; dates of most recently published data do not exactly match.
Global Financial Asset Choice Set: Intended to be a representation of various market values as defined by the footnotes above and should not be construed as a complete representation of all assets or
markets. Sum of asset class components and all asset classes may not add up exactly to total due to rounding
Source: BNY Mellon using data from FactSet, Bloomberg, Barclays Live, IMF, BIS, Preqin, U.S. Census Bureau, and Reserve Bank of India
Total 174,930 2,050,488 Other Derivatives 41,611 1,792 10% 62,902
Total 632,579 24,740 810,821
Global Credit Market Value* U.S. $12,722 Bil. as of August 31, 2013
Grand Total 380,165 4,868,155
Global Cash Financial Market Value Size (U.S.$ Billion)
Global Derivative Financial Markets5 Size (U.S.$ Billion)
Global Real Estate Asset Value Size (U.S.$ Billion)
Information Security Identification: Confidential
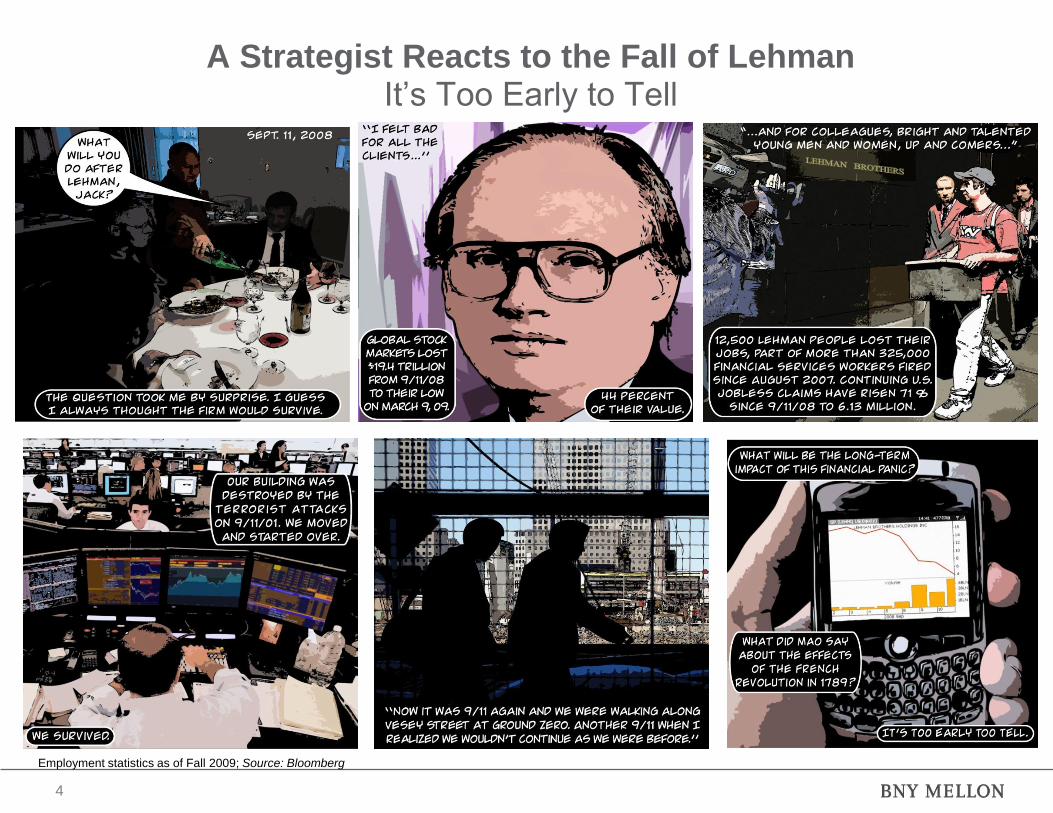
A Strategist Reacts to the Fall of Lehman It’s Too Early to Tell
4
Employment statistics as of Fall 2009; Source: Bloomberg
Information Security Identification: Confidential
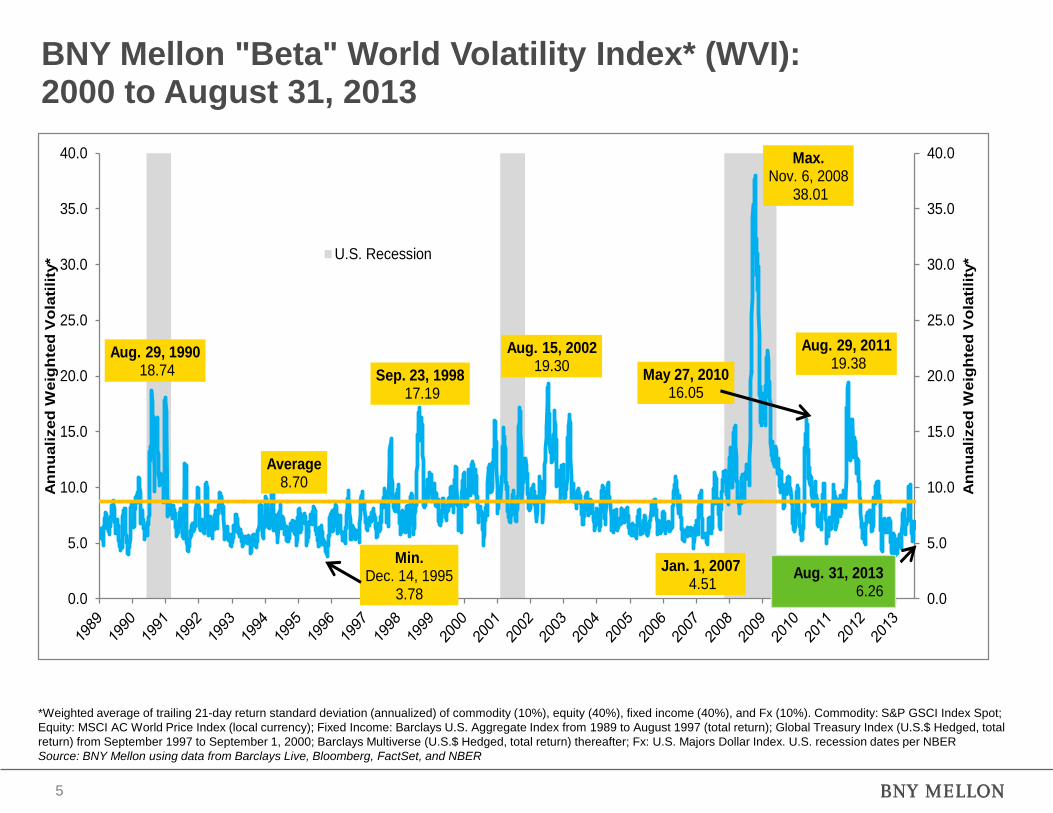
BNY Mellon "Beta" World Volatility Index* (WVI): 2000 to August 31, 2013
*Weighted average of trailing 21-day return standard deviation (annualized) of commodity (10%), equity (40%), fixed income (40%), and Fx (10%). Commodity: S&P GSCI Index Spot;
Equity: MSCI AC World Price Index (local currency); Fixed Income: Barclays U.S. Aggregate Index from 1989 to August 1997 (total return); Global Treasury Index (U.S.$ Hedged, total
return) from September 1997 to September 1, 2000; Barclays Multiverse (U.S.$ Hedged, total return) thereafter; Fx: U.S. Majors Dollar Index. U.S. recession dates per NBER
Source: BNY Mellon using data from Barclays Live, Bloomberg, FactSet, and NBER
5
Aug. 29, 199018.74
Min.Dec. 14, 1995
3.78
Sep. 23, 199817.19
Aug. 15, 200219.30
Jan. 1, 20074.51
Max.Nov. 6, 2008
38.01
May 27, 201016.05
Aug. 29, 201119.38
Average8.70
0.0
5.0
10.0
15.0
20.0
25.0
30.0
35.0
40.0
0.0
5.0
10.0
15.0
20.0
25.0
30.0
35.0
40.0
An
nu
ali
zed
Weig
hte
d V
ola
tili
ty*
An
nu
ali
zed
Weig
hte
d V
ola
tili
ty* U.S. Recession
Aug. 31, 20136.26
Information Security Identification: Confidential
Structured Products Oil SIVs Write-offs SWFs
Fed
Iraq Progress/Pullout
N. Korean
Nukes
Hedge Funds
Global Capital Flows
Inflation
Asian
Revaluation
Autos
Insurance
U.S. Dollar
Iran Nukes
Terrorism
Japanese Growth
GPR
Unilateralism
Budget
Deficits
Business/
Regulatory
Reforms
Imbalances
Global RatesSpread Expansion
Consumer Credit
Alternatives
Global Easing Cycle
Strategic Rise
of China/India
Latin America
Demographics
Structured
Products
Correlation
Books
Avian FluRussia
Portfolio Products
Rating Agencies
Hurricanes
Outsourcing
Global
Warming
Cyclical Vol
Increase
Trade
TensionsGlobalization
Technology
Capital
Preservation
M&A / LBO
Pipeline
Oil
ECB
Nigeria
Venezuela
Commodities
Economic
Nationalism
Deleveraging
Consumer
Spending
Conversion From
Relative Value to
Absolute Return
Nature of Capitalism
Distributionist Issues
Portable Alpha/Beta
SIVs
Mortgage Lenders
Hedge Fund
Replication
Elections
LIBOR
Residential Real
Estate Bubble Pop
CLOsCommercial Real Estate
CDOs
Loan
Warehousing
Sowood
Infrastructure
Alt-A
Northern Rock
Subprime
Countrywide
Moral
Hazard
ABCP
Hung
Bridge
Loans
Lender of
Last Resort
Relief from
Negative Event Risk
Kenya
LDI
Economic
Decoupling
Write-offs
Monolines
ABS
Private
Equity
U.S.
Recession
Approach
130/30
Liquidity
Injections
U.S. Presidential ContestEquity
Quantitative
Management
SWFs
Soc. Gen
Fiscal Stimulus
CMBX
Bear Stearns
TSLF
PDCF
TAF
Food Prices
Food Prices
Fall of Lehman
Fannie, Freddie
Nationalized
“The Great Recession of 2007-2009”: Unusual in its Length, Magnitude, and Assault More on “Alleged” High Quality Than Low Quality
6
Information Security Identification: Confidential
“And the seasons, they go round and round,
And the painted ponies go up and down
We’re captive on the carousel of time,
We can’t return, we can only look behind,
From where we came,
And go round and round and round,
In the circle game.”
“The Circle Game”
by Joni Mitchell
“The Great Global Capital Markets Circle Game”
7
Information Security Identification: Confidential
“Recurrent speculative insanity and the associated
financial deprivation and larger devastation are, I
am persuaded, inherent in the system. Perhaps it is
better that this be recognized and accepted."
-- John Kenneth Galbraith, A Short History of Financial
Euphoria, 1993
“I can measure the motion of bodies, but I cannot
measure human folly.”
-- Sir Isaac Newton
“The Capital Markets Framework”
8
Information Security Identification: Confidential
Capital Market Corrections Are All Too Common Crash Timeline (1622 to 2013):
A Major Adjustment Every 5 – 10 Years
1622-Coins debased in Holy
Roman Empire by weight,
fineness, denomination
1696-Coins debased in
England
1720-John Law’s English South
Sea Company and French
Mississippi Company Bubbles
1763-Dutch commodities Crash,
bankruptcies in Amsterdam and
Hamburg, liquidity squeeze in
Amsterdam
1773-Financial Crisis; British
Banks bankrupted by loans to
British East India Company, hurts
Dutch capital market
1779-The U.S. Continental dollar
falls 50% in three weeks of
inflation
1791-“Scrippomania” Bubble rips
U.S. stock markets. First Crash in
U.S. government securities
markets
1793-Canal mania in England in
1792, Crash in 1793
1797-Collapse of French Assignat
(currency)
1819-First major economic crisis in U.S.
history: Bank failures, deflation, large-scale
unemployment, sharp contraction of money
and credit
1825-Banking panic in England; Speculation
in Latin American bonds, mines, cotton;
Crash in same year
Panic of 1837-Banks in New York and New
Orleans suspend redemption of notes and
deposits; English/U.S./French cotton Boom
and Crash
1847-1848-Railroad and wheat speculation in
England, U.S.: Crash in same year; “Food &
Money Panic”; English banking crisis
1857-1858-Railroad and wheat speculation
and Crash in England, U.S.; Failure of Ohio
Life Insurance and Trust Company; British,
U.S., and German banking panics
1864-1866-Cotton speculation and Crash and
France, England, and Italy
1869-Gold market “corner” collapses on
“Black Friday”
1873-U.S. bank panic; Railroad Bubble and
Crash in Germany, Austria, and U.S.; Panic
and stock market Crash in Vienna & New
York, back to another panic in Vienna and
Germany, and much of Continental Europe
1878-U.S. Depression; Bland Alison Act
1890-U.S. bank panic; Liquidation of
Barings; English speculation in Argentina
stock market, crash that year; German stock
market Bubble
1892-U.S. Treasury gold reserves nearly
depleted; Bland Alison Act repealed;
German stock market Crash
1893-Australian banking crisis; Silver
collapse
1896-U.S. bank panic
1897-U.S. Depression; Alaska gold rush
1907-U.S. bank panic initiated by copper
Crash; Amsterdam stock panic;
New York-Turin financial crisis (stocks)
1913-Non U.S. bond Bubble
1914-Stock exchanges close on war;
Suspension of gold convertibility in Europe;
-Bank of England raises discount rate; U.S.
dollar weakens; Run on German banks
1920-Stock market collapses in London and
New York
1924-German reichemark / French franc
squeeze
1925-Florida real estate Bubble; U.K. pound
restored to par
1929-Equity market Crash
1930-U.S. banking crisis during Great
Depression; U.S. Bank closed
1931-U.K. leaves gold standard; Failure of
Creditanstaldt in Austria; Danatbank in
Germany; U.S. bank crisis
1936-Gold bloc collapses; Tripartite
Monetary Agreement
1953- U.S. credit crisis
1962-U.S. equity market Crash
1966-U.S. “credit crunch”
1970-Collapse of Penn Central
1973-Collapse of Bretton Woods; Arab oil
embargo; Recession in U.S., Europe, Japan
1974-U.K. stock market Crash; Franklin
National Bank fails; Herstatt Bank collapses
(Germany)
1976-U.K. asks IMF for bailout
1979-Iranian revolution; Volcker vs. U.S.
inflation; Hunt Brothers attempt to corner
global silver market
1981-“Great Rust Belt Restructuring” worst U.S.
economic slump since Great Depression
1983-Butcher Brothers Bank Scandal;
Failure of American Bank of Knoxville, Canadian
financial crisis
1984-Continental Illinois Bank fails
1986-Japanese equity and real estate value peak and
beginning of long Crash; Negative event risk reset
of U.S. corporate governance
1987-“Crash of 1987” (U.S. stocks); Norway, New
Zealand, Denmark banking crises
1989-Dow drops 11% intraday, U.S. equity
crashette; Real estate Crashes in Texas, Oklahoma,
and Louisiana on oil price fall; Australia banking
crisis
1990-Fall of Drexel Burnham; Iraq invades Kuwait;
U.S. HY market “Nuclear Winter”; Italy banking
crisis
1994-Fed rate hikes roils the markets; Hedge funds
difficulties; Kidder, Peabody fails; “Mexican
Tequila Crisis”; Orange County Debacle;
Community Bankers Fund fails; Brazil and Mexico
devalue; French banking crisis
1995-Yen rises to all-time peak versus U.S. dollar;
Failure of Barings PLC Bank
1997-“Asian Financial Crisis” begins with
devaluation of Thai baht; Global equity markets
meltdown; Bre-X Minerals fraud
1998-“Great Spread Sector Crash”; Russian
devaluation/default; Long Term Capital rescue;
HKMA props HK equity market; Malaysia halts
international trading of the ringgit; U.S. joins
intervention to boost yen.
2000-Global equity markets peak and begin first 3-
year slide since 1939 – 1941; Credit market
succumbs to U.S. curve inversion
2001-Global recession; 9/11; Enron;
Anthrax; Default rate surges
2002-WorldCom fails
2007-2009- “The Credit Recession of 2007-2009,”
Function of U.S. housing bubble pop
1637-Tulip Mania in Holland
1977-Spanish, German banking crises
1991/1992- Bank crises: U.K., Finland, Sweden,
Greece, Japan
1985- Icelandic banking crisis
Sources: Author’s compilation from various sources
9
Information Security Identification: Confidential
Investment Strategy Along The Global Economic/Credit Cycle: 1990-2027
Time
January
2000
“Middle of The
Cycle”
2001-
2002
May
2007
June
2009
High rates, flat-to-
inverted curves, tight
spreads, low vol,
equities peak
Low rates, steep curves,
wide spreads, high vol
Higher rates, flatter
curves, tighter
spreads, low-to-
medium vol,
equities peak
9/11
Enron
11/1/01 WorldCom
4/02
“CDO
Fuss”
2/07
Lehman
Failure
9/08
Panic
9/08-
3/09
European
Recession
2011-2013
September
2013
Next
Peak
2015-
2016
1990-
1991
10
Fatigue after 8-year
expansion, rates climb,
fall of Drexel, Iraq
invasion of Kuwait
Information Security Identification: Confidential
Investment Strategy Along The Global Economic/Credit Cycle: 1990-2027 continued……
Time
2022
“Middle of
The Cycle”
2025
2017/
2018
Peak
Q3 2017 -Normalization of
monetary policy
-High rates
-Inflation
-China hard landing
2027
-Higher
interest rates
help drive
economy back
into recession
11
Information Security Identification: Confidential
30+ Root Causes of “The Great Recession”
Source: BNY Mellon Center for Global Investment and Market Intelligence
1) No Single Factor Accounts for the Mishaps of the Oughts
2) Failure to Be Adequately Versed in Economic/Capital Market History
3) Global Financial System Complexity/Vastness
4) Vast Changes in the Global Economic and Financial Systems. Examples: EM Grand Convergence and End of Broker-Dealer Partnerships
5) Major Economic Correction Overdue
6) “Long-Wave Swing” in the Economic/Regulatory Philosophy Pendulum Begun in the 1970s
7) In Some Instances, the Enormous Scale of Newly-Created Mega Financial Institutions Exceeded Management Capability and Regulators’ Surveillance Efficiency
8) Supremacy of Short-Termism in Political, Economic, Corporate, Investment, Consumer Decision-Making, Economic and Capital Market Forecasting
9) Rise of Shadow Banking
10) Rating Agencies: Another Miss On Structured Product, More Conservative, Additional Regulatory Involvement
11) Elevation of Finance from “Means” to “The End”
12) Too Much Faith Was Placed in the Efficacy of “Bubble-Piercing Shy Central Banks” and Monetary Policy as Guardians of Global and Local Financial Stability
12
Information Security Identification: Confidential
Root Causes of “The Great Recession”
Source: BNY Mellon Center for Global Investment and Market Intelligence
13) Excessive Systemic Financial Leverage
14) Mean Reversion of Geopolitical Risk (GPR) in the Oughts Encouraged Extended Central Bank
Generosity
15) Growing Sell-Side and Buy-Side Scale Made for Extremely Crowded Trading Lanes
16) Cross-Border Accounting, Regulatory, and Economic Policymaking Inconsistencies
17) Erroneous Specifications of Economic and Asset Class Correlations; Elevated Confidence in
Diversification
18) Yield Deficits in Early and Mid-Oughts
19) All New Products Are Stress Tested; Structured Credit Products Were Due in the Oughts
20) To Paraphrase the Late Nobel Laureate Merton Miller, Derivitization of All Financial Asset Classes,
Including Credit, Was Inevitable
21) Multi-Decade Global Housing Infatuation
22) Credit Evaluation Indolence at Too Many Organizations
23) Asset Management Philosophical Conversion from Relative Value to Absolute Return
13
Information Security Identification: Confidential
Root Causes of “The Great Recession”
Source: BNY Mellon Center for Global Investment and Market Intelligence
24) Persistence of Ancient Difficulty in Differentiating Between Secular and Cyclical Economic/
Industry/Issuer Changes
25) Early 21st Century Schism Between Old and New Credit Markets Distracted
26) Regional/Product Siloization and Absence of Methodological Consilience
27) Economics/Finance Academic and Practitioner Dissonance
28) Irregular Pace and Digestion of Technological and Productivity Changes
29) Faulty Management Processes at Some Major Financial Institutions
30) Uneven Distribution of Experience/Talent
31) Ethical Deficiencies
14
Information Security Identification: Confidential
“Extraordinary Monetary Policy Represses Interest Rates and Boosts Financial Assets, Commodities, and Real Estate”: Index1 (100=Jan. 1, 1999) of Major Central Banks Total Assets (U.S.$): Approximately $16.2 Trillion at G-201 Central Banks
1) Base Value: January 1, 1999 = 100 and includes Reserve Bank of Australia, Bank of Canada, European Central Bank, Bank of Japan, Bank of Mexico, Central Bank of Russia, Bank of
Korea, Bank of England, and Federal Reserve from 1999 to present; also includes People’s Bank of China from February 2002 to present, Reserve Bank of India from November 2005 to
present, and Central Bank of Brazil from 2008 to present. For the latest month, South Korea is not included due to data availability.
Source: BNY Mellon using data from various central banks, FactSet, and Bloomberg
15
0
100
200
300
400
500
600
700
800
900
1000
Ind
ex
of
Ce
ntr
al B
an
k T
ota
l A
ss
ets
(B
as
e V
alu
e:
10
0 o
n J
an
. 1
, 1
99
9)
Bank of Japan
European Central Bank
G-20
Bank of England
Federal Reserve
$615.7Bil.$16,214.8 Bil.
$3,181.9 Bil.
$3,571.8 Bil.
$2,010.2 Bil.
Aug. 1, 2013
Information Security Identification: Confidential
“Atypical, Anemic U.S. Cyclical Recovery” Percentage Change in Total Nonfarm Payrolls Relative to Peak1 in Post WWII Recessions: 1948 to August 31, 2013
Total nonfarm payrolls seasonally adjusted
1) Max employment (total nonfarm payrolls) month near business cycle peak as determined by NBER and may not be in the same year each recession begins
Source: BNY Mellon using data from Bloomberg and NBER
14.87%Key Interest Rate Proxies:1800-1819 Federal Government Bonds1820-1839 New England Municipals1840-1859 Federal Gov't Average New Issues1860-1899 Highest Grade Corporate Bonds (Rail Road)1900-1976 30-year Prime Corporates1977-Present 30-year Treasury Bond
June 28, 20133.50%
Min.Feb. 1947
2.45%
Recession
Max.Sep. 1981
14.87%Key Interest Rate Proxies:1800-1819 Federal Government Bonds1820-1839 New England Municipals1840-1859 Federal Gov't Average New Issues1860-1899 Highest Grade Corporate Bonds (Rail Road)1900-1976 30-year Prime Corporates1977-Present 30-year Treasury Bond
Aug. 31, 20133.70%
5.12
7.07
3.17
Max.Sep. 1981
12.58
Aug. 31, 20132.03
0
2
4
6
8
10
12
14
0
2
4
6
8
10
12
14
1871 1891 1911 1931 1951 1971 1991 2011
%%
Avg. +1 Std. Dev. =
Avg. -1 Std. Dev. = Min.Jul. 2012
1.25
Avg. =
Information Security Identification: Confidential
Source: BNY Mellon using data from Barclays Live, NBER, Bloomberg, and Global Financial Data
U.S. Corporate Investment-Grade, High-
Yield, and Emerging-Markets Spreads
(U.S. dollar-denominated, OAS bps):
June 1989 to August 31, 2013
Credit Is Not the Most Expensive Ever
“Investment-Grade U.S. Corporates
Still Have Room to Tighten”:
Moody's 30-Year Baa Industrial Spreads
(bp): 1919 to August 31, 2013
Credit Spread Compression Not Done
18
Average172
0
100
200
300
400
500
600
700
0
100
200
300
400
500
600
700
191
9
192
3
192
7
193
1
193
5
193
9
194
3
194
7
195
1
195
5
195
9
196
3
196
7
197
1
197
5
197
9
198
3
198
7
199
1
199
5
199
9
200
3
200
7
201
1
Recession Average +/-1 Std. Dev. Baa Industrial Spread
bp bp
Aug. 31,2013180
Only 8 bp above 95-year
average
0
500
1000
1500
2000
0
500
1000
1500
2000
U.S. Corporate Investment Grade - OAS
Emerging Markets (U.S. Dollar) - OAS
U.S. Corporate High Yield - OAS
bp bp
Information Security Identification: Confidential
U.S. Dollar Stability: Tripolar World Currency Regime on the Way U.S. Majors Dollar Index: 1967 to August 31, 2013
Source: BNY Mellon using data from Bloomberg
19
Jan. 31, 1967119.9
Oct. 30, 197882.1
Max.Feb. 25, 1985
164.7
Sep. 1, 199278.3
Jul. 5, 2001120.9
Min.Apr. 22, 2008
71.3
Average97.7
60.0
80.0
100.0
120.0
140.0
160.0
180.0
60.0
80.0
100.0
120.0
140.0
160.0
180.0
Aug. 31, 201382.09
Information Security Identification: Confidential
M&A activity not limited to all cash transactions and may also include stock
*2013 M&A annualized as of September 2
Source: BNY Mellon using data from Bloomberg
“Source of Incremental Equity Valuation” Global M&A Activity Slow to Match Previous Post Recession Annual Volumes and Deal Count: Faster M&A Pace Expected in 2013*-2015
Rising S&P 500 Dividends and Buybacks (U.S. $ Billion): Q2 2004 to Q1 20131
1) Preliminary as of June 19, 2013
Source: BNY Mellon using data from www.standardandpoors.com and www.sp-indexdata.com
22
70.9Average
57.0
0.0
10.0
20.0
30.0
40.0
50.0
60.0
70.0
80.0U.S. $ Bil.
Q1 2013
100.0Average89.0
0.0
20.0
40.0
60.0
80.0
100.0
120.0
140.0
160.0
180.0U.S. $ Bil.
Q1 2013
Information Security Identification: Confidential
*Barclays fixed income indices in local currency unless otherwise stated; Global Aggregate.: U.S.-dollar hedged; Pan European HY: euro hedged; **S&P GSCI spot indices;
***Through June 30, 2013
Source: BNY Mellon using data from Bloomberg and Global Financial Data
Global Capital Market Summary: June 30, 2008 to August 31, 2013
23
6/30/2008 8/31/2013 Change (bp) Total Return* (%)
U.S. 3.97 2.78 -119 Global Aggregate* 27.73
U.K. 5.13 2.77 -236 Euro Aggregate 34.77
Japan 1.60 0.72 -89 Sterling Aggregate 40.89
Germany 4.62 1.86 -277 Japan Aggregate 12.35
U.S. Aggregate 28.29
China Aggregate 21.76
6/30/2008 8/31/2013 Change (%) Indian Government 48.58
Dollar Index Majors 72.46 82.09 13.28 U.S. Corporate HY 70.18
Euro 1.58 1.32 -16.08 Pan European HY* 97.93
British Pound 1.99 1.55 -22.18 EM (U.S.-dollar) 51.27
Japanese Yen 106.21 98.17 8.19 U.S. Municipal 26.69
Global Financial Asset1 Nominal Returns (%) Stalled During the Transition to
21st Century Financial System but Are Rebounding in the Teens
1) Global Financial Asset: Equally weighted average return of Global Equity and Global Bond from 1926 to 1989; market-value weighted average return from 1990 to current.
Global Equity: Data provided by Global Financial Data, a provider of historical market datasets and indices as described at www.globalfinancial data.com, from 1926 to 1987;
MSCI-Hedged World U.S. $ Index from 1988 to current. Global Bond: Data provided by Global Financial Data from 1926 to 1986; Barclays Live from 1987 to current.
Global Bond U.S.-dollar hedged after 1986; Global Equity U.S.-dollar hedged after 1987. Financial asset total return series begins in 1926; Global Equity total return
except from 1988 to current. Source: BNY Mellon using data from FactSet, Bloomberg, Global Financial Data, and Barclays Live
Buoyant 2012 and 2013 for Risky Assets
5.29% Nominal Return in the Teens Below 88-Year Average of 6.77%
Global Financial Asset1 Real Returns (%) Stalled During the Transition to
21st Century Financial System but Are Rebounding in the Teens
1) Global Financial Asset: Equally weighted average return of Global Equity and Global Bond from 1926 to 1989; market-value weighted average return from 1990 to current.
Global Equity: Data provided by Global Financial Data, a provider of historical market datasets and indices as described at www.globalfinancial data.com, from 1926 to 1987;
MSCI-Hedged World U.S. $ Index from 1988 to current. Global Bond: Data provided by Global Financial Data from 1926 to 1986; Barclays Live from 1987 to current.
Global Bond U.S.-dollar hedged after 1986; Global Equity U.S.-dollar hedged after 1987. Financial asset total return series begins in 1926; Global Equity total return
except from 1988 to current. Source: BNY Mellon using data from FactSet, Bloomberg, Global Financial Data, and Barclays Live
Buoyant 2012 and 2013 for Risky Assets
3.07% Real Return in the Teens Exceeds 88-Year Average of 2.67%
S&P 500 Index (Gross Total Return) MSCI EAFE (Gross Total Return, U.S. $) Barclays U.S. Aggregate (Total Return)
Dollar Index Spot (DXY Curncy BofA Merrill Lynch U.S. High Yield - Master II MSCI EM (Gross Total Return, U.S. $)
in Bloomberg) (Total Return)
S&P GSCI (Total Return) Citigroup Non-USD WGBI (Total Return, U.S. $) J.P. Morgan EMBI Global Total Return Index
Barclays U.S. TIPS
U.S.
DOLLAR
‐8 .25
6.94
U.S.
BONDS
4.33
EM G
M ARKET
DEBT
9.88
INT'L
FIXED
15.79
HIGH
YIELD U.S.
11.77
INT'L
DEVEL‐
OPED
26.86
U.S.
EQUITY
EM G
M ARKET
EQUITY
‐6 .00
EM G
M ARKET
EQUITY
‐1.89
INT'L
DEVEL‐
OPED
‐12 .76
U.S.
DOLLAR
HIGH YIELD
U.S.
10.26
U.S.
BONDS
13.11
U.S. TIPS
16.57
INT'L FIXED
21.99
EM G
M ARKET
DEBT
2002
COM M O‐
DOTIES
32.07 32.59
U.S. TIPS
0.41
U.S.
EQUITY
COM M O‐
DITIES
‐22 .10 ‐15.09
-15.66
Information Security Identification: Confidential
*Q1 2013 corporate profits after tax (saar) divided by Q1 2013 nominal GDP (saar)
**Corporate profits after tax with inventory and capital consumption adjustments; adjusts inventories and depreciation of fixed assets at current cost; revenue
excludes dividends and capital gains; expenses exclude bad debt, depletion, and capital losses
Source: BNY Mellon using data from BEA, FactSet, and NBER
U.S. Corporate Profits After-tax** (% of Nominal GDP): 1929 to 2013*
U.S. Capital Rewards Boom; Labor Lags Capital’s Share of U.S. Economy at a Record High
Strategic Effects of Global Imbalances Accumulation Enormous Central Bank Reserves1 (U.S. $ Trillion): August 31, 2013 and Forecasted2 to 2025 Under Three Growth Scenarios
1) International reserve assets excluding gold
2) Forecasted annual percentage change (CAGR) in total reserves from natural accretion and investment return
Source: BNY Mellon using data from Bloomberg
28
0.0
5.0
10.0
15.0
20.0
25.0
30.0
35.0
40.0
45.0
11.2
18.1
25.8
40.5U.S.$ Tril.August 31, 2013
December 31, 2025Under Three Growth Scenarios
11%
7%
4%
Information Security Identification: Confidential
“Invisible Hand” Becomes More Visible
Prevent future financial system disruptions from spilling over into real economy with “too big to fail” financial institutions owning a put back to taxpayers
Identify and better monitor systemically important financial institutions
“Post-bubble conservatism” for “neo-modern credit markets”
Shift of government legislative/regulatory pendulum toward more oversight
More conservative consumer finance
Lower financial leverage for certain classes of financial institutions; especially broker-dealers
Global mortgage origination process: less low-quality capacity, more caution
Rating agencies: more conservative, additional regulatory involvement
Greater emphasis on in-house fundamental credit analysis
Structured credit products: medium-to-long term resurrection in more conservative form
Acceleration of disintermediation; especially in Europe
Attempt to better coordinate cross-border regulatory and economic policymaking
Virtues, efficacy, even existence of efficient
markets questioned
Re-appraisal of strategic liquidity premia; likely
extended era of higher risk premia
Better appreciation of limits to empirical models,
High Corporate Profitability Miniscule Yields On Debt Securities
Broken Broker-Dealer Model = Less Liquidity
39
Information Security Identification: Confidential
The Future of Global Asset Management
Late 20th/Early 21st Century Global Capital Market Framework
The Great Recession of 2007-2015 will be recalled for “systematic
credit cleansing”; a secular adjustment in credit risk premia and
credit market methodology
The beginning of the 21st century more conservative capital market
order
– Everything’s ripe for re-interpretation
Institutional aftermath: assimilation of learning lessons; long
process; full adjustment by 2025
Absolute return to relative value to absolute return
Bright strategic outlook for the Teens
Asia-focused financial system
Global Asset Management Developments
Low yields, paltry AE growth Deregulation/re-regulation Global diversification/issuer
concentration
Pension fund capitalism
Aging AE demographics Privatization/nationalization Algorithmic/quant over
fundamental value
Shorter tactical timeline
Global Grand Convergence Derivitization/stagnation Active vs. passive
indexing & ETFs
Horizon and academic/practitioner
dissonance
EM mainstreaming Securitization
pause/resurgence
Index customization
(self indices)
Risk budgeting/risk parity
GPR rise Disintermediation/quickening
in Europe/Asia
Better capitalized financial
system
Quadruple A1 & quadruple I2 doctrine
Globalization/deceleration Liquidity declines/
liquidity scoring
Equity market fragmentation Global electronic bond exchange
Big data/technology advances
Global Portfolio Strategy
Moving out risk horizon curve; portfolio concentration; minimization of pro-cyclical processes; model standardization
Opportunities in IG and HY credit, EM, Frontier, real estate, and Alternative markets 1) Quadruple A’s: alternatives; absolute return; alpha/beta separation; all styles, geographies on choice menu
2) Quadruple I’s: innovation; infrastructure; inflation-protection; insurance of risk
40
Information Security Identification: Confidential
The Most Important Potential Capital Market Developments from 2013 to 2020 (*Biggest Risks) • Capitalist Model Re-engineered
• Global Financial System Upgraded; Regulatory Evolution
Western Central Bank Tapering to Normalcy and Subsequent Economic Market Reaction Function
(Undoubtedly, Some Organizations Will Trip on Curve Flattening and Elevation Like Orange County in
1994)
• European Economic Resurrection, China’s First Major Slow Down Since 1970s
Survival and Scale of Eurozone
• Full and Free Convertibility of Renminbi and Rupee
Bubble Puncture: Bonds, EM, Precious Metals
ETF Rationalization
• Creation of World Volatility Index
• U.K. Considers Departure from EU
Geopolitical Risk Events (Cyberattacks, Terrorism, Conventional Military Skirmishes) Tied to Ideology
Competition Over Energy and Water Resources
• EM Convergence to AE Status
• Rise of EM Middle Class
Technological Change (Cloud, Social Media, Google Glasses, Capacity, Speed)
• Application of Big Data to Financial Markets
• ESG Investment Expansion
• Baby-Boom Peaking Retirements
• Economic Rise of Africa and LATAM
• Asian Pollution Control and Safety Net Construction
Fiscal Rectitude Magnitude
• Rate of Human Capital Development
Where’s the Liquidity; Episodic “Flash Crashes”
Redefinition of Broker-dealer Business Model
• New Asset Management Philosophy (Mix of Empirical and Behavioral Data); Increased Competition Among Asset
Managers
• Better Risk Prevention Design: Equation for Disaster is (Natural Hazard, Nature) + (Hubris, Arrogance, Greed,
Indolence)
41
Information Security Identification: Confidential
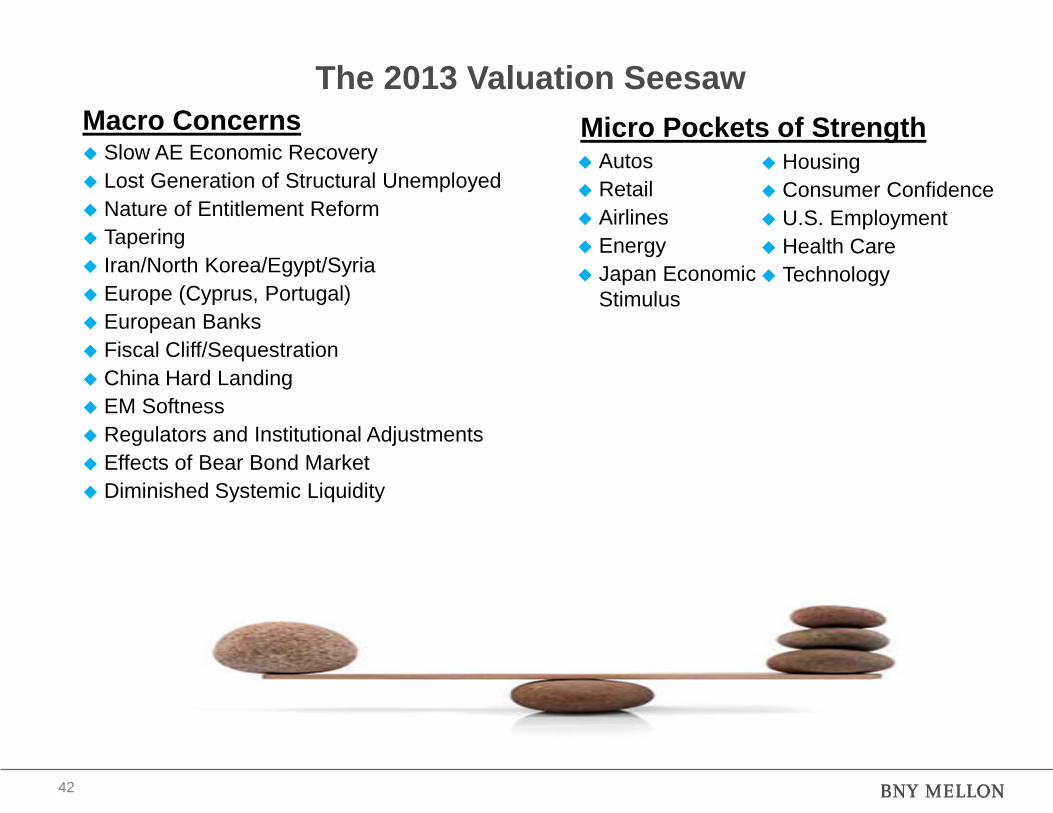
The 2013 Valuation Seesaw
Macro Concerns Slow AE Economic Recovery
Lost Generation of Structural Unemployed
Nature of Entitlement Reform
Tapering
Iran/North Korea/Egypt/Syria
Europe (Cyprus, Portugal)
European Banks
Fiscal Cliff/Sequestration
China Hard Landing
EM Softness
Regulators and Institutional Adjustments
Effects of Bear Bond Market
Diminished Systemic Liquidity
Micro Pockets of Strength Autos
Retail
Airlines
Energy
Japan Economic
Stimulus
Housing
Consumer Confidence
U.S. Employment
Health Care
Technology
42
Information Security Identification: Confidential
2011/2012 Actual; 2013 to 2015 Forecasts1 (as of August 31, 2013)
Global Real GDP Growth (%): Pick-up in 2H 2013 and 2014 “Austerity, Rebalancing, and then Re-Ignition”
1) Bloomberg consensus estimate
Source: BNY Mellon using data from Bloomberg
2011 2012 2013 2014 2015
World 2.95 2.13 1.94 2.92 3.18
Euro area 1.50 -0.60 -0.60 1.00 1.40
France 2.00 0.00 -0.20 0.80 1.30
Germany 3.30 0.70 0.50 1.65 1.60
Italy 0.40 -2.40 -1.80 0.50 0.90
Spain 0.10 -1.60 -1.50 0.50 0.90
United States 1.80 2.80 1.60 2.70 3.00
China 9.30 7.70 7.50 7.45 7.20
Japan -0.58 1.98 1.90 1.50 1.10
United Kingdom 1.10 0.20 1.00 1.70 2.20
Canada 2.53 1.71 1.70 2.35 2.70
Brazil 2.76 0.87 2.20 2.65 3.10
Russia 4.30 3.40 2.30 3.00 3.20
India 7.48 5.10 5.70 5.20 6.00
Indonesia 6.49 6.23 5.80 6.00 6.40
Mexico 3.90 3.90 2.30 3.90 4.00
South Africa 3.48 2.58 2.30 3.00 3.45
Turkey 8.80 2.20 3.55 4.35 4.70
43
Information Security Identification: Confidential
Social Unrest
Global
Imbalances
Iran
Demographics
Regulatory
Change
Politics Higher Dividend
and Capital Gains
Taxes
Capitalism
Global Economic
Revival
Savings Rates
European
Economy
Technology
Energy Supply
Lower Corporate
Tax Rates Possible
Source: BNY Mellon Center for Global Investment & Market Intelligence
Deleveraging
China/EM Hard
Landing
Unknown
“Black and White Swan Lake”
Political
Uncertainties
Housing
Correction Ended
Natural
Disasters
Productivity
Slowdown Currency
Competition
44
Information Security Identification: Confidential
The Future History of Global Capital Markets
Brute Force in Early-to-Mid Industrial Age
Desktop AI Optimization Subject to Flexible Portfolio Constraints
All Fundamentals, Technicals, Prices, Indices, New Issues, Retirements (Calls, Tenders, Maturities)
Real-Time Portfolio Adjustments Executed Through Global Virtual Exchange
Moore's Law* PC Chip Speed
2008 500 GHz
2010 1,300 GHz
2012 3,700 GHz
2025 1,578,667 GHz
2050 165,535,197,867 GHz
* Processing Speed doubles approximately every 18 months
45
Information Security Identification: Confidential
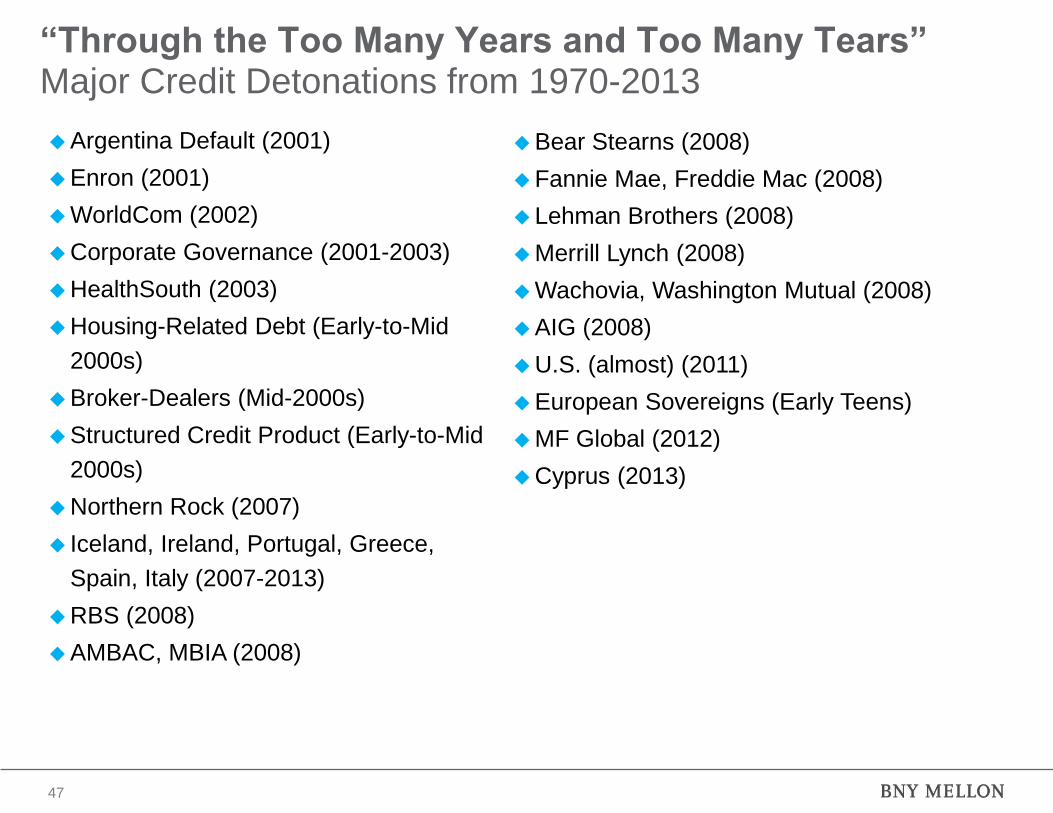
“Through the Too Many Years and Too Many Tears” Major Credit Detonations from 1970-2013
46
Penn Central (1970)
W.T. Grant (1976)
Nuclear-Building Utilities (Mid-1970s, Late
1980s)
Electric Utilities (Mid-1970s to Mid-1980s)
U.S. Manufacturers: Rust-Belt
Restructuring (Mid-1970s)
U.S. Money Center Banks (Late 1970s-
Early 1980s)
Energy Companies (Late 1970s)
Johns-Manville (1982)
Mexico (1982)
Penn Square (1982)
Continental Illinois (1984)
Underleveraged U.S. Industrials (Mid-
1980s)
U.S. High-Yield Corporate Debt (Mid-to-
Late 1980s)
S&Ls (late 1980s)
P.S. of New Hampshire (1988)
L.F. Rothschild (1988)
Columbia Savings (1989)
Franklin Savings and Loan (1990)
Drexel Burnham (1990)
U.S. Banks, European Banks (Early 1990s)
EM Debt (Early 1990s)
Asian Sovereigns (1997-1998)
European Telephone/Media (Late 1990s)
Bank of New England (1991)
Columbia Gas (1991)
Blue Chip Credit Massacre - Sears, GM,
Marriott (October 1992)
Askin Asset Management (1994)
Kidder Peabody (1994)
Mexico (1995)
Tiphook (1997)
LTCM, Russia Devaluation/Default (1998)
Information Security Identification: Confidential 47
Argentina Default (2001)
Enron (2001)
WorldCom (2002)
Corporate Governance (2001-2003)
HealthSouth (2003)
Housing-Related Debt (Early-to-Mid
2000s)
Broker-Dealers (Mid-2000s)
Structured Credit Product (Early-to-Mid
2000s)
Northern Rock (2007)
Iceland, Ireland, Portugal, Greece,
Spain, Italy (2007-2013)
RBS (2008)
AMBAC, MBIA (2008)
Bear Stearns (2008)
Fannie Mae, Freddie Mac (2008)
Lehman Brothers (2008)
Merrill Lynch (2008)
Wachovia, Washington Mutual (2008)
AIG (2008)
U.S. (almost) (2011)
European Sovereigns (Early Teens)
MF Global (2012)
Cyprus (2013)
“Through the Too Many Years and Too Many Tears” Major Credit Detonations from 1970-2013
Information Security Identification: Confidential
Fragility of Institutions: Acquired or Defunct 1974 to 2012
Halsey Stuart (1974)
Kuhn Loeb (1977)
White Weld (1978)
Hornblower & Weeks (1979)
Shearson Hayden Stone (1979)
Bache (1981)
Continental Illinois (1984)
Irving Securities (1988)
E.F. Hutton (1988)
L.F. Rothschild (1988)
Thompson McKinnon (1989)
First Boston (1990)
Drexel Burnham (1990)
Manufacturers Hanover (1991)
Security Pacific (1992)
Kidder, Peabody & Co. (1994)
Barings (1995)
Bank One (2004)
Refco (2005)
ABN Amro (2007)
Bear Stearns (2008)
Lehman Brothers (2008)
Merrill Lynch (2008)
MF Global (2011)
Peregrine Financial (2012)
First Interstate (1996)
Chemical (1996)
Alex Brown (1997)
Dillon Read (1997)
Dean Witter (1997)
Harris Trust (1998)
Salomon Brothers (1998)
First Chicago (1998)
Hambrecht & Quist (1999)
Bankers Trust (1999)
Yamaichi (1999)
Robert Fleming (2000)
Chase Manhattan (2000)
Wertheim Schroder (2000)
DLJ (2000)
Paine Webber (2000)
Prudential Securities (2003)
48
Information Security Identification: Confidential
Key Credit Diagnostic Problems
Macro obliviousness
Lack of differentiation between transitory cyclical and long-term structural factors
Failure to incorporate market signals (spreads, CDS, equities)
Siloization by industry issuers
Historical Ignorance
49
Information Security Identification: Confidential
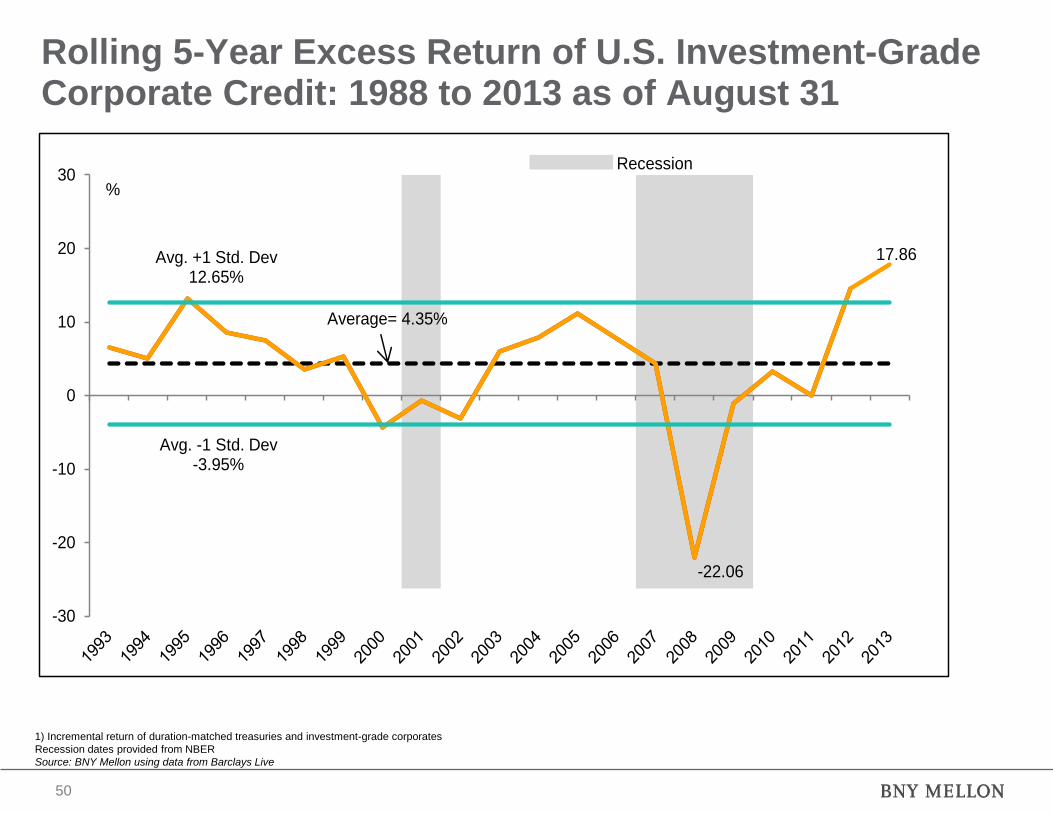
Rolling 5-Year Excess Return of U.S. Investment-Grade Corporate Credit: 1988 to 2013 as of August 31
1) Incremental return of duration-matched treasuries and investment-grade corporates
Recession dates provided from NBER
Source: BNY Mellon using data from Barclays Live
50
-22.06
17.86
-30
-20
-10
0
10
20
30
Avg. +1 Std. Dev12.65%
Avg. -1 Std. Dev-3.95%
Average= 4.35%
%
Recession
Information Security Identification: Confidential
2012 Second Best Year Ever for Spread Sectors; Lower Outperformance Expected in 2013 Global Spread-Sector Performance (Excess Return, bp): August 31, 2013
1) 2013 YTD: as of August 31
Excess Return: Excess returns remove the duration dependence of nominal returns and represent the incremental reward for the assumption of credit and volatility risk over the domestic
treasury curve
U.S. CMBS High Yield: As of January 1, 2011, High Yield CMBS was removed from the Barclays Global High Yield Index
*Excess returns are relative to U.S. Treasury bonds on a U.S. dollar-hedged basis
**Excess returns are relative to local European government curves on a euro-hedged basis
***Excess returns are relative to local Asian-Pacific government curves on a yen-hedged basis
Source: BNY Mellon using data from FactSet and Barclays Live
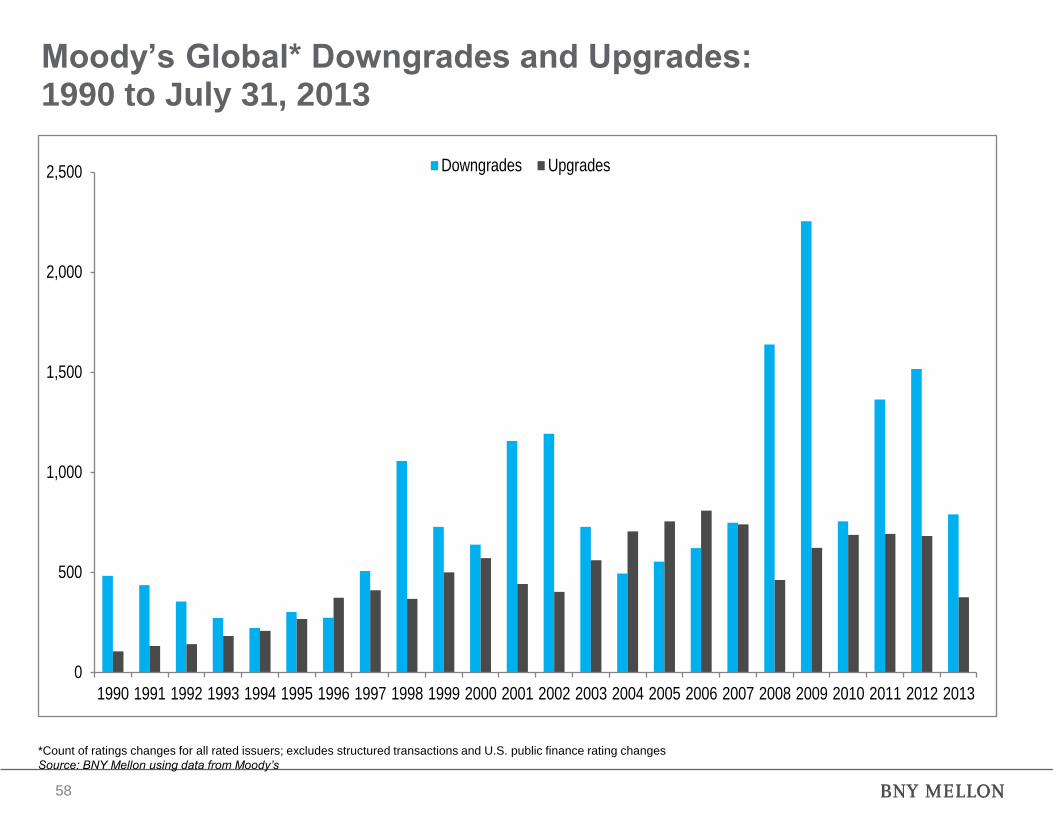
*Count of ratings changes for all rated issuers; excludes structured transactions and U.S. public finance rating changes
Source: BNY Mellon using data from Moody’s
59
Information Security Identification: Confidential
Conclusion
Reality conforms to theory: over the long run, credit products with higher long-term
returns than presumably risk-free government securities
Credit returns and risk viewed as “asymmetric.” Asset managers may suffer large,
transitory relative underperformance to Treasuries with the onset of systemic risk
event (i.e., the financial panic in September 2008). And the price of individual credit
securities may tumble from the par vicinity to zero in the event of default
Credit bond portfolio management requires more work and asset management firm
infrastructure than other debt asset classes
Thousands of credit choices, dozens of security forms, multiple structures
Global credit asset class size to accelerate with new emerging-market based issuers
Global bond management philosophy evolution: euro in 1999; usage of CDS; new
quantitative tools for relative- value rankings, asset allocation; credit portfolios
globalized; major portfolio-duration bets less common because of duration-timing
disappointments
Higher long-term returns of corporates, migration from “government-only index
benchmarks” to “government plus corporate and securitized index benchmarks,”
propelled investor interest in global credit portfolio optimization as a path to more
consistent overall portfolio outperformance in an increasingly competitive asset
management industry
60
Information Security Identification: Confidential
This publication is provided to you for information purposes only. There are no offers to buy or sell or soliciting offers to buy or sell any financial instrument. The information contained in this publication has been obtained from sources that are known to be reliable, but we do not represent or warrant that it is accurate or complete. The views in this publication are those of the authors and are subject to change, and there is no obligation to update opinions or the information in this publication. The forecasts contained herein are for illustrative purposes only and are not to be relied upon as advice or interpreted as a recommendation. In addition, the forecasts are based upon subjective estimates and assumptions about circumstances and events that may not yet have taken place and may never do so. BNY Mellon Center for Global Investment & Market Intelligence initiates strategic investment thought leadership throughout BNY Mellon. Responsibilities include contributing to Investment Management’s global and market knowledge platform through analysis of geopolitical factors, global economics, investment asset classes, and market activity. BNY Mellon Investment Management is one of the world’s leading investment management organizations and one of the top U.S. wealth managers, encompassing BNY Mellon’s affiliated investment management firms, wealth management organization and global distribution companies. BNY Mellon is the corporate brand of The Bank of New York Mellon Corporation and may also be used as a generic term to reference the Corporation as a whole or its various subsidiaries generally. The views and opinions in this presentation are those of the Center for Global Investment & Market Intelligence.