30
INTERNATIONAL EXPERIENCE IN INNOVATIONS IN METRO RAIL Gerald Ollivier Transport Cluster Leader Singapore, World Bank

INTERNATIONAL EXPERIENCE ININNOVATIONS IN METRO RAIL
Gerald OllivierTransport Cluster Leader
Singapore, World Bank

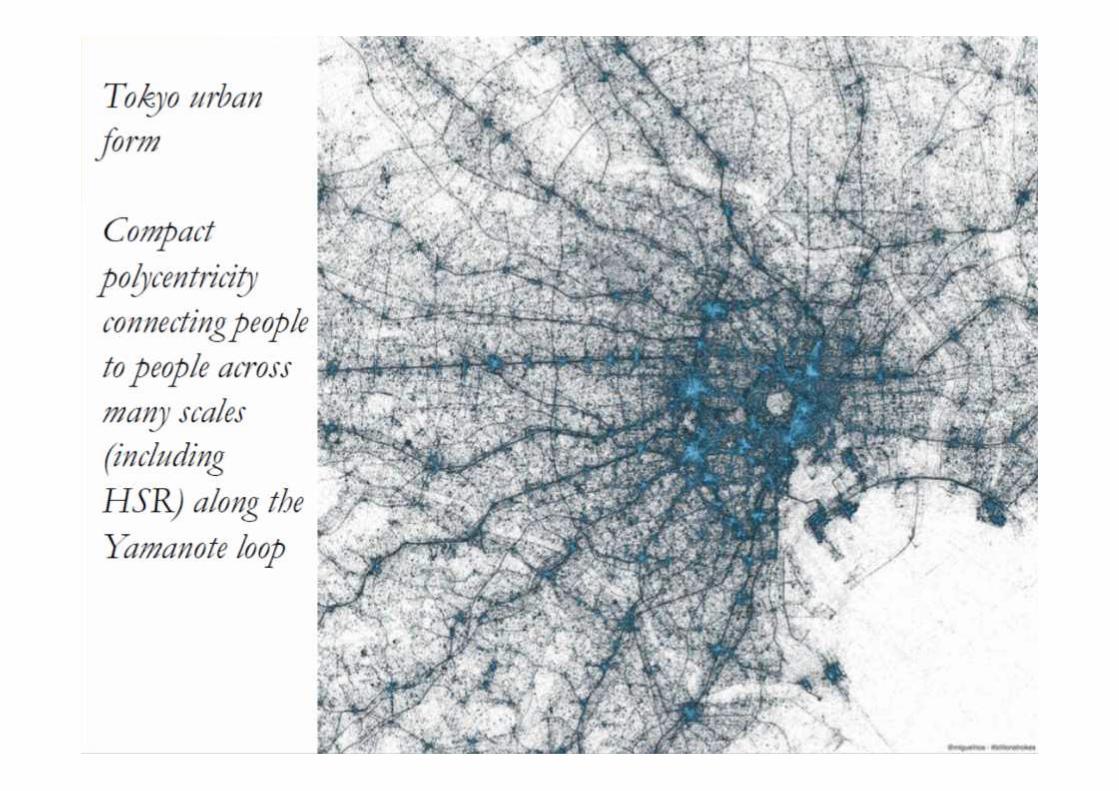
Innovation 1: Density Aligned withTransit

From Serge Salat

London’s Jobs densities are clearlyclustered around subway stations
Source: Urban Morphology Institute (2015)

Population Density (London)
Source: Urban Morphology Institute (2015)

Innovation 2: TOD-Land ValueCapture Typology of Stations

• Node Value based on itslocation in the network
• Place Value based on itsurban qualities
• Market Value, based onits economic potential
The “3V Framework”
The 3V Framework (Serge Salat, Gerald Ollivier)

• Hub, Interchange, Single station• Diversity of connectivity• Node Accessibility/Centrality• Intensity of node activity
Node Value (London Tube)
0
10
20
30
40
50
60
70
80
90
Mill
ion
peop
le /
yea
r
Rank
Source: Urban Morphology Institute
0
50
100
150
200
250
1 2 3 4 5 6
Num
ber o
f sta
tions
Number of lines per station

• Mix of land uses• Density of social
infrastructure• Compactness• Physical form
and streetpatterns
• Walkability andbikability
Place Value
Source: Urban Morphology Institute
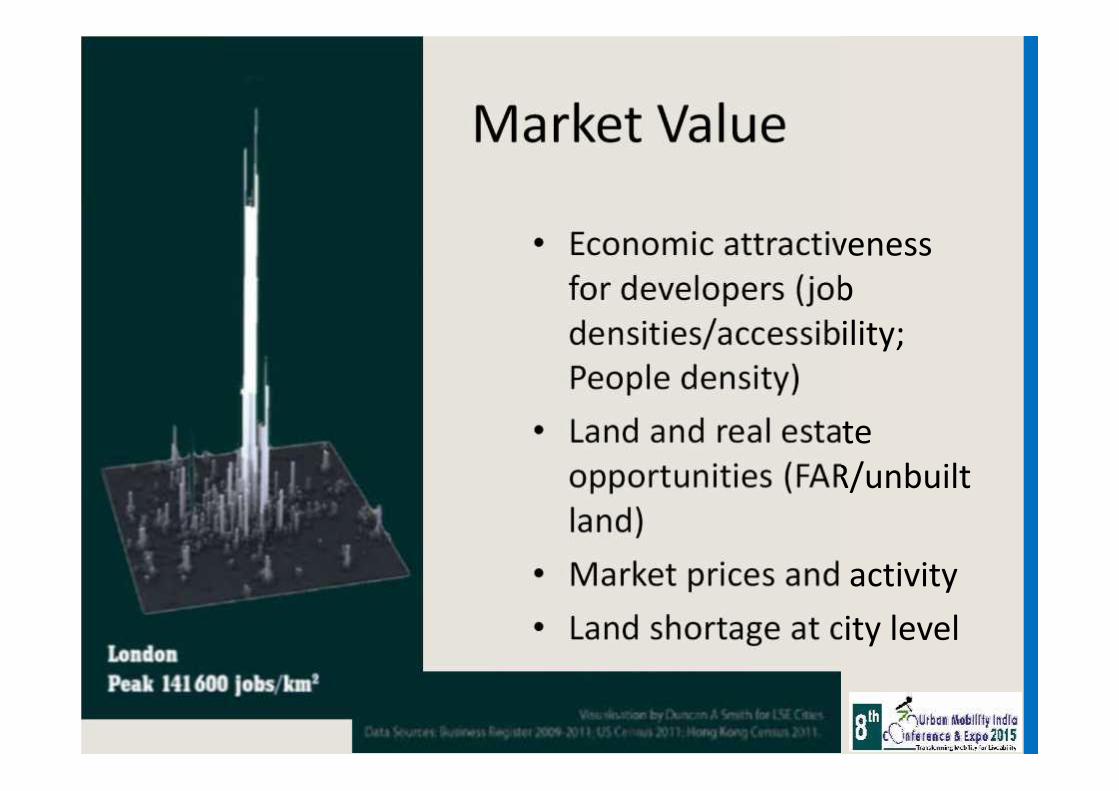
• Economic attractivenessfor developers (jobdensities/accessibility;People density)
• Land and real estateopportunities (FAR/unbuiltland)
• Market prices and activity• Land shortage at city level
Market Value
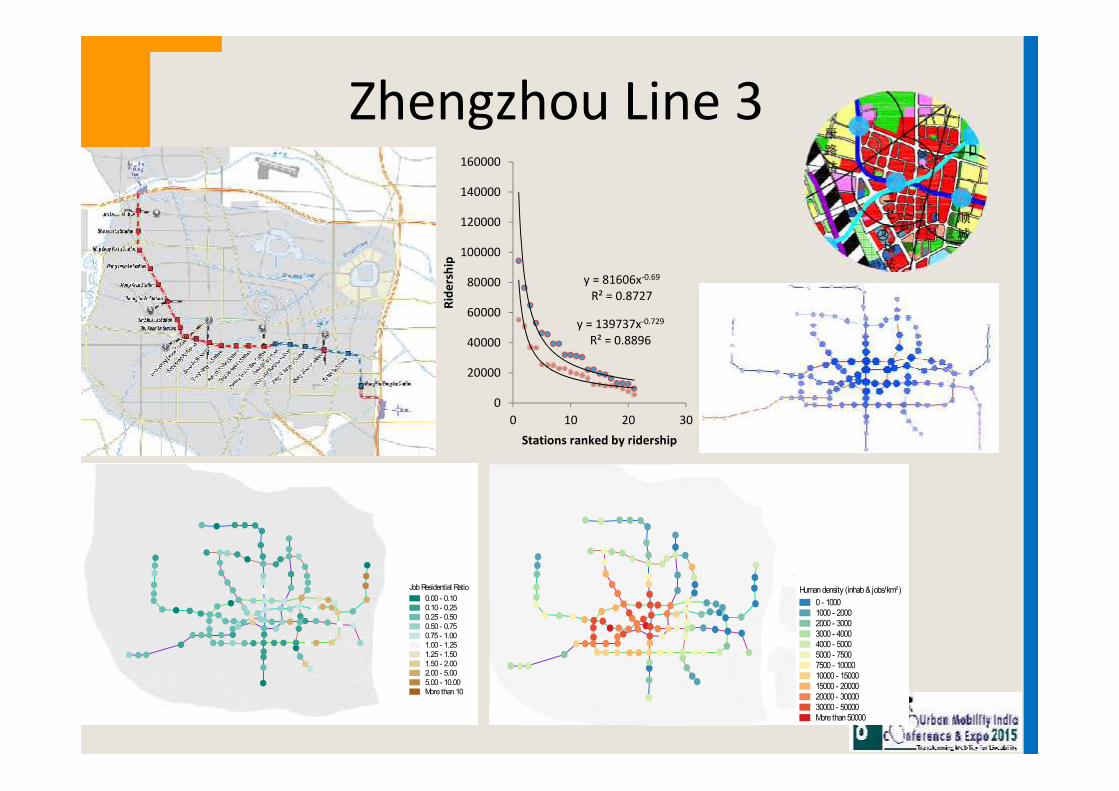
y = 81606x-0.69
R² = 0.8727
y = 139737x-0.729
R² = 0.8896
0
20000
40000
60000
80000
100000
120000
140000
160000
0 10 20 30
Ride
rshi
pStations ranked by ridership
Humandensity (inhab& jobs/km²)0 - 10001000 - 20002000 - 30003000 - 40004000 - 50005000 - 75007500 - 1000010000 - 1500015000 - 2000020000 - 3000030000 - 50000More than50000
JobResidential Ratio0.00 - 0.100.10 - 0.250.25 - 0.500.50 - 0.750.75 - 1.001.00 - 1.251.25 - 1.501.50 - 2.002.00 - 5.005.00 - 10.00More than10
Zhengzhou Line 3

Results in Zhengzhou Line 3

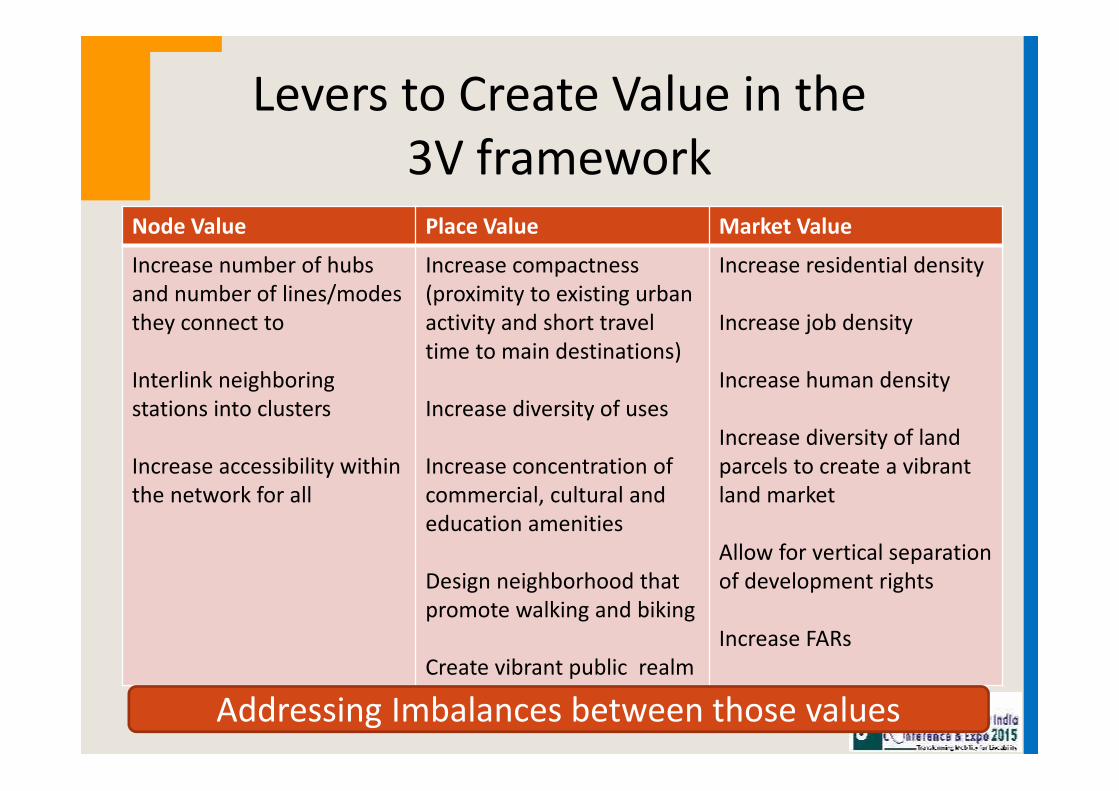
Node Value Place Value Market Value
Increase number of hubsand number of lines/modesthey connect to
Interlink neighboringstations into clusters
Increase accessibility withinthe network for all
Increase compactness(proximity to existing urbanactivity and short traveltime to main destinations)
Increase diversity of uses
Increase concentration ofcommercial, cultural andeducation amenities
Design neighborhood thatpromote walking and biking
Create vibrant public realm
Increase residential density
Increase job density
Increase human density
Increase diversity of landparcels to create a vibrantland market
Allow for vertical separationof development rights
Increase FARs
Levers to Create Value in the3V framework
Addressing Imbalances between those values

Innovation 3: Look at accessibilitywith open data (GTFS) and open tools
(Open Transit Indicators)

Zhengzhou Urban Transport

Transit Level of Service IndicatorsBasic Transit System Indicators
• Average headway/frequency• Number of service hours• On-time performance• 平均发车频率• 服务时长• 准点性能评价
Service Schedule服务时间• Number of stops• Average distance between
stops• 公交站点总数• 平均站点间距
Stops站点• Number of modes• Total length of transit routes• 公交模式数量• 公交线路总长
Routes线路
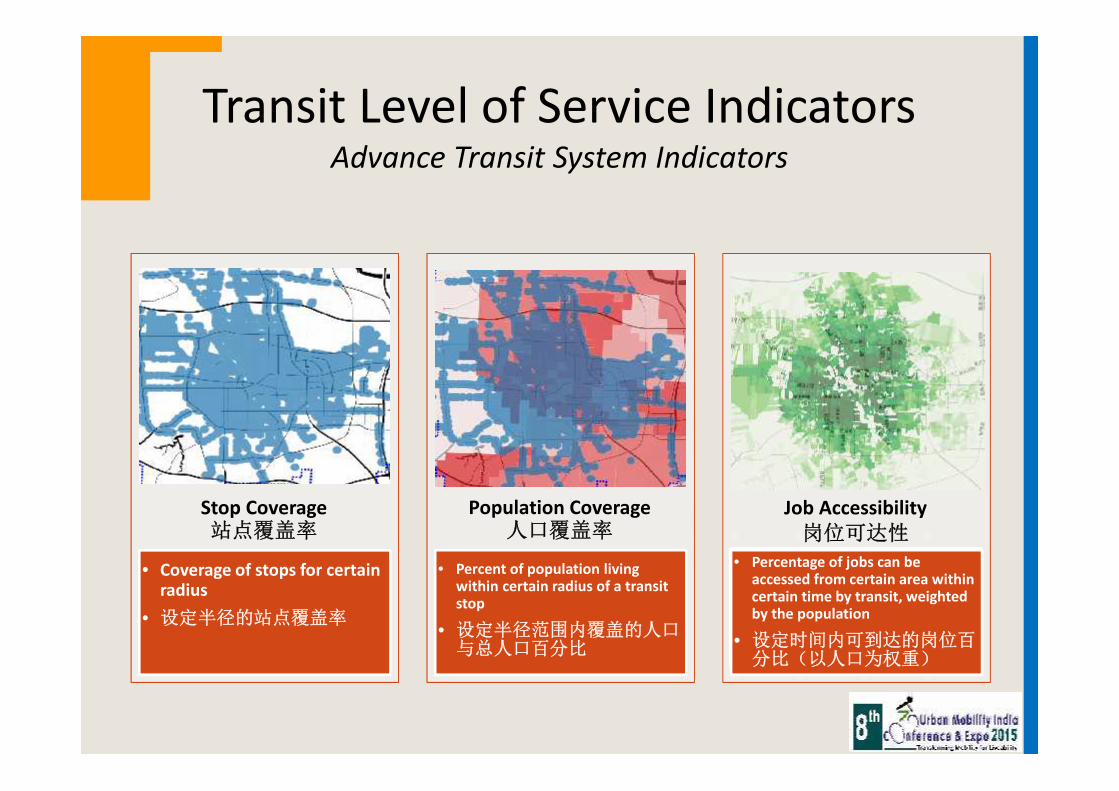
Transit Level of Service IndicatorsAdvance Transit System Indicators
• Coverage of stops for certainradius
• 设定半径的站点覆盖率
Stop Coverage站点覆盖率
• Percent of population livingwithin certain radius of a transitstop
• 设定半径范围内覆盖的人口与总人口百分比
Population Coverage人口覆盖率
• Percentage of jobs can beaccessed from certain area withincertain time by transit, weightedby the population
• Percentage of jobs can beaccessed from certain area withincertain time by transit, weightedby the population
• 设定时间内可到达的岗位百分比(以人口为权重)
Job Accessibility岗位可达性
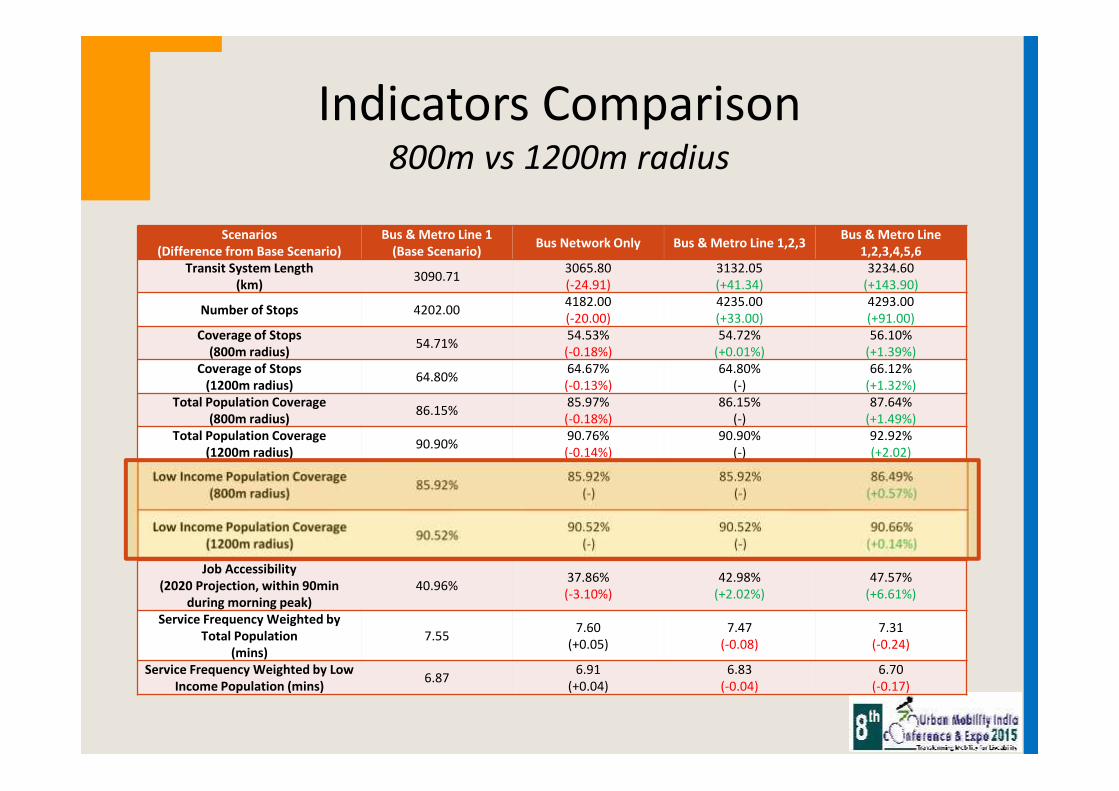
Scenarios(Difference from Base Scenario)
Bus & Metro Line 1(Base Scenario) Bus Network Only Bus & Metro Line 1,2,3 Bus & Metro Line
1,2,3,4,5,6Transit System Length
(km) 3090.71 3065.80(-24.91)
3132.05(+41.34)
3234.60(+143.90)
Number of Stops 4202.00 4182.00(-20.00)
4235.00(+33.00)
4293.00(+91.00)
Coverage of Stops(800m radius) 54.71% 54.53%
(-0.18%)54.72%
(+0.01%)56.10%
(+1.39%)Coverage of Stops
(1200m radius) 64.80% 64.67%(-0.13%)
64.80%(-)
66.12%(+1.32%)
Total Population Coverage(800m radius) 86.15% 85.97%
(-0.18%)86.15%
(-)87.64%
(+1.49%)Total Population Coverage
(1200m radius) 90.90% 90.76%(-0.14%)
90.90%(-)
92.92%(+2.02)
Low Income Population Coverage(800m radius) 85.92% 85.92%
(-)85.92%
(-)86.49%
(+0.57%)
Low Income Population Coverage(1200m radius) 90.52% 90.52%
(-)90.52%
(-)90.66%
(+0.14%)
Job Accessibility(2020 Projection, within 90min
during morning peak)40.96% 37.86%
(-3.10%)42.98%
(+2.02%)47.57%
(+6.61%)
Service Frequency Weighted byTotal Population
(mins)7.55 7.60
(+0.05)7.47
(-0.08)7.31
(-0.24)
Service Frequency Weighted by LowIncome Population (mins) 6.87 6.91
(+0.04)6.83
(-0.04)6.70
(-0.17)
Indicators Comparison800m vs 1200m radius

Accessibility for the Poor

Innovation 4: PPP Financing

From George Darido

PPP Example: Lima Metro 2:Project Financing Sources
• Government of Peru will finance its contribution towards the PPP frombudgetary resources and loans provided by International FinancialInstitutions (IFIs).
• World Bank (IBRD) loan for US$ 300 million approved on September 15, 2015(P145610)
US$ million % of FinancingTotal Public Financing by GoP 4,185 71.7%Total Foreign Debt 1,900 32.6%IBRD (2015) 300 5.2%IADB 300 5.2%CAF 150 2.5%Other/future IFI loans 1150 19.7%Public Treasury 2,285 39.1%Concessionaire (Private Financing) 1,651 28.3%Total Estimated Cost 5,836 100%

Risk MatrixRisk Type Public, Private or Shared RiskDemand Public assumes all fare revenue risk and must develop and implement a public
transport reorganization plan.Land Acquisition andResettlement
100% Public, must provide required land to the concessionaire “free and clear”
Design 100% Private, must meet all requirements and obtain required approvalsInterferences and utilities • Private is responsible for all known utility relocation, geological conditions
and other related interferences.• Public is responsible for all unknown utility relocation, geological conditions
and chance archeological finds.Construction and Financing Private responsible for all costs and time overruns under its responsibility (input
costs, availability of material and equipment, design or implementationproblems, environmental requirements, etc).
Operational Performance • Private must meet level of service requirements or is penalized.• Private receives a minimum annual operations payment but Gov’t may
regulate level of service above this.Ancillary revenues Shared: gross revenues to be split between Public and Private on all advertising,
commercial leasing and other services within concession areas (stations andimmediate surroundings) with approval by Granting Authority.

Innovation 5: Technology
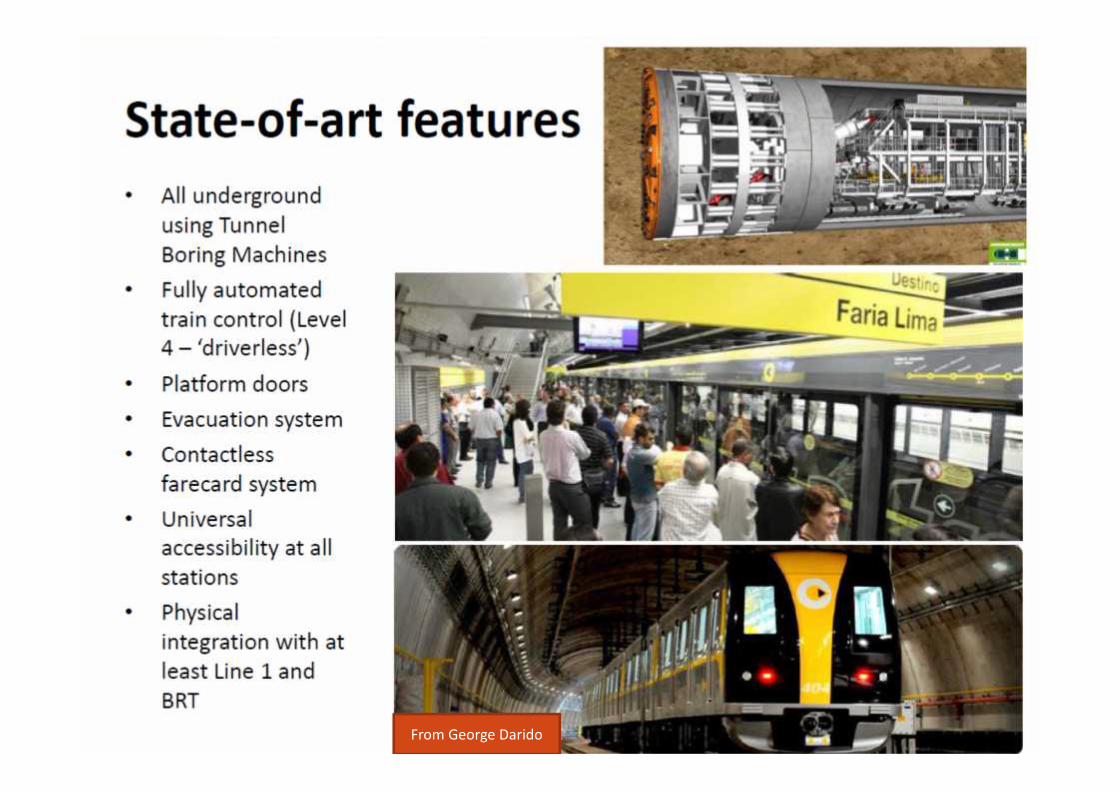
From George Darido


