1 www.bea.gov The Impact of Multi- National Companies on Balance of Payments and National Accounts Working Group on Impact of Globalization on National Accounts April 23-24, 2008 J. Steven Landefeld, Brent Moulton, and Obie Whichard Agenda item 10 Invited paper 20
Transcript
1www.bea.gov
The Impact of Multi-National Companies on Balance of Payments and National
Accounts
Working Group on Impact of Globalization on National Accounts
April 23-24, 2008
J. Steven Landefeld, Brent Moulton, and Obie Whichard
Agenda item 10
Invited paper 20
2www.bea.gov
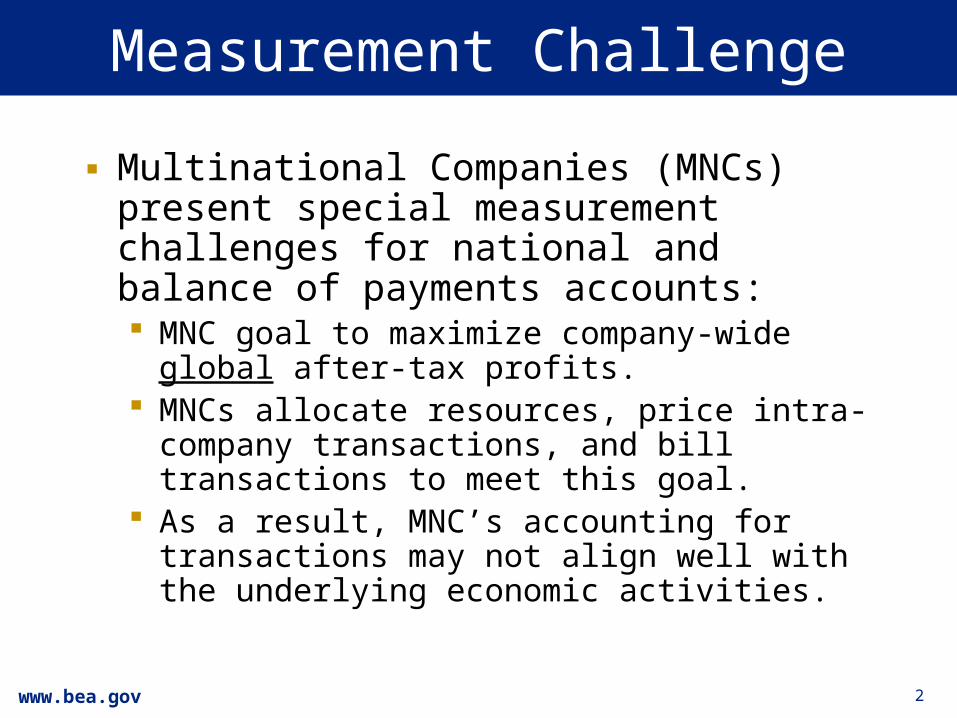
Measurement Challenge
▪ Multinational Companies (MNCs) present special measurement challenges for national and balance of payments accounts: MNC goal to maximize company-wide global
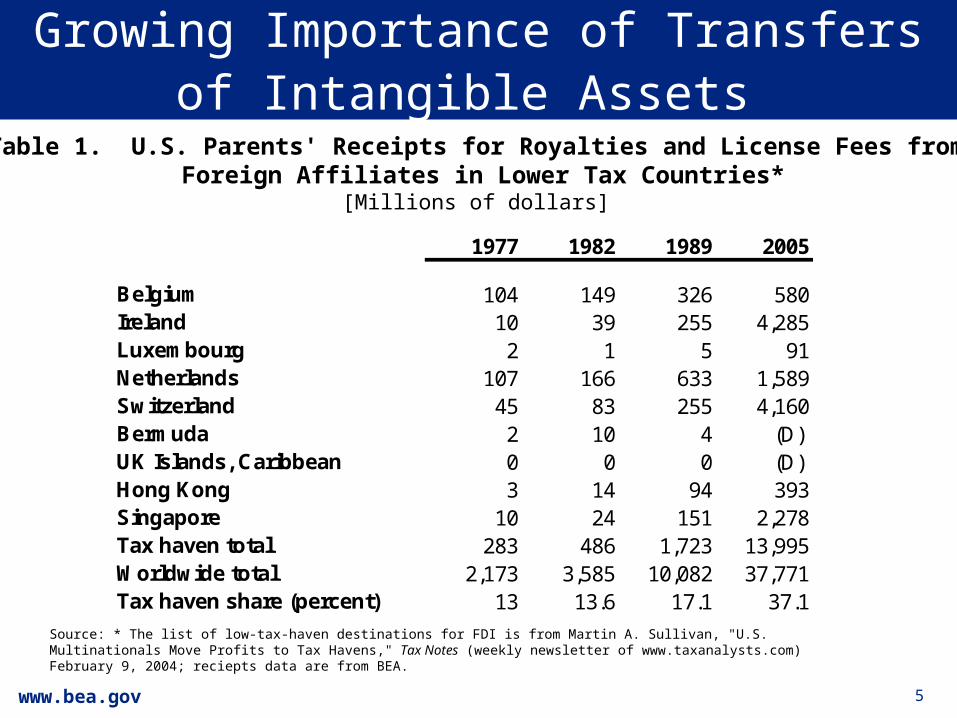
Source: * The list of low-tax-haven destinations for FDI is from Martin A. Sullivan, "U.S. Multinationals Move Profits to Tax Havens," Tax Notes (weekly newsletter of www.taxanalysts.com) February 9, 2004; reciepts data are from BEA.
6www.bea.gov
Other Means of Reallocating Income
▪ Establishing finance or holding company affiliates in low-tax countries
▪ Structuring transfer prices to shift net income toward subsidiaries in lower tax countries;
▪ Establishing offshore factoring corporations in low tax countries that bill and collect for the parent’s worldwide sales; and
▪ Inverting the corporate ownership structure, with an overseas entity in a low-tax country becoming the parent that collects net income for the MNC’s worldwide corporate structure.
7www.bea.gov
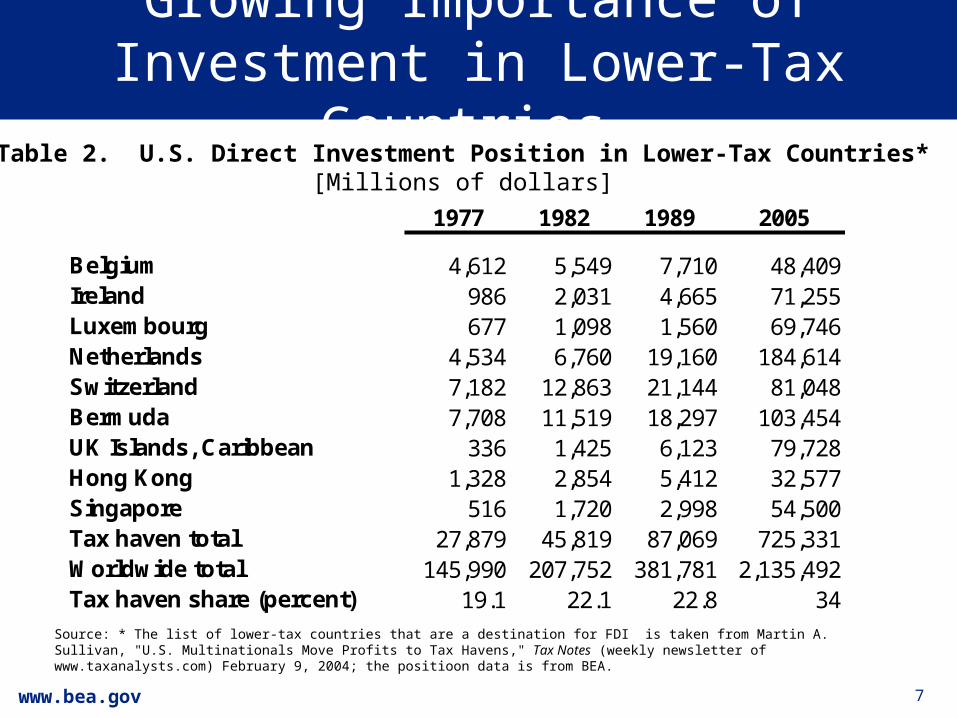
Growing Importance of Investment in Lower-Tax Countries
Table 2. U.S. Direct Investment Position in Lower-Tax Countries*[Millions of dollars]
Source: * The list of lower-tax countries that are a destination for FDI is taken from Martin A. Sullivan, "U.S. Multinationals Move Profits to Tax Havens," Tax Notes (weekly newsletter of www.taxanalysts.com) February 9, 2004; the positioon data is from BEA.
8www.bea.gov
Other Issues in MNC Allocation of Income
▪ MNCs allocate profits, retained earnings, and record transfer prices in ways that differ from the underlying economic transactions for strategic as well as tax reasons.
▪ Also, MNCs are worldwide corporations and, for many transactions, place limited importance on national boundaries. As a result their business records may not
support more accurate reporting of geography to statistical agencies.
9www.bea.gov
Impacts of Global Allocation of Income
On Nominal GDP & BOP: Lower recorded GDP and
exports, and raise imports, in high tax countries
Raise recorded GDP and exports, and lower imports, in low tax countries
10www.bea.gov
Possible Solutions
▪ Limited potential for improvement on tax-motivated transfer pricing issues
▪ However, some MNC reporting practices may be amenable to consistent reporting with international guidelines, through:
Respondent outreach efforts Clarification of instructions Cognitive work to redesign survey forms
11www.bea.gov
Possible Solutions (continued)
▪ Other solutions: Further work by national
accountants and business accountants on valuing and accounting for intangible assets.
Collection of data on the basis of the “ultimate beneficial owner.”
12www.bea.gov
Impact of MNCs and Offshoring on Real GDP
▪ Domestic producers switch from domestic suppliers to non-comparable imports
Difference in price between foreign supplier and domestic supplier not reflected in price indexes. Import price index measures prices only from
foreign suppliers; producer price index measures prices only from domestic producers.
Understatement of real imports and intermediate inputs
Overstatement of real GDP and Productivity
13www.bea.gov
Impact of MNCs and Offshoring on Real GDP
14www.bea.gov
Impact of MNCs and Offshoring on Real GDP
Overstatement of U.S. real GDP and productivity may not be large: 0.1 percentage point on real GDP growth
and 0.2 on productivity. Also, understatement of imports (17% of
U.S. GDP) may be more than offset by similar problem with switch to new goods and services produced domestically
15www.bea.gov
Possible Solutions
▪ Given the pervasive nature of the “new goods” problem and the absence of a clear solution, it may be difficult to develop a global “fix” However, further research into direct
comparisons, indirect estimates (Feenstra, Reinsdorf, and Slaughter), hedonic, and other techniques (Aizcorbe and Nestoriak) may yield solutions.