Page 1
International Journal of Advanced Technology in Engineering and Science www.ijates.com
Volume No.03, Special Issue No. 02, February 2015 ISSN (online): 2348 – 7550
710 | P a g e
PETROGRAPHIC – MINERALOGICAL ANALYSIS OF
AGGREGATES FROM DEVOLL HYDROPOWER
PROJECT
Rezarta QEMALLAJ1 ,dr. ing. Alma GOLGOTA
1
Authors Affiliations: Prof.Dr. Marie Koçi
1 ( KIBE1 Laborator , Durres, Albania)
1 ( Department of Engeneering Science, Faculty of Professional Studies, "Aleksander Moisiu" University,
Durres, Albania)
ABSTRACT
The petrographic examination in Devoll aggregates establish whether the aggregate contains chemically unstable
minerals such as soluble sulfates, unstable sulfides that may form sulfuric acid or create distress in concrete
exposed to high temperatures during service, or volumetrically unstable materials such as micas, smectites
(formerly known as the montmorillonite-saponite group of minerals or swelling clays). Specifications has limited
the quartz content of aggregates for use in concrete that is subjected to high temperatures because of the conversion
to beta-quartz at 573°C (1063°F), with accompanying volume increase. The petrographic tests made on aggregates
are based on the American method ASTM C 295, British standard method BS 812: Part 104, European standard EN
932-3.The problems mentioned above are analyzed in aggregates taken from Devoll Hydropower Project.
Keywords: Devoll Aggregates , Soluble Sulfates, Unstable Sulfides, Petrographic Tests
I INTRODUCTION
Natural aggregates are the most important constituent in many building materials e.g concrete, mortar and roads.
Natural aggregates of Devoll Hydropower Project are processed from natural deposits of sand, gravel or crushed
rock. The method to describe and classify aggregates is the petrographic analysis. The petrographic analysis is a
systematic description method for rocks, minerals and other constituents, usually in hand specimens, thin sections or
by use of other analytical methods (e.g. XRF- analysis). The purpose with the petrographic analysis is to obtain
information on one or all of the material characteristics: Geometrical–mechanical, physical-and chemical properties,
impurities, contamination and very important the rock and mineral content. The rock and minerals constituents are
in many cases conclusive for the end use of aggregate.
Petrographic examination in this study identify and call attention to potentially alkali-silica reactive and alkali-
carbonate reactive constituents, determine such constituents quantitatively, and recommend additional tests to
Page 2
International Journal of Advanced Technology in Engineering and Science www.ijates.com
Volume No.03, Special Issue No. 02, February 2015 ISSN (online): 2348 – 7550
711 | P a g e
confirm or refute the presence in significant amounts of aggregate constituents capable of alkali reaction in concrete.
Alkali-silica reactive constituents found in aggregates include:
opal, chalcedony, cristobalite, tridymite, highly strained quartz, microcrystalline quartz, volcanic glass, and
synthetic siliceous glass. Aggregate materials containing these constituents include: glassy to cryptocrystalline
intermediate to acidic volcanic rocks, some argillites, phyllites, greywacke, gneiss, schist, gneissic granite, vein
quartz, quartzite, sandstone, and chert.
Potentially deleterious alkali-carbonate reactive rocks are usually calcareous dolomites or dolomitic limestones
with clayey insoluble residues. Some dolomites essentially free of clay and some very fine-grained limestones free
of clay and with minor insoluble residue, mostly quartz, are also capable of some alkali-carbonate reactions,
however, such reactions are not necessarily deleterious.
Here petrographic examination is directed specifically at the possible presence of contaminants in aggregates, such
as synthetic glass, cinders, clinker, or coal ash, magnesium oxide, calcium oxide, or both, gypsum, soil,
hydrocarbons, chemicals which may affect the setting behavior of concrete or the properties of the aggregate,
animal excrement, plants or rotten vegetation, and any other contaminant that may prove undesirable in concrete
used at Devoll Hydropwer Project.
II MATERIALS AND METHODOLOGY
2.1 Materials
The samples subjected to be tested for Petrographic-mineralogical analysis are listed below:
1. Limestone (873.6 gr).
2. Natural river gravel (732.9 gr.)
3. Gravel 1 (416.8 gr), 1-4-6 mm.
4. Gravel 1 (50 grains, 73.5 gr.), grain size = 8-14 mm,
5. Gravel 2 (30 grains, 235.8 gr.), grain size = 1-2 cm.
6. Gravel 2 (51 grains, 263.3 gr.), grain size = 12.5-20 mm
7. Gravel 2 (12 grains, 518.4 gr.), grain size = 32.5- 45 mm.
8. Gravel 2 [> 32.5-40 mm].
2.2 Methodology
2.2.1 Chemical analysis of samples
Table 1. Chemical composition of aggregates
Main oxides
1 2 3 4
Natural river sand Crashed gravel
12-38 mm Gravel 1 Limestone
Page 3
International Journal of Advanced Technology in Engineering and Science www.ijates.com
Volume No.03, Special Issue No. 02, February 2015 ISSN (online): 2348 – 7550
712 | P a g e
SiO2 53.18 43.25 43.98 2.23
CaO 15.35 23.04 24.01 50.29
MgO 9.10 6.43 5.76 0.77
Fe2O3 5.67 4.72 3.80 0.63
Al2O3 9.65 13.93 13.54 0.98
SO3 0.11 0.10 0.13 0.21
K2O 1.26 1.24 1.24 _
Na2O 0.82 0.84 0.83 _
LOI 0.25 2.36 2.19
Total 95.39 95.91 95.48
Test results for chemical composition of aggregates are realized at FKCF Cement factory, Albania.
2.2.2 Physical analysis of samples
Table 2. Determination of specific density for CRASHED GRAVEL 05-12mm sample
No. TEST DESCRIPTION UNITS SAMPLE
1 Grain size mm 05/12 05/12
2 Temperature ºC 20 20
3 Water density g/cm3 1.0000 1.0000
4 Sample SSD weight g 500.10 500.00
5 Pycnometer no.(1000 ml) ml 1 1
6 Mass of pycnometer + water g 1,178.60 1,178.60
7 Mass of pycnometer + water+ sample g 1,493.50 1,494.00
8 Dry mass of sample for absorption test g 117.20 74.80
9 SSD mass of sample for absorption test g 115.90 73.90
10 Absorption % 1.122 1.218
11 Average absorption value % 1.170
12 SSD density ( each sample ) g/cm3 2.700 2.709
13 SSD density( average value) g/cm3 2.704
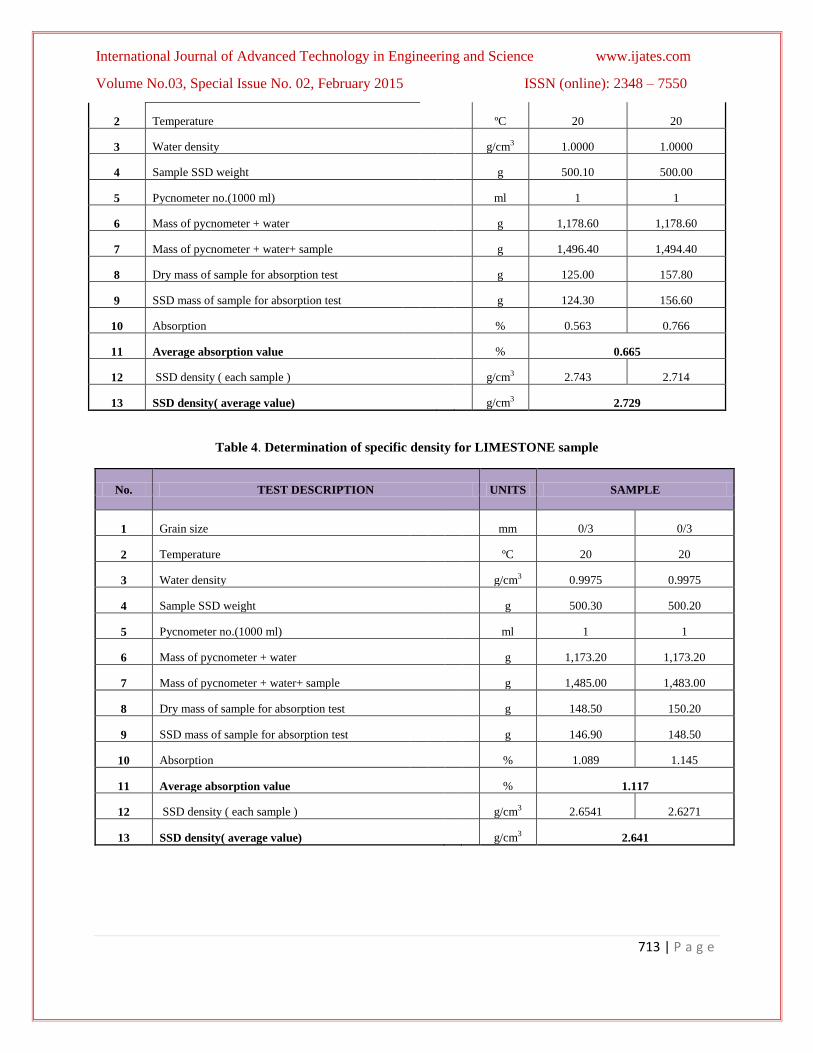
Table 3. Determination of specific density for CRASHED GRAVEL 12-38mm sample
No. TEST DESCRIPTION UNITS SAMPLE
1 Grain size mm 12/38 12/38
Page 4
International Journal of Advanced Technology in Engineering and Science www.ijates.com
Volume No.03, Special Issue No. 02, February 2015 ISSN (online): 2348 – 7550
713 | P a g e
2 Temperature ºC 20 20
3 Water density g/cm3 1.0000 1.0000
4 Sample SSD weight g 500.10 500.00
5 Pycnometer no.(1000 ml) ml 1 1
6 Mass of pycnometer + water g 1,178.60 1,178.60
7 Mass of pycnometer + water+ sample g 1,496.40 1,494.40
8 Dry mass of sample for absorption test g 125.00 157.80
9 SSD mass of sample for absorption test g 124.30 156.60
10 Absorption % 0.563 0.766
11 Average absorption value % 0.665
12 SSD density ( each sample ) g/cm3 2.743 2.714
13 SSD density( average value) g/cm3 2.729
Table 4. Determination of specific density for LIMESTONE sample
No. TEST DESCRIPTION UNITS SAMPLE
1 Grain size mm 0/3 0/3
2 Temperature ºC 20 20
3 Water density g/cm3 0.9975 0.9975
4 Sample SSD weight g 500.30 500.20
5 Pycnometer no.(1000 ml) ml 1 1
6 Mass of pycnometer + water g 1,173.20 1,173.20
7 Mass of pycnometer + water+ sample g 1,485.00 1,483.00
8 Dry mass of sample for absorption test g 148.50 150.20
9 SSD mass of sample for absorption test g 146.90 148.50
10 Absorption % 1.089 1.145
11 Average absorption value % 1.117
12 SSD density ( each sample ) g/cm3 2.6541 2.6271
13 SSD density( average value) g/cm3 2.641
Page 5
International Journal of Advanced Technology in Engineering and Science www.ijates.com
Volume No.03, Special Issue No. 02, February 2015 ISSN (online): 2348 – 7550
714 | P a g e
Table 5. Determination of specific density for NATYRAL RIVER SAND 0-5mm sample
No. TEST DESCRIPTION UNITS SAMPLE
1 Grain size mm 0/5 0/5
2 Temperature ºC 20 20
3 Water density g/cm3 1.0000 1.0000
4 Sample SSD weight g 500.10 500.00
5 Pycnometer no.(1000 ml) ml 1 1
6 Mass of pycnometer + water g 1,178.60 1,178.60
7 Mass of pycnometer + water+ sample g 1,489.60 1,488.90
8 Dry mass of sample for absorption test g 107.70 76.10
9 SSD mass of sample for absorption test g 106.00 74.70
10 Absorption % 1.604 1.874
11 Average absorption value % 1.739
12 SSD density ( each sample ) g/cm3 2.645 2.636
13 SSD density( average value) g/cm3 2.640
III RESULTS AND TABLES
3.1 Petrographic Description
Sample 1 – Crushed limestone sand (873.6 grams)
Figure 1 and 2 represent crushed limestone sand, observed optically, with main composition made of totally crushed
calcite [CaCO3] represented by beige to yellow color. Limestone grains dimensions range from hundredths of mm
(in powder form), which occupies 15% of the total amount, up to tenths of mm which occupies about 55% of the
total mass of sample. 35% of remaining mass has non uniform shape with dimensions ranging from 1-3 mm. Minor
of clay spots are observed in the limestone grains which gave darker color to the material. By chemical analysis of
the sample labeled limestone in Table 1, results that this material content is of pure lime and have calcite main
composition.
Sample 1 – River sand (732.9 grams)
Figure 3 shows river sand material optically observed as fractioned scarification material with non uniform shape.
From stereomicroscope observation is concluded that:
Page 6
International Journal of Advanced Technology in Engineering and Science www.ijates.com
Volume No.03, Special Issue No. 02, February 2015 ISSN (online): 2348 – 7550
715 | P a g e
a) The size of the granules and aggregates have dimensions ranging from hundredths of mm to powder form, and
represent about 10% of the total mass,
b) Consist mainly of aggregates with size ranging to tenths mm, which made up 60% of total amount of sample
taken for petrographic test analysis,
c) Grain size of this aggregate range from 1 to 4 mm which represent 30% of the total mass of the sample tested.
Fig. 1: Natural view of limestone sand. Fractioned, Fig. 2: Limestone sand observed with stereomicrospe
granular calcaleorous material with dimmension apparatus with magnification 8 x.
ranging from hundretths to tenths of mm. Calcareous granular aggregate represented by
Grain size is 1-3 mm. beige – yellow colour.
Fig. 3: Natural view of natural sand. Fig. 4: River sand, observed with stereomicroscope
Granular fractioned river sand with ferrous apparatus, with aluminosilicate magnification scale 8x.
pieces represented by green –black colour, Chloride aggregates-grains, olivine, pyroxene, olivine –
pyroxene (silicate), quartz, quartz and calcite.
calcareous – carbonate, metallic grains.
Page 7
International Journal of Advanced Technology in Engineering and Science www.ijates.com
Volume No.03, Special Issue No. 02, February 2015 ISSN (online): 2348 – 7550
716 | P a g e
In mineral composition are included: (Figures no.3; 4; 5)
a. Chloride aggregates (aluminum silicates of iron), 34% of total mass represented by color green to darkness.
b. Olivine + Pyroxene (Ca, Fe and Mg silicates) 12% of total mass.
c. Quartz (SiO2), 35% of the total mass.
d. Fractioned calcite aggregates (Calcite – CaCO3), 13 % of the total mass.
e. Inserted grains of metallic minerals such as magnetite micro grains, pyrite micronic particles etc., made up
3-5%.
f. analysis is applied on river sand sample. All magnetic fractions were split apart and the observation was
made with Stereomicroscopes apparatus. During observation are noted fractions of inserted grains –
aggregates magnetic fractions of magnetite micro grains.
Fig. 5: Magnetic fraction of river sand sample observed with stereomicroscope apparatus, with magnification
scale 20x. Inserted aggregate – grains of micro magnetite mineral particles.
We should take in consideration:
First:
Based on ASTM C 295-03 standard requirements is important to observe the presence of non-stable chemical
minerals such as insoluble sulphates and non-stable sulfides which may effect on formation on sulphuric acid or
creation of surface tension of exposed concrete structures in high temperatures during the application, or non stable
volume minerals such as mica, smectite (known as Montmorillonite- -Saponite mineral group) or expanded clay.
Second:
Based on chemical analysis of samples it was necessary to prepare the sample for mineralogical observation of
sulphate content. Relating to petrographic analyses results during transmitted polarized microscope observation
there are noted points in range 20-40 microns of sulphur mineralization (Pyrite – FeS2).
Page 8
International Journal of Advanced Technology in Engineering and Science www.ijates.com
Volume No.03, Special Issue No. 02, February 2015 ISSN (online): 2348 – 7550
717 | P a g e
Fig. 6: Micrograph view of polished river sand sample surface observed on reflected light of mineralogical microscope.
Bright grains represent sulphur spots with dimensions ranging from 20-40 μ and PY index shows pyrite- FeS2.
Gravel 1 (416.8 gr.), 1-4-6 mm.
During the observation with stereomicroscope apparatus it is concluded that this sample, composed from micro-
aggregate grains with partially regular shaped size in range of 1mm, made 30% of total sample mass, while
dimensions 2-4 mm occupied 40% of total mass. Grains with dimension ranging from 4-6 mm made up to 30% of
the total mass of the sample (Fig. 7 & 8).
Fig. 7: Gravel 1, 1-4-6 mm, Natural view. Pieces of aggregate-grains with dimensions 1-4-6 mm, consist
mainly from sandy material pieces of darkness color, those with green to black color represent basalt
material while those colored with white to grey are calcareous aggregates (carbonate CaCO3).
Fig. 8: Gravel 1, observed with stereomicroscope apparatus with magnification scale 8x.
Carbonate aggregates, sandy material pieces with dimensions 2-4mm.
Page 9
International Journal of Advanced Technology in Engineering and Science www.ijates.com
Volume No.03, Special Issue No. 02, February 2015 ISSN (online): 2348 – 7550
718 | P a g e
Up to 50% of those aggregate-pieces are represented by sandy material, 25-30% from basalt material having dark
green to black color, while carbonate material – calcareous material (CaCO3) make 10-15% of total mass represent
by white – grey color.
Gravel 1 (50 pieces, 73.5 gr.) (8-14 mm)
During the observation with stereomicroscope is noted that this sample represent aggregate pieces with non uniform
shape and dimensions ranging from 8-14mm. Pieces are mostly sandy material making 65-75% of the total mass,
while basalt is up to 10-15% and calcareous pieces represent 15% of the total mass. (See Fig. 9).
Gravel 2 (30 pieces, 235.8 gr.) (1-2 cm.)
Made from fractioned aggregates with dimensions ranging from 1-2 cm (Fig. 10), which represent 65% of sandy
quartz micro grains, 20-25% is calcareous-carbonate which is represented by white-grey color while basalt pieces
and volcanic rocks (siliceous – chloride base) made up 10% of the total mass.
Fig. 9: Gravel 1, 8-14 mm, natural view. Fig. 10: Gravel 2 (1-2 cm), natural view.
Sandy material made of fractioned aggregates. Fractioned sandy material represented with
Basalt is represented by darkness pieces and beige-darkness color, while calcareous
calcareous material is represented by white-grey pieces. material is represented with white-grey color.,
Siliceous-chloride base volcanic rocks
represented with green to darkness color.
Gravel 2 (51 pieces, 263.3 gr.) (12.5-20 mm)
The sample is represented by fractioned aggregates with non-uniform shape (Fig. 11).
Sandy piece materials made 60-65% of the total mass while volcanic rocks (green color) with chloride content,
represent 10-15% of the total mass. Calcite pieces (CaCO3) with beige – yellow color represent 5-10% of the total
mass. Few pieces of red siliceous material (SiO2 with insertion of ferrous material) are represented with reddish
color.
Gravel 2 sample, was polished and prepared in thin section for examination with a transmitted or either reflected
light microscope to determine types of mineral rocks taken in this study.
Page 10
International Journal of Advanced Technology in Engineering and Science www.ijates.com
Volume No.03, Special Issue No. 02, February 2015 ISSN (online): 2348 – 7550
719 | P a g e
Fig. 11: Gravel 2, natural view (12.5-20 mm). Fig. 12: Gravel 2 sample, textured microstructure of sandy
Sandy aggregate pieces, chloride volcanic material observed on polarized light petrographic
rocks, calcites, while red siliceous pieces are microscope with magnification scale 40 x
very rare (mainly formed by iron hydroxides). (Quartz grain size ranging from 0.1 - 0.2 mm).
a. b.
Fig. 13: Gravel 2 crystalline Plagioclase with grain size 0.1-0.2 mm. Polarized light microscope:
a. Magnification scale 40x b. Magnification scale 100x
Sand material is composed mainly from quartz (Fig. 12) with dimensions ranging from 0.1 - 0.2 mm making 60 %
of the total mass of tested sample; plagioclase-anorthite 7-10 % (Fig. 13); mica grains (muscovite) up to 2-3 % (Fig.
14), inserted in cement of sand where chloride cement represent 15-20%, while opac minerals (magnetite, pyrite
etc.) 2-4% of the mass.
Fig. 14: Gravel 2, Sandy material containing mica grains (muscovite) in cement between quartz and
plagioclase –feldspar quantity with grain dimensions ranging from 0.1-0.2 mm. Polarized light microscope
with magnification scale 100x.
Page 11
International Journal of Advanced Technology in Engineering and Science www.ijates.com
Volume No.03, Special Issue No. 02, February 2015 ISSN (online): 2348 – 7550
720 | P a g e
Fig.15: Gravel 2
a. Sandy material with chloride cement content observed in polarized light microscope. Magnifications
scale 40x.
b. Black spots represent opac minerals (magnetite, pyrite, etj.)
Polarized light microscope. Magnifications scale 40 x.
Gravel 2 (12 pieces, 518.4 gr.) (32.5- 45 mm)
Sample composed from sandy pieces, basalt represented from green-black color pieces, calcite and chlorite volcanic
rocks are mainly fractioned aggregates with non-uniform shape, with dimensions ranging from 32.5 up to 45mm.
Basalt pieces meet rare and contains secondary calcite (CaCO3) seam traces represented by white color. The width
of seam traces range from 2-5 mm making non-uniform shape of texture (Fig. 16).
Fig.16: Gravel 2: Natural view (32.5-45 mm) grain size. Basalt pieces with green black color, sandy pieces
with yellow-darkness color, alkaline volcanic rocks pieceswith green color, small microcrystalline of calcite
secondary (CaCO3) with white color and dimensions 2-5mm.
Basalt mineral observation made with petrographic microscope (Fig. 17). Microstructure made by plagioclase,
cemented from chlorite. Basalt pieces are almost cracked and filled mostly with calcite secondary (Fig. 18), while
volcanic alkaline rocks have high content of chlorides (Fig. 19).
Page 12
International Journal of Advanced Technology in Engineering and Science www.ijates.com
Volume No.03, Special Issue No. 02, February 2015 ISSN (online): 2348 – 7550
721 | P a g e
Fig. 17: Gravel 2, pieces, basaltic texture with Fig. 18: Gravel 2 sample observed with
darkness to black color composed from plagioclase polarized light microscope. View of micro-
rods with size up to 0.2mm, chlorite cement with cracks filled with calcite second (CaCO3).
opac minerals (metallic, such as magnetite, Magnification scale up to 40x.
pyrite etc.) observed with polarized light
microscope with magnification 40x.
a b
Fig. 19: Gravel 2,
a. High chloride content volcanic rocks composed from iron hydroxides in the center, observed with
polarized light microscope, magnification scale 100x.
b. Volcanic rocks with high chlorides and silica content, observed on polarized-light microscope with
magnification scale 100x. Sample 32.5-40 mm grain size
Meet mostly fractioned sandy rock particles almost shaped plate (Fig. 20), with beige to darkness color, with
chloride, silica and carbonate cement content and few pieces of volcanic basaltic rocks with chlorides content.
Fig. 20: Natural view of sample 32.5-40 mm grain size,. Fractioned sand pieces, shaped plate with gray to
dark beige color.
III CONCLUSIONS
According to mineralogical-stereoscopic test results, the conclusions for this study are:
Page 13
International Journal of Advanced Technology in Engineering and Science www.ijates.com
Volume No.03, Special Issue No. 02, February 2015 ISSN (online): 2348 – 7550
722 | P a g e
Sample/Mineral Microscopic examination % Grain
size Description
Limestone
100% 0-3 mm
This limestone sample
consists entirely of calcite.
Where replacement of the
original calcite is apparent,
the newly formed carbonate
contains a minor amount of
MgO (ca. 0.21 wt %).
Natural river
sand
SiO2= 35%
Olivine and pyroxene =
12%
(in form of silicates of Ca,
Fe and Mg)
Carbonate (CaCO3) =
13%
Metallic
minerals(magnetite micro
grains & pyrite) = 3-5%
Aluminum silicates of
Iron = 34%
0-4 mm
The microscopic
examination of natural river
sand shows the presence of
quartz and aluminum
silicates of iron as main
components. A few grains of
additional minerals were
optically observed include
carbonate, olivine, pyroxene,
and metallic minerals.
Gravel 1
SiO2= 50%
Basalt = 25-30%
Carbonate (CaCO3) = 10-
15%
1-4-6 mm
River gravel 1 with grain
size 1-4-6 mm. Sandy
material made of 50% SiO2,
some black to dark green
basalt pieces up to
percentage as identified in
related section.
It is found carbonate content
too.
Gravel 1
SiO2= 65-75%
Basalt = 10-15%
Carbonate (CaCO3) =
15%
8-14 mm
Sandy material made of 75%
SiO2, and some black to dark
green basalt pieces up to
percentage as identified in
related section.
It is found carbonate content
too.
Gravel 2
SiO2= 65%
Basalt = 10%
Carbonate (CaCO3) =
20-25%
10-20 mm
Sandy material made of 65%
SiO2, and some black to dark
green basalt pieces up to
percentage as identified in
related section.
It is found carbonate content
too.
Gravel 2
SiO2= 60% (0.1-0.2 mm)
Feldspar
(plagioklazianorit
group)= 7-10%
Muscovite = 2-3%
Iron aluminum silicates =
15-20%
Magnetite & pyrite = 2-
4%
12.5-20 mm
Sandy material made of 60%
SiO2. Feldspar and
muscovite trace are founded
in mineral microstructure
under the microscope
examination. Opac mineral
such as magnetite and pyrite
are founded too during the
examination.
Page 14
International Journal of Advanced Technology in Engineering and Science www.ijates.com
Volume No.03, Special Issue No. 02, February 2015 ISSN (online): 2348 – 7550
723 | P a g e
ACKNOWLEDGMENTS
I would like to thank all those people who have been involved directly or indirectly with my research work.
I appriciate the valuable support of my friends and colleagues, during the implementation of this research, including
construction company, FSHN; UPT universities in Albania concrete production site company, the additives supply
company, testing laboratories.
REFERENCES
1. ASTM C 295 - 98. “Standard guide for Petrographic Examination of Aggregates for Concrete”,Annual books of
standards, 1990
2. ASTM C 294 - 98. “Standard descriptive Nomenclature for Constituents of Concrete Aggregates”,Annual books
of standards, 1990
3. ASTM C 33 - 99a. “Standard Specification for Concrete Aggregates”, Annual books of standards,1990
4. BS 812: Part 104: 1994. “Method for qualitative and quantitative petrographic examination ofaggregates”,
British Standard
5. EN 932-4 “Procedure for qualitative and quantitative petrographic examination of aggregates”,document
CEN/TC 154/N173E,1993 (withdrawn European Standard)
6. BS 812: Part 102: 1989. “Method for sampling”, 1989, British Standard
7. BS 7943:1999 “Guide to The interpretation of petrographical examinations for alkali-silicareactivity”, 1999,
British Standard
8. EN 932:Part 3: Procedure and terminology for simplified petrographic description, 1996,European standard