21
| Date post: | 08-Apr-2018 |
| Category: |
Documents |
| Upload: | ai-coordinator-csc-journals |
| View: | 214 times |
| Download: | 0 times |

8/6/2019 International Journal of Applied Sciences (IJAS) Volume (2) Issue (1)
http://slidepdf.com/reader/full/international-journal-of-applied-sciences-ijas-volume-2-issue-1 1/21

8/6/2019 International Journal of Applied Sciences (IJAS) Volume (2) Issue (1)
http://slidepdf.com/reader/full/international-journal-of-applied-sciences-ijas-volume-2-issue-1 2/21
INTERNATIONAL JOURNAL OF APPLIED
SCIENCES (IJAS)
VOLUME 2, ISSUE 1, 2011
EDITED BYDR. NABEEL TAHIR
ISSN (Online): 2180-1258
International Journal of Applied Sciences is published both in traditional paper form and in
Internet. This journal is published at the website http://www.cscjournals.org, maintained by
Computer Science Journals (CSC Journals), Malaysia.
IJAS Journal is a part of CSC Publishers
Computer Science Journals
http://www.cscjournals.org

8/6/2019 International Journal of Applied Sciences (IJAS) Volume (2) Issue (1)
http://slidepdf.com/reader/full/international-journal-of-applied-sciences-ijas-volume-2-issue-1 3/21
INTERNATIONAL JOURNAL OF APPLIED SCIENCES (IJAS)
Book: Volume 2, Issue 1, March 2011
Publishing Date: 04-04-2011
ISSN (Online): 2180-1258
This work is subjected to copyright. All rights are reserved whether the whole or
part of the material is concerned, specifically the rights of translation, reprinting,
re-use of illusions, recitation, broadcasting, reproduction on microfilms or in any
other way, and storage in data banks. Duplication of this publication of parts
thereof is permitted only under the provision of the copyright law 1965, in its
current version, and permission of use must always be obtained from CSC
Publishers.
IJAS Journal is a part of CSC Publishers
http://www.cscjournals.org
© IJAS Journal
Published in Malaysia
Typesetting: Camera-ready by author, data conversation by CSC Publishing Services – CSC Journals,
Malaysia
CSC Publishers, 2011

8/6/2019 International Journal of Applied Sciences (IJAS) Volume (2) Issue (1)
http://slidepdf.com/reader/full/international-journal-of-applied-sciences-ijas-volume-2-issue-1 4/21
EDITORIAL PREFACE
This is first issue of volume two of the International Journal of Applied Sciences (IJAS). IJAS is anInternational refereed journal for publication of current research in applied sciences. IJASpublishes research papers dealing primarily with the research aspects of Applied Sciences ingeneral. Publications of IJAS are beneficial for researchers, academics, scholars, advanced
students, practitioners, and those seeking an update on current experience, state of the artresearch theories and future prospects in relation to applied science. Some important topicscovers by IJAS are agriculture, architectural, audio, automotive, military ammunition, militarytechnology, military etc.
The initial efforts helped to shape the editorial policy and to sharpen the focus of the journal.Starting with volume 2, 2011, IJAS appears in more focused issues. Besides normal publications,IJAS intend to organized special issues on more focused topics. Each special issue will have adesignated editor (editors) – either member of the editorial board or another recognized specialistin the respective field.
This journal publishes new dissertations and state of the art research to target its readership thatnot only includes researchers, industrialists and scientist but also advanced students and
practitioners. IJAS seeks to promote and disseminate knowledge in the applied sciences, naturaland social sciences industrial research materials science and technology, energy technology andsociety including impacts on the environment, climate, security, and economy, environmentalsciences, physics of the games, creativity and new product development, professional ethics,hydrology and water resources, wind energy.
IJAS editors understand that how much it is important for authors and researchers to have theirwork published with a minimum delay after submission of their papers. They also strongly believethat the direct communication between the editors and authors are important for the welfare,quality and wellbeing of the Journal and its readers. Therefore, all activities from papersubmission to paper publication are controlled through electronic systems that include electronicsubmission, editorial panel and review system that ensures rapid decision with least delays in thepublication processes.
To build its international reputation, we are disseminating the publication information throughGoogle Books, Google Scholar, Directory of Open Access Journals (DOAJ), Open J Gate,ScientificCommons, Docstoc, Scribd, CiteSeerX and many more. OurInternational Editors are working on establishing ISI listing and a good impact factor for IJAS. Wewould like to remind you that the success of our journal depends directly on the number of qualityarticles submitted for review. Accordingly, we would like to request your participation bysubmitting quality manuscripts for review and encouraging your colleagues to submit qualitymanuscripts for review. One of the great benefits we can provide to our prospective authors is thementoring nature of our review process. IJAS provides authors with high quality, helpful reviewsthat are shaped to assist authors in improving their manuscripts.
Editorial Board MembersInternational Journal of Applied Sciences (IJAS)

8/6/2019 International Journal of Applied Sciences (IJAS) Volume (2) Issue (1)
http://slidepdf.com/reader/full/international-journal-of-applied-sciences-ijas-volume-2-issue-1 5/21
EDITORIAL BOARD
EDITOR-in-CHIEF (EiC)
Professor. Rajab ChallooTexas A&M University (United States of America)
ASSOCIATE EDITORS (AEiCs)
Dr. Nikolaos KourkoumelisUniversity of Ioannina (Greece)
EDITORIAL BOARD MEMBERS (EBMs)
Dr. Sullip Kumar MajhiIndian Council of Agricultural Research
India
Dr. Srung SmanmooNational Center for Genetic Engineering and BiotechnologyThailand
Professor Naji Qatanani An-Najah National University - PalestinePalestinian Occupied Territories
Dr. Shuhui Li The University of AlabamaUnited States of America
Professor Vidosav D. Majstorovich University of Belgrade - SerbiaSerbia and Montenegro

8/6/2019 International Journal of Applied Sciences (IJAS) Volume (2) Issue (1)
http://slidepdf.com/reader/full/international-journal-of-applied-sciences-ijas-volume-2-issue-1 6/21
International Journal of Applied Sciences (IJAS), Volume (2), Issue (1)
TABLE OF CONTENTS
Volume 2, Issue 1, March 2011
Pages
1 - 11 Rapid Prediction of Extractives and Polyphenolic Contents in Pinus caribaea Bark Using
Near Infrared Reflectance Spectroscopy
N.S.A Derkyi, B. Adu-Amankwa, D. Sekyere & N.A. Darkwa

8/6/2019 International Journal of Applied Sciences (IJAS) Volume (2) Issue (1)
http://slidepdf.com/reader/full/international-journal-of-applied-sciences-ijas-volume-2-issue-1 7/21
N.S.A Derkyi, B. Adu-Amankwa, D. Sekyere & N.A. Darkwa
International Journal of Applied Sciences (IJAS), Volume (2) : Issue (1) : 2011 1
Rapid Prediction of Extractives and Polyphenolic Contents in Pinuscaribaea Bark Using Near Infrared Reflectance Spectroscopy
Nana Sarfo Agyemang Derkyi [email protected] Forest Products and Marketing Division CSIR-Forestry Research Institute of Ghana Kumasi, Ghana
Benjamin Adu-Amankwa [email protected] Chemical Engineering Department Kwame Nkrumah University of Science and Technology Kumasi, Ghana
Daniel Sekyere [email protected] Wood Industry Development and Trade Division CSIR-Forestry Research Institute of Ghana Kumasi, Ghana
Nicholas Albert Darkwa [email protected] Renewable Natural Resources Faculty Kwame Nkrumah University of Science and Technology Kumasi, Ghana
Abstract
The potential of near infrared reflectance spectroscopy (NIRS) for rapidly and accurately determining theextractives and polyphenol contents in Pinus caribaea bark extracts was assessed. Pinus caribaea barksamples were obtained from 110 trees in plantation stands at different locations of Ghana and were thenscanned by NIRS. Their extractives and polyphenol contents reference values were obtained by TAPPIT204 om-88 and Folin-Ciocalteu methods respectively. These reference values were regressed against
different spectral transformations using partial least square (PLS) regression. First derivativetransformation equation of the raw spectral data, resulted in a coefficient of determination r2 in theexternal validation of 0.91 and 0.97 respectively for extractives content and polyphenol content. Thecalibration samples covered a wide range of extractives content from 34 – 45% and polyphenolic contentfrom 16 – 23.5%. The standard deviation to root mean square error of cross validation ratio(SD/RMSECV), root mean square error of calibration to standard deviation ratio (RMSEC/SD),RMSECV/RMSEC and r2 for both extractives and polyphenol models were indicative of good predictionequations. The predicted values were thus highly correlated with time-consuming wet chemical measuredvalues of extractives content and polyphenol content. The use of NIRS for the determination of theextractives and polyphenol contents in Pinus caribaea bark thus provides an advantage of time savingand cost of analysis.
Keywords: Folin-Ciocalteu Assay, Chemometric Modeling, Soxhlet Extraction, First Derivative,Spectroscopy
1. INTRODUCTIONPolyphenolic and extractives contents are very important for most wood utilization. In the adhesiveindustry, the polyphenolic and extractives contents affect product quality, process and production costs.Nevertheless, there is no established on-line method suitable for the determination of polyphenolic andextractives contents in the raw material, wood bark. Near infrared spectroscopy (NIRS) combined withchemometrics might offer such applications.
8/6/2019 International Journal of Applied Sciences (IJAS) Volume (2) Issue (1)
http://slidepdf.com/reader/full/international-journal-of-applied-sciences-ijas-volume-2-issue-1 8/21
N.S.A Derkyi, B. Adu-Amankwa, D. Sekyere & N.A. Darkwa
International Journal of Applied Sciences (IJAS), Volume (2) : Issue (1) : 2011 2
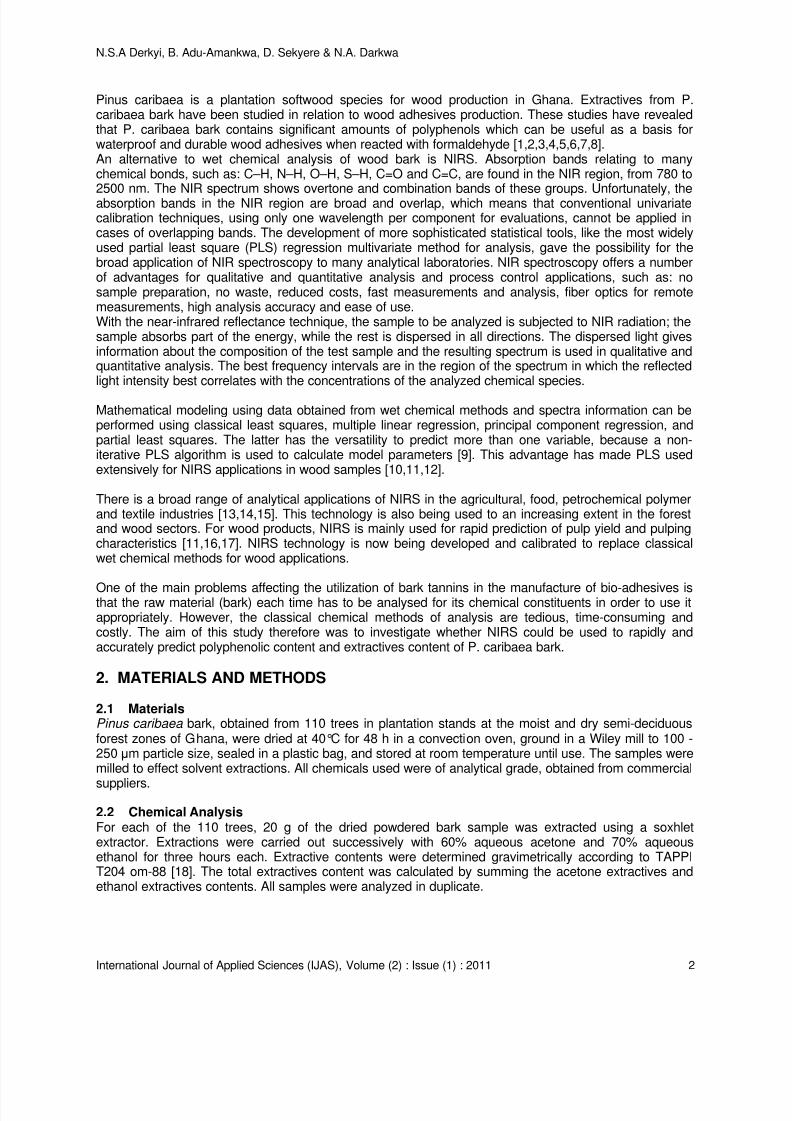
Pinus caribaea is a plantation softwood species for wood production in Ghana. Extractives from P.caribaea bark have been studied in relation to wood adhesives production. These studies have revealedthat P. caribaea bark contains significant amounts of polyphenols which can be useful as a basis forwaterproof and durable wood adhesives when reacted with formaldehyde [1,2,3,4,5,6,7,8].An alternative to wet chemical analysis of wood bark is NIRS. Absorption bands relating to manychemical bonds, such as: C–H, N–H, O–H, S–H, C=O and C=C, are found in the NIR region, from 780 to2500 nm. The NIR spectrum shows overtone and combination bands of these groups. Unfortunately, theabsorption bands in the NIR region are broad and overlap, which means that conventional univariatecalibration techniques, using only one wavelength per component for evaluations, cannot be applied incases of overlapping bands. The development of more sophisticated statistical tools, like the most widelyused partial least square (PLS) regression multivariate method for analysis, gave the possibility for thebroad application of NIR spectroscopy to many analytical laboratories. NIR spectroscopy offers a numberof advantages for qualitative and quantitative analysis and process control applications, such as: nosample preparation, no waste, reduced costs, fast measurements and analysis, fiber optics for remotemeasurements, high analysis accuracy and ease of use.With the near-infrared reflectance technique, the sample to be analyzed is subjected to NIR radiation; thesample absorbs part of the energy, while the rest is dispersed in all directions. The dispersed light givesinformation about the composition of the test sample and the resulting spectrum is used in qualitative andquantitative analysis. The best frequency intervals are in the region of the spectrum in which the reflectedlight intensity best correlates with the concentrations of the analyzed chemical species.
Mathematical modeling using data obtained from wet chemical methods and spectra information can beperformed using classical least squares, multiple linear regression, principal component regression, andpartial least squares. The latter has the versatility to predict more than one variable, because a non-iterative PLS algorithm is used to calculate model parameters [9]. This advantage has made PLS usedextensively for NIRS applications in wood samples [10,11,12].
There is a broad range of analytical applications of NIRS in the agricultural, food, petrochemical polymerand textile industries [13,14,15]. This technology is also being used to an increasing extent in the forestand wood sectors. For wood products, NIRS is mainly used for rapid prediction of pulp yield and pulpingcharacteristics [11,16,17]. NIRS technology is now being developed and calibrated to replace classicalwet chemical methods for wood applications.
One of the main problems affecting the utilization of bark tannins in the manufacture of bio-adhesives isthat the raw material (bark) each time has to be analysed for its chemical constituents in order to use itappropriately. However, the classical chemical methods of analysis are tedious, time-consuming andcostly. The aim of this study therefore was to investigate whether NIRS could be used to rapidly andaccurately predict polyphenolic content and extractives content of P. caribaea bark.
2. MATERIALS AND METHODS
2.1 MaterialsPinus caribaea bark, obtained from 110 trees in plantation stands at the moist and dry semi-deciduousforest zones of Ghana, were dried at 40°C for 48 h in a convection oven, ground in a Wiley mill to 100 -250 µm particle size, sealed in a plastic bag, and stored at room temperature until use. The samples weremilled to effect solvent extractions. All chemicals used were of analytical grade, obtained from commercial
suppliers.
2.2 Chemical AnalysisFor each of the 110 trees, 20 g of the dried powdered bark sample was extracted using a soxhletextractor. Extractions were carried out successively with 60% aqueous acetone and 70% aqueousethanol for three hours each. Extractive contents were determined gravimetrically according to TAPPIT204 om-88 [18]. The total extractives content was calculated by summing the acetone extractives andethanol extractives contents. All samples were analyzed in duplicate.
8/6/2019 International Journal of Applied Sciences (IJAS) Volume (2) Issue (1)
http://slidepdf.com/reader/full/international-journal-of-applied-sciences-ijas-volume-2-issue-1 9/21
N.S.A Derkyi, B. Adu-Amankwa, D. Sekyere & N.A. Darkwa
International Journal of Applied Sciences (IJAS), Volume (2) : Issue (1) : 2011 3
The phenolic content was determined in the acetone and the ethanol extracts by means of a modifiedFolin-Ciocalteu assay [19]. For each extract, 0.5ml was put in a test tube and 0.5 ml distilled water added.0.5ml of Folin-Ciocalteu reagent was added followed by 2.5 ml 20% Na2CO3 solution. The tube wasvortexed and the absorbance at 765 nm taken after 60 min on a Beckman DU 650 UV-VISspectrophotometer. The amount of total extractable phenolics as gallic acid equivalent was calculatedfrom a calibration curve using standard gallic acid solution, and expressed on a dry matter basis. Allsamples were run in duplicate.
2.3 Near Infrared Spectra AquisitionEach of the 110 powdered un-extracted bark samples was placed in a NIRSystem micro sample cup.Near-infrared (NIR) spectra were recorded on a Bruker FT-IR spectrometer to measure diffuse reflectedlight in the range 800 to 2,600 nm from the sample held in the spinning sample holder. Sixty four scanswere accumulated for the sample with a spectral resolution of 8 cm
-1and the results averaged. After the
spectrum had been obtained, the sample cup was emptied, repacked with the next sample and thespectrum obtained. The background was taken with a sintered gold reference standard.
2.4 Calibration ModelingChemometric modelling was performed with the OPUS software package (version 5.5). For pre-processing, the algorithms of full multiplicative scatter correction, first derivative (smoothed and derivedaccording to Savitzky and Golay [20]), straight line subtraction and standard normal variate among others
were applied. Wavelength selection was done manually as well as automatically by means of the MartensUncertainty test [21], to eliminate unimportant variables to simplify the models and make them morereliable.
Calibrations were developed (based on NIR spectra and wet chemical analysis of polyphenol content andextractives content) using partial least squares (PLS) regression after principal component analysis (PCA)had been performed on the global samples spectra which was also done after checking on the normaldistribution of the samples. Calibrations were tested by full cross-validation and predicted extractivescontent and polyphenol content were compared to measured ones. The root mean square error wascalculated for the calibration samples and for the predicted samples.
3. RESULTS AND DISCUSSIONSA statistical summary of the polyphenolic content and extractives content of P. caribaea bark determined
through wet chemical analysis is given in Table 1. A meaningful interpretation of calibration resultsdepends to a large extent on the accuracy and precision of the wet chemical analysis of the samples. Theextractives content of P. caribaea bark varied from 34% to 45%, with a mean and standard deviation of39.4% and 2.42% respectively. The measured extractives content (N=110) were fairly normally distributedaround the mean. Similarly, the polyphenol content of P. caribaea bark varied from 16% to 23.5% with amean and standard deviation of 19.69% and 1.18% respectively. The measured polyphenol content(N=110) were also fairly normally distributed around the mean. The values determined for bothextractives content and polyphenol content of the samples covered a large enough range, which washelpful for developing good models.
Parameter (%) N Range Mean Standard deviation
Extractives content
Polyphenol content
110
110
34 – 45
16 – 23.5
39.4
19.69
2.42
1.18
TABLE 1: Descriptive statistics for extractives content and phenolic content of bark samples.N: total number of samples statistically analysed.
The NIR diffuse reflectance spectra of P. caribaea bark samples (Fig. 1) demonstrated a high degree ofvariation, with wavelengths in the regions 7500 – 6200 cm
-1and 5500 – 4500 cm
-1showing the greatest
variability. Bands in the region 6170 – 5800 cm-1
results from the first overtone of C – H stretch, while

8/6/2019 International Journal of Applied Sciences (IJAS) Volume (2) Issue (1)
http://slidepdf.com/reader/full/international-journal-of-applied-sciences-ijas-volume-2-issue-1 10/21
N.S.A Derkyi, B. Adu-Amankwa, D. Sekyere & N.A. Darkwa
International Journal of Applied Sciences (IJAS), Volume (2) : Issue (1) : 2011 4
bands in the region 4760 – 4350 cm-1
mainly results from C – H, N – H and O – H combination bands[13,22]. Some of the compounds that have been noted have been assigned to specific wood componentsthat are also present in bark. The band at 4760 cm has been assigned to cellulose [23] and starch [22]and the bands at 6000 and 5930 cm
-1have been assigned to lignin [22,24]. Michell and Schimleck [25] in
a study of Eucalyptus Globulus Labill. Woods, noted that the bands at 5995, 4800 and 4690 cm-1
were allvery well correlated with extractives and lignin content.
4000600080001000012000
Wavenumber cm-1
0 . 2
0 . 4
0 . 6
0 . 8
1 . 0
1 . 2
1 . 4
1 . 6
1 . 8
A b s o r b a n c e
U n i t s
FIGURE 1: Near infrared diffused reflectance spectra of P. caribaea bark.
The optimal method of spectra processing (constant offset elimination, vector normalization, straight linesubtraction, min-max normalization, multiplicative scatter correction, internal standard, first derivative andsecond derivative etc.) depends on the system studied. In this study, first derivative spectra processingwith 15 point filter and second order polynomial at two frequency ranges (7500 – 6200 cm
-1and 5500 –
4500 cm-1
) with the best positive correlation between the changes in the spectra and measuredextractives and polyphenol contents data were chosen by the PLS algorithm (Fig. 2) to give the bestresults for the PLS calibration model. The best positive correlation between the changes in the spectraand measured data are in the frequency ranges with maximal absorption and the largest value for thecorrelation coefficient r
2.

8/6/2019 International Journal of Applied Sciences (IJAS) Volume (2) Issue (1)
http://slidepdf.com/reader/full/international-journal-of-applied-sciences-ijas-volume-2-issue-1 11/21
N.S.A Derkyi, B. Adu-Amankwa, D. Sekyere & N.A. Darkwa
International Journal of Applied Sciences (IJAS), Volume (2) : Issue (1) : 2011 5
4500500055006000650070007500 - 0 . 0 0
3 0
- 0 . 0
0 2 0
- 0 . 0
0 1 0
0 . 0
0 0 0
A b s o r b a n c e U n i t s
Wavenumber cm-1
FIGURE 2: First derivative spectra of P. caribaea bark in selected wavelength region.
In an evaluation of the methods for measuring phenolics, Yu and Dahlgren [26] suggested that the Folin-Ciocalteu method which takes into account all hydroxyl aromatic compounds [27] provides a good test forthe characterization of extractable phenolics. Total polyphenol analysis is achieved by direct spectralmeasurement at 280 nm or by Folin-Ciocaltreau colorimetry. Spectral analysis of phenolic compounds iseffective, but because the absorbance maxima of all polyphenols is not 280 nm, results are more difficultto quantify. The Folin-Ciocalteu method is the reduction of metal oxides by polyphenols resulting in a bluesolution that has absorption maxima at 765 nm. Since different types of polyphenols react similarly withthe Folin-Ciocalteu reagent, it is more easily quantifiable. However, the procedure is complicated andtime-consuming because some sample dilution and long incubation periods are required. The applicationof NIRS combined with multivariate calibration can address sample preparation and analyses reducingthe time considerably.
The quality of the chemometric model depends on the choice of the correct number of factors (rank) usedfor the model. Choosing too small a rank, results in underfitting so that not all features can be explainedby the model. On the other hand, including too many factors (rank too high) leads to overfitting and onlyadds noise, and in fact degrades the model. As a consequence there is an optimum number of factors forevery system, i.e. an optimum rank. A criteria for determining the optimum rank is to look at the root meansquare error of cross validation resulting from an analysis of the cross validation. If the RMSECV isdepicted against the rank used in each model, a minimum can be observed in this graph, indicating theoptimum rank. In this study, the optimum rank for both models was 9 (Figure 3). The leave-one-out cross
validation method was used to calculate the prediction residual error sum of squares (which calculatesthe lack of prediction accuracy) and to establish the number of PLS components for each model. Anumber of PLS components that yields the lowest prediction residual error sum of squares is usuallychosen to establish a model [9]. In this study, a PLS component of 4 was found for each of the models(Table 2). A lower PLS component improves the statistics of a model.

8/6/2019 International Journal of Applied Sciences (IJAS) Volume (2) Issue (1)
http://slidepdf.com/reader/full/international-journal-of-applied-sciences-ijas-volume-2-issue-1 12/21
N.S.A Derkyi, B. Adu-Amankwa, D. Sekyere & N.A. Darkwa
International Journal of Applied Sciences (IJAS), Volume (2) : Issue (1) : 2011 6
a)
b)
FIGURE 3: RMSECV plotted against Rank for a) extractives content and b) polyphenol content.
Other criteria generally used to assess the quality of a model include the root mean square error of
calibration (RMSEC), root mean square error of cross validation (RMSECV) and the correlation coefficient(r
2). A good model should have a low RMSEC, a low RMSECV and a high correlation coefficient (r
2)
between the predicted and measured values, but also a small difference between RMSEC and RMSECV.The correlation coefficient r
2, the most commonly used, should be higher than 0.8 for quantitative
predictions. For excellent models, the RMSEC-to-SD ratio should be ≤ 0.2, where SD is the standarddeviation of the reference values. If 0.2 < RMSEC-to-SD ratio ≤ 0.5, quantitative predictions is possible[28]. The SD-to-RMSECV ratio should be ≥2 [29,30], RMSECV-to-RMSEC ≤ 1.2 and the SD-to-RMSECVratio should be ≥ 2.5 [31]. The PLS regression calibrations developed for extractives content andpolyphenol content in this study are given in Table 2.

8/6/2019 International Journal of Applied Sciences (IJAS) Volume (2) Issue (1)
http://slidepdf.com/reader/full/international-journal-of-applied-sciences-ijas-volume-2-issue-1 13/21
N.S.A Derkyi, B. Adu-Amankwa, D. Sekyere & N.A. Darkwa
International Journal of Applied Sciences (IJAS), Volume (2) : Issue (1) : 2011 7
Model N PLSComp
RMSEC RMSECV RMSEC/SD SD/RMSECV RMSECV/RMSEC R2
EC (%)
PC (%)
110
110
04
04
0.65
0.21
0.72
0.23
0.26
0.17
3.36
5.13
1.10
1.09
0.91
0.96
TABLE 2. PLS regression calibration developed for extractives content (EC) and polyphenol content (PC).
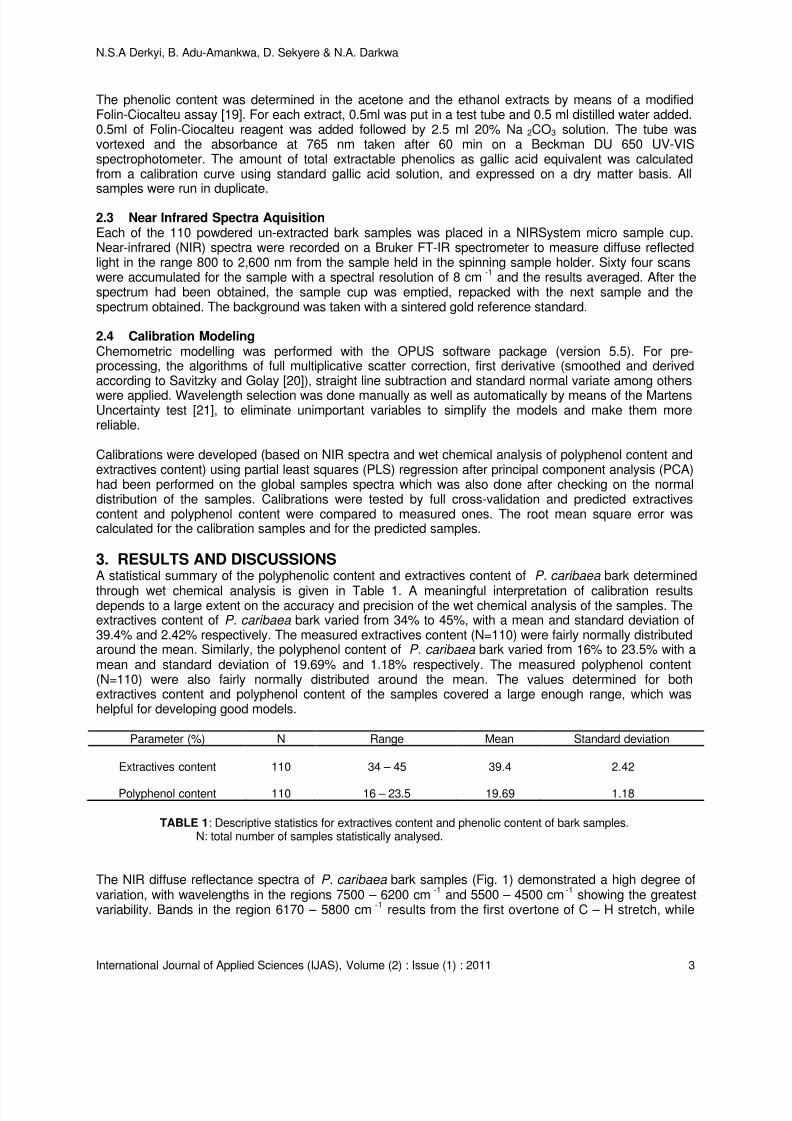
Plots indicating the relationship between laboratory determined extractives and polyphenol contents andtheir NIR fitted values are shown in Figures 4 and 5 respectively. Both plots show that over the range ofcalibration sets the data were well fitted by the PLS regression. Gielinger et al. [32] have used NIRspectroscopy to estimate total soluble extractives and phenolic contents from Larch heartwood, recordinggood calibration models. Donkin and Pearce [33] have also used NIR spectroscopy to estimate totalsoluble extractives from the bark of Acacia mearnsii reporting a correlation coefficient of 0.99. Theircalibration was developed using 11 factors, which could be considered excessive. Schimleck and Yazaki[34] used NIR spectroscopy to estimate hot water extractives from the bark of P. radiata reporting a
correlation coefficient of 0.88. In this study, the two calibrations between extractives content andpolyphenol content and the spectral data were accurate with r2
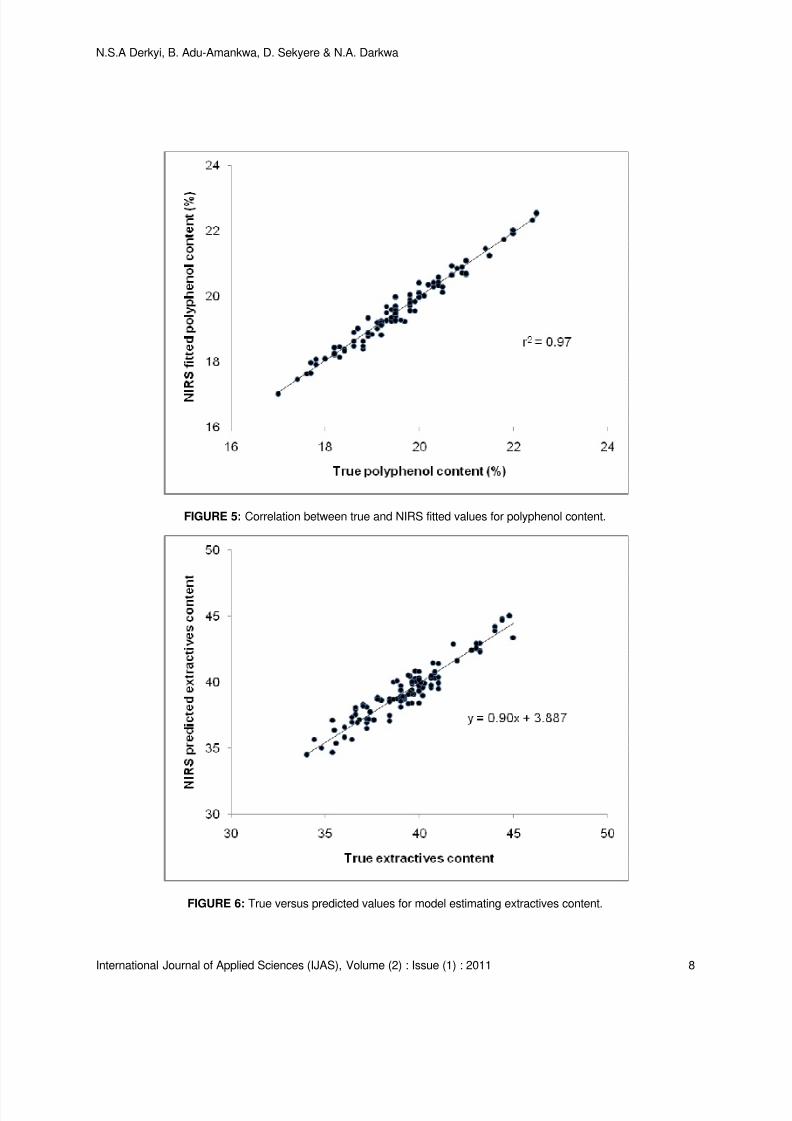
= 0.91 and 0.96 and RMSECV = 0.72 and0.23 respectively. In general, both models showed good predictive ability as can be observed in Figures 6and 7 where true versus predicted data were plotted for models of extractives content and polyphenolcontent respectively. For each model, the slope of the calibration curve was close to 1.0 indicating a goodcalibration. However, the PLS model for polyphenol content showed a higher prediction performance thanthat for extractives content, according to RMSECV/RMSEC, RMSEC/SD, SD/RMSECV and r
2(Table 2).
Values obtained for RMSEC and RMSECV were close for each model, indicating that the introduction ofthe given number of PLS components did not create an over-fitting effect and that the calibration modelwas valid.
FIGURE 4: Correlation between true and NIRS fitted values for extractives content.
8/6/2019 International Journal of Applied Sciences (IJAS) Volume (2) Issue (1)
http://slidepdf.com/reader/full/international-journal-of-applied-sciences-ijas-volume-2-issue-1 14/21
N.S.A Derkyi, B. Adu-Amankwa, D. Sekyere & N.A. Darkwa
International Journal of Applied Sciences (IJAS), Volume (2) : Issue (1) : 2011 8
FIGURE 5: Correlation between true and NIRS fitted values for polyphenol content.
FIGURE 6: True versus predicted values for model estimating extractives content.

8/6/2019 International Journal of Applied Sciences (IJAS) Volume (2) Issue (1)
http://slidepdf.com/reader/full/international-journal-of-applied-sciences-ijas-volume-2-issue-1 15/21
N.S.A Derkyi, B. Adu-Amankwa, D. Sekyere & N.A. Darkwa
International Journal of Applied Sciences (IJAS), Volume (2) : Issue (1) : 2011 9
FIGURE 7: True versus predicted values for model estimating polyphenol content.
4. CONCLUSSIONAs the use of natural adhesives becomes more common, the need has arisen for an analytical methodcapable of rapidly and noninvasively assessing phenolic content in wood biomass. This study hasdemonstrated the high reliability of NIRS in determining extractives and polyphenolic contents in P.caribaea bark. These compounds have great significance in adhesives formulation, and the availability ofNIRS to measure them may help adhesive technologist to develop improved adhesives through rapid,cost-effective and nondestructive NIRS analysis. By means of multivariate calibration techniques (PLS),
relationships were established between reflectance spectra and extractives content and polyphenolcontent of Pinus caribaea bark. The first derivative spectra with PLS were found to provide the bestpredictions for the extractives and polyphenol contents of Pinus caribaea bark with a RMSECV of 0.72and 0.23 and coefficient of determination (r
2) of 0.91 and 0.96 respectively. The non-destructive FT-NIR
measurements thus provided good estimation of the extractives content and polyphenol content of Pinus caribaea bark and could therefore be of practical importance.
5. REFERENCES1. Y. Yazaki and W.E. Hillis. “Polyphenolic extractives of Pinus radiata bark”. Holzforschung, 31(1):20-
25, 1997
2. Y. Yazaki and W.E. Hillis. “Molecular size distribution of radiate pine bark extracts and its effects onproperties”. Holzforschung, 34(1):125-130, 1980
3. A. Pizzi. “Pine tannin adhesives for particle board”. Holz Roh-Wekstoff, 40(1):293-301 1982
4. D.J. Jenkin. “Adhesives from Pinus radiata bark estraction”. In: International Symposium on Adhesionand Adhesives. Washington State University, Pullman, Washington, 1982
5. J.K. Woo, “Bark adhesives for particle board and plywood”. In International Symposium on Adhesionand Adhesives. Washington State University, Pullman, Washington, 1982

8/6/2019 International Journal of Applied Sciences (IJAS) Volume (2) Issue (1)
http://slidepdf.com/reader/full/international-journal-of-applied-sciences-ijas-volume-2-issue-1 16/21
N.S.A Derkyi, B. Adu-Amankwa, D. Sekyere & N.A. Darkwa
International Journal of Applied Sciences (IJAS), Volume (2) : Issue (1) : 2011 10
6. V.J. Sealy-Fisher and A. Pizzi, “Increased pine tannins extraction and wood adhesives developmentby phlobaphenes minimization”. Holz Roh-Wekstoff. 50(1):212-220, 1992
7. A. Pizzi , E.P. von Leyser, J. Valenzulela and J.G. Clark. “The chemistry and development of pinetannin adhesives for exterior plywood”. Holzforschung 47(1):168-169, 1993
8. A. Pizzi , J. Valenzulela and C. Westmeyer. “Low formaldehyde emission, fast pressing pine andpecan tannin adhesives for exterior particleboard”. Holz Roh-Wekstoff, 52(1):311-315 1994
9. P. Geladi P and B.R. Kowalski, “Partial least squares regression: A tutorial”. Anal. Chim. Acta. 1986
10. R.J. Olson, P. Tomani, M. Karlsson, T. Josefsson, K. Sjoberg and C. Bjorklund, “Multivariatecharacterization of chemical and physical descriptors in pulp using NIRS”. Tappi J, 78(10):158-165,1995
11. L.R. Schimleck, P.J. Wright, A.J. Michell and A.F.A. Wallis, “Near infrared spectra and chemicalcompositions of Eucalptus globules and E. nitens plantation woods”. Appita J, 50(1): 40-46, 1997
12. A. Marklund, J.B. Hauksson, U. Edlund and M. Sjostrom. “Multivariate data analysis based onorthogonal signal correction and near infrared spectroscopy”. Nord. Pulp Pap. Res. J, 14(2):140-148,
1999
13. B.G. Osborne, T. Fearn and P.H. Hindle. “Practical NIR Spectroscopy with Applications in Food andBeverage Analysis”. Longman Scientist and Technical, Harlow, UK. 1993
14. S. Wold. “Cross-validation estimation of the number of components in factor and principalcomponents models”. Technometrics, 20(1):397-405, 1978
15. D. Betrand and E. Dufour. La spectroscopie infrarouge et ses applications analytiques. Collectionsciences et technique agroalimentaires, édition Tec et Doc. 2000
16. L.R. Schimleck and A.J. Michell. “Determination of within-tree variation of kraft pulp yield using nearinfrared spectroscopy”. Appita J, 81(1):229-236, 1998
17. J.A. Wright, M.D. Birkett and M.J.T. Grambino. “Prediction of pulp yield and cellulose content fromwood samples using near infrared reflectance spectroscopy”, Tappi J. 73(8):164- 166, 1990
18. Tappi test method T204 om-88, Solvent extractives of wood and pulp, 1997.
19. Singleton, V.L. and J.A. Jr. Rossi. “Colorimetry of total phenolics with phosphomolybdic-phosphotungstic acid reagents”. Am. J. Enol. Vitic., 16(1):144-158, 1965
20. A. Savitzky and M.J.E. Golay, “Smoothing and differentiation of data by simplified least squaresProcedures”. Anal Chem, 36(1):1627-1639, 1964
21. F. Westad and H. Martens. “Variable selection in near infrared spectroscopy based on significance
testing in partial least squares regression”. J. Near Infrared Spectrosc, 8(2):117-124, 2000
22. J.S. Shenk, J.J. Workmann, and M.O. Westerhaus. “Application of NIR spectroscopy to agriculturalproducts”. In Handbook of Near Infrared Analysis. Ed by. D.A. Burns, E.W. Ciurczak. Marcel Dekker,New York. pp. 383-431 (1992)
23. K.H. Basset, C.H. Liang and R.H. Marchessault. “The infrared spectrum of crystallinepolysaccharides, IX. The near infrared spectrum of cellulose”. J. Polym. Sci, 1(1):1687-1692 1963
24. F.E. Barton II and D.S. Himmelsbach. “Two-dimensional vibratiional spectroscopy II: Correlation of

8/6/2019 International Journal of Applied Sciences (IJAS) Volume (2) Issue (1)
http://slidepdf.com/reader/full/international-journal-of-applied-sciences-ijas-volume-2-issue-1 17/21
N.S.A Derkyi, B. Adu-Amankwa, D. Sekyere & N.A. Darkwa
International Journal of Applied Sciences (IJAS), Volume (2) : Issue (1) : 2011 11
the absorptions of lignins in the mid- and near-infrared”. Appl. Spectrosc, 47(1): 1920-1925, 1993
25. A.J. Michell and L.R. Schimleck. “NIR spectroscopy of woods from Eucalyptus globules”. Appita J,49(1):23-26, 1996
26. Z. Yu and R.A. Dahlgren. “Evaluation of methods for measuring polyphenols in conifer foliage”.Journal of Chemical Ecology, 26(1):2119-2140, 2000
27. L. Chapuis-Lardy, D. Contour-Ansel and F. Bernhard-Reversat. “High performance liquidchromatography of water-soluble phenolics in leaf litter of three Eucalyptus hybrids (Congo)”. PlantScience, 163(1):217-222, 2002
28. M.M. Couˆteaux, P. Rovira and B. Berg. “Near infrared reflectance spectroscopy for determination oforganic matter fractions including microbial biomass in coniferous forest soils”. Soil Biology andBiochemistry, 35(1):1587-1600, 2003
29. C.W. Chang, D.A. Laird, M.J. Mausbach and C.R. Hurburgh. “Near infrared reflectancespectroscopy-principal components regression analyses of soil properties”. Soil Science Society ofAmerica Journal, 65(1):480-490, 2001
30. C. Chang and D.A. Laird. “Near-infrared reflectance spectroscopic analysis of soil C and N”. SoilScience, 167(1):110-116, 2002
31. G.W. Mathison, H. Hsu, R. Soofi-Siawash, G. Recinos-Diaz, E.K. Okine, J. Helm and P. Juskiw.“Prediction of composition and ruminal degradability characteristics of barley straw by near infraredreflectance spectroscopy”. Canadian Journal of Animal Science, 79(1):519-523, 1999
32. N. Gierlinger, M. Schwannminger, B. Hinterstoisser and R. Wimmer. “Rapid determination ofheartwood extractives in Larix sp. by means of Fourier transform near infrared spectroscopy”. J. nearinfrared spectrosc, 10(1):203-214, 2002
33. M.J. Donkin and J. Pearce. “Tannin analysis by near infrared spectroscopy”. J. Soc. LeatherTechnol. Chem, 79(1):8-11, 1995
34. L.R. Schimleck and Y. Yazaki. “Analysis of Pinus radiata D. Don Bark by Near InfraredSpectroscopy”. Holzforscchung, 57(1):520-526, 2003

8/6/2019 International Journal of Applied Sciences (IJAS) Volume (2) Issue (1)
http://slidepdf.com/reader/full/international-journal-of-applied-sciences-ijas-volume-2-issue-1 18/21
INSTRUCTIONS TO CONTRIBUTORS
International Journal of Applied Sciences (IJAS) is publishing articles in all areas of appliedsciences. IJAS seeks to promote and disseminate knowledge in the applied sciences, natural andsocial sciences industrial research materials science and technology, energy technology andsociety including impacts on the environment, climate, security, and economy, environmental
sciences, physics of the games, creativity and new product development, professional ethics,hydrology and water resources, wind energy. IJAS is an academic peer reviewed on-lineinternational journal of broad appeal aimed at fast publication of cutting edge multidisciplinaryresearch articles reporting on original research across the fields of pure and applied sciences.
To build its International reputation, we are disseminating the publication information throughGoogle Books, Google Scholar, Directory of Open Access Journals (DOAJ), Open J Gate,ScientificCommons, Docstoc and many more. Our International Editors are working onestablishing ISI listing and a good impact factor for IJAS.
The initial efforts helped to shape the editorial policy and to sharpen the focus of the journal.Starting with volume 2, 2011, IJAS appears in more focused issues. Besides normal publications,IJAS intend to organized special issues on more focused topics. Each special issue will have a
designated editor (editors) – either member of the editorial board or another recognized specialistin the respective field.
We are open to contributions, proposals for any topic as well as for editors and reviewers. Weunderstand that it is through the effort of volunteers that CSC Journals continues to grow andflourish.
IJAS LIST OF TOPICS The realm of International Journal of Applied Sciences (IJAS) extends, but not limited, to thefollowing:
• Agricultura • Architectural
• Audio • Automotive
• Automotive Engineering • Biochemical• Biological • Biomedical
• Bombs • Broadcast
• Building officials • Ceramic• Chemical • Civil
• Combat Engineering • Construction
• Cryogenics • Domestic appliances• Domestic Educational Technologies • Domestic Technology
• Energy • Energy storage
• Engineering geology • Enterprise
• Entertainment • Environmental• Environmental Engineering Science • Environmental Risk Assessment• Environmental technology • Financial Engineering
• Fire Protection Engineering • Fisheries science
• Fishing • Food• Food Technology • Genetic• Health Safety • Health Technologies
• Industrial Technology • Industry Business Informatics• Machinery • Manufacturing
• Marine Engineering • Material Sciences• Materials science and engineering • Medical Technology
• Metallurgical • Microtechnology

8/6/2019 International Journal of Applied Sciences (IJAS) Volume (2) Issue (1)
http://slidepdf.com/reader/full/international-journal-of-applied-sciences-ijas-volume-2-issue-1 19/21
• Military Ammunition • Military Technology
• Military Technology and equipment • Mining• Motor Vehicles • Music
• Naval Engineering • Nuclear technology
• Nutrition • Ocean
• Ontology • Optical
• Optics • Particle physics• Pharmaceuticals • Safety Engineering
• Sanitary Engineering • Space Technology• Textile • Tissue
• Traffic • Transport
• Visual Technology • Zoography
CALL FOR PAPERS
Volume: 2 - Issue: 3 - May 2011
i. Paper Submission: May 31, 2011 ii. Author Notification: July 01, 2011
iii. Issue Publication: July /August 2011

8/6/2019 International Journal of Applied Sciences (IJAS) Volume (2) Issue (1)
http://slidepdf.com/reader/full/international-journal-of-applied-sciences-ijas-volume-2-issue-1 20/21
CONTACT INFORMATION
Computer Science Journals Sdn BhDM-3-19, Plaza Damas Sri Hartamas50480, Kuala Lumpur MALAYSIA
Phone: 006 03 6207 1607006 03 2782 6991
Fax: 006 03 6207 1697
Email: [email protected]

8/6/2019 International Journal of Applied Sciences (IJAS) Volume (2) Issue (1)
http://slidepdf.com/reader/full/international-journal-of-applied-sciences-ijas-volume-2-issue-1 21/21


