67

Int. Journal of Business Science and Applied Management, Volume 7, Issue 2, 2012
Challenging the strategy paradigm within the paper packaging
industry
Malin Olander Roese
Lund University, Department of Design Sciences, Division of Packaging Logistics
Box 118, 221 00 Lund, Sweden
Telephone: +46 46 222 9701
Email: [email protected]
Annika Olsson
Lund University, Department of Design Sciences, Division of Packaging Logistics
Box 118, 221 00 Lund, Sweden
Telephone: +46 46 222 9734
Email: [email protected]
Abstract
Formulating and implementing a new strategy may be a challenging task, especially if it alters the way in which
a company has operated and positioned itself before. This may be particularly true for companies within the
forest industry, like manufacturers of paper packaging products, pursuing differentiated customer value and
innovative solutions where, traditionally, success has been measured in volume and relative position on a cost
curve. In theory there are different schools of thought and approaches on how to go about formulating and
implementing strategy. In practice, going through strategic change may create a need to embrace new ways of
thinking and acting in order to close the gap between formulation and implementation, between knowing what
to do and doing it. This gap, particularly the interdependence between formulation and implementation in the
context of change between strategies of different schools and assumptions, merits more attention in literature.
The purpose of this paper is to contribute to the understanding of strategic change, illustrating a change process
of formulating and implementing a strategy through the lenses of schools of strategy and cognitive research. The
purpose is also to suggest areas for future research and practical guidance for organisations aiming to break
away from a reigning strategy paradigm in search for new ways to compete. Based on a longitudinal case study
of Billerud, a Swedish world-leading manufacturer of paper packaging material, two propositions are suggested
for future research and practical guidance for managers when formulating and implementing strategic change.
Firstly for an organisation going through strategic change, understanding the assumptions behind different
strategic intents and the link between a chosen strategy and critical core activities, capabilities and culture is a
prerequisite to enable a transition. Secondly, strategic change is enabled through an iterative and probing
approach between formulation and implementation which considers knowledge and learning of new concepts,
activity and culture as situated.
Keywords: strategic change, strategy implementation, customer orientation, innovation, paper packaging
industry
Acknowledgments: The authors would like to express their deep gratitude to Billerud: the interviewees and
those involved in facilitating this research, for sharing their experiences, giving feed-back and for allowing our
findings to be communicated. We would also like to extend a warm thank you to the anonymous reviewers for
their very constructive comments on how to improve earlier versions of this paper. Finally, we would like to
acknowledge the Bo Rydin Foundation for financing the research.

Int. Journal of Business Science and Applied Management / Business-and-Management.org
2
1 INTRODUCTION
Research shows that “…despite the enormous time and energy that goes into strategy development at most
companies, many have little to show for the effort” (Mankins & Steele, 2005, p. 66). The source of this shortfall
may lie in the actual planning and formulation of strategy, in the implementation and execution of strategy, or
both (Porter, 1996; Collins & Porras, 1996; Gadiesh & Gilbert, 2001; Kim & Mauborgne, 2004; Mankins &
Steele, 2005; Kaplan & Norton, 2007; Johnson, Christensen, & Kagermann, 2008; Neilson, Martin, & Powers,
2008; Porter, 2008). In order to address these shortfalls solutions may be found in literature on strategy and
management. However, knowing what to do is not the same thing as doing them.
In practice, setting out to formulate and implement a new strategy, particularly one that alters the way in
which a company has operated and positioned itself before, may be a daunting task. This may be especially true
for companies within traditional and primary industries, such as the forest industry, who have long competed on
the premises of an industrial economy where transformation, standardization and production has been at the
heart of business logic (Normann, 2001; Hayhurst, 2002). The transformation towards an economy where
knowledge, innovation and customer value are guiding principles question that inherent logic. In such an
endeavour, the strategy development process employed by many organisations may in itself be a deterrent for
new value creation and innovation (Dobni, 2010). Not understanding the link between the organisation’s
strategy, market orientation and new product development another hurdle, which in turn has received limited
attention in research (Frambach, Prabhu, & Verhallen, 2003).
In theory there are different schools of thought and approaches on how a company may go about
formulating and implementing strategy. A company can, according to Porter (1985), achieve a competitive
advantage through a distinctive way of competing, for example – through cost or through differentiation in
relation to its competitors. This notion is completely rejected by the authors behind Blue Ocean who discard
“…the fundamental tenet of conventional strategy: that a trade-off exists between value and cost...” (Kim &
Mauborgne, 2004, p 82). The proponents of the ambidextrous approach argue similarly the need and success of
companies who are able to exploit and explore at the same time (O'Reilly & Tushman, 2004; Sarkees, Hulland,
& Prescott, 2010). Where generic strategies have an external focus for leveraging competitive advantage and
position, the resource-based view emphasize internal capabilities and leveraging firm-specific (internal and
external) competencies to compete or achieve the strategic intent (Hamel & Prahalad, 1993; Herrmann, 2005).
Hence, the outcome of strategy and the process by which it is made will differ fundamentally depending on its’
underlying assumptions (Whittington, 1997).
Herrmann (2005) argues that whereas Porter’s models have helped firms analyse the industry and
streamline their strategies in the last decades, firms now need new ways and models of creating and preserving
knowledge and doing addressing the cognitive rather than analytical aspects of strategy. Normann (2001) calls
for the need for combining conceptual thinking and action orientation which can be related to Pfeffer and
Sutton’s notions of reducing the gap between the knowing and doing (Pfeffer & Sutton, 1999).
The separation, or gap, between formulation and implementation of strategy has long been addressed and
dismissed in literature (Mintzberg & Quinn, 1992; Cummings & Daellenbach, 2009). However, it remains an
issue in practice (Mankins & Steele, 2005). Furthermore, research on the interdependence between the two
(formulation and implementation), particularly in the context of change between strategies of different
assumptions, merits more attention (Johnson, 1992; Mankins & Steele, 2005; Sull, 2007; Melnyk, Hanson, &
Calantone, 2010). The Strategic change literature per se may provide the roadmap for the process (Kotter, 1995;
Mento, Jones, & Dirndorfer, 2002), but does not necessarily address the strategies involved.
With a reference to different schools of strategy within literature, and findings within cognitive research,
one company’s journey from a predominant generic paradigm of cost towards a more differentiated, blue ocean
or ambidextrous strategy is explored. The purpose of the study is to contribute to the understanding of strategic
change, illustrating a change process of formulating and implementing a strategy through the lenses of schools
of strategy and cognitive research. The purpose is further to suggest areas for future research and practical
guidance for organisations aiming to break away from a reigning strategy paradigm in search for new ways to
compete. The research is based on a longitudinal case study of Billerud, a Swedish world-leading manufacturer
of paper packaging material.
The Swedish Forest Industry
The forest industry, the pulp- and paper and the wood mechanical industry, is one of Sweden’s most
important primary industries representing approximately 12% of the nation’s GDP, export, and employment.
The pulp- and paper industry is in itself the third largest in Europe with manufacturers of newsprint, printing and
packaging paper, board and tissue. Manufacturers of pulp- and paper products such as Billerud are characterized
by its’ high-tech, capital intensive processes and products with a high knowledge content. Research and
development within production and process efficiency are key while the development of new products with high
value added have become increasingly important in meeting global changes of technology, competition from

Malin Olander Roese and Annika Olsson
3
emerging markets, and changing consumer demands. Structural development over the last three decades has
nearly halved the number of production facilities but doubled the capacity and production of paper (The
Swedish Forest Industries Federation, 2011; The Swedish Forest Industries Federation, 2012a; The Swedish
Forest Industries Federation, 2012b).
2 STRATEGY: FROM THEORY TO PRACTICE – A THEORETICAL FRAME OF REFERENCE
The forest industry has in recent years, like other primary industries, found themselves in search for new
ways to compete, challenging the conventional wisdom of its industry which in Porter’s terms has had a
homogenizing effect on competition (Porter, 1996). Industry experts have criticized the industry for its’ inability
to develop strategically in a new direction due to stiffening structures and a lack of market orientation and
entrepreneurship (Ottosson, 2008; Beckeman, 2008).
Different schools and different strategies
For an organisation in search for a new way to compete there may be different routes. Historically and still
today, Porter’s theory on strategy and the classical, or generic, approach has a strong hold both in literature and
practice (Whittington, 1997; Herrmann, 2005; Dobni, 2010). A company can according to Porter (1985) achieve
a competitive advantage through a distinctive way of competing, for example through cost or through
differentiation in relation to its competitors. Based on a unique and valuable position, strategy is then all about
making trade-offs and deliberately choosing a set of activities (different to competitors) and create fit between
all of them to deliver a unique mix of value. Different positions require different activities, hence the need for
trade-offs especially in choosing what not to do (Porter, 1996).
The need for trade-off is however rejected by the authors behind Blue Ocean (Kim & Mauborgne, 2004) as
“... the evidence shows that successful companies pursue differentiation and low cost simultaneously” (Ibid.
p.82). The problem argued by the authors of blue ocean strategies is being stuck in the old belief that trade-offs
are necessary. A blue ocean strategy is all about creating new uncontested market space, making rivals
irrelevant, through value innovation – simultaneously pursuing differentiation and low cost. This is in line with
the proponents of the ambidextrous approach who point at the need and success of companies who are able to
exploit what they have, through increased cost efficiency, and explore new areas for innovation and growth, at
the same time (O'Reilly & Tushman, 2004; Sarkees et al., 2010). Normann (2001) calls for a new business logic,
the ‘reconfiguration of value creating systems’ with the critical competence being ‘organisation of value
creation’ rather than production. Where the customer is a co-producer, and not the final destination at the end of
a value-chain, which was synonymous with the ‘industrial paradigm’. The resource-based view advocates a
move away from the traditional concepts of competitive advantage. From creating ‘strategic fit’, to that of
leveraging resources based on a ‘strategic intent’ (Hamel & Prahalad, 1989; Hamel & Prahalad, 1993).
For organisations who originate from the industrial era, changing logic implies a dramatic conceptual and
real change in how customers are viewed and how value is created (Hamel, 1996; Normann, 2001; Kim &
Mauborgne, 2005). This, in turn, might require a new understanding and implementation of new concepts,
competencies, tools and models. Research shows that for any organisation wishing to increase their customer
orientation and innovation it is important to understand the link between these two, and strategy, and to know
the relative impact of the actual strategy in relation to organisational values (Frambach et al., 2003; Dobni,
2010). “Understanding the links between a firm’s market orientation and its underlying business strategy is
critical to understanding how an organisations-wide commitment to markets can be created or, conversely, how
this commitment may fail to arise in a firm” (Frambach et al. 2003, p. 379). This is in line with Dobni (2010)
who argues that understanding the difference and the relationships between strategy and innovation is
foundational to becoming innovative.
Despite the views of different schools of thought there is an agreement that creating fit between core
activities and capabilities is the essence of strategy. Combining the ‘whole’ and not just focusing on one activity
or one capability is advocated by Porter (1996) as well as the authors of Blue Ocean (Kim & Mauborgne, 2005)
and Normann (2001). The more fit there is between company’s critical tasks, resources and competencies as
well as structure and culture, the more likely it is to achieve a competitive advantage (in Porter’s terms), create a
Blue Ocean, or be a prime mover (in Normann’s terms). Different strategies then require a different mix to
create fit. However, how these can be combined appears to be the issue.
With the aim to better understand the relationship and links between strategy and customer orientation and
innovation, along with archetypal tasks, competencies, organisational structure and culture, a theoretical strategy
landscape is proposed (see figure 1). Figure 1 is a summary of different schools of thought coupled with
inherent characteristics of different strategies (Porter, 1985; Porter, 1996; Frambach et al., 2003; O'Reilly &
Tushman, 2004; Kim & Mauborgne, 2005). Positioning dominant and contemporary schools of thought within
strategy and management on the same map is naturally to simplify respective theory. The point here however is
to visualize differences in theory and the potential challenges in practice. Without advocating one school or the
other, the authors’ proposed landscape aims to facilitate the understanding of relationships and links for an

Int. Journal of Business Science and Applied Management / Business-and-Management.org
4
organisation going through strategic change, moving from one end to the other, from cost to differentiation or
aiming to combine both.
Figure 1: A proposed strategy landscape based on different authors and schools of thought within
strategy (Porter 1985, Porter 1996, Frambach et al. 2003, O’Reilly & Tushman 2004, Kim & Mauborgne
2005
Strategy in practice – from knowing to doing through learning in context
For any organisation, and particularly for a company seeking to break-away from a reigning approach, it
may well be a necessary first step to question the assumptions behind the strategy, and the implementation
process rather than adhering to a set of suggestions deriving from one particular school or author. Such an
inquiry may be facilitated by an honest and fundamental questioning of the mental models or industry recipes
that govern the behaviour of any individual or organisation in order to think of new ways to compete (Argyris &
Schön, 1995; Markides, 1997; Jacobs & Heracleous, 2005).
Understanding the why before how is fundamental to closing the knowing doing gap (Pfeffer & Sutton,
1999), potentially more so when going through strategic change. From the perspective of learning and cognition
(Brown, Collins, & Newman, 1989), closing a similar knowing-doing gap would furthermore require that
individuals in an organisation learn, not just “learn about”, a new intended strategy and its’ prerequisites or
inherent characteristics as suggested in figure 1. The failure to do so can be viewed as an error, a mismatch
between what is intended and realized caused by individual and organisational defensive routines and theories in
use, hampering learning (Argyris, 1989). One such routine is the separation of knowing and doing which we are
taught from an early stage according to Brown et al. (1989). This can be compared with the criticism towards
the classical approach within strategy for having separated thought from action, and the formulation and
implementation of strategy (Mintzberg, 1994; Whittington, 1997; Harryson, 2000).
Brown et al. (1989) challenge the separation of what is learned from how it is learned and used through
pointing at learning and cognition as fundamentally situated, i.e. a product of the activity, context and culture in
which it is developed and used. Brown et al. (1989) propose three interdependent parts necessary for learning:
concept, activity and culture. The authors argue that a ‘concept’, like the meaning of a word is always under
construction and will continually evolve with each new occasion of use. They argue that knowledge can be
compared to tools which can only be fully understood through use, through authentic, real, ‘activities’ which in
turn are impossible to grasp unless they are viewed from within the ‘culture’ (Ibid. 1989).
Looking at strategy based on the notions of situated cognition one could view strategy as a tool (concept)
which can only be fully developed and understood through implementation (real work activity) which in turn is
dependent on the organisations culture (culture). Instead of focusing on what may hamper learning, the notions
put forward by Brown et al. (1989) offer an interesting perspective on the prerequisites for enabling learning. In
terms of formulation and implementation of strategy it is not only about the actual concept/-s of strategy ‘per se’
but also the way these concepts are understood and developed in ordinary activities and practices, in turn
influenced by the organisation’s culture. Hence, introducing a strategy of differentiation in an organisation
Formal organisational
structure
DIFFERENTIATION
greater value at higher average
unit price
Linked core activities and capabilities
Lin
ked
co
re a
ctiv
itie
s an
d c
apab
ilit
ies
Strategic intent
Innovation-
growth
Critical tasks:
Adaptability,
New products,
Breakthrough
innovation
Entrepreneurial
Competence
Adaptive organisational
structure
Measuring
Milestones,
growth
Culture of
Risk taking,
Speed,
Flexibility
Customer
orientation
Operational
competence
Critical tasks: Operations,
Efficiency, Incremental
innovation
Measuring margins,
productivity
Culture of
Efficiency,
Low risk,
Quality
Competitor
orientation
Strategic intent
Cost - profit BLUE OCEAN
Simultaneous pursuit of
differentiation and low
cost
COST comparable
value at
lower cost

Malin Olander Roese and Annika Olsson
5
previously focused on cost would require more than new definitions of, or tools for increased customer
orientation and innovation. To enable practitioners to act meaningfully and purposefully one needs to be
exposed to authentic activity, defined as the ordinary practices of a culture (Brown et al., 1989). In the face of
change, the process of learning and enculturation is dependent on new systems of behaviour and belief, or
cognitive apprenticeship as suggested by Brown et al (1989) .
3 METHOD
The theoretical framework and empirical findings presented here stem from a qualitative and longitudinal
case study from 2004 to the beginning of 2011 of one company within the Swedish forest industry named
Billerud. Billerud is a world-leading manufacturer of paper packaging material with three main business areas:
packaging and speciality paper, packaging boards, and pulp. The first two areas represent the main business with
approximately 75% of net sales. The four mills, three located in Sweden and one in the UK, and more than ten
sales offices serve 1000 customers in 100 countries. Europe is the core market, while emerging markets are
growing. The selection of the case was based on the aim to contribute to the understanding of strategic change
of a reigning paradigm why the type of industry, and particular company, proved suitable for the purpose
together with access over a period of time (Stuart, McCutcheon, Handfield, McLachlin, & Samson, 2002;
Gummesson, 2003). The unit of analysis is the strategic change under way and more specifically the managerial
actions and decisions (Kim & Mauborgne, 2005) involved in this particular case for implementing a strategic
change. The qualitative approach has allowed for capturing the individual perceptions of the studied change
(Voss, Tsikriktsis, & Frohlich, 2002).
During the first two years of the study (2004 to 2005) the aim was to identify the challenges of
implementing a new strategy (Olander-Roese & Olsson, 2007). In 2006, a new management team was put in
place, and the strategy revised. The findings presented here are based on a comparison between the initial
findings and the development within Billerud up to 2011 with the aim to contribute to the understanding of
strategic change.
The empirical findings collected between 2006 and 2011 (in order to be able to compare the initial
initiatives 2004 to 2005 reported on previously) are based on interviews, meetings/workshops and written
material. Nine (9) in-depth and semi-structured interviews were performed with six, out of eight, individuals in
the group management team and three individuals closely linked to prioritized strategic projects in the end of
2010. The interviewees in the group management team include the CEO as well as heads for packaging related
business areas, production and business functions such as HR and R&D. The three individuals outside the group
management were selected and interviewed based on their responsibility for technical development, business
analysis and development and service development respectively. The interview guide comprised of issues
covering: objectives and financial targets, strategy, customers/markets, products/services, innovation and
development, implementation and control systems. The interviews were aided by four images with copied
illustrations and text of the company’s: Business idea, Strategy, Organisational structure and Value chain, from
2004/2005 and 2009/2010 respectively. The images were used to contrast the differences and similarities
between the years and capture the interviewees’ experiences and reflections on the changes. The illustrations
and texts were collected from internal presentations and annual reports. Three meetings and workshops were
held 2008 to 2011 with members of the group management team to prepare and reflect on previous research and
new findings and propositions. Written material studied includes internal and external presentations, employee
magazines, annual reports, press releases and media articles.
Through an abductive approach, an iteration between theory and empirical findings has been allowed for
(Alvesson & Sköldberg, 1994; Dubois & Gadde, 2002; Olsson & Olander-Roese, 2005). In analysing the
empirical data from interviews and written material, qualitative content analysis has been applied (Patton, 2002).
The interviews were transcribed and summarized with findings in the written material. This was followed by
matching central events, decisions, actions, and experiences in relation to the themes identified in the initial
phases of the study when four main challenges to the implementation of the new strategy were identified. Firstly
“Dominant perspectives” referring to existing and predominant perspectives and ways of working with a strong
focus on production rather than customer and potential market needs. Secondly “Tools and Processes” referring
to a lack of definitions, tools and processes for market learning, new product development and innovation.
Thirdly “Strategy and strategic decisions” referring to assumptions and actions guiding strategy and strategic
decision not supporting the strategic intent. And last, the actual “Implementation approach” in itself which had
led to breakdowns in communication (Olander-Roese, 2008). The analysis of the interviews was complemented
with findings and content analysis of the written material on: particular events and focus areas, and descriptions
of targets, strategy, markets, business areas, and developments of internal programs, systems and processes.
Different sources of data were used to ensure the quality of the case study at hand (Benbasat, Goldstein, &
Mead, 1987; Yin, 2003). Furthermore a continuous dialogue with the case company has allowed for reflections
on preliminary outcomes and final propositions suggested in this article. This was an important step in order to

Int. Journal of Business Science and Applied Management / Business-and-Management.org
6
validate the findings, or rather demonstrate reasonableness, credibility and truthfulness in practice as well as in
relation to existing theory (Patel & Tebelius, 1987; Arbnor & Bjerke, 1994; Gummesson, 2000).
4 FINDINGS AND DISCUSSION: THE JOURNEY TOWARDS A NEW PARADIGM
Billerud was formed in 2001 through a merger of existing Swedish paper mills and introduced on the
Stockholm Stock exchange. During the first years, much work was spent on coordinating the activities of the
different mills. Synergies lead to increased production capacity and a significant rise in deliveries. In 2004 a
new strategy was developed where customer orientation and new product development were important
cornerstones. However, implementing the new strategy proved difficult due to the history and current strategy of
the company. To further complicate the situation, weakening of the market conditions, and rising costs for raw
materials and energy, brought the operating margin to negative levels in 2005.
Following the first attempt to institute the notions of ‘customer orientation’ and ‘innovation’, a new
management team was formed between 2005 and 2006. Together with external expertise Billerud’s objectives
and strategy were revised anew. In 2010 the financial target of operating margin was reached for the first time.
During the years in between, two issues of particular relevance to Billerud’s journey, contribute to the purpose
of this paper. Firstly, how to link and form new dominating ideas of customer orientation and innovation in
relation to the current paradigm guiding the firm and secondly, how to implement relevant tools and models for
innovation and business development.
Linking and forming new dominating ideas - Aiming to lead the future of packaging development
The central driving force for the new management team of Billerud was, and still is, to move away from a
traditional paper-pulp supplier to a customer focused, solution oriented company. Revising the strategy anew in
2006 aimed to clarify that intent and enable a move from a position of competing on price, volume and
‘receiving orders’, to taking a proactive lead in the development of future packaging and packaging solutions.
What was expressed as an aim to be ‘the customer's first choice when selecting packaging paper’ in 2004 has
evolved to the objective of leading ‘the development of future packaging with a focus on function, design and
sustainability’. The main aim was to, in parallel, establish the two cornerstones of strategy being world class
process efficiency and customer focused development.
Billerud’s point of departure, or rather that of the founding mills’, can be plotted to the left on the strategy
landscape where operations, efficiency and incremental innovation were key (see figure 1). When Billerud first
introduced the concepts of customer orientation and new product development in 2004, the link between these
and strategy as suggested by Frambach et al. (2003) was not established. Limited attention was paid to what
these terms actually entailed from the perspective of strategy, in addition to the practical and cultural
prerequisites (Olander-Roese & Olsson, 2007).
Revising the strategy in 2006 clarified the strategic intent through addressing the assumptions behind and
answering the ‘why’, before how, as suggested by Pfeffer and Sutton (1999). This was also coupled with
decisions based on a cultural view (as opposed to a behavioural view applied by Frambach et al. 2003), seeing
an organisation’s culture rather than only strategy as influencing the organisation’s market orientation and hence
new product activity and innovation (Deshpandé & Webster, 1989; Homburg & Pflesser, 2000; Frambach et al.,
2003). For Billerud the inherent ‘industrial view’ as phrased by Normann (2001) recognized by a culture in
favor of process efficiency, low risk, and quality did not promote the exploring culture of risk-taking and
flexibility sought for. As expressed by one interviewee “…we have decided to embark on a journey which
means we must maintain and increase our flexibility and our ability to respond to our customers in a way that is
much clearer now than it was before, that puts a lot of pressure on production. Historically the industry, and us,
have lived by the logic to produce as much as possible and sell what we produce, and it does not add up
anymore”.
One important decision to enable customer orientation, without reducing the focus on operational
excellence, was to re-structure the organisation much in line with the ambidexterity approach suggested by
Tushman and O’Reilly (2004) to enable exploiting and exploring simultaneously. In 2006 shortly after revising
the strategy three business areas were formed. The intent was to clarify the organisational responsibility for
customer focused development and sales on the one hand within the business areas, and the mills responsibility
for production efficiency and quality on the other. The commercial responsibility, which had previously been
with the mills, was placed with the business areas together with the development of new products and services.
In doing so, Billerud has allowed for a new exploring culture within the formed business areas, and a
strengthening of the existing culture of exploitation within the mills, of equal importance to ensure the quality
and development of the production processes. As Billerud’s strategy has evolved “culture, values and
employees” has been added as an important cornerstone of strategy to further emphasize the building blocks
paramount for achieving growth. However, fundamental challenges facing the new management team were that
of ‘back-selling’, a term connected with approaching the customers’ customer, and how to increase innovation.

Malin Olander Roese and Annika Olsson
7
The ring fight between operational excellence and customer development
When the decision was made to put more emphasis on ‘customer orientation’ already in 2004 it opened up
for a new perspective, extending the scope beyond the primary customer (the converters) to also include the
customers’ customers: brand owners and retailers. The intent was not to move forward in the value chain e.g.
through acquiring converting capacity. The intention was to move from a position of ‘receiving orders’ to taking
a more proactive stance, finding other meanings of value than price per square-meter. This is in line with
Normann (2001) who argue the need for a new business logic where ”…true customer orientation means that
one has to go beyond the direct relationship between oneself and one’s customer to understand the relationship
between the customers and the customers’ customer...” (Ibid. p.71). However, embracing the brand owners and
retailers, tapped on the deeply rooted taboo of ‘back-selling’ and was not regarded acceptable industry practice.
Managing the ring fight between “productivity focus” versus “customer-sales focus” created a need for steps,
solutions and a timeframe more suitable to Billerud’s organisations than initially foreseen. Revising the strategy
in 2006, giving new meaning to customer orientation and innovation has required learning, not just ‘learning
about’, in the relevant context and through ‘real’ activities to enable implementation in line with the suggestions
of Brown et al. (1989). For Billerud it was not only a matter of finding the right tools and processes for
identifying market needs and developing new product or services. Challenging ‘back-selling’ involved risk-
taking and a learning by doing approach much in line with the suggestions by Pfeffer and Sutton (1999). It also
involved enabling a new mind set as suggested by Normann (2001) – not only within the organisation but also
in the industry. Through intense communication in media and new innovative offerings, the image of Billerud
today is that of a ‘prime mover’ to use Normann’s terminology (Normann, 2001). That image may be stronger
outside than inside the company but has helped the company’s re-positioning on the market as well as in
strengthening the strategic intent internally.
Within the organisation, what in 2004 was perceived as a decision “put on top” of the regular tasks
performed, has become part of the daily activities within the business areas set up to work with customer
focused solutions. One of the contributing factors in this process was recruiting competence with experience
from working with brand owners and retailers. With support from the management team, and individuals in
charge, second customers were approached. The first attempts were by no means a success. However, through a
determined and yet tolerant trial and error approach, valuable market intelligence was gathered and relations
with new actors created. One of the interviewees recalled one of the first attempts to approach retailers “…we
met with retailer X, the heads and all, well prepared, presented our paper and our environmental approach and
their response was: ‘guys, we don’t buy rolls of paper, we buy packaging. So please come back when you have
thought this over and have something to offer.’ So we did that and realized it is the packaging solution that is
the key issue.” The reaction from primary customers, the converters, was not that of back-selling but rather a
positive response to the value that Billerud was able to contribute to them, in what has become a joint effort in
satisfying the needs and expectations of brand owners and retailers. For Billerud the feedback process from
talking to retailers and brand owners has become lead generators in the company’s own development of new
products and service solutions. Today, customer based solutions account for approximately five percent of the
turnover with the intention to be five folded.
Exploring and situating the concept of innovation
Introducing the idea of ‘innovative packaging solutions’ in 2004 led to a need for new tools and processes
which, at the time, were not familiar to the organisation. With the revised strategy in 2006 a number of potential
areas for innovation were identified and the achievements that followed can be understood through the
prerequisites for situated cognition, or enabling not only knowing but also doing (Brown et al., 1989; Pfeffer &
Sutton, 1999). Firstly, the term innovation itself was addressed in the context of Billerud with its’ overriding
strategic intent and different organisational cultures enabled through the new organisation. The term in itself
was found inhibiting for many years and extensive work was put into defining and putting in place an
interpretation and way of working suitable for Billerud, where previously development had been much tied to
the production processes improving efficiency and the quality of the paper. Similar to other interviewees one
explained the management’s work with innovation: ”I would like to say, or rather what we want innovation to
be…, we’ve struggled with the term, it is a rather intimidating concept, there are so many different views on
what innovation is. So we have chosen to describe it in three areas, where we believe we contribute, where we
aim to develop our strengths.”
Debating and testing resulted in three focus areas: radical business development, customer driven product
development and customer relations including events and workshops. In practice Billerud has worked with
parallel instead of sequential processes, developing and testing the same ideas and solutions on the market
simultaneously, with the result of launching innovative packaging solutions with registered trademarks. The
move would not have been possible without the fundamental and deep-seated knowledge of the paper within the
organisation, combined with a competent and flexible approach of test-runs and trial and error.

Int. Journal of Business Science and Applied Management / Business-and-Management.org
8
Today Billerud has arrived at an innovation model with two different processes and outcomes adapted to
the mills on the one hand, and the business areas on the other. While the mills have a process for improvements
and incremental development, the business areas have one for renewal and business development. In spite of the
different innovation processes, new product concepts have been tested in the mills and successfully launched, in
one particular case even without the consent of management. Billerud’s learning-by-doing approach allows for
new interpretations and action through ‘real activities’, hence enabling innovation in areas not foreseen. A closer
cooperation beyond existing customers to customers’ customers, has also included building a network with
suppliers, universities and interest organisations to support a more open arena for innovation.
Linking and situating – instead of formulating and implementing
From a theoretical perspective of strategy one could argue that it goes without saying that understanding
and making the link between strategy, core activities and capabilities (Porter, 1996; Normann, 2001; O'Reilly &
Tushman, 2004; Kim & Mauborgne, 2005) as well as customer orientation and innovation, is a prerequisite for
success. However, the limited research between strategy, customer orientation and new product development
identified by Frambach et al (2003), together with the empirical findings presented here, suggest that more
understanding is needed to facilitate such strategic change. We would argue that there is little consideration for
the actual outset of an organisation’s strategic endeavour, in relation to the process of linking. For Billerud, the
strategy paradigm that had formed the constituent parts of the company for decades, and its’ core activities and
capabilities, had little room for customer orientation and innovation in the way it was intended, when it was first
addressed. The actual progress made towards a new competitive position – aiming to move from a cost-focused
strategy to a strategy combining cost and differentiation in Porter’s terms, or a Blue Ocean, has been facilitated
by a deeper understanding of these links, not only from a behavioural view but also a cultural view (Deshpandé
& Webster, 1989; Homburg & Pflesser, 2000; Frambach et al., 2003). In practice, discussions within the
management team on the feasibility of the strategy and differences in view on the deadline for performance
output have been continuous, while at the same time a contributing factor to the changes. While on the one hand
clarifying the new strategic intent, the on-going journey to achieve this objective has required an equal share of
clarifying the assumptions behind the strategy to date. “It’s all about simplicity, a simple organisation, creating
trust and confidence between people. If you create a complexity in the communication and relations between
people you undermine that, from sales to the visionary stuff it’s all about the ability to concretize in all
simplicity what needs to be done, otherwise this journey will only be a power point-presentation” in the words
of one interviewee. The different actions and decisions taken between 2004 and 2011, has created a deeper
understanding of the links between strategies and core activities, capabilities and cultures. This in turn has
contributed to finding and developing new ways of working, recruit new competence, guide the allocation of
resources and structuring of the organisation as well as adapt the performance measures. “Today, we in the
management team talk exclusively about customers…no rather, we talk about business, innovation and
development. Volumes and production takes less space, if any.” as expressed by one person in the management
team. Based on the empirical findings and theoretical framework presented here we would therefore suggest the
following: (Proposition 1) for an organisation going through strategic change, understanding the assumptions
behind different strategic intents and the link between a chosen strategy and critical core activities, capabilities
and culture is a prerequisite to enable a transition. The proposed strategy landscape (see figure 1) may be one
starting point.
In order to overcome the formulation and implementation gap however, understanding the links is only the
first step. The main contributing factor to Billerud’s progress from 2006 and onward, is the way in which
management acknowledged and approached the differences in capabilities, tasks and culture needed. And
foremost, the iterative and interdependent process between new and existing concepts of the strategic intent,
work activities and culture. In the words of Argyris (1977), the new management violated the norms and games
respected and played in order to survive through challenging “back-selling” for example. However, this action
was coupled with establishing new “ordinary practices” both through approaching customers customer’s and
through doing test runs in the production facilitates, not common practice in the process and investment heavy
forest industry. Progress and projects have been allowed to flourish even if they have not always followed the
documented implementation routines or, for example, power point templates connected to new initiatives. The
recruitment of new managers have played a central part in setting a different, or rather complementary,
innovative culture, recognized by risk-taking, speed and flexibility through a process of joint interaction
between the “new” and the “existing”. As expressed by one interviewee: “This learning process we have entered
is so multifaceted. It’s about everything from our administrative systems to how we communicate, how we
should be organised, our control system and performance measures, about incentives for sales people; all this is
part of the journey that we are on. And what may seem very logic on the surface, and heading the direction we
are, is not trivial.” Billerud’s iterative implementation and learning approach for enabling strategic change,
moving towards differentiation while maintaining focus on cost, is illustrated in figure 2. The figure is

Malin Olander Roese and Annika Olsson
9
developed based on the suggestions by Brown et al. (1989) seeing learning for strategic change through the
lenses of situated cognition and different schools of strategy.
Figure 2: Implementing strategic change through the lenses of situated cognition. Figure developed based
on the suggestions by Brown et al. (1989) and authors within strategy (Porter 1985, Porter 1996,
Frambach et al. 2003, O’Reilly & Tushman 2004, Kim & Mauborgne 2005).
Hence, strategic change with the aim to create a new paradigm, linking new core activities and capabilities,
allowing for simultaneous exploitation and exploration has not only required linking or subsequent structural
measures as suggested by O'Reilly & Tushman (2004). To quote one interviewee: ”This is very much about
turning people’s heads around, to create the right attitudes is extremely important. And that journey, we have
certainly not reached the end of. Getting to the depth of the whole organisation, is a job not finished, if it is even
feasible…”. In their own words Billerud’s journey is still in an early phase. Issues of culture, organisation
structure and business models remain as well as finding new performance measures. Through the lenses of
situated cognition (Brown et al., 1989) and different schools of thought within strategy, Billerud’s journey from
2004 to 2011 is best described as an on-going movement and a process of knowledge and learning as situated –
much dependent on an interaction between the existing and wanted strategic ‘concepts’, ‘activity’ and ‘culture’.
Hence we propose that (Proposition 2): strategic change is enabled through an iterative and probing approach
between formulation and implementation which considers knowledge and learning of new concepts, activity and
culture as situated.
5 CONCLUSIONS AND SUGGESTIONS FOR FUTURE RESEARCH
The purpose of this paper is to contribute to the understanding of strategic change, especially for an
organisation challenging a reigning strategy paradigm. Through combining empirical research with different
schools of thought within strategy and a cognitive approach for learning we suggest two propositions
contributing to future research and practical guidance for managers when formulating and implementing
strategic change through: linking and situating.
Firstly we suggest that understanding the assumptions between different strategic intents and the link to and
between the subsequent core activities, capabilities and culture is a prerequisite for enabling a similar strategic
change. For theory we argue the need for further research on the link (or non-link) between assumptions of
current and intended strategy and particular activities, capabilities and cultural attributes of relevance for
enabling a viable strategic change. Future studies within the forest and paper packaging industry and similar
settings could aim to further identify, compare and develop frameworks for, for example, introducing
contemporary strategy concepts such as customer orientation and innovation. In the case reported here, the link
between strategy and these concepts was expressed to be particularly difficult due to the dynamics between the
productivity focus versus the customers-sales focus.
Secondly, and possibly more importantly in a similar situation, we suggest that a transition and
implementation is facilitated through an approach which considers knowledge and learning as situated. The case
DIFFERENTIATION
Linked core activities and capabilities
Lin
ked
co
re a
ctiv
itie
s an
d c
apab
ilit
ies
Strategic intent
Innovation-
growth
Critical tasks:
Adaptability,
New products
Customer
orientation
Critical tasks:
Operations,
Culture:
Low risk
Competitor
orientation
Strategic intent
Cost - profit
Billerud’s strategic intent to
take a leading position
through world class process
efficiency and customer
focused development
COST
The Culture/-s of the Organisation
Authentic work activities and critical tasks –
forming and formed by the Concepts
The Concept/-s formulated as the Strategic intent and/or related characteristics
EXISTING
NEW
Culture:
Risk taking,
Flexibility

Int. Journal of Business Science and Applied Management / Business-and-Management.org
10
study indicates that in spite of the outset with a revised strategy and plan, an iterative and probing approach of
formulation, interpretation and implementation coupled with purposeful activities acknowledging different
cultures, have been integral (but not always foreseen) parts of the journey. For theory we argue the need for
further research on the role of situated cognition in strategic change, and particularly the interdependency
between cognitive and behavioural aspects in formulating and implementing strategy. A study focusing on
identifying the content and relative impact between the interdependent parts of strategic ‘concept/-s’, ‘authentic
work activities’ and ‘culture/-s’ (see figure 2) could shed more light on the iterative process of strategy
formulation and implementation in strategic change. Furthermore it could be made more explicit what needs to
change and how, seeing that change takes time and may require more focus on the how compared to
implementing a strategy with no or limited change. Future research in this direction would require more in-depth
and longitudinal case studies beyond the management tier of an organisation.
An interesting aspect of the cognitive processes is also the role of language and particularly use of verbal
expression and their potential development during a change process when giving new meaning to new concepts,
tasks and capabilities. Further research is also suggested in the area of managing a dual focus, in terms of
strategy, exploring and exploiting through an ambidextrous approach, based on longitudinal studies.
For practice we argue that these findings are of high relevance for organisations, not least within primary
industries, facing the same or going through similar strategic change, questioning or challenging a strategy
paradigm. Adhering to calls for increased customer orientation and innovation is easy but making them
everyday practice, and strategically viable, may comprise more than adding them to the current strategy. The
propositions suggest that managers could benefit from acknowledging the strategic landscape suggested in this
paper as a means to prepare for strategic change. The findings also indicate that a strategic change process may
be facilitated through consciously applying an iterative process from the outset allowing for an effective
adaptation of strategic concepts such as value propositions, and development of capabilities and culture
considering ‘every day activities’.
On a final note the concluding propositions have limitations in that they have been derived from a single
case study and thus has not allowed for a cross-case analysis (Eisenhardt, 1989; Gummesson, 2000). However,
despite the empirical description being specific to one company, the resulting findings may be of general
relevance as studies of management and organisations benefit from longitudinal and in-depth qualitative
research (Gummesson, 2000; Gummesson, 2003). The aim to contribute to the understanding of strategic change
may benefit from even more explorative and patient research approaches within companies who are dipping
their toes in a new ocean without knowing what awaits below the surface.
REFERENCES
Alvesson, M. & Sköldberg, K. (1994). Tolkning och reflektion - Vetenskapsfilosofi och kvalitativ metod. First
edn. Studentlitteratur, Lund.
Arbnor, I. & Bjerke, B. (1994). Företagsekonomisk metodlära. Lund: Studentlitteratur.
Argyris, C. (1977). Double Loop Learning in Organizations. Harvard Business Review, 55(5), 115-125.
Argyris, C. (1989). Strategy Implementation - An Experience in Learning. Organizational Dynamics, 18(2), 5-
15.
Argyris, C. & Schön, D. A. (1995). Organizational Learning II - Theory, Method and Practice. Reading, Mass:
Addison-Wesley Publishing.
Beckeman, C.-G. (2008). Innovation Management i ny skepnad ett måste för svensk skogsindustri. Nordisk
Papper & Mässa,(1/2008), 58.
Benbasat, I., Goldstein, D. K., & Mead, M. (1987). The Case Research Strategy in Studies of Information-
Systems. Mis Quarterly, 11(3), 369-386.
Brown, J. C., Collins, A., & Newman, D. (1989). Situated cognition and the culture of learning. Educational
Researcher, 18(1), 32-42.
Collins, J. C. & Porras, J. I. (1996). Building your company's vision. Harvard Business Review, 74(5), 65-77.
Cummings, S. & Daellenbach, U. (2009). A Guide to the Future of Strategy? The History of Long Range
Planning. Long Range Planning, 42(2), 234-263.
Deshpandé, R. & Webster, F. E. (1989). Organizational Culture and Marketing: Defining the Research. Journal
of Marketing, 53(1), 3-16.
Dobni, C. B. (2010). Achieving synergy between strategy and innovation: The key to value creation.
International Journal of Business Science and Applied Management, 5(1), 48-58.

Malin Olander Roese and Annika Olsson
11
Dubois, A. & Gadde, L. E. (2002). Systematic combining: an abductive approach to case research. Journal of
Business Research, 55(7), 553-560.
Eisenhardt, K. M. (1989). Building Theories from Case-Study Research. Academy of Management Review,
14(4), 532-550.
Frambach, R. T., Prabhu, J., & Verhallen, T. M. M. (2003). The influence of business strategy on new product
activity: The role of market orientation. International Journal of Research in Marketing, 20(4), 377-397.
Gadiesh, O. & Gilbert, J. L. (2001). Transforming corner-office strategy into frontline action. Harvard Business
Review, 79(5), 72-79.
Gummesson, E. (2000). Qualitative Methods in Management Research. (Second edn ed.) Thousand Oaks,
California: Sage Publications Inc.
Gummesson, E. (2003). All research is interpretive! Journal of Business and Industrial Marketing, 18(6/7), 482-
492.
Hamel, G. (1996). Strategy as revolution. Harvard Business Review, 74(4), 69-&.
Hamel, G. & Prahalad, C. K. (1989). Strategic Intent. Harvard Business Review, 67(3), 63-76.
Hamel, G. & Prahalad, C. K. (1993). Strategy As Stretch and Leverage. Harvard Business Review, 71(2), 75-84.
Harryson, S. J. (2000). Managing Know-Who Based Companies - A Multinetworked Approach to Knowledge
and Innovation Management. Cheltenham, UK: Edward Elgar Publishing Limited.
Hayhurst, D. (2002). Valuing the customer's voice. PPI Pulp and Paper International Magazine, 44(8), 25-27.
Herrmann, P. (2005). Evolution of strategic management: The need for new dominant designs. International
Journal of Management Reviews, 7(2), 111-130.
Homburg, C. & Pflesser, C. (2000). A multiple-layer model of market-oriented organizational culture:
Measurement issues and performance outcomes. Journal of Marketing, 3(4), 449-462.
Jacobs, C. D. & Heracleous, L. (2005). Answers for questions to come: reflective dialogue as an enabler of
strategic innovation. Journal of Organizational Change Management, 18(4), 338-352.
Johnson, G. (1992). Managing Strategic Change - Strategy, Culture and Action. Long Range Planning, 25(1),
28-36.
Johnson, M. W., Christensen, C. M., & Kagermann, H. (2008). Reinventing Your Business Model. Harvard
Business Review, 86(12), 50-59.
Kaplan, R. S. & Norton, D. P. (2007). Using the balanced scorecard as a strategic management system. Harvard
Business Review, 85(7-8), 150-161.
Kim, W. C. & Mauborgne, R. (2004). Blue ocean strategy. Harvard Business Review, 82(10), 76-84.
Kim, W. C. & Mauborgne, R. (2005). Blue Ocean Strategy - How to Create Uncontested Market Space and
Make the Competition Irrelevant. Boston: Harvard Business Review Press.
Kotter, J. P. (1995). Leading Change - Why Transformation Efforts Fail. Harvard Business Review, 73(2), 59-
67.
Mankins, M. C. & Steele, R. (2005). Turning great strategy into great performance. Harvard Business Review,
83(7), 64-72.
Markides, C. (1997). Strategic innovation. Sloan Management Review, 38(3), 9-23.
Melnyk, S. A., Hanson, J. D., & Calantone, R. J. (2010). Hitting the Target ... but Missing the Point: Resolving
the Paradox of Strategic Transition. Long Range Planning, 43(4), 555-574.
Mento, A. J., Jones, R. M., & Dirndorfer, W. (2002). A change management process: Grounded in both theory
and practice. Journal of Change Management, 3(1), 45-59.
Mintzberg, H. (1994). The Rise and Fall of Strategic Planning. Hertfordshire: Prentice Hall International (UK).
Mintzberg, H. & Quinn, J. B. (1992). The Strategy Process - Concepts and Context. Englewood Cliffs: Prentice
Hall International, Inc.
Neilson, G. L., Martin, K. L., & Powers, E. (2008). The secrets to successful strategy execution. Harvard
Business Review, 86(6), 60-70.
Normann, R. (2001). Reframing business - When the Map Changes the Landscape. John Wiley & Sons Ltd,
Chichester.
O'Reilly, C. A. & Tushman, M. L. (2004). The ambidextrous organisation. Harvard Business Review, 82(4), 74-
81.
Olander-Roese, M. (2008). Towards a new business paradigm - A study of the paper packaging industry. Lund:
Department of Design Sciences, Division of Packaging Logistics, Lund University, Media-Tryck.

Int. Journal of Business Science and Applied Management / Business-and-Management.org
12
Olander-Roese, M. & Olsson, A. (2007). Adapting to changes in the supply chain – Challenges to re-defining
the supply chain for increased customer orientation and product innovation within the paper packaging
industry. In 16th annual IPSERA conference.
Olsson, A. & Olander-Roese, M. (2005). Multi-theoretical perspectives in an abductive action research study. In
B. Gammelgaard & T. Skjött-Larsen (Eds.), Nofoma 2005 edn Copenhagen: Nofoma.
Ottosson, E. (2008). Strategiskt vägskäl för nordisk skogsindustri. SPCI/Svenska Papperstidning,(1), 26-27.
Patel, R. & Tebelius, U. (1987). Grundbok i forskningsmetodik: kvalitativt och kvantitativt. Lund:
Studentlitteratur.
Patton, M. Q. (2002). Qualitative Research & Evaluation Methods. (3rd ed.) Thousand Oaks: Sage Publications,
Inc.
Pfeffer, J. & Sutton, R. I. (1999). Knowing "what" to do is not enough: Turning knowledge into action
(Reprinted from The knowing-doing gap: How smart companies turn knowledge into action). California
Management Review, 42(1), 83-108.
Porter, M. E. (1985). Competitive advantage, Creating and Sustaining Superior performance. New York: The
Free Press.
Porter, M. E. (2008). The five competitive forces that shape strategy. Harvard Business Review, 86(1), 78-93.
Porter, M. E. (1996). What Is Strategy? Harvard Business Review, 74(6), 61-78.
Sarkees, M., Hulland, J., & Prescott, J. (2010). Ambidextrous organizations and firm performance:the role of
marketing function implementation. Journal of Strategic Marketing, 18(2), 165-184.
Stuart, I., McCutcheon, D., Handfield, R., McLachlin, R., & Samson, D. (2002). Effective case research in
operations management: a process perspective. Journal of Operations Management, 20(5), 419-433.
Sull, D. N. (2007). Closing the gap between strategy and execution. Mit Sloan Management Review, 48(4), 30-
40.
The Swedish Forest Industries Federation (2011). Skogsindustrin: En faktasamling 2011 års branschstatistik
[On-line]. Available: www.skogsindustrierna.se
The Swedish Forest Industries Federation (2012a). Strukturutveckling 1969-2011 [On-line]. Available:
www.skogsindustrierna.se
The Swedish Forest Industries Federation (2012b). The Swedish Forest Industries Federations.
www.skogsindustrierna.se [On-line]. Available: www.skogsindustrierna.se
Voss, C., Tsikriktsis, N., & Frohlich, M. (2002). Case research in operations management. International Journal
of Operations & Production Management, 22(2), 195-219.
Whittington, R. (1997). What is strategy and does it matter. London: International Thomson Business Press.
Yin, R. K. (2003). Case study research: design and methods. (3rd ed.) Thousand Oaks: Sage Publications, Inc.

Int. Journal of Business Science and Applied Management, Volume 7, Issue 2, 2012
Differences on the image of Brazil in external markets according
to consumers’ age, gender, knowledge about the country and
country of residence
Fernanda de Tavares Canto Guina
Master of Science in Business Administration, University of São Paulo
Av. Bandeirantes, 3900. Ribeirao Preto, SP. ZIP: 14040-905. Brazil.
Telephone: 55-16-3602-4970
Email: [email protected]
Janaina de Moura Engracia Giraldi
Tenured Professor at the Department of Business Administration, University of São Paulo
Av. Bandeirantes, 3900. Ribeirao Preto, SP. ZIP: 14040-905. Brazil.
Telephone: 55-16-3602-4970
Email: [email protected]
Abstract
A country’s image could be managed to give greater value to products from that country, while making the
country more attractive to investors and more desirable as a tourism destination. Considering two important
gaps in the literature on country image (discrepant results on the influence of socio-demographic characteristics
on the image of a country and few studies on the image of Brazil), this paper’s objective is to check for
differences on Brazil image according to the following consumers’ characteristics: age, gender, knowledge
about Brazil and country of residence. A quantitative survey was distributed to 380 respondents from four
European countries: Germany, Ireland, England and France. This study concluded that beliefs about countries
may differ according to the degree of perceived similarity with a given country and to certain demographic
issues, and respondents that had better evaluations on Brazil’s image were: young, men, with a high level of
knowledge about Brazil and from France. Moreover, aspects related to communication, distribution and
differentiation of Brazilian products were those that received the worst evaluation by consumers participating in
the survey, which indicates the need for greater investments from both the Brazilian government and the private
sector in communicating and promoting Brazilian products abroad.
Keywords: country image, Brazilian products, European market
Acknowledgments: This research has received financial support from FAPESP/Brazil.

Int. Journal of Business Science and Applied Management / Business-and-Management.org
14
1 INTRODUCTION
Several studies on country image have been conducted since the 1960s (Pharr, 2005; Usunier, 2006). In
general, they point to the idea that consumers have very distinct but generalised perceptions of products from
other countries. These perceptions of a country have a significant effect on consumer attitudes regarding brands
of products made in certain countries (Balabanis, Mueller & Melewar, 2002; Han, 1989). Several authors call
this phenomenon the “country-of-origin effect” (Han, 1989; Jaffe & Nebenzhal, 2001; Martin & Eroglu; 1993;
Pappu, Quester & Cooksey, 2007).
By analysing the research on country image and its relevance in a decade when global brands were already
consolidated (i.e., the 2000s), Pharr (2005) reports that one conclusion can be unequivocally drawn: the origin
of the product continues to influence the evaluation the consumer makes of that product. According to Pharr
(2005), to oppose the rules of origin as well as to search for reduced trading tariffs or to reduce the labour costs
by reallocating manufacturing facilities, including lower salaries, major companies are redefining the country of
origin of their products and services.
Bhaskaran and Sukumaran (2007) indicate that the findings of past country image studies can sometimes be
contradictory, with some authors concluding that country image is a salient variable that influences product
evaluations and purchase intentions, and others concluding that many other factors influence customer beliefs
and purchase intentions much more strongly. They have suggested that country image beliefs are highly
contextual and evolve over time, and that past studies may have not considered the potential influences,
interactions and interconnectedness of factors such as brand names, hybrid offerings, communication and
promotional activities, customer characteristics and market dynamics.
Thus, the image of a country can be influenced by exogenous factors such as the level of economic
development, national identity, people, political factors, culture and personal values (Jaffe & Nebenzhal, 2001;
Balabanis, Mueller & Melewar, 2002), leading to different results. Specifically, studies involving age as an
influential factor have presented significant results, with younger consumers more open and receptive with
regard to foreign products (Good & Huddleston, 1995). Gender also plays an important role in the perception of
“made-in’’ images (Johansson et al. 1985), but results are not consistent and this is one of the motivations for
developing this research. For instance, Balabanis, Mueller and Melewar (2002) explain that females have a
higher bias against foreign products and in favor of domestic ones. On the other hand, Good and Huddleston
(1995) indicate that women tend to evaluate foreign products in a more favourable manner. This discussion
leads to the idea that the consumers’ perceptions actually can change based on their socio-demographic or
cultural characteristics, which is an influence investigated in this research.
By understanding the influence of a country’s image on one or more products, the managers of private
institutions, such as the export companies, may or may not use the country of origin emphatically as a marketing
strategy, or they can alter the product price to increase competitiveness and minimise the negative effects of the
country’s negative image among consumers (Han, 1989; Jaffe & Nebenzhal, 2001).
Additionally, companies, industries and government should work collaboratively so that the nation’s image
can be positively formed and successfully explored. Individually, a company cannot control the image of its
country overseas. At the same time, managers of both private and public institutions should be aware of the
magnitude of the “country-of-origin effect” in terms of consumer perception and market competition (Jaffe &
Nebenzhal, 2001).
Considering the existing scales for measuring country image, despite the fact that there are many of them,
only a few correlate with one another; researchers develop a new approach rather than improve an already-
existing scale (Roth & Diamantopoulos, 2009). Many scales have sought to assess the dimensions of country
image, while others try to evaluate how this image can affect purchase intentions regarding foreign products. In
addition, the majority of these scales have been used in countries such as Germany, France, Canada, and the
USA, and only few studies regarded the image of Brazil (Giraldi & Carvalho, 2006), despite the growing
importance of the country in the world economy. Brazil is the 7th
economy in GDP numbers (US$ 2,304.646
million in 2011), with a population of around 196.7 million inhabitants (The World Bank, 2012). However,
according to Usunier (2006), Brazil has served as a research topic for only 2% of the total amount of work on
this theme.
Considering two important gaps in the literature on country image (discrepant results on the influence of
socio-demographic characteristics on the image of a country and few studies on the image of Brazil), this
paper’s objective is to grow the current literature on the topic, by checking for differences on Brazil image
according to the following consumers’ characteristics: age, gender, knowledge about Brazil and country of
residence.
The present study sought to evaluate the image of Brazil from the perspective of a group of European
consumers through a quantitative survey. Some European market countries were chosen for this survey, as
consumers from these countries tend to be environmentally conscious and active, thus resulting in their
consumption behaviours having as little impact as possible on the environment (Prieur, 2001).
Fernanda de Tavares Canto Guina and Janaina de Moura Engracia Giraldi
15
2 COUNTRY IMAGE
There have been many studies on country image (Pharr, 2005; Usunier, 2006). In fact, the academic
community has sought to deepen the analyses of country image, particularly in the last 30 years, and to
determine how these images can influence individuals’ purchasing decisions and attitudes as well as their choice
of country to visit. In addition, a country’s image affects other governments’ decisions regarding partnerships
for development of joint projects or even companies’ choices of new regions for investment (Han, 1989; Jaffe &
Nebenzhal, 2001; Pappu, Quester & Cooksey, 2007; Roth & Diamantopoulos, 2009; Roth and Romeo, 1992).
The literature on national stereotypes and perceptions of nations dates from the 1930s (Child & Doob,
1943; Katz & Braly, 1933; Klingberg, 1941 apud Roth & Diamantopoulos, 2009). However, it was not until the
1960s that the concept of country image began to draw more attention from marketing researchers as a result of
the intensification of commercial exchanges and financial investments. Research on country image indicates
that, despite globalisation and the growing economic interdependence between nations, countries have been
analysed differently in various regions of the world (Papadopoulos, 1993).
Nagashima (1970) was the first author to define the concept of country image in terms of origin of
products, that is, of country image as being the picture, reputation, and stereotype that businessmen and
consumers associate with the products of a country. This image is created by variables such as history and
tradition, representation of products, political and economic systems and the consumer’s emotional experiences.
For Roth and Romero (1992), country image is the real perception that consumers have of products from a
certain country based on their previous perceptions of the country’s production, market resistance and
weaknesses, while Martin and Eroglu (1993) define country image as the sum of all of the informative,
inferential and descriptive beliefs that an individual has of a country.
For Nebenzhal, Jaffe and Usunier (2003), country image is formed by the consumer’s perceptions of
attributes of a product made in a given country, by the emotions the consumer has regarding the country and by
the perceptions resulting from the social desire to have products manufactured in that country. According to
D’Astous and Boujbel (2007), other countries are strongly present in people’s consciousness through mass
media, products and brands, and travel experiences, and individuals possess organised mental representations of
other countries as they do with other objects (brands, stores, persons) related to personal characteristics (e.g.,
brands) (Aaker, 1997) and stores (D’Astous & Lévesque, 2003).
Beliefs about country image are important when consumers have difficulty distinguishing different
offerings or when they do not have enough information to reduce risky buying behaviour (Heslop &
Papadopoulos, 1993). Therefore, a country’s image affects the consumer’s mind cognitively and intuitively in
four ways: general image of the country based on previous contacts or experiences; general image of the country
in addition to other affective and cognitive influences derived from experiences with its products, thus forming a
country-of-origin image of the product or brand; image of the country in addition to functional and aesthetic
attributes of the product or brand, thus creating beliefs and attitudes; and finally, comparisons with other
countries’ products, thus creating cognitive and affective behaviours (Bhaskaran & Sukumaran, 2007; Heslop &
Papadopoulos, 1993).
An individual’s image of a given country can affect his or her attitudes towards the same country. In other
words, in addition to being a cognitive cue of the quality of the product, the country of origin also evokes
emotions, identity, pride and memories. These symbols and emotions transform the country of origin into an
image attribute, which has been shown to be significant in the decision making regarding purchases and an
important source of brand equity (Verlegh & Steenkamp, 1999).
Some studies show strong evidence that country image changes over time and that beliefs about the country
of origin are indeed changeable as well (Verlegh, 2007). The influence of communication strategies on such
beliefs has been studied by Lotz and Hu (2001), who conclude that a negative country-of-origin image can be
more favourable when products are associated with a prestigious retail market, thus serving as an effective
marketing strategy tool.
For Nagashima (1977), negative beliefs about a country can also change through advertisements and
national campaigns to promote exports. Thus, countries with unfavourable images can change those images over
time, though it is necessary to invest in research that is focused on consumers and investors to improve the
production, logistics and tourism structures of those countries.
Conceptually, the most recent research on country of origin has gradually shifted from a mere assessment
of the product differences and preferences based on a country of origin premise to the analysis of a “more
complex construct”, that is, the country image that is currently accepted (Roth & Diamantopoulos, 2009). While
these conventional studies allow researchers to analyse whether consumers prefer products or brands of one
country over another, the focus on the image perceived by other countries allows these perceptions to be
analysed.
Recent attempts have been made to organise different conceptualisations of country image. For example,
Roth and Diamantopoulos (2009) have established three groups to define country image. The first definition
uses country image (CoI) as a construct involving general images created not only by those products

Int. Journal of Business Science and Applied Management / Business-and-Management.org
16
representing the country, but also by the country’s degree of economic development, the political maturity, the
culture and traditions, the level of technological advancement and the industrialisation (Allred, Chakraborty &
Miller, 1999; Roth & Diamantopoulos, 2009). The second group defines country image in terms of origin of
products, the so-called product-country image (PCI), while the third and last group exclusively defines the
product image (PI) of a country, as described by Nagashima (1970).
According to Roth and Diamantopoulos (2009), the inconsistencies in defining the country-image construct
have resulted in considerable confusion. Some authors define country image as “perceptions” (Han, 1989;
Nebenzahl, Jaffe & Usunier, 2003), while others suggest that it represents impressions or associations (Ittersum,
Candel & Meulenberg, 2003), and still others support the premise that country image is a stereotype (Verlegh &
Steenkamp, 1999) or schema (Askegaard & Ger, 1998). Finally, there are those who identify country image as
“beliefs” (Martin & Eroglu, 1993), i.e., a trait that represents one of the attitude components. This lack of
consensus seems to be the result of a lack of consensus about the country’s image itself (Poiesz, 1989).
Although none of the aforementioned definitions are incorrect (perceptions, stereotypes, schema, and
beliefs), Roth and Diamantopoulos (2009) believe that they are not broad enough to capture the entire scope of
the country-image construct. According to Roth and Diamantopoulos (2009), the theory of attitude is the only
concept in the literature that has no limitations and attempts to explain how country image is formed and how
consumers perceive it. For these authors, this concept can explain both favourable and unfavourable evaluations
about country image. Furthermore, attitude involves not only cognitive aspects but also affective (feelings and
emotions) and conative (behaviour) ones (Verlegh & Steenkamp, 1999).
Most studies on the factors determining country image are based on the country’s characteristics and on the
demographic differences between the countries analysed (Balabanis, Mueller & Melewar, 2002), indicating that
the country image formation is dependent on different antecedents (precursors or determinants), which have
been the focus of investigation of an increasing number of researchers (Balabanis, Mueller & Melewar, 2002;
Roth & Diamantopoulos, 2009; Pharr, 2005; Verlegh & Steenkamp, 1999). Among the antecedents contributing
to the country image formation, one can mention: the level of contact between countries, language similarity,
demographic factors, lifestyle, culture and personal values (Balabanis, Mueller & Melewar, 2002; Chao &
Rajendran, 1993).
With regard to consumers’ characteristics investigated in this research, the age group is related to
differences in the consumer receptiveness to foreign products (Shimp & Sharma, 1987). Interestingly, studies
based on age groups have reported significant results for younger consumers, who seem to be more receptive to
foreign products (Good & Huddleston, 1995). Wall, Heslop and Hofstra (1988) have found gender differences
in evaluations of foreign products, with men relying on technological development and political orientation to
form their opinions about the quality of the products made in another country, whereas women used different
criteria, such as geographical proximity and product specificity (e.g. clothes, shoes), to evaluate the countries.
Balabanis, Mueller and Melewar (2002) have also reported that women have a bias towards foreign products,
being more favourable to national products. On the other hand, Good and Huddleston (1995) found that women
tend to assess foreign products more favourably than men. Therefore, one can observe that despite the consensus
on the fact that consumer gender influences evaluations of the country-of-origin image, the results are indeed
conflicting. In addition to gender, Ahmed and D’Astous (1996) showed that young consumers and individuals
belonging to higher-income classes have more positive beliefs about foreign products.
3 SCALES TO MEASURE THE COUNTRY IMAGE AND ITS DIMENSIONS
Based on the review conducted by Roth and Diamantopoulos (2009), we see that the literature contains at
least thirty studies on ways of measuring country image and another forty studies using methods to measure a
product’s image. In one of the first reviews of the research on country of origin, Bilkey and Nes (1982)
criticised the large number of samples used in the USA, as approximately one-third of the studies used
developing or emergent nations as country of origin for products (Usunier, 2006).
Two-thirds of the scales developed to measure country image were also aimed at measuring product image,
with most scales using “global products” rather than specific categories. The reasons for this methodology are
related to the fact that images of specific products from a given country may not be generalised, thus limiting
the value of such research (Papadopoulos, 1986). Therefore, if the main objective of the research is to explore
general images of countries and their products, global product evaluations are more suitable for measuring the
image of products. If, on the other hand, the objective is to assess the impact of country image on both purchase
intention and evaluations of a product or brand, then researchers should ask about specific products or brands
(Roth & Diamantopoulos, 2009).
Some of the most important scales are presented herein, as they have been largely used in research and
demonstrate a better capacity to measure images within a multidimensional context. In one of the first studies on
country image, Nagashima (1970) evaluated attitudes towards foreign products by comparing those of Japanese
and American origins. Country image was evaluated using twenty questions that covered five dimensions: price
and value; service and engineering; advertising and reputation; design and style; and consumer profile.

Fernanda de Tavares Canto Guina and Janaina de Moura Engracia Giraldi
17
Nagashima (1970) considered the image of a country to consist of several associations with the country’s
products rather than the general image people have of the country itself. Nagashima’s analysis falls into the third
group of definitions suggested by Roth and Diamantopoulos (2009), that is, the image of a country is the result
of various associations with its products.
Han (1990) has sought to measure country image using five dimensions: technical advancement, prestige
value, workmanship, price, and serviceability. For Roth and Romeo (1992), four elements are considered when
assessing a country’s image: innovation, design, finishing, and prestige. Innovation refers to both the inclusion
of new technologies and a product’s technological advances. Design refers to a product’s appearance, style and
colour, and finishing refers to a product’s level of reliability, durability and quality. Finally, prestige refers to the
exclusivity, status and reputation of a product’s brand. These elements are related to aspects of products made in
a given country rather than to the general characteristics of a country.
One can find that the variables adopted by Han (1989) and Roth and Romeo (1992) to assess country image
are only related to the product’s attributes, that is, these variables are not correlated to the country’s attributes.
Therefore, this scale cannot detect any correlation between country-of-origin image and product image, which
suggests a one-dimensional concept based on the product’s quality, not including other important elements, as
observed in a multidimensional concept (Giraldi & Ikeda, 2009).
According to some authors, the concept of country image is not one-dimensional but rather
multidimensional. The focus is no longer the characteristics of the products but the country and those issues
related to its image, such as the country’s economy, history and international importance (Jaffe & Nebenzahl,
2001; Pisharodi & Parameswaran , 2002; Roth & Diamantopoulos, 2009). Since the 1990s, studies have
considered dimensions other than product-related images that impact a country’s image.
Martin and Eroglu (1993) measured country image using three dimensions: political, economic and
technological. Based on the items established by Martin and Eroglu (1993), Pappu, Quester and Cooksey (2007)
sought to investigate country image using two categories of products (television sets and automobiles) and their
dimensions (i.e., innovation, prestige and design) as well as the country-image dimensions (technological,
economic and political).
Pisharodi and Parameswaran (1992, 2002) also sought to measure country image in a multidimensional
manner by using three groups of country-related aspects with their own dimensions. The first group of items,
called “general country attributes” (GCA), is aimed at capturing the respondents’ attitudes towards a given
country. The second group, “general product attributes” (GPA), is aimed at identifying attitudes towards the
general characteristics of the products made in the country under study. The third group, “specific product
attributes” (SPA), identifies attitudes towards specific products.
By studying the Canada’s image and its products, Papadopoulos and Heslop (2000) presented a group of
variables utilised as mental models that are used by consumers to evaluate a country and its products. The
criteria used to evaluate a country were the following: level of country development (technological
development, total growth, level of education), feelings related to people (honesty, hostility, dedication to work)
and established narrow relationships with the country (intent to invest and purchase more products made in the
country). For the product evaluations, the variables used as criteria by the consumers included the following:
price, market presence, and responsibility.
In addition to the scales described above, the personification approach developed by Nebenzahl, Jaffe and
Usunier (2003) measures the image of a country as the origin of products. This scale contains 27 items and has
been tested in Canada, France, Israel, Mexico and the USA. The scale is based on specific questions (e.g.,
“People who buy products made in X are…”) and includes the evaluation of statements made according to an
agreement scale (e.g., “Products made in X have high quality…”). These statements involve evaluative
dimensions as well as the social-emotional dimensions that the consumers attach to the evaluated products.
Consequently, three major dimensions were obtained, representing different personality profiles that are
associated with individuals who buy foreign products, namely, “underdog”, “economic value seeker”, and
“quality and satisfaction seeker”.
More recently, D’Astous and Boujbel (2007) developed a scale to rank countries according to the
respondents’ personal characteristics. The authors listed relevant adjectives obtained from personality scales and
individual interviews with a sample of Canadian French-speaking adults. The authors identified six dimensions
of “country personality”: agreeableness, wickedness, snobbism, assiduousness, conformity and unobtrusiveness.
Int. Journal of Business Science and Applied Management / Business-and-Management.org
18
4 METHODOLOGY
Considering empirical studies samples to measure the country image, different types were used, including
students (Martin & Eroglu, 1993; Pereira, Hsu and Kundu, 2005; Brijs, 2006), housekeepers (Ittersum, Candel
& Meulenberg, 2003; Nebenzahl, Jaffe & Usunier, 2003), consumers (Pappu, Quester & Cooksey, 2007) and
business men (Kuhn, 1993). Concerning the method of sampling, the majority of the studies utilizes
convenience sample (Roth & Diamantopoulos, 2009).
In this regard, this research population consisted of a group of European consumers who were represented
by under-graduate students, post-graduate students and staff of five European institutions, including the
Business School of the University College in Dublin (Ireland); the IESEG School of Management in Paris
(France); the International Office of Sorbonne-Paris (France); the University of Münster Schools of
Management, Economics and Law in Münster (Germany); and the University of Kent Business School in
Canterbury (England). The ages of the participants ranged from 18 to 60 years.
Including all five institutions, the entire population included approximately 4,000 students and staff.
This group of individuals was defined for the study because they represent a segment of interest for
companies as potential buyers of foreign products. In addition, as shown by Verlegh and Steenkamp (1999), the
magnitude of the country-of-origin effect does not differ between studies using samples of students and those
using samples of consumers. However, the choice of this population may have brought some bias to the results
of the evaluation of Brazil's image, as the sample includes individuals with higher levels of education than the
general population. This element is one of the limitations of the research.
This research used a non-probabilistic sample and convenience criteria. As the elements of the sample were
not chosen randomly, it was not possible to objectively evaluate the sampling error (Churchill, 1991). Thus, it is
not possible to place limits on the accuracy of the estimates. In other words, no generalisations can be made of
the results obtained from this sample for the entire survey population, since the key characteristic of a sample
allowing generalization is its probabilistic versus non-probabilistic nature (Mazzocchi, 2008). Therefore, the t-
test to check the statistical significance of differences was not employed. However, the magnitude of differences
was evaluated by the coefficient of variation, which is a way to express the variability of the data from the
average (Anderson, Sweeney & Williams, 2010).
According to Roth and Diamantopoulos (2009), non-probability sampling techniques prevail among studies
on country image, and they are considered acceptable for theory testing purposes, as it is the case in this study
(the investigation of differences on the image of Brazil according to consumers’ age, gender, knowledge about
the country and country of residence).
The variables used in this study to measure Brazil’s image were adapted from a study by Pisharodi and
Parameswaran (2002). This scale was chosen, since it has good reports on both reliability and validity, which
according to Roth and Diamantopoulos (2009) is a critical problem in country image research. Moreover,
considering that the attitude theory perspective is the best way to conceptualize the country image construct
(Roth & Diamantopoulos, 2009), Pisharodi and Parameswaran’s (2002) proposal comprises cognitive, affective
and conative components of attitude.
The items of the scale proposed by Pisharodi and Parameswaran’s (2002) considered in this research are
the ones comprising the dimension “general country attributes” (GCA), which is aimed at capturing the general
attitudes towards a country, and the dimension “general product attributes” (GPA), which is aimed at identifying
general attitudes towards the products made in the country. The items evaluated in this research are presented in
Exhibit 1.

Fernanda de Tavares Canto Guina and Janaina de Moura Engracia Giraldi
19
Exhibit 1: General country attributes and general product attributes used to measure the image of Brazil.
Adapted from Parameswaran and Pisharodi (2002)
General country attributes
Brazil is friendly and internationally admired
Brazilian people are creative and artistically gifted
Brazilian people are well-educated
Brazilian people are hard working
Brazilian people reached high standard of living
Brazilian people have technical skills
Brazil is economically similar to my country
Brazil is politically similar to my country
Brazil is culturally similar to my country
Brazil plays a significant international role
Brazil is well known for producing mainly industrial products
General product attributes
Brazilian products are expensive
Brazilian products are luxury
Brazilian products have quality workmanship
Brazilian products are imitations
Brazilian products are sold in many countries
Brazilian products are not attractive
Brazilian products are heavily advertised overseas
Brazilian products need frequent repairs
Brazilian products have a wide range of models
Brazilian products are long-lasting
Brazilian products have a good value
Brazilian products are highly technological
Brazilian products are easily found
Brazilian products are prestigious
We used a seven-point Likert scale of agreement (1=strongly agree to 7=strongly disagree), and we sought
to reduce data relating to questions about Brazil's image and its products through exploratory factor analysis to
facilitate the identification of the key dimensions that compose Brazil’s image. New variables were created from
the observed composition of factors (mean values of the questions that compose them). Thus, it was possible to
identify those aspects of Brazil’s image that were evaluated more positively and those that were evaluated more
negatively, as well as to check for differences on the evaluations according to consumers’ age, gender,
knowledge about the country and country of residence.
5 RESULTS AND DISCUSSIONS
In total, 382 questionnaires were obtained during the months of September and October 2010, in the four
countries mentioned, but two were dropped due to outliers’ identification. According to Roth and
Diamantopoulos (2009), the average sample size of studies on country image is 338, which makes this study’s
sample consistent with the sort of sample sizes typically found in cross-sectional research. Questionnaires were
applied individually to under-graduation and post-graduation students as well as to the staff of the four
aforementioned European universities.
With regard to the sample obtained from the four countries, the mean age of the respondents was 24.4
years, with standard deviation of 6.4 years. The youngest respondent was 18 years old, whereas the oldest was
61. Of the total sample, 60% of the respondents were between 18 and 24 years old, whereas 40% were older,
which justifies the sample being spilt into two age groups. Table 1 lists the participation of each country in the
sample of respondents.

Int. Journal of Business Science and Applied Management / Business-and-Management.org
20
Table 1: Participation of each country in the total sample
Frequency Percentage
France 40 10
England 116 30.5
Germany 112 29.5
Ireland 114 30.0
Total 382 100.0
The level of knowledge about Brazil among the respondents was assessed by means of a 7-point itemized
scale, ranging from 1 (“I know a lot”) to 7 (“I know nothing”). The mean score was 5.0, with standard deviation
of 1.4, which indicates in general a relatively poor knowledge of Brazil among respondents. Respondents
scoring less than 4 were considered as having good knowledge about Brazil, whereas those scoring more than 4
were considered as knowing little about the country for group comparisons.
It is observed that for the analysis, the variables "Brazilian products are not attractive”, "Brazilian products
need frequent repairs" and "Brazilian products are imitations" were recoded because they are sentences with
negative connotations and should thus have their valences reversed. Accordingly, all of the questions had the
same valence as part of a consistent procedure scoring.
Regarding the critical assumptions necessary for running a factor analysis, the Bartlett's sphericity test was
performed, which confirmed the suitability of the technique. In addition, to measure the fit of the data to factor
analysis, we employed the Kaiser-Meyer-Olkin (KMO) test, with a value obtained of 0,816. This result can be
considered excellent, according to Hair et al. (2005). Furthermore, the commonalities of the variables were
evaluated, and those less than 0.5 were excluded (“Brazilian products are expensive” and “Brazilian products
are luxury”).
The choice of the number of factors to be retained was made by analysing the eigenvalues. We obtained
seven factors with eigenvalues greater than 1, thus explaining, together, 61.045% of the total variance.
Following the suggestion of Hair et al. (2005), we rotated the factors using the VARIMAX method, which is the
most commonly used method for this type of analysis (Malhotra, 1996). Table 2 shows the factor loadings
obtained.
Table 2: Rotated component matrix, name of the variables and Cronbach’s alphas coefficient
Factor name Cronbach’s
alpha
Statements Factor loads
Factor 1- Face of the Brazilian
People
0.749 Brazilian people are hard working 0.769
Brazilian people are well-educated 0.732
Brazilian people have technical skills 0.679
Brazilian people reached high standard of living 0.644
Factor 2 - General Image of the
Brazilian products
0.707 Brazilian products are long-lasting 0.801
Brazilian products have a good value 0.731
Brazilian products have a wide range of models 0. 601
Factor3 - Communication,
Distribution and Differentiation of
Brazilian Products
0.728 Brazilian products are easily found 0.740
Brazilian products are prestigious 0.668
Brazil is well known for producing mainly
industrial products
0.618
Brazilian products are highly technological 0.523
Brazilian products are heavily advertised overseas 0.515
Factor 4 - Perceived Similarity 0.720 Brazil is politically similar to my country 0.791
Brazil is economically similar to my country 0.770
Brazil is culturally similar to my country 0.639
Factor 5 - Internationalisation of
Brazil
0.507 Brazilian products are sold in many countries
Brazil plays a significant international role
0.688
0.680
Factor 6 - Beliefs about Brazilian
Arts and Sympathy for Brazil
0.697 Brazilian people are creative and artistically gifted
Brazil is friendly and internationally admired
0.864
0.843
Factor 7- Negative Aspects of
Brazilian Products
0.429 Brazilian products are imitations
Brazilian products need frequent repair
Brazilian products are not attractive
0.723
0.721
0.488

Fernanda de Tavares Canto Guina and Janaina de Moura Engracia Giraldi
21
Once the rotated solution with seven factors was obtained, the factors were interpreted. According to Hair
et al. (2005), it is necessary to verify the practical significance of the factors found. The authors determined that
the factors that have factor loadings close to .50 are considered to be significant and must be retained. Virtually
all of the factor loadings from the analysis have values greater than 0.50, except for the factor loading on the
correlation between the variable “The Brazilian products have quality workmanship” (0.465) and factor 5.
Therefore, this variable was deleted from the analysis.
Moreover, variables cross-loadings in different dimensions were analysed. Two cases were detected:
“Brazilian products are highly technological”, cross-loading more intensely in Factor 2 (0.444) and Factor 3
(0.523); and “Brazilian products are not attractive”, cross-loading more intensely in Factor 5 (0.482) and Factor
7 (0.488). In the first case, the variable was kept in Factor 3, since the load was higher than 0.5 and, in the
second case, the whole Factor 7 was withdrawn from the analysis, as explained next.
The second step of the process of factor interpretation involves reliability analysis of the results found,
which is a measure of the consistency between the multiple measurements of a variable (Hair et al., 2005).
Internal consistency is a common method of measuring reliability based on the rationale that individual items of
a scale should measure the same construct and, therefore, be highly correlated. Internal consistency was
assessed using Cronbach’s alpha coefficient. According to Hair et al. (2005), the lower limit for Cronbach’s
alpha is 0.070, although 0.60 is acceptable in exploratory research.
Factor 1, which contained variables that describe the Brazilian people in terms of quality of life, education,
work and technical skills, had a Cronbach’s alpha of 0.749, which is considered to be satisfactory. Therefore,
Factor 1 was termed “Face of the Brazilian People”.
Factor 2 had a Cronbach’s alpha of 0.707, thus ensuring its reliability. This factor, consisting of variables
related to evaluations of Brazilian products in terms of model variety, durability, and price, was termed “General
Image of the Brazilian products”.
Factor 3 had a Cronbach’s alpha of 0.728, showing good reliability. This factor consisted of variables
related to access to Brazilian products (if they are easily found), differentiation (if they are highly technological
and prestigious) and communication (if they are heavily advertised internationally). In addition, Factor 3 also
includes the variable “Brazil is well known for producing mainly industrial products” and “Brazilian products
are highly technological”. Therefore, Factor 3 was termed “Communication, Distribution and Differentiation of
Brazilian Products”.
Factor 4 also had a satisfactory Cronbach’s alpha of 0.720. This factor consisted of variables related to the
cultural, economic and political similarities perceived by the respondents between their countries and Brazil.
Therefore, this factor was termed “Perceived Similarity”.
Factor 5 was termed “Internationalisation of Brazil” as it consisted of variables such as “Brazil plays a
significant international role" and “Brazilian products are sold in several countries”. Cronbach’s alpha showed
internal consistency of 0.507, indicating that this factor was not acceptable. In fact, according to Cortina (1993),
the value of Cronbach’s alpha decreases as the number of variables in a factor decreases, as its calculation is
directly proportional to this number (N). Since Factor 5 only has two variables and a low Cronbach’s alpha, it
was decided to drop it from the analysis.
Factor 6, termed “Beliefs about Brazilian Arts and Sympathy for Brazil”, consisted of variables such as
“Brazil is friendly and internationally admired” and “Brazilian people are creative and artistically gifted”. This
might be an indication that Brazilian arts are admired in external markets. The reliability coefficient for this
factor was 0.697, which is very close to the acceptable level. Finally, factor 7 was termed “Negative Aspects of
Brazilian Products”. Because its reliability coefficient was 0.429, this factor was unacceptable for the analysis.
In their study, Parameswaran and Pisharodi (1992) found only two dimensions (factors) related to variables
aimed at measuring country image through the method of structural equations analysis: “People Facet” and
“Perceived Similarity”. In the present study, one additional reliable factor was found that related to Brazilian
image, namely, “Beliefs about Arts and Sympathy for Brazil”.
Parameswaran and Pisharodi (2002) found three factors resulting from variables used to measure product
image. The first factor involves the image of the product itself (e.g., price, durability, variety), the second factor
involves the distribution and marketing of the product (e.g., heavily advertised, easily found), and the third
factor involves negative aspects of the product (e.g., imitations, lack of attractiveness, constant repairs). Similar
factors were found in the current study. Overall, there was a certain similarity between the five image
dimensions for Brazil found here and those observed by Parameswaran and Pisharodi (2002).
New variables were created from the factors composition (mean answer values of related questions). To
identify which dimension was better assessed by the respondents, the factor composition was calculated to rank
the factors obtained. To be considered well evaluated, the dimensions that compose Brazil’s image must obtain
average scores below 4 (i.e., closer to "totally agree"). Negative assessments are represented by average scores
above 4 (i.e., closer to "strongly disagree"). Average scores close to 4 are considered to be neutral assessments.
The scores are presented in Table 3, and the analysis is complemented by the coefficients of variation (CV) of
each variable.
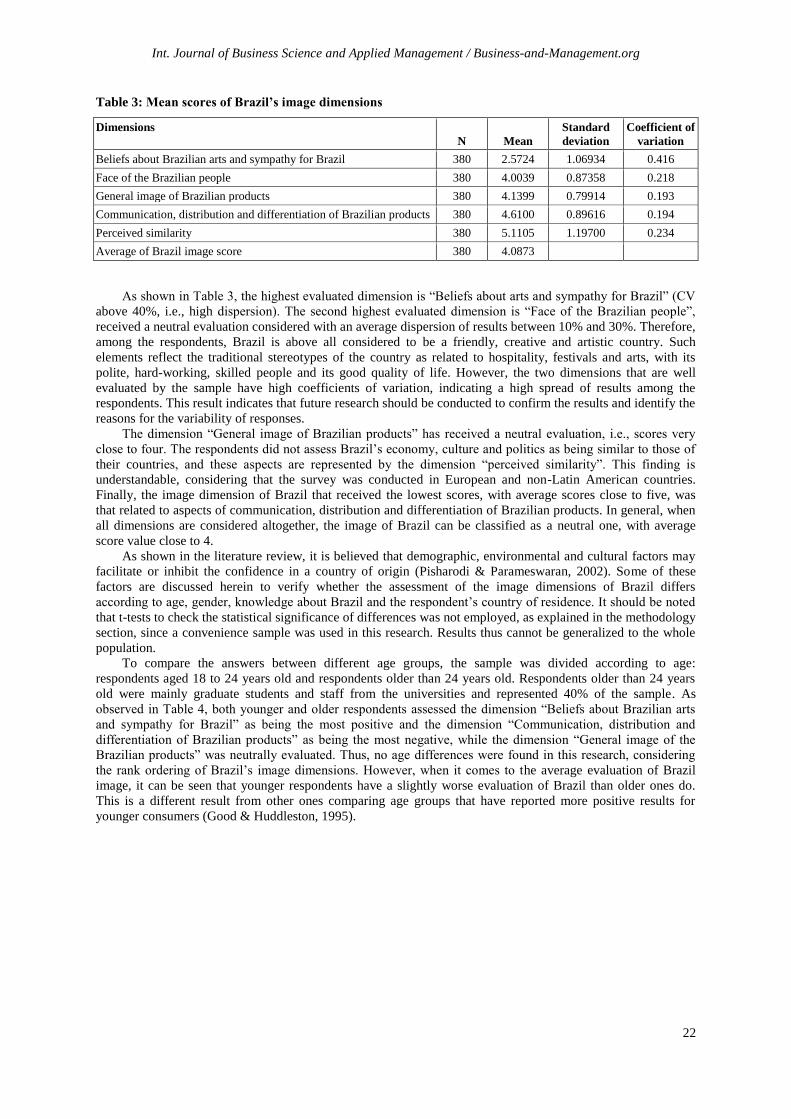
Int. Journal of Business Science and Applied Management / Business-and-Management.org
22
Table 3: Mean scores of Brazil’s image dimensions
Dimensions
N Mean
Standard
deviation
Coefficient of
variation
Beliefs about Brazilian arts and sympathy for Brazil 380 2.5724 1.06934 0.416
Face of the Brazilian people 380 4.0039 0.87358 0.218
General image of Brazilian products 380 4.1399 0.79914 0.193
Communication, distribution and differentiation of Brazilian products 380 4.6100 0.89616 0.194
Perceived similarity 380 5.1105 1.19700 0.234
Average of Brazil image score 380 4.0873
As shown in Table 3, the highest evaluated dimension is “Beliefs about arts and sympathy for Brazil” (CV
above 40%, i.e., high dispersion). The second highest evaluated dimension is “Face of the Brazilian people”,
received a neutral evaluation considered with an average dispersion of results between 10% and 30%. Therefore,
among the respondents, Brazil is above all considered to be a friendly, creative and artistic country. Such
elements reflect the traditional stereotypes of the country as related to hospitality, festivals and arts, with its
polite, hard-working, skilled people and its good quality of life. However, the two dimensions that are well
evaluated by the sample have high coefficients of variation, indicating a high spread of results among the
respondents. This result indicates that future research should be conducted to confirm the results and identify the
reasons for the variability of responses.
The dimension “General image of Brazilian products” has received a neutral evaluation, i.e., scores very
close to four. The respondents did not assess Brazil’s economy, culture and politics as being similar to those of
their countries, and these aspects are represented by the dimension “perceived similarity”. This finding is
understandable, considering that the survey was conducted in European and non-Latin American countries.
Finally, the image dimension of Brazil that received the lowest scores, with average scores close to five, was
that related to aspects of communication, distribution and differentiation of Brazilian products. In general, when
all dimensions are considered altogether, the image of Brazil can be classified as a neutral one, with average
score value close to 4.
As shown in the literature review, it is believed that demographic, environmental and cultural factors may
facilitate or inhibit the confidence in a country of origin (Pisharodi & Parameswaran, 2002). Some of these
factors are discussed herein to verify whether the assessment of the image dimensions of Brazil differs
according to age, gender, knowledge about Brazil and the respondent’s country of residence. It should be noted
that t-tests to check the statistical significance of differences was not employed, as explained in the methodology
section, since a convenience sample was used in this research. Results thus cannot be generalized to the whole
population.
To compare the answers between different age groups, the sample was divided according to age:
respondents aged 18 to 24 years old and respondents older than 24 years old. Respondents older than 24 years
old were mainly graduate students and staff from the universities and represented 40% of the sample. As
observed in Table 4, both younger and older respondents assessed the dimension “Beliefs about Brazilian arts
and sympathy for Brazil” as being the most positive and the dimension “Communication, distribution and
differentiation of Brazilian products” as being the most negative, while the dimension “General image of the
Brazilian products” was neutrally evaluated. Thus, no age differences were found in this research, considering
the rank ordering of Brazil’s image dimensions. However, when it comes to the average evaluation of Brazil
image, it can be seen that younger respondents have a slightly worse evaluation of Brazil than older ones do.
This is a different result from other ones comparing age groups that have reported more positive results for
younger consumers (Good & Huddleston, 1995).

Fernanda de Tavares Canto Guina and Janaina de Moura Engracia Giraldi
23
Table 4: Mean scores of Brazil’s image dimensions, according to age groups
Aged 18 to 24 years
N Mean
Standard
deviation
Coefficient
of variation
Beliefs about Brazilian arts and sympathy for Brazil 231 2.5411 1.04254 0.410
Face of the Brazilian people 231 4.0465 0.84427 0.209
General image of Brazilian products 231 4.1775 0.81353 0.195
Communication, distribution and differentiation of Brazilian
products
231 4.6221 0.89129
0.193
Perceived similarity 231 5.1609 1.17532 0.228
Average of Brazil image score (aged 18 to 24 years) 231 4.1096
Older than 24 years
Beliefs about Brazilian arts and sympathy for Brazil 149 2.6208 1.11144 0.424
Face of the Brazilian people 149 3.9379 0.91614 0.233
General image of Brazilian products 149 4.0817 0.77540 0.190
Communication, distribution and differentiation of Brazilian
products
149 4.5913 0.90635
0.197
Perceived similarity 149 5.0324 1.22978 0.244
Average of Brazil image score (older than 24 years) 149 4.0528
When comparing the evaluations performed by men and women, it can be seen that no difference in the
rank ordering of image dimensions were detected, as shown in Table 5. Nonetheless, men have a slightly better
general image of Brazil than women do, as it can be seen from the average score of Brazil image. In the
literature review, it was seen that, although there is a consensus that consumer gender influences evaluations of
a country’s image, results are conflicting. Nonetheless, the results of this research are more in accordance with
Balabanis, Mueller and Melewar’s (2002), who have also reported that women have a worse image of foreign
products. Wall, Heslop and Hofstra (1988) have also observed gender differences in evaluations of foreign
products. The authors found that men rely on technological development and political orientation to form their
opinions about the quality of products made in another country, whereas women use different criteria, such as
geographical proximity and product specificity (e.g., clothes, shoes), to rank the countries. It was also found here that older individuals (over 24 years of age) and males rated Brazil’s economy,
politics and culture as being more similar to their own countries than did younger and female subjects, having a
better general image of Brazil. Results are in accordance with Han’s (1989), for whom the country evaluation
can differ depending on how consumers perceive similarities (or lack of) between their own country and others
in terms of culture, economy and political systems.
Table 5: Mean scores of Brazil’s image dimensions, according to gender
Male
N Mean
Standard
deviation
Coefficient of
variation
Beliefs about Brazilian arts and sympathy for Brazil 188 2.5146 1.11988 0.445
Face of the Brazilian people 188 4.0492 0.89876 0.222
General image of Brazilian products 188 4.0709 0.77673 0.191
Communication, distribution and differentiation of Brazilian
products
188 4.5915 0.87333 0.190
Perceived similarity 188 5.0718 0.19855 0.236
Average of Brazil image score (male) 188 4.0596
Female
Beliefs about Brazilian arts and sympathy for Brazil 192 2.6289 0.01719 0.387
Face of the Brazilian people 192 3.9596 0.84820 0.214
General image of Brazilian products 192 4.2075 0.81687 0.194
Communication, distribution and differentiation of Brazilian
products
192 4.6281 0.91989 0.199
Perceived similarity 192 5.1484 1.19741 0.233
Average of Brazil image score (female) 192 4.1145

Int. Journal of Business Science and Applied Management / Business-and-Management.org
24
Table 6 shows the mean values for each dimension and the coefficients of variation according to the level
of knowledge respondents have about Brazil. Respondents with a high level of knowledge about Brazil assessed
all of the dimensions more positively compared to respondents with a lack of knowledge about Brazil, as well as
the general image of Brazil (represented by the mean score lower than 4). The high-knowledge respondents also
regarded Brazil’s culture, economy, and political systems as being more similar to those of their own countries
than did the low-knowledge respondents. However, there is a high variability in the results of the two high rated
dimensions, which also occurred in the previous comparative analysis. Respondents with greater knowledge about Brazil neutrally evaluated the dimension “Communication,
distribution and differentiation of Brazilian products”, i.e., they provided a more positive assessment of this
dimension than individuals with less knowledge. Those who had little knowledge about Brazil negatively
evaluated the “Overall image of Brazilian products” and the “Communication, distribution and differentiation of
Brazilian products” dimensions, the latter being the most poorly evaluated dimension.
The dimension “Perceived similarity” received the worst average score among the group of respondents
with little knowledge about Brazil, when compared to all other groups. These results may be indicative of the
need to invest in improving aspects related to tourism in and communications about Brazil and its products to
reduce the negative stereotypes, since people that show good levels of knowledge tend to have a better
evaluation of Brazil and Brazilian products.
Table 6: Mean scores of Brazil’s image dimensions, according to level of knowledge
Good knowledge about Brazil
N Mean
Standard
deviation
Coefficient of
variation
Beliefs about Brazilian arts and sympathy for Brazil 144 2.4479 1.09188 0.446
Face of the Brazilian people 144 3.8701 0.96054 0.248
General image of Brazilian products 144 3.9483 0.85932 0.218
Communication, distribution and differentiation of Brazilian
products
144 4.3730 0.98001
0.224
Perceived similarity 144 4.6551 1.37616 0.296
Average of Brazil image score (good knowledge) 144 3.8589
Poor knowledge about Brazil
Beliefs about Brazilian arts and sympathy for Brazil 236 2.6483 1.05045 0.397
Face of the Brazilian people 236 4.0856 0.80725 0.198
General image of Brazilian products 236 4.2568 0.73782 0.173
Communication, distribution and differentiation of Brazilian
products
236 4.7546 0.80956
0.170
Perceived similarity 236 5.3884 0.97660 0.181
Average of Brazil image score (poor knowledge) 236 4.2267
Table 7 presents the mean scores for each country that participated in the study. Based on these results, we
conclude that French respondents positively assessed the dimensions “Beliefs about Brazilian arts and sympathy
for Brazil” and “Face of the Brazilian people”, whereas the dimension “Communication, distribution and
differentiation of Brazilian products” received the most negative evaluation. French respondents gave the best
overall evaluation of Brazil’s image, as it can be seen from the average image score.
Among the participants from England, the most positively evaluated dimensions were also “Beliefs about
Brazilian arts and sympathy for Brazil” and “Face of the Brazilian people”. Considering the mean scores
obtained from both the French and English respondents, there is little perceived similarity between Brazil’s
culture, economy and political systems and those of France and England. The degree of perceived similarity was
even lower among the Irish and German respondents.
Similarly to the other groups of respondents, Irish respondents positively evaluated the dimensions “Beliefs
about Brazilian arts and sympathy for Brazil” and “Face of the Brazilian people” and negatively evaluated the
dimension “Communication, distribution and differentiation of Brazilian products”. The assessment of the
dimension “General image of Brazilian products” can be considered neutral. It can be said that respondents from
England and from Ireland had very similar overall ratings of Brazil (as shown in the average image score).
Among the German respondents, the most positively evaluated dimensions was “Beliefs about Brazilian
arts and sympathy for Brazil”, whereas the worst evaluation was given to the dimension “Communication,
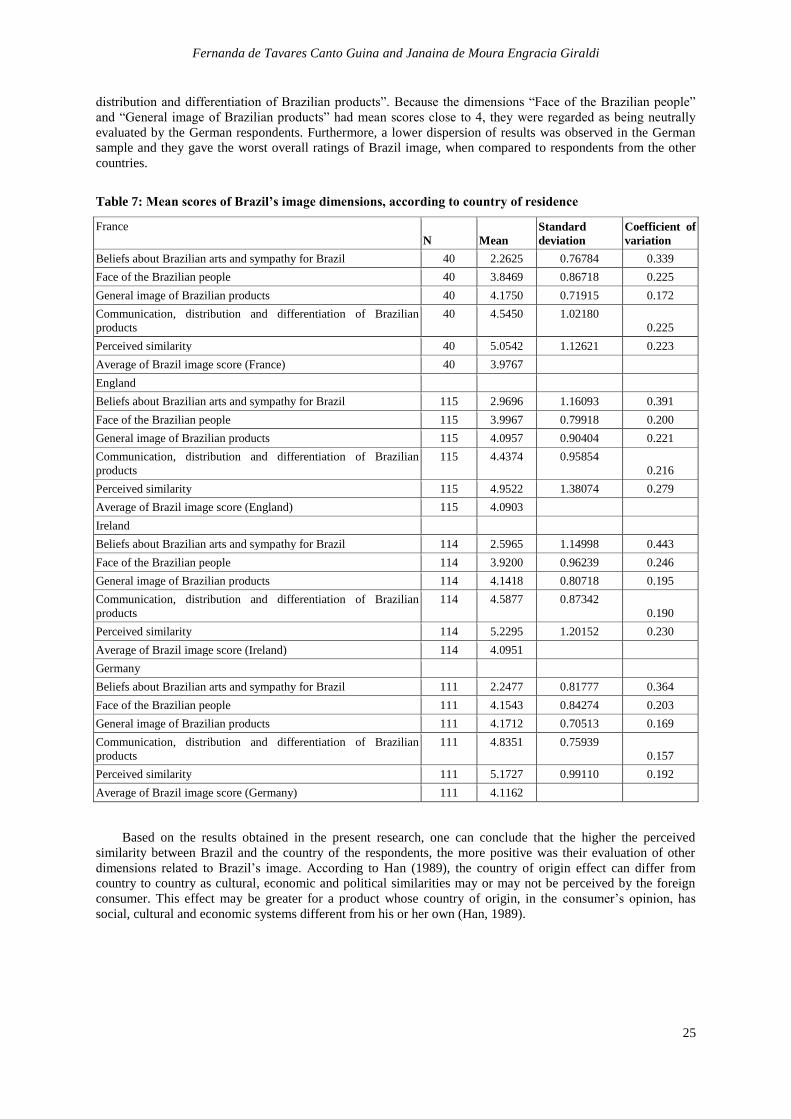
Fernanda de Tavares Canto Guina and Janaina de Moura Engracia Giraldi
25
distribution and differentiation of Brazilian products”. Because the dimensions “Face of the Brazilian people”
and “General image of Brazilian products” had mean scores close to 4, they were regarded as being neutrally
evaluated by the German respondents. Furthermore, a lower dispersion of results was observed in the German
sample and they gave the worst overall ratings of Brazil image, when compared to respondents from the other
countries.
Table 7: Mean scores of Brazil’s image dimensions, according to country of residence
France
N Mean
Standard
deviation
Coefficient of
variation
Beliefs about Brazilian arts and sympathy for Brazil 40 2.2625 0.76784 0.339
Face of the Brazilian people 40 3.8469 0.86718 0.225
General image of Brazilian products 40 4.1750 0.71915 0.172
Communication, distribution and differentiation of Brazilian
products
40 4.5450 1.02180
0.225
Perceived similarity 40 5.0542 1.12621 0.223
Average of Brazil image score (France) 40 3.9767
England
Beliefs about Brazilian arts and sympathy for Brazil 115 2.9696 1.16093 0.391
Face of the Brazilian people 115 3.9967 0.79918 0.200
General image of Brazilian products 115 4.0957 0.90404 0.221
Communication, distribution and differentiation of Brazilian
products
115 4.4374 0.95854
0.216
Perceived similarity 115 4.9522 1.38074 0.279
Average of Brazil image score (England) 115 4.0903
Ireland
Beliefs about Brazilian arts and sympathy for Brazil 114 2.5965 1.14998 0.443
Face of the Brazilian people 114 3.9200 0.96239 0.246
General image of Brazilian products 114 4.1418 0.80718 0.195
Communication, distribution and differentiation of Brazilian
products
114 4.5877 0.87342
0.190
Perceived similarity 114 5.2295 1.20152 0.230
Average of Brazil image score (Ireland) 114 4.0951
Germany
Beliefs about Brazilian arts and sympathy for Brazil 111 2.2477 0.81777 0.364
Face of the Brazilian people 111 4.1543 0.84274 0.203
General image of Brazilian products 111 4.1712 0.70513 0.169
Communication, distribution and differentiation of Brazilian
products
111 4.8351 0.75939
0.157
Perceived similarity 111 5.1727 0.99110 0.192
Average of Brazil image score (Germany) 111 4.1162
Based on the results obtained in the present research, one can conclude that the higher the perceived
similarity between Brazil and the country of the respondents, the more positive was their evaluation of other
dimensions related to Brazil’s image. According to Han (1989), the country of origin effect can differ from
country to country as cultural, economic and political similarities may or may not be perceived by the foreign
consumer. This effect may be greater for a product whose country of origin, in the consumer’s opinion, has
social, cultural and economic systems different from his or her own (Han, 1989).

Int. Journal of Business Science and Applied Management / Business-and-Management.org
26
6 CONCLUSIONS
This paper has shown that the consumers’ perceptions can change based on their socio-demographic or
cultural characteristics, by checking for differences on Brazil image according to some consumers’
characteristics. Using a quantitative survey, this study concluded that beliefs about countries may differ
according to the degree of perceived similarity with a given country and to certain demographic issues, such as
country of residence, knowledge about Brazil, gender and age. Respondents that had better evaluations on
Brazil’s image were: young, men, with a high level of knowledge about Brazil and from France. With these
results, it can be said that two important gaps in the literature on country image were addressed: discrepant
results on the influence of socio-demographic characteristics on the image of a country and few studies on the
image of Brazil.
It was also concluded that aspects related to communication, distribution and differentiation of Brazilian
products were those that received the worst evaluation by consumers participating in the survey, which indicates
the need for greater investments from both the Brazilian government and the private sector in communicating
and promoting Brazilian products abroad. In these communication campaigns, it seems important to emphasise
issues related to the arts, festivities and friendliness of the Brazilian people, which were dimensions that were
rated positively by respondents from all of the countries where the survey was conducted.
Considering other practical implications of the results, Brazilian public managers could launch campaigns
aimed to minimise the negative image of the country overseas, thus increasing the likelihood that the products
will be consumed worldwide with higher aggregate value. Projects should be also implemented to improve
airport, port and road infrastructures for export logistics, in addition to offering higher fiscal incentives to
exporters.
Regarding the methodological limitations of this research, we highlight the defined target population for
this study, which does not cover other important markets with which Brazil maintains trade relations, such as
other European and Asian countries, the United States, or even other European consumer segments, such as
professionals and affluent consumers. Moreover, the interviewees were most likely more educated than the
general population; thus, the assessments of the country and product choices in general could have been based
on aspects other than those made by less educated individuals. For example, choices and evaluations made by
more educated individuals may be more rational and less based on stereotypes. Therefore, the fact that we have
used a sample of undergraduate students, post graduate students and faculty members can be considered a
limitation of this research, since they may not represent the opinions of all European consumers or even of
consumers from the countries analysed.
Furthermore, it is stressed that the questionnaire did not cover questions related to respondents’ willingness
to pay a premium price for Brazilian products, or even their intention to buy and to recommend Brazilian
products, what could have allowed for different analysis (such as the relation between a country’s image and the
willingness to pay a premium price).
Future studies could apply different scales to evaluate Brazil’s image in other countries, using samples of
individuals with various educational levels to deepen the discussions and conclusions presented here.
Additionally, future research may help to identify the reasons for the high variability in some of the results.
REFERENCES
Ahmed, S. & D'Astous, A. (1996). Country of origin and brand effects: a multi-dimensional and multi-attribute
study. Journal of International Consumer Marketing, v. 9, n. 2, p. 93 115.
Anderson, David R., Sweeney, Dennis J. & Williams, Thomas A. (2010). Statistics for Business and Economics.
South-Western College.
Balabanis G., Mueller R. & Melewar T. C. (2002). The human values’ lenses of country of origin images.
International Marketing Review, v19, n6, p.582-610.
Bhaskaran S. & Sukumaran N. (2007). Contextual and methodological issues in COO studies. Marketing
Intelligence & Planning, v.25, n1,p. 66-81. doi: 10.1108/02634500710722407
Bilkey, W. J. & Nes, E. (1982). Country-of-origin effects on product evaluations, Journal of International
Business Studies, Spring/Summer, p.89-99.
Brijs, K. (2006). Unravelling country-of-origin: Semiotics as a theoretical basis for a meaning-centred approach
towards country-of-origin effects.2006. 398f. PhD Dissertation, Nijmegen, the Netherlands: Radboud
Universiteit Nijmegen.
Child I. L. & Doob, L. W. (1943). Factors determining national stereotypes. Journal of Social
Psychology,17:203–19.
Fernanda de Tavares Canto Guina and Janaina de Moura Engracia Giraldi
27
Chao, P. & Rajendran, K. (1993). Consumer profiles and perceptions: country of origin effects. International
Marketing Review, v.10, n. 2, p. 22-39.
Cortina, J. (1993). What is Coefficient Alpha? An Examination of Theory and Applications. Journal of Applied
Psychology. v.78 n. 1, p 98-104.
Churchill, G. A. (1991). Marketing research: methodological foundations. Fort Worth: The Dryden Press.
D´Astous A. & Boujbel L. (2007). Positioning countries on personality dimensions: scale development and
implications for country marketing. Journal of Business Research, v.60 pp. 231-239.
D'Astous, A. & Lévesque, M. (2003). A Scale for Measuring Store Personality. Psychology & Marketing, v.20,
n.5, pp. 455-469.
Giraldi, J. M. E. & Carvalho, Dirceu Tornavoi de. (2006). A influência da imagem do Brasil nas atitudes com
relação a produtos brasileiros: uma investigação empírica do efeito país de origem. Revista Eletrônica de
Administração, v. 12, p. 4.
Giraldi, J. M. E. & Ikeda, Ana Akemi (2009). Personal values and the 'country-of-origin effect': the moderating
role of consumers' demographics. International Journal of Consumer Studies, v. 33, p. 309-315.
Good, L. K. & Huddleston, P. (1995). Ethnocentrism of Polish and Russian consumers: are feelings and
intentions related? International Marketing Review, Vol. 12, No. 5, pp. 35-48.
Hair, J. F., Anderson, R. E., Tatham, R. L. & Black, W. C. (2005). Análise Multivariada de Dados. 5. ed. Porto
Alegre: Bookman.
Han, M. (1989). Country Image: Halo or Summary Construct? Journal of Marketing Research, Chicago. v26,
n2. p222-229.
Han, M. (1990). Testing the Role of Country Image in Consumer Choice Behaviour. European Journal of
Marketing, v.24, n 6 p 24- 36.
Ittersum K., Candel M. & Meulenberg M. (2003). The influence of the image of a product's region of origin on
product evaluation. Journal of Business Research, New York, v.56, n.3, p.215–26.
Jaffe, E.D & Nebenzahl I. D. (2001). National Image and Competitive Advantage: the theory and practice of
country of origin effect. Copenhagen: Copenhagen Business School Press.
Johansson, J. K., Douglas, S. P. & Nonaka, I. (1985). Assessing the impact of country of origin on product
evaluations: a new methodological perspective, Journal of Marketing Research, Vol. 22, No. 4, pp. 388-
396.
Katz D. & Braly, K. (1933). Racial stereotypes of one hundred college students. Journal of Abnorm Soc
Psychol; 28:280–90.
Klingberg, F. L. (1941). Studies in measurement of the relationship among sovereign states. Psychometrica;
6:335–52.
Kühn R. Das (1993). “Made-in-Image” Deutschlands im internationalen Vergleich. Marketing ZFP; v. 15, n 2,
p. 119–27.
Martin, I. M.& Eroglu, S. (1993). Measuring a multi-dimensional construct: country image. Journal of Business
Research, v. 28, Iss. 3, p. 191-210.
Mazzocchi, M. (2008). Statistics for Marketing and Consumer Research. London, UK: Sage Publications.
Nagashima, A. (1970). A comparison of Japonese and U.S. attitudes towards foreign products. Journal of
Marketing, v. 34, p.68-74.
Nebenzahl, I. D., Jaffe, D. & Usunier, J. C. (2003). Personifying country of origin research. Management
International Review. Wiesbaden, v. 43, n. 4, p. 383-406.
Papadopoulos, N. (1993). What product and country images are and are not. In: Papadopoulos, N; Heslop, L. A
product country images: impact and role in international marketing. London: Haworth Press. p.3-38.
Papadopoulos, N. & Heslop, L. (2002). Country equity and country branding: problems and prospects. Journal
of Brand Management, v.9, ISS. 4/5, p 294-314.
Pappu, R., Quester. P. & Cooksey R. (2007). Country image and consumer based brand equity: relationships
and implications for international marketing. Journal of International Business Studies, v. 38, pp 726-745.
Pereira A., Hsu C.-C. & Kundu S.K. (2005). Country-of-Origin Image: Measurement and Cross-national
Testing. Journal of Business Research, New York, v. 58, n.1, 103-6.
Pisharodi, M. & Parmeswan, R. (1992). Confirmatory factor of a country origin scale: initial results. In: John
Sherry and Brian Sternthal (Eds), Sterntahl Advances in consumer Research. vol.19, pp706-714. Provo, UT
Association for Consumer Research.

Int. Journal of Business Science and Applied Management / Business-and-Management.org
28
Pisharodi, Mohan R & Parameswaran, Ravi. (2002). Assimilation effects in country image reseach. Intemational
Marketing Review, n.19, v.2/3, p. 259-261.
Poiesz, T. B. C. (1989). The image concept: its place in consumer psychology. Journal of Economic
Psychology, 10(4), 457-472.
Prieur, Michel. (2001). Droit de l´environnement. 4. ed. s.l. Dalloz,. Roth, M.S. & Romeo, J. B. (1992). Matching product category and country image perceptions: a framework for
managing Country-of-Origin Effects. Journal of International Business Studies, Third Quarter: 447-497.
Roth, M.S. & Diamantopoulos, A. (2009). Advancing the country image construct. Journal of Business
Research, v.62, pp 726-740.
Shimp, T.A & Sharma, S. (1987). Consumer ethnocentrism: construction and validation of the CETSCALE.
Journal of Marketing Research, v.24, n.3, pp.280-290.
The World Bank (2012). Retrieved from http://data.worldbank.org/country/brazil.
Usunier, Jean-Claude (2006). Relevance in business research: the case of country-of-origin research in
marketing. European Management Review, v.3, pp. 60–73.
Wall M., Heslop L. & Hofstra G. (1988). Male and Female Viewpoints of Countries as Producers of Consumer
Goods. Journal of International Consumer Marketing, v.1, n1, p.1-26.

Int. Journal of Business Science and Applied Management, Volume 7, Issue 2, 2012
Computer-mediated group communication and ideation
performance
Leif Jarle Gressgård
International Research Institute of Stavanger
Thormøhlensgt. 55, 5008 Bergen, Norway
Telephone: + 47 97061318
Email: [email protected]
Abstract
Computer-based group idea generation is used in a variety of organizational settings to generate ideas that are
helpful in attaining a goal. In such situations, the characteristics of the interaction may impact on the group
processes, and accordingly on group performance. This paper reports on a study investigating the impacts of
synchronicity, parallelism and identification on ideation performance. The results show that both parallelism and
synchronicity are important for ideation performance, but that the levels of these affordances have no impacts
when it comes to generation of low quality ideas. However, as the quality criteria are sharpened, the importance
of the affordances increases. The results thus show that high degrees of parallelism and synchronicity are
important for generation of high-quality ideas in computer-mediated group work. The results also point to the
importance of adopting rigorous measures when investigating group ideation performance. Implications for
research and practice are discussed.
Keywords: ideation, computer-mediated communication, electronic brainstorming, virtual groups, idea quality

Int. Journal of Business Science and Applied Management / Business-and-Management.org
30
1 INTRODUCTION
New organizational forms and work arrangements are evolving as the increase in use of information and
communication technologies (ICT) renders possible real-time data sharing and comprehensive interaction across
geographical and organizational boundaries. In order to create successful new products and services in
competitive and global markets, new product development groups whose members interact by use of ICT (i.e.
virtual groups), are increasingly being assembled both within and between organizations (Jung, Schneider, &
Valacich, 2010). Such groups consist of members who are formally assigned and work towards achieving a
specific goal, and thus differ from networks and communities of practice.
Producing creative solutions to problems is an important task for virtual groups in the workplace (DeRosa,
Smith, & Hantula, 2007). That is, the quality of the ideas the virtual group produces is fundamental (Girotra,
Terwiesch, & Ulrich, 2010), and the objective of this study is to investigate the effects of communication
characteristics on ideation performance of virtual groups. This field of research has received substantial
attention the last decades, but research within this domain has been conducted based on a widely accepted belief
that there is a positive relationship between the quantity and the quality of ideas that are put forth in group work.
Recent research has been questioning this view (Briggs & Reinig, 2010), and has actually shown that high idea
quantity may be detrimental to the generation of high quality ideas that are worth pursuing in later innovation
phases.
On this basis, this study analyses the impacts of communication media affordances on several performance
indicators, and by this makes a more rigorous investigation of the relationship between communication
characteristics and ideation performance. The paper is organized as follows. First, the theoretical basis for the
research is presented, including development of hypotheses. The methodological approach is thereafter
described, and the results of hypotheses tests are presented. Finally, the paper concludes with a discussion of
results, limitations of the study, and suggestions for further research.
2 THEORY AND HYPOTHESES
All innovations originate from ideas (Boeddrich, 2004). The very early stages of the innovation process,
often referred to as the fuzzy front end of innovation (Smith & Reinertsen, 1991), are therefore important in
order to generate ideas that can be developed into practicable project proposals and subsequently result in
successful innovations (de Brentani & Reid, 2012; Boeddrich, 2004). In this respect, the concept of ideation
refers to the process of generating or conceiving of new ideas, and the main objective is generally to generate
ideas of high quality (i.e. ideas which are helpful in attaining a goal) (Reinig, Briggs, & Nunamaker, 2007).
Ideation is typically carried out in brainstorming groups, as it is widely believed that groups are superior to
unaided individuals (DeRosa et al., 2007). This is based on the proposal of Osborn (1957) that groups would
produce more and better ideas than individuals working alone. However, these assertions have been subject for
extensive investigation, and have been disconfirmed in numerous studies (DeRosa et al., 2007; N. L. Kerr &
Tindale, 2004). In light of these findings, considerable attention has been devoted to studying electronic
brainstorming groups as the communication form is believed to reduce some of social psychological factors that
are said to underlie the weaknesses of traditional (face-to-face) brainstorming (Mullen, Johnson, & Salas, 1991;
Munkes & Diehl, 2003). In fact, the superiority of electronic brainstorming over face-to-face brainstorming has
been clearly demonstrated (D. S. Kerr & Murthy, 2009; Valacich, Dennis, & Connolly, 1994; Valacich,
Paranka, George, & Numamaker, 1993).
Ideation is to a large extent a social process, and Leonard and Sensiper (1998) assert that quality of group
collaboration is more important than individual factors in idea generation. The social context may thus enhance
or inhibit creative activity. Accordingly, in group-based problem solving situations, it is common to speak of
process gains and process losses as results of elements like group characteristics, task characteristics, context
characteristics, reward structure, etc. (McGrath, 1984). An individual’s contribution (e.g. idea, comment,
criticism, etc.) in group work is shaped by this context of enhancing and stifling forces (Valacich, Dennis, &
Numamaker, 1992). In other words, certain aspects of the situation improve outcomes, while others impair
outcomes, and the results of problem solving activities are thus contingent upon the balance of the process gains
and losses (Connolly, Jessup, & Valacich, 1990). There are many different sources of gains and losses that can
be attributed to situational factors of group interaction. Nunamaker, Dennis, Valacich, Vogel and George (1991)
list several process gains and process losses that, depending upon the situation, vary in strength (or may not
exist at all).
The processes of production blocking, free riding and evaluation apprehension are identified as significant
causes for productivity loss in brainstorming groups (Diehl & Stroebe, 1987, 1991; Paulus & Yang, 2000).
Production blocking implies that group members are prevented from contributing ideas as they occur (e.g.
because only one group member may speak at a time). Evaluation apprehension refers to withholding of ideas
and comments due to fear of negative evaluations from other group members, and free riding occurs when group

Leif Jarle Gressgård
31
members rely on others to accomplish the tasks (as they expect that the ideas will be analysed at a group level).
This is related to social loafing, referring to the tendency of individuals to exert less effort when working with
others (Wagner, 1995). Communication technologies that are able to reduce such inhibiting group processes
may thus facilitate ideation. In this respect, Avital and Te’eni (2009) use the concept of generativity when
discussing the importance of computer systems to “enhance our creativity, reveal opportunities, and open new
vistas of uncharted frontiers” (p. 345). In particular, they argue that generative fit, denoting the extent to which
an information system can complement, bolster and enhance the users in seeing new configurations and
possibilities for the task they face, is essential for system design and usage. Usefulness of communication media
thus depends on the tasks that are to be solved (Dennis, Wixom, & Vandenberg, 2001).
According to Leonardi (2011), technologies have material properties that afford different possibilities for
action. Burgoon et al. (1999) also argue that communication technologies can be understood in terms of their
abilities to enable specific affordances of the communication process. In group-based ideation, affordances of
communication media that are influential for the strength of production blocking, evaluation apprehension and
free riding may therefore be central performance determinants. Generative fit may thus depend on the abilities
of the communication media to reduce these process losses, and in this respect we argue that the affordances of
synchronicity, parallelism and identification are central.
Synchronicity refers to whether the interaction is same-time or not (Burgoon et al., 1999), and may be
important for ideation performance in group work. While there are many different methodologies about how to
most effectively engage in idea generating activities, one element they have in common is that the free flow of
initial ideas must occur without the interruptions of criticisms or evaluations. In this respect, the level of
synchronicity may be important as it is influential for the response characteristics of the interaction. That is,
group members’ expectancies regarding timing of feedback may depend on the level of synchronicity of the
interaction. It is for example likely that the group members expect immediate responses on the ideas that are
presented when the interaction occurs in real time, and may therefore influence the level of production blocking.
Further, it can be argued that high synchronicity does not render possible a critical examination of neither the
ideas that the sender is to put forth (rehearsability), nor the ideas or messages that an individual has received
from other participants (reprocessability) before composing a response. High synchronous interaction may by
this reduce evaluation apprehension, and thereby facilitate the proposal of numerous and innovative ideas. We
therefore propose that:
Hypothesis 1: Participants involved in interaction with high synchronicity produce a higher number of new
ideas, and b) ideas with higher quality than participants involved in interaction with low synchronicity.
Parallelism refers to the number of simultaneous conversations that can effectively take place in a group
work situation (Dennis, Fuller, & Valacich, 2008; Dennis & Valacich, 1999). Interaction with high parallelism
thus implies that the group members can be engaged in multiple dialogues at the same time, and therefore do not
have to take turns in utterance of contributions. This characteristic of interaction may be of particular
importance when it comes to the level of production blocking, which may occur when group members cannot
express their ideas when someone else is talking (Diehl & Stroebe, 1991; Paulus & Yang, 2000; Shepherd,
Briggs, Reinig, Yen, & Nunamaker, 1995). In these situations, a group member may forget an idea while
waiting for a turn to speak, or may devote attention to remembering an idea and may therefore be too distracted
to generate new ideas (Diehl & Stroebe, 1987; Nunamaker, Dennis, Valacich, & Vogel, 1991; Nunamaker,
Dennis, Valacich, Vogel, et al., 1991). In line with this, Nijstad, Stroebe and Lodewijkx (2003) found that
delays between production and articulation of ideas are an important factor for production blocking. Dennis et
al. (1997) also found that groups involved in multiple dialogues generated more ideas, more high-quality ideas,
and more novel ideas than groups using single dialogues. We therefore expect that:
Hypothesis 2: Participants involved in interaction with high parallelism produce a higher number of new
ideas, and ideas with higher quality than participants involved in interaction with low parallelism.
Identification refers to the degree to which the originator of contributions to group work can be identified.
This affordance is by this equivalent to the understanding of content anonymity, which Valacich et al. (1992)
define as “the extent to which group members can identify the source of a particular contribution to the group”
(p. 224). Several authors have identified anonymity as an important aspect of group decision support systems as
it may encourage full participation of group members that otherwise would have been socially inhibited from
expressing ideas (Kraemer & King, 1988; Nunamaker, Applegate, & Konsynski, 1988). In other words, group
members engaged in problem solving sessions where the contributions are linked to the contributor, may be
unwilling to express their ideas because they are afraid of negative evaluation (Paulus & Yang, 2000).
Maintaining anonymity can thus reduce evaluation apprehension and might promote the generation and sharing
of more non-redundant ideas and more controversial ideas (Cooper, Gallupe, Pollard, & Cadsby, 1998; DeRosa

Int. Journal of Business Science and Applied Management / Business-and-Management.org
32
et al., 2007). In contrast, there is also a possibility that low identification will lead to a reduction of the group
members’ awareness of responsibility. However, Suleiman and Watson (2008) found that identifiability of
group members had no observable effect on social loafing. Jessup, Connolly and Galegher (1990) also studied
the influence of anonymity on group processes in a CMC setting, and found that anonymous interaction resulted
in more comments, more critical probing, and more clarifications and adding to ideas that were put forth.
Similarly, both Cooper et al. (1998) and Connolly et al. (1990) found that anonymous groups generated more
different problem solutions than identified groups. We therefore expect that:
Hypothesis 3: Participants involved in interaction with low identification produce a) a higher number of
new ideas, and b) ideas with higher quality than participants involved in interaction with high identification.
3 METHOD
3.1 Experimental design and treatments
To compare the ideation performance of group members communicating by use of media with different
levels of synchronicity, parallelism and identification, we designed an experiment that allowed us to manipulate
the communication affordances and measure the quantity and quality of ideas generated during a problem
solving session. The research design including collaborative tools and manipulations is shown in Table 1. Text-
based communication tools were chosen because of the need to create variance in synchronicity, parallelism,
and identification while holding the levels of other communication affordances constant across conditions.
Table 1: Experimental design
Condition Collaborative tool Affordances
Synchronicity Parallelism Identification
1 Discussion forum
Low High High
Time-lag of minimum 3
minutes between posting and reading of messages
Multiple dialogues possible Link between contributor
and contribution
2 Shared note-pad/
text editor
High Low Low
Real-time interaction
Sequential contributions -
similar to face-to-face
interaction
No link between contributor and contribution
3 Discussion forum
High High Low
Real-time interaction Multiple dialogues possible No link between contributor
and contribution
12 experimental sessions with a total of 27 problem-solving groups and 95 participants were conducted.
The subjects were randomly distributed into problem-solving groups that belonged to one of the three
conditions. Condition 1 consisted of 8 groups (and a total of 32 participants), condition 2 consisted of 10 groups
(32 participants), and condition 3 consisted of 9 groups (31 participants). There were between 3 and 5
participants in each problem-solving group.
Manipulation of synchronicity was ensured by instructing groups in condition 1 to work offline, except for
brief online periods every three minutes when the contributions (ideas, comments, etc.) were transmitted.
Problem-solving groups in condition 2 and 3 were working online. Regarding parallelism, high parallelism
(groups in conditions 1 and 3) was implemented as discussion forums that allowed for simultaneous postings.
Participants in condition 2 on the other hand were communicated by typing messages in a shared text editor, and
simultaneous typing would thus be regarded as mutual interruption. In order to ensure high perceived
identification (groups in condition 1), the names of the contributors were displayed together with their postings.
This was not the case for the problem-solving groups in conditions 2 and 3, thus ensuring low identification.
3.2 Task and subjects
The theme of the group work was streaming of music and peer-to-peer sharing of audio files on the
Internet. More specifically, the group members were given the task to discuss the problem of non-commercial
(private) distribution of music on the Internet, and come up with ideas and solutions for products and services
that were suitable and beneficial for both the music industry (various actors) and the consumers. A business-

Leif Jarle Gressgård
33
related challenge caused by increasing use of information and communication technologies was thus chosen
instead of a typical creativity research task (e.g. the “additional thumbs problem” - see e.g. Dugosh & Paulus,
2005) in order to increase the practical value of the experiment. The groups were given 30 minutes to discuss
the problem, and the total experimental session (including introduction and debriefing) lasted for approximately
45-50 minutes. The interaction among the group members was based on Groove (collaboration software), and
the subjects were given an introduction to the software in plenum prior to the problem solving session. In
addition, letters explaining the task to be solved and the specific use of collaboration tools in Groove (according
to the manipulations) were handed out.
As a consequence of the characteristics of the experimental setting, the participants had to be relatively
experienced in using electronic communication media (collaboration software in particular). They further
needed some prior knowledge of the problem that was to be discussed (peer-to-peer file sharing), and use of
business school students therefore seemed appropriate. Subjects (56% male and 44% female) for the experiment
were on this basis recruited from several graduate and undergraduate courses within the fields of information
science, organizational behaviour, and strategy and management at a business school. Participation in the
experiment was voluntary, and had no bearing on performance on the courses. A small compensation was
provided for participation.
3.3 Measures
According to Lowry, Romano, Jenkins, & Guthrie (2009), participants’ perceptions of media affordances
are central when investigation effects of communication characteristics on group work. On this basis, the
experimental setup, including configuration of collaborative tools and work process instructions, was designed
to create variance in perceptions of synchronicity, parallelism, and identification. These perceptions were
measured by use of a questionnaire applying a five-point Likert scale distributed after the problem solving
sessions. The following items were applied (resulting in satisfactory discriminant and convergence validity of
the constructs):
Synchronicity: 1) I could provide immediate feedback on the other group members’ contributions; 2) I
could get immediate feedback on my contributions; 3) My response time to contributions from other participants
could be very low (negative indicator); 4) The response time of the other group participants to my contributions
could be very low (negative indicator). Parallelism: 1) Thoughts and ideas that popped up could be presented
without interrupting other group participants; 2) Ideas and thoughts that popped up could be framed immediately
without risking everyone speaking at once; 3) It happened that I delayed proposing thoughts and ideas that
popped up because I didn’t want to interrupt other group participants (negative indicator). Identification: 1) The
other participants in the group knew which contributions were mine; 2) It was easy to know who had presented
an idea/comment; 3) It was easy to relate a specific contribution to the person who proposed it; 4) The
contributors were generally unknown (negative indicator), 5) The collaborative tool made it possible for me to
present my contributions without the other participants knowing that they were mine (negative indicator).
Based on the perceptions of affordances, the participants were distributed in groups of high and low levels
of synchronicity, parallelism and identification, which again were applied in the hypotheses testing. T-tests to
assure that the differences in perceived values of the independent variables between groups were appropriate for
further analyses were also conducted. The results of these tests showed that the difference in score on
synchronicity between the high/low synchronicity-groups was significant (high=4.43 vs. low=2.80, giving: t=-
12.94, d.f=64, p<0.00), while the differences in scores on parallelism and identification were not significant
(high=3.81 vs. low=3.65, giving: t=-0.72, d.f.=89, p=0.48, n.s., and high=3.12 vs. 2.98, giving: t=-0.60, d.f.=89,
p=0.57, n.s., respectively). For the high/low parallelism-groups, the difference in scores on parallelism was
significant (high= 4.49 vs. low=2.82, giving: t=-12.18, d.f.=57, p<0.00), and the differences in scores on
synchronicity and identification were not significant (high=3.76 vs. low=3.60, giving: t=-0.82, d.f.=69, p=0.41,
n.s., and high=3.10 vs. low=3.00, giving: t=0.43, d.f.=89, p=0.66, n.s., respectively). Finally, the difference in
scores on identification for the anonymous/identified-groups was significant (high=4.09 vs. 2.09, giving: t=-
18.15, d.f.=88, p<0.00), but the differences in scores on synchronicity and parallelism between these groups
were not significant (high=3.62 vs. low=3.77, giving: t=0.71, d.f.=89, p=0.48, n.s., and high=3.73 vs. low=3.74,
giving: t=0.01, d.f.=89, p=0.99, n.s., respectively).
Regarding ideation performance, there is a widely held conjecture that all else being equal, more ideas give
rise to more good ideas (Reinig & Briggs, 2008). However, in testing the hypothesis that an increase in the
quantity of brainstorming ideas (i.e. the total number of ideas, including bad ones) might directly stimulate the
production of more good ideas, Briggs, Reinig, Shepherd, Yen and Nunamaker (1997) found that idea quantity
was far stronger correlated with bad ideas than with good ideas. Accordingly, a quality focus may be more
useful in ideation research (Briggs & Reinig, 2010), and multiple measures/indicators of ideation performance
were on this basis applied in the study. That is, the measures of “idea count”, “good idea count”, “sum of
quality” (i.e. sum of the quality scores of the individual ideas) and “average quality” as discussed by Reinig et
al. (2007) were applied.
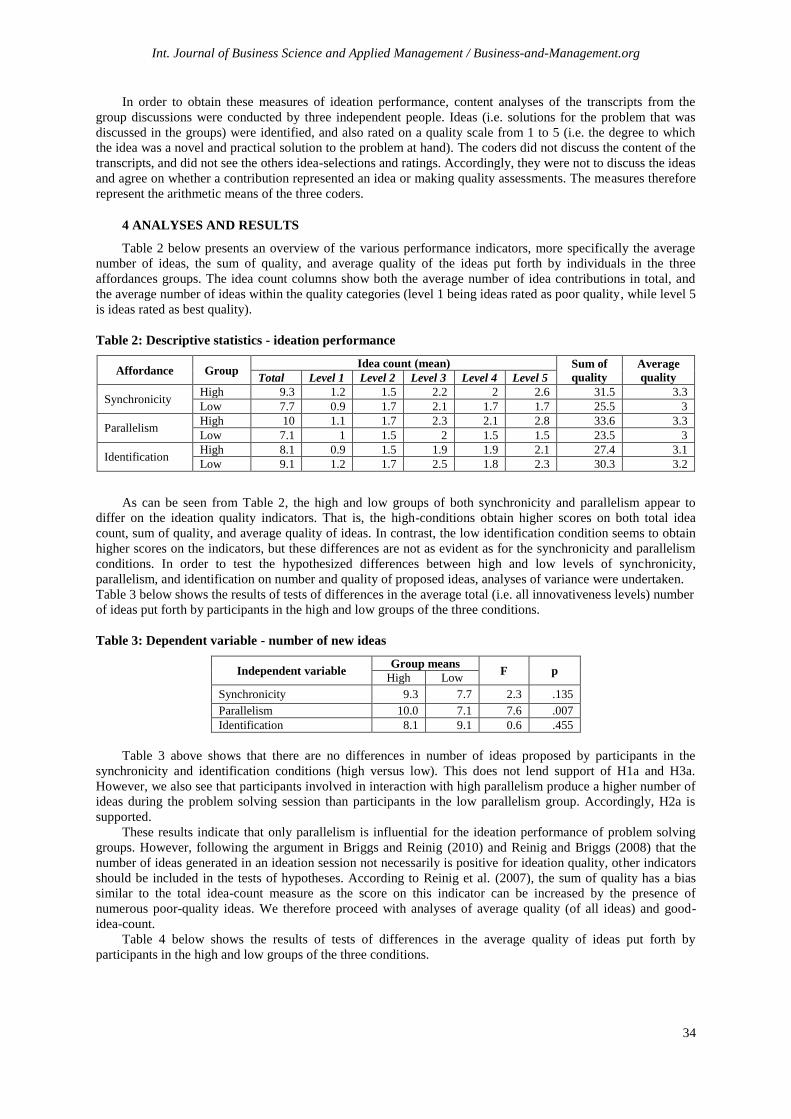
Int. Journal of Business Science and Applied Management / Business-and-Management.org
34
In order to obtain these measures of ideation performance, content analyses of the transcripts from the
group discussions were conducted by three independent people. Ideas (i.e. solutions for the problem that was
discussed in the groups) were identified, and also rated on a quality scale from 1 to 5 (i.e. the degree to which
the idea was a novel and practical solution to the problem at hand). The coders did not discuss the content of the
transcripts, and did not see the others idea-selections and ratings. Accordingly, they were not to discuss the ideas
and agree on whether a contribution represented an idea or making quality assessments. The measures therefore
represent the arithmetic means of the three coders.
4 ANALYSES AND RESULTS
Table 2 below presents an overview of the various performance indicators, more specifically the average
number of ideas, the sum of quality, and average quality of the ideas put forth by individuals in the three
affordances groups. The idea count columns show both the average number of idea contributions in total, and
the average number of ideas within the quality categories (level 1 being ideas rated as poor quality, while level 5
is ideas rated as best quality).
Table 2: Descriptive statistics - ideation performance
Affordance Group Idea count (mean) Sum of
quality
Average
quality Total Level 1 Level 2 Level 3 Level 4 Level 5
Synchronicity High 9.3 1.2 1.5 2.2 2 2.6 31.5 3.3
Low 7.7 0.9 1.7 2.1 1.7 1.7 25.5 3
Parallelism High 10 1.1 1.7 2.3 2.1 2.8 33.6 3.3
Low 7.1 1 1.5 2 1.5 1.5 23.5 3
Identification High 8.1 0.9 1.5 1.9 1.9 2.1 27.4 3.1
Low 9.1 1.2 1.7 2.5 1.8 2.3 30.3 3.2
As can be seen from Table 2, the high and low groups of both synchronicity and parallelism appear to
differ on the ideation quality indicators. That is, the high-conditions obtain higher scores on both total idea
count, sum of quality, and average quality of ideas. In contrast, the low identification condition seems to obtain
higher scores on the indicators, but these differences are not as evident as for the synchronicity and parallelism
conditions. In order to test the hypothesized differences between high and low levels of synchronicity,
parallelism, and identification on number and quality of proposed ideas, analyses of variance were undertaken.
Table 3 below shows the results of tests of differences in the average total (i.e. all innovativeness levels) number
of ideas put forth by participants in the high and low groups of the three conditions.
Table 3: Dependent variable - number of new ideas
Independent variable Group means
F p High Low
Synchronicity 9.3 7.7 2.3 .135
Parallelism 10.0 7.1 7.6 .007
Identification 8.1 9.1 0.6 .455
Table 3 above shows that there are no differences in number of ideas proposed by participants in the
synchronicity and identification conditions (high versus low). This does not lend support of H1a and H3a.
However, we also see that participants involved in interaction with high parallelism produce a higher number of
ideas during the problem solving session than participants in the low parallelism group. Accordingly, H2a is
supported.
These results indicate that only parallelism is influential for the ideation performance of problem solving
groups. However, following the argument in Briggs and Reinig (2010) and Reinig and Briggs (2008) that the
number of ideas generated in an ideation session not necessarily is positive for ideation quality, other indicators
should be included in the tests of hypotheses. According to Reinig et al. (2007), the sum of quality has a bias
similar to the total idea-count measure as the score on this indicator can be increased by the presence of
numerous poor-quality ideas. We therefore proceed with analyses of average quality (of all ideas) and good-
idea-count.
Table 4 below shows the results of tests of differences in the average quality of ideas put forth by
participants in the high and low groups of the three conditions.

Leif Jarle Gressgård
35
Table 4: Dependent variable - average quality
Independent variable Group means
F p High Low
Synchronicity 3.3 3.0 4.1 .046
Parallelism 3.3 3.0 4.5 .037
Identification 3.1 3.2 0.2 .694
As can be seen from Table 4, there is no difference between participants in the high and low identification
conditions, and H3b must therefore be rejected. For the corresponding groups in the parallelism and
synchronicity conditions on the contrary, we find that the participants in groups with high levels of these
affordances produce ideas with a higher degree of innovativeness compared to the low groups. This lends
support for H1b and H2b.
In order to further investigate the impact of the synchronicity, parallelism and identification on ideation
performance, 5 variables of idea count with various degrees of innovativeness were constructed: 1) “Idea quality
1” (innovativeness rating 1, i.e. poor quality ideas); “Idea quality 2” (innovativeness ratings 2 through 5); “Idea
quality 3” (innovativeness ratings 3 through 5); “Idea quality 4” (innovativeness ratings 4 through 5); and “Idea
quality 5” (innovativeness rating 5, i.e. high quality ideas). Thus, the variables represent an increase in the
quality of ideas put forth in group work. Analyses of variance were conducted in order to test whether there
were differences between high and low levels of media affordances on the various performance variables. Table
5 below shows the results of the tests.
Table 5: Effects of independent variables on ideation performance
Independent
variable Dependent variable
Group means F p
High Low
Synchronicity
Idea quality 1 1.2 0.92 1.1 .301
Idea quality 2 8.3 7.1 1.5 .226
Idea quality 3 6.7 5.4 2.2 .143
Idea quality 4 4.6 3.4 3.2 .077
Idea quality 5 2.6 1.7 5.0 .028
Parallelism
Idea quality 1 1.1 0.98 0.7 .416
Idea quality 2 8.8 6.6 5.3 .024
Idea quality 3 7.2 4.9 6.6 .012
Idea quality 4 5.0 3.1 8.0 .006
Idea quality 5 2.8 1.5 11.7 .001
Identification
Idea quality 1 0.9 1.2 0.75 0.387
Idea quality 2 7.3 8.2 0.55 0.462
Idea quality 3 5.8 6.4 0.43 0.515
Idea quality 4 4.0 4.2 0.11 0.747
Idea quality 5 2.1 2.3 0.14 0.710
From the first five rows in Table 5 we see that the differences between the groups of high and low
synchronicity are not significant for the first four dependent variables. For “Idea quality 5” however, the high
synchronicity group has generated a significantly higher number of ideas than the low synchronicity group. It
should also be noted that the differences between the groups increase as the quality standards get higher (though
it is only the highest quality measure that turns out significant).
Regarding parallelism, Table 5 shows that the differences between the groups are significant for all
variables, except “Idea quality 1”. For “Idea quality 2” and “Idea quality 3”, the differences between the groups
are significant at the 5% level, while the differences between the groups are significant at the 1% level for the
last two dependent variables. As for the effects of synchronicity, the differences between the groups (high
versus low parallelism) increase with increasing quality standards. Regarding identification, no differences
between the groups are found.
In summarizing the tests of hypotheses, we found that the number of ideas put forth in group work were
dependent on level of parallelism (high parallelism resulted in a higher number of ideas compared to low
parallelism), but not on different levels of synchronicity and identification. H2a was thus supported, while H1a
and H3a were rejected. Regarding quality of ideas put forth, both parallelism and synchronicity were important.
The tests revealed that high levels of these affordances resulted in higher quality of the ideas, and H1b and H2b

Int. Journal of Business Science and Applied Management / Business-and-Management.org
36
were thus supported. The level of identification had no significant effect on idea quality, and H3b was therefore
rejected.
5 DISCUSSION
The study revealed some interesting relationships. First, the results showed that the level of parallelism is
important for ideation performance. In general, interaction characterized by high parallelism appears to be more
suited for generation of both numerous and high quality ideas. This is thus consistent with finding of Dennis et
al. (1997). The fact that high degree of parallelism is positive for the total amount of ideas proposed is not
surprising. Naturally, as the participants have to take turn speaking (low parallelism), the number of ideas that
can be put forth is reduced. What is interesting is the difference in the quality aspect of the ideas. For ideas rated
as having a poor quality (level 1), there were no difference in the number of ideas put forth. The same type of
relationship is also found when it comes to the impacts of synchronicity. That is, the differences in ideation
performance between the high and low conditions of both parallelism and synchronicity increase as the idea
evaluation criteria are sharpened (i.e. increasing idea quality). This is particularly obvious for high synchronous
interaction, as we find significant effects on ideation performance only for ideas with the highest quality. This
means that the levels of these affordances are important for generation of high quality ideas.
With reference to the underlying rationale of the hypotheses, the results may indicate that production
blocking caused by low parallelism and low synchronicity is a major detrimental factor for ideation
performance. That is, production blocking is most apparent in interaction with low parallelism, causing the
groups in this condition to perform significantly poorer on ideation work. Further, as discussed in the theoretical
section, the effect of synchronicity can be attributed to both production blocking and evaluation apprehension.
Whether the effects of this affordance on ideation quality were caused by either or both of these group processes
is a question that remains to be answered, hence the combination of evaluation apprehension and production
blocking is important to investigate in future research.
The results also indicate that production blocking is more evident for generation of high quality ideas. This
can be explained by a plausible relationship between cognitive efforts and quality standards in idea generation.
That is, the manifestation of deteriorative cognitive processes of group members due to production blocking
becomes more evident with increasing ideation quality standards. Related to this, we should also notice that the
results provides support for the assertion of Briggs and Reinig (2010) that the number of ideas proposed in idea
generation tasks is an insufficient measure regarding the ideation performance of virtual groups.
The results showed that the level of identification had no influence on ideation performance in this study.
This may indicate that identifiability of group members does not affect evaluation apprehension in a way that
reduces the number and quality of ideas proposed in group work. Another explanation can be that the reduction
of evaluation apprehension is overruled by an increase of free riding. In this case, the contributions of individual
members are less apparent in an anonymous environment, and the production focus is thus moved from the
individual to the group. As group members may expect that their ideas to be evaluated at the group level only,
they may be inclined to free ride on the efforts of others (Diehl & Stroebe, 1987). However, whether the lack of
a relationship between identification and ideation performance is caused by free riding problems remains an
unanswered question. The relationship between evaluation apprehension and free riding issues in group
interaction with various degrees of identifiability of group members should therefore be addressed in future
research.
6 CONCLUSIONS
The overall objective of this research was to investigate how characteristics of computer-mediated
communication influence ideation performance in virtual groups. An experiment was on this basis conducted
that investigated the effects of different levels of synchronicity, parallelism, and identification on the number
and quality of ideas put forth in group work. Regarding the former performance measure (idea quantity), the
results of the study showed that high parallelism resulted in a larger number of ideas put forth compared to low
parallelism, while there were no significant effects of synchronicity and identification. Regarding idea quality,
identification of participants had no effects. In contrary, both parallelism and synchronicity were significant
variables as high levels of these affordances resulted in higher quality of the ideas that were generated. The
study further showed that the importance of these affordances for group ideation increases with increasing
quality criteria. That is, the differences between high and low levels of synchronicity and parallelism increase as
the quality standards get higher. This finding is the most important contribution of this study, and implies that
computer-mediated group work aiming at generating high-quality ideas should consider the levels of parallelism
and synchronicity in group interaction. In other words, these communication affordances seem to be important
for the fuzzy front end of innovation.
Some limitations of the study should also be addressed. The first issue that should be commented is the
lack of measurement of the important mediating variables of group processes (i.e. evaluation apprehension,

Leif Jarle Gressgård
37
production blocking and free riding). This means that the explanatory logic underlying the interpretation of the
results is on a hypothetical level. Future research should therefore measure important group processes in order to
make a more rigorous analysis of the relationship between communication affordances, group processes, and
ideation performance. The potential importance of group size when it comes to group processes (evaluation
apprehension, production blocking, and free riding) in computer-supported group work, and subsequently on
ideation performance, should also be mentioned. As an example of group size effects, Valacich et al. (1992)
compared ideation performance between groups of 3 and 9 participants, and found that larger groups generated
significantly more ideas (and higher-quality ideas as rated by judges) than did smaller groups. Mullen et al.
(1991) also showed that process losses increase with group size. An important issue for future research is thus
whether (and in case to what extent) the effects of various affordances on process losses dependent on group
size, which again impact on ideation performance. Finally, the use of students as participants in the study may
have affected the results. As pointed out by Pissarra and Jesuino (2005), use of students as subjects and running
the experiments in a scholarly context, may contribute to the elimination of fears and to freeing the participants
from evaluation apprehension. The degree to which the findings can be regarded as valid for other people (and
in other settings) should be addressed in later studies.
REFERENCES
Avital, M., & Te’eni, D. (2009). From generative fit to generative capacity: Exploring an emerging dimension
of information systems design and task performance, Information Systems Journal, 19(4), 345-367.
Boeddrich, H-J. (2004). Ideas in the workplace: A new approach towards organizing the fuzzy front end of the
innovation process. Creativity and Innovation Management, 13(4), 274-285.
Briggs, R. O., & Reinig, B. A. (2010). Bounded ideation theory. Journal of Management Information Systems,
27(1), 123-144.
Briggs, R. O., Reinig, B. A., Shepherd, M. M., Yen, J., & Nunamaker, J. F. (1997). Quality as a function of
quantity in electronic brainstorming. Proceedings of the 30th Hawaii International Conference on System
Sciences, Los Alamitos, CA: IEEE Computer Society Press, Volume 2.
Burgoon, J. K., Bonito, J. A., Bengtsson, B., Ramjrez Jr, A., Dunbar, N. E., & Miczo, N. (1999). Testing the
interactivity model: Communication processes, partner assessments, and the quality of collaborative work.
Journal of Management Information Systems, 16(3), 33-56.
Connolly, T., Jessup, L. M., & Valacich, J. S. (1990). Effects of anonymity and evaluative tone on idea
generation in computer-mediated groups. Management Science, 36(6), 689-703.
Cooper, W. H., Gallupe, R. B., Pollard, S., & Cadsby, J. (1998). Some liberating effects of anonymous
electronic brainstorming. Small Group Research, 29(2), 147-178.
de Brentani, U., & Reid, S.E. (2012). The fuzzy front-end of discontinuous innovation: Insights for research and
management, Journal of Product Innovation Management, 29(1), 70-87.
Dennis, A. R., Fuller, R. M., & Valacich, J. S. (2008). Media, tasks, and communication processes: A theory of
media synchronicity. MIS Quarterly, 32(3), 575-600.
Dennis, A. R., & Valacich, J. (1999). Rethinking media richness: Towards a theory of media synchronicity.
Proceedings of the 32nd
Annual Hawaii Conference on System Sciences, Los Alamitos, CA: IEEE
Computer Society Press, Volume 1.
Dennis, A. R., Valacich, J. S., Carte, T. A., Garfield, M. J., Haley, B. J., & Aronson, J. E. (1997). Research
report: The effectiveness of multiple dialogues in electronic brainstorming. Information Systems Research,
8(2), 203.
Dennis, A. R., Wixom, B. H., & Vandenberg, R. J. (2001). Understanding fit and appropriation effects in group
support systems via meta-analysis. MIS Quarterly, 25(2), 167-193.
DeRosa, D. M., Smith, C. L., & Hantula, D. A. (2007). The medium matters: Mining the long-promised merit of
group interaction in creative idea generation tasks in a meta-analysis of the electronic group brainstorming
literature. Computers in Human Behavior, 23(3), 1549-1581.
Diehl, M., & Stroebe, W. (1987). Productivity loss in brainstorming groups: Toward the solution of a riddle.
Journal of Personality and Social Psychology, 53(3), 497-509.
Diehl, M., & Stroebe, W. (1991). Productivity loss in idea-generating groups: Tracking down the blocking
effect. Journal of Personality and Social Psychology, 61(3), 392-403.
Dugosh, K.L., & Paulus, P.B. (2005). Cognitive and social comparison processes in brainstorming, Journal of
Experimental Social Psychology, 41(3), 313-320.

Int. Journal of Business Science and Applied Management / Business-and-Management.org
38
Girotra, K., Terwiesch, C., & Ulrich, K. T. (2010). Idea generation and the quality of the best idea. Management
Science, 56(4), 591-605.
Jessup, L. M., Connolly, T., & Galegher, J. (1990). The effects of anonymity on GDSS group process with an
idea-generating task. MIS Quarterly, 14(3), 313-321.
Jung, J. H., Schneider, C., & Valacich, J. (2010). Enhancing the motivational affordance of information systems:
The effects of real-time performance feedback and goal setting in group collaboration environments.
Management Science, 56(4), 724-742.
Kerr, D. S., & Murthy, U. S. (2009). The effectiveness of synchronous computer-mediated communication for
solving hidden-profile problems: Further empirical evidence. Information & Management, 46(2), 83-89.
Kerr, N. L., & Tindale, S. R. (2004). Group performance and decision making. Annual Review of Psychology,
55(1), 623-655.
Kraemer, K. L., & King, J. L. (1988). Computer-based systems for cooperative work and group decision
making. ACM Computing Surveys, 20(2), 115-127.
Leonard, D., & Sensiper, S. (1998). The role of tacit knowledge in group innovation. California Management
Review, 40(3), 112-132.
Leonardi, P.M. (2011). When flexible routines meet flexible technologies: Affordance, constraint, and the
imbrication of human and material agencies, MIS Quarterly, 35(1), 147-167.
Lowry, P. B., Romano, N. C., Jenkins, J. L., & Guthrie, R. W. (2009). The CMC interactivity model: How
interactivity enhances communication quality and process satisfaction in lean-media groups. Journal of
Management Information Systems, 26(1), 155-195.
McGrath, J. E. (1984). Groups: Interaction and Performance. Englewood Cliffs, NJ: Prentice-Hall Inc.
Mullen, B., Johnson, C., & Salas, E. (1991). Productivity loss in brainstorming groups: A meta-analytic
integration. Basic & Applied Social Psychology, 12(1), 3-23.
Munkes, J., & Diehl, M. (2003). Matching or competition? Performance comparison processes in an idea
generating task. Group Processes & Intergroup Relations, 6(3), 305-320.
Nijstad, B. A., Stroebe, W., & Lodewijkx, H. F. M. (2003). Production blocking and idea generation: Does
blocking interfere with cognitive processes? Journal of Experimental Social Psychology, 39(6), 531-548.
Nunamaker, J. F., Applegate, L. M., & Konsynski, B. R. (1988). Computer-aided deliberation: Model
management and group decision support. Operations Research, 36(6), 826.
Nunamaker, J. F., Dennis, A. R., Valacich, J. S., & Vogel, D. R. (1991). Information technology for negotiating
groups: Generating options for mutual gain. Management Science, 37(10), 1325-1346.
Nunamaker, J. F., Dennis, A. R., Valacich, J. S., Vogel, D. R., & George, J. F. (1991). Electronic meeting
systems to support group work. Communications of the ACM, 34(7), 40-61.
Osborn, A. F. (1957). Applied Imagination (2nd ed.). New York: Scribner.
Paulus, P. B., & Yang, H.-C. (2000). Idea generation in groups: A basis for creativity in organizations.
Organizational Behavior and Human Decision Processes, 82(1), 76-87.
Pissarra, J., & Jesuino, J. C. (2005). Idea generation through computer-mediated communication: The effects of
anonymity. Journal of Managerial Psychology, 20(3/4), 275-291.
Reinig, B. A., & Briggs, R. O. (2008). On the relationship between idea-quantity and idea-quality during
ideation. Group Decision and Negotiation, 17(5), 403-420.
Reinig, B. A., Briggs, R. O., & Nunamaker, J. F. (2007). On the measurement of ideation quality. Journal of
Management Information Systems, 23(4), 143-161.
Shepherd, M. M., Briggs, R. O., Reinig, B. A., Yen, J., & Nunamaker, J. F. (1995). Invoking social comparison
to improve electronic brainstorming: Beyond anonymity. Journal of Management Information Systems,
12(3), 155-170.
Smith, P.G., & Reinertsen, D.G. (1991). Developing Products in Half the Time. New York: Van Nostrand
Reinhold.
Suleiman, J., & Watson, R. (2008). Social loafing in technology-supported teams. Computer Supported
Cooperative Work, 17(4), 291-309.
Valacich, J. S., Dennis, A. R., & Connolly, T. (1994). Idea generation in computer-based groups: A new ending
to an old story. Organizational Behavior and Human Decision Processes, 57(3), 448-467.

Leif Jarle Gressgård
39
Valacich, J. S., Dennis, A. R., & Numamaker, J. F. (1992). Group size and anonymity effects on computer-
mediated idea generation. Small Group Research, 23(1), 49-73.
Valacich, J. S., Paranka, D., George, J. F., & Numamaker, J. F. (1993). Communication concurrency and the
new media: A new dimension for media richness. Communications Research, 20(2), 249-276.
Wagner, J. A. (1995). Studies of individualism-collectivism: Effects on cooperation in groups. Academy of
Management Journal, 38(1), 152-172.

Int. Journal of Business Science and Applied Management, Volume 7, Issue 2, 2012
Measuring burnout and work engagement: Factor structure,
invariance, and latent mean differences across Greece and the
Netherlands
Despoina Xanthopoulou
School of Psychology, Aristotle University of Thessaloniki
Old Building, GR-54124, Thessaloniki, Greece
Telephone: +30 2310 997216
Email: [email protected]
Arnold B. Bakker
Department of Work & Organizational Psychology, Erasmus University Rotterdam
Institute of Psychology
PO BOX 1738, 3000 DR, Rotterdam, The Netherlands
Telephone: + 31 10 4088853
Email: [email protected]
Aristotelis Kantas
Department of Primary Education, University of Patras
Archimedes str., Building 7
Telephone: + 30 2610 996152
Email: [email protected]
Evangelia Demerouti
Department of Industrial Engineering & Innovation Sciences, Section of Human Performance Management,
Eindhoven University of Technology
PO BOX 513, 5600 MB, Eindhoven, The Netherlands
Telephone: + 31 40 2475669
Email: [email protected]
Abstract
This study examines the factor structure and invariance of the instruments measuring burnout (Maslach Burnout
Inventory - General Survey / MBI-GS) and work engagement (Utrecht Work Engagement Scale / UWES) in a
sample of Dutch (N = 162) and Greek (N = 206) employees. Confirmatory factor analyses in both samples
supported the superiority of the proposed three-factor structure of both the MBI-GS (exhaustion, cynicism, and
reduced professional efficacy) and the UWES (vigor, dedication, and absorption). Alternative two-factor and
one-factor models did not show a better fit to the data. In addition, results of multigroup analyses partly
supported the invariance of the three-factor model of the MBI-GS, and fully supported the invariance of the
three-factor model of the UWES across the two national samples. These results suggest that the MBI-GS and the
UWES are not only valid instruments for testing burnout and engagement but also allow comparisons across
countries.
Keywords: burnout, cross-national study, factor structure, invariance, latent mean differences, work
engagement

Despoina Xanthopoulou, Arnold Bakker, Aristotelis Kantas and Evangelia Demerouti
41
1 INTRODUCTION
Organizational psychologists and managers are interested in burnout because it is a significant correlate of
employee impaired health, and reduced performance (Bakker, Van Emmerik, & Van Riet, 2008; Shirom, 2003).
Over the past decade, researchers have shifted the attention from employee malfunctioning to optimal
functioning. This latter development reflects the trend towards a ‘positive psychology’ that focuses on human
strengths rather than on weaknesses (Seligman & Csikszentmihalyi, 2000). Luthans (2002) underlined the need
for positive organizational behavior research, defined as ‘the study and application of positively oriented human
resource strengths and psychological capacities that can be measured, developed, and effectively managed for
performance improvement in today’s workplace’ (p. 59). In this context, researchers and managers became
interested in understanding not only what makes employees burned out, but also what makes them energetic and
enthusiastic about their work (Bakker, Schaufeli, Leiter, & Taris, 2008). This is because engaged employees
enjoy better health, are more proactive and perform better (for a review see Bakker, Demerouti, &
Xanthopoulou, 2012), while engagement relates positively to financial turnover (Xanthopoulou, Bakker,
Demerouti, & Schaufeli, 2009) and client loyalty (Salanova, Agut, & Peiró, 2005). Thus, valid instruments to
estimate employee burnout and engagement are necessary both for researchers and managers.
Together with this positive trend, the need for cross-cultural studies in organizational psychology research
has become more evident. However, there are methodological difficulties that cross-cultural researchers
frequently encounter. One major problem occurs when cross-cultural comparisons are made between responses
to questionnaires, which have not been validated psychometrically across cultures (Smith, Fisher, & Sale, 2001).
Nevertheless, the need for valid psychometric measures is better understood than in the past. Several studies
have compared levels of burnout and work engagement across different countries. However, apart from some
exceptions (Mäkikangas, Hätinen, Kinnunen, & Pekkonen, 2011; Schaufeli & Bakker, 2010; Schaufeli,
Salanova, González-Romá, & Bakker, 2002b; Schaufeli & Van Dierendonck, 1993), the instruments used were
simply translated and their psychometric properties have been taken for granted. Furthermore, none of the
previous studies estimated whether the relations between the underlying constructs and the specific items are
invariant across the national groups (i.e. scalar invariance). This issue raises concerns about the validity of the
instruments, when used for comparisons across different settings.
The central aim of the present study is to examine the factor structure and invariance of two instruments
that are broadly used to measure burnout (Maslach Burnout Inventory-General Survey; MBI-GS; Schaufeli,
Leiter, Maslach & Jackson, 1996) and work engagement (Utrecht Work Engagement Scale; UWES; Schaufeli et
al., 2002b) across Greece and The Netherlands. This would allow valid estimations and comparisons of the
levels of burnout and engagement among employees from both national groups. The advantage of this study as
compared to previous work (for a review see, Schaufeli & Bakker, 2010; Schaufeli et al., 2002b) is that we do
not only test the configural and metric invariance of these instruments across the two national samples, but also
their scalar invariance. Only when scalar invariance is met, we are sure that we measure the same construct and
thus, it is possible to compare means across samples with generalizable results (Vandenberg & Lance, 2000).
Even though Greece and The Netherlands share the same European background, working condition surveys
systematically show that Dutch employees enjoy more favourable working conditions than Greek employees
(Eurofound, 2007; 2012). Therefore, we expect that Greek and Dutch employees will exhibit different levels of
burnout and work engagement. We compare employees from Greece and the Netherlands because the UWES
(Schaufeli & Bakker, 2003) has been initially developed in the Dutch language, while most empirical evidence
on the validity of the MBI-GS (Schaufeli et al., 1996) is based on Dutch employees. Thus, it makes sense to
compare the Greek versions of these instruments with the original and/or validated ones.
2 LITERATURE REVIEW AND HYPOTHESES
2.1 Burnout and Engagement
Over the course of their careers, many employees experience a great deal of job strain that may include
exhaustion, disengagement and health complaints, as a result of a demanding and emotionally charged work
environment (Schaufeli & Greenglass, 2001). These experiences may lead to poor performance, high levels of
absenteeism, and personnel turnover. For more than two decades, clinical observations have been made and
empirical research has been conducted on this phenomenon, which has been labelled “burnout”. Burnout is
defined as a syndrome of exhaustion, cynicism towards work and reduced professional efficacy, occurring
among individuals in relation to their work (Maslach, Jackson & Leiter, 1996). According to Schaufeli et al.
(1996), exhaustion -the central component of burnout- refers to energy depletion and is characterized by mental,
emotional and physical tiredness. Cynicism refers to the development of negative attitudes towards one’s job or
the recipients of one’s work – an extreme and therefore dysfunctional kind of detachment and loss of concern.
Finally, lack of professional efficacy is the tendency to evaluate one’s work negatively. Such an evaluation is
often accompanied by feelings of insufficiency, self-doubt and poor self-esteem (Maslach, 1993).

Int. Journal of Business Science and Applied Management / Business-and-Management.org
42
Instead of looking exclusively at the negative side of employee well-being, burnout research also focuses
on the positive side. Maslach and Leiter (1997; 2008) rephrased burnout as an erosion of engagement with the
job. Accordingly, engagement is characterized by energy, involvement and efficacy - the direct opposites of the
three burnout dimensions. Schaufeli and Bakker (2001) have taken a different approach to the concept of work
engagement, according to which engagement is defined and operationalized in its own right. They defined work
engagement as a positive, affective-motivational state of fulfilment in employees that is characterized by vigor,
dedication and absorption. Vigor refers to high levels of energy and resilience, the willingness to invest effort in
one’s job, the ability to not be easily fatigued and to be persistent in the face of difficulties. Dedication refers to
a strong involvement in one’s work, accompanied by feelings of enthusiasm and significance and by a sense of
pride and inspiration. Finally, absorption refers to a pleasant state of total immersion in one’s work, which is
characterized by time passing quickly and being unable to detach oneself from the job (Schaufeli & Bakker,
2010; Schaufeli, Martínez, Marques-Pinto, Salanova, & Bakker, 2002a).
2.2 The Measurement of Burnout and Engagement
Originally, burnout was conceived as a three-dimensional syndrome of emotional exhaustion,
depersonalisation and reduced personal accomplishment that occurs in individuals who do people work (i.e.,
education, social services or health care), and was measured with the Maslach Burnout Inventory-Human
Services Survey (MBI-HSS; Maslach & Jackson, 1981). However, research has shown that burnout is not
restricted to individuals who work with people but the syndrome can also be found outside the context of human
services (Bakker, Demerouti & Schaufeli, 2002; Leiter & Schaufeli, 1996). Therefore, the concept of burnout
and its measurement were broadened to include all employees, irrespective of their occupation. As a result, the
original version of the MBI was adapted for use outside the human services and transformed into the MBI-GS
(Schaufeli et al., 1996).
The three dimensions of the MBI-GS (Schaufeli et al., 1996) parallel those of the original MBI, in the sense
that they are more generic and do not refer to individuals as the object of one’s work. For example, exhaustion is
measured by items that do not include other people as the source of the fatigue (e.g. “I feel tired when I get up in
the morning and I have to face another day on the job”). The same applies for cynicism and (reduced)
professional efficacy. In particular, the items that measure cynicism reflect a distance towards work in general
and not only regarding working with other people (e.g. “I doubt the significance of my work”). Finally, the
items that measure professional efficacy focus both on social and non-social occupational accomplishments (e.g.
“I have accomplished many worthwhile things in this job”).
Psychometric research with the MBI-GS has shown that the three-factor structure is invariant across
occupations (Bakker et al., 2002; Leiter & Schaufeli, 1996; Mäkikangas et al., 2011; Taris, Schreurs, &
Schaufeli, 1999), and across samples from Finland, Norway, and The Netherlands (Schutte, Toppinnen, Kalimo,
& Schaufeli, 2000). Only one study examined the psychometric properties of the Greek version of the MBI-GS
(Demerouti, Bakker, Vardakou & Kantas, 2003). Results of this study provided evidence for the three-factor
structure of the MBI-GS across various occupations in Greece. However, analyses showed that there are
problems with some items, mostly of the cynicism scale. Therefore, the first objective of the present study is to
re-examine the factorial validity of the MBI-GS across a sample of Greek and Dutch employees. The following
hypothesis is formulated:
Hypothesis 1: The three-factor structure of the MBI-GS (exhaustion, cynicism, and reduced professional
efficacy) will be the same in Greece and the Netherlands.
As mentioned earlier, research on work engagement was actually developed through the research on
burnout (Maslach et al., 2001; Maslach & Leiter, 1997, 2008). First, Maslach and Leiter (1997) conceptualized
engagement as the opposite pole of burnout and assumed that engagement is characterized by energy,
involvement and efficacy, which are the exact opposites of the three burnout dimensions: exhaustion, cynicism,
and reduced professional efficacy. Engaged employees are strongly connected to their work tasks and believe
that they are effective in dealing with their job demands. Based on this approach, engagement is measured by
the opposite pattern of scores on the three MBI-GS dimensions (Maslach et al., 2001). This means that low
scores on exhaustion and cynicism, and high scores on professional efficacy are indicative of engagement.
Schaufeli and Bakker (2001; Schaufeli et al., 2002a; 2002b) followed a different approach in defining work
engagement. They argued that Maslach and Leiter’s (1997) approach precludes an investigation of the
relationship between burnout and engagement, since both concepts are considered to be the opposite poles of a
continuum that is assessed with one instrument (the MBI-GS). Engagement cannot be measured by the opposite
profile of the MBI-GS, because, even though in conceptual terms it is the positive antithesis of burnout, the
structure and the measurement of both concepts are different. Importantly, burnout and engagement do not share
the same antecedents and are explained by different psychological mechanisms (Schaufeli & Bakker, 2010).
Burnout is mainly determined by the demanding aspects of the job (e.g. workload, physical demands), while

Despoina Xanthopoulou, Arnold Bakker, Aristotelis Kantas and Evangelia Demerouti
43
work engagement is mainly determined by the availability of resources in the work environment (e.g. autonomy
or support; for a meta-analysis, see Halbesleben, 2010). This argumentation explains why engagement cannot be
measured with the opposite scores of burnout, and should be measured on its own right. Thus, Schaufeli and
Bakker (2001; 2010) proposed that burnout and engagement should be conceived as two distinct concepts that
should be measured independently with different instruments. In this context, the Utrecht Work Engagement
Scale (UWES) has been developed that measures the three underlying dimensions of engagement (i.e. vigor,
dedication, and absorption).
In a recent study by Demerouti, Mostert, and Bakker (2010), where the MBI-GS and the UWES were
examined, results showed that the cynicism dimension of burnout and the dedication dimension of engagement
can be considered as the opposite ends of the same attitude dimension called “identification” (see also
González-Romá, Schaufeli, Bakker, & Lloret, 2006). However, the same cannot be said for the exhaustion and
vigor dimensions that do not seem to represent the different ends of the “energy” continuum, despite being
highly related. These conclusions were further supported by the results that exhaustion associated mainly to
work pressure (i.e. a typical job demand), while vigor to job autonomy (i.e. a typical job resource). All in all,
empirical evidence suggests that burnout (as measured with the MBI-GS) and engagement (as measured with
the UWES) seem to be related but independent constructs, which further supports the use of the UWES for the
measurement of work engagement.
The UWES initially included fifteen items (a later version includes seventeen items, while a shorter version
includes only nine items; Schaufeli, Bakker, & Salanova, 2006), which are assumed to assess the three
underlying dimensions of engagement: vigor, dedication and absorption. Results based on Dutch (Schaufeli &
Bakker, 2004; Schaufeli et al., 2002a) and Spanish samples of employees and university students (Schaufeli et
al., 2002b) showed that the fit of the hypothesized three-factor model to the data was superior to alternative
models (see also Schaufeli & Bakker, 2010). Schaufeli et al. (2006) supported the three-factor structure of the
UWES across different countries (e.g. Australia, Canada, Belgium, South Africa, France, and Finland) and
across occupations. Also, Nerstad, Richardsen, and Martinussen, (2010) supported the three-factor structure
across occupational groups in Norway. In the present study, we follow Schaufeli et al.’s (2002a; 2002b)
approach on engagement, and we use the original fifteen-item UWES. The second objective of our study is to
test the factorial validity of the UWES across Greece and The Netherlands. This is interesting because there is
no evidence so far on the validity of the scale in a Greek sample. On the basis of previous findings (Schaufeli et
al., 2002a), we formulate the following hypothesis:
Hypothesis 2: The three-factor structure of the UWES (vigor, dedication, and absorption) will be the same
in Greece and the Netherlands.
2.3. A Cross-national Comparison of Burnout and Engagement
The present study also concerns comparisons between Greek and Dutch employees regarding their levels of
burnout and engagement. The interesting point in comparing Greece and The Netherlands is that both countries
are very different in terms of their work characteristics and the opportunities provided. The most recent
European survey on working conditions shows that the work environment of Greek employees is significantly
more demanding and less resourceful than that of Dutch employees (Eurofound, 2012). More specifically, Greek
employees work longer hours than Dutch, they are at a higher level of risk exposure, they perceive lower levels
of autonomy at work, lower task rotation, and they receive significantly less training. Interestingly, profit-
sharing schemes (where employees receive part of the profits generated by the company they work for) is a
common practice in the Netherlands, but almost negligible in Greece. Also, Greek employees are among the
first in Europe to report that their work affects their health in a negative way. These differences are important
because theoretical models explaining burnout and engagement suggest that demanding work environments (i.e.
characterized by high workload, high risks, and cognitive demands) are responsible for employee burnout, while
resourceful work environments (i.e. characterized by high levels of autonomy, support, employee-friendly
practices) relate to employee engagement (Demerouti, Bakker, Schaufeli, & Nachreiner, 2001).
Furthermore, the level of unemployment has been historically significantly higher in Greece than in The
Netherlands (Eurofound, 2007; 2012). This suggests that problems regarding job insecurity are more prevalent
in Greece. Demerouti et al. (2003) used the Dutch norm scores to classify the Greek respondents of their study
in low, medium, high and very high levels on the three MBI-GS dimensions and they found that one third to half
of the Greek participants was experiencing high or very high levels of burnout. Finally, Dutch were found to be
amongst the most engaged employees in Europe (Taipale, Selander, Anttila, & Nätti, 2011), while studies
outside the domain of occupational health psychology have shown that Dutch individuals are happier than
Greeks (Veenhoven, 2000). These results suggest that Greek employees are more likely to be burned out and
less likely to be engaged than Dutch employees:

Int. Journal of Business Science and Applied Management / Business-and-Management.org
44
Hypothesis 3: Greek employees will report higher levels of burnout and lower levels of work engagement
than Dutch employees.
3 METHOD
3.1 Samples and Procedure
Sample 1 concerned a heterogeneous group of 206 Greek employees (101 men, 49%; 105 women, 51%)
from a large public enterprise (49%; health care employees, administration and technical staff) and from private
profit organizations (i.e. two banks, a department store, a sports union and a travel agency; 51%), where
employees were mainly working in customer-service jobs (e.g., sales). The majority of participants (43.2%)
were between thirty and forty years of age and held a bachelor degree (44.7%). Their mean organizational
tenure was 7.8 years (SD = 5.7), and the response rate was 74%.
Sample 2 included 162 Dutch employees (79 men, 49%; 83 women, 51%). The sample was also
heterogeneous since the questionnaire was administered to both public servants (33%; teachers and nurses), and
employees working in the private sector [therapists (28%), managers (23%), technicians (4%) and
administrators (5%)]. The remaining of the participants (7%) did not report their occupation. The mean age of
participants was 44 years (SD = 8.7). The majority of the participants (53%) held a bachelor degree. Their mean
organizational tenure was 10.9 years (SD = 8.3), and the response rate was 79%.
In both countries, researchers informed the managers or CEOs of the organizations that were approached
about the purposes of the study. After receiving their consent, employees from these organizations were invited
to participate in a study about ‘work-related well-being’. Participants of both samples were approached directly
by the researchers and were asked to fill in a questionnaire about their work life. All contacts between
researchers and participants were face-to-face. In all cases, employees were reassured that participation was
anonymous and that data would be treated confidentially.
3.2 Measures
Burnout was measured with the Dutch (Schutte et al., 2000) and Greek (Demerouti et al., 2003) version of
the MBI-GS (Schaufeli et al., 1996). The MBI-GS includes 16 items that assess the three dimensions of burnout.
Exhaustion is measured with five items, such as: “I feel emotionally drained from my work”. Cynicism is also
assessed with five items, including: “I have become less enthusiastic about my work”. Finally, professional
efficacy is assessed with six items, for example: “I can effectively solve the problems that arise in my work”. All
items are scored on a seven-point scale, ranging from (0) “never” to (6) “every day”. High scores on exhaustion
and cynicism and a low score on professional efficacy indicate burnout. Previous studies that tested the factorial
validity of the MBI-GS (Demerouti et al., 2003; Schutte et al., 2000) have shown that all items load significantly
on the intended factors, save one exception. One item (item 4; “I just want to do my job and not be bothered”) of
the cynicism sub-scale proved to be ambivalent, and did not load significantly on the cynicism factor. For that
reason, as suggested by Schutte et al. (2000), we excluded this item from the following analyses.
Work Engagement was assessed with the Dutch (Schaufeli & Bakker, 2003) and Greek 15-item version of
the UWES. The UWES was translated in Greek from the Dutch original and was checked for accuracy with the
method of back-translation. The UWES items reflect three underlying dimensions, which were measured with
five items each: Vigor (e.g. “At my work, I feel bursting with energy”), Dedication (e.g. “am enthusiastic about
my job”) and Absorption (e.g. “I get carried away when I am working”). All items are scored on a seven-point
scale, ranging from (0) “never” to (6) “every day”. High scores on all three dimensions indicate work
engagement.
3.3 Strategy of Analysis
In order to test Hypotheses 1 and 2, competing models were examined with confirmatory factor analyses
(CFAs; Vandenberg & Lance, 2000), using the AMOS 19.0 software package. The three burnout dimensions
were represented as latent variables that were operationalized by five items (indicators) for exhaustion, four
items for cynicism, and six items for professional efficacy. We followed the same procedure but in a separate
analysis for the three engagement dimensions. These dimensions were also represented as latent variables and
were operationalized by five items for each of the dimensions: vigor, dedication and absorption. In the proposed
model, exhaustion is expected to correlate positively with cynicism and negatively with professional efficacy.
Cynicism is also expected to correlate negatively with professional efficacy. Regarding work engagement,
positive correlations between all three latent variables were expected.
To test Hypothesis 1, we conducted CFAs and we compared -for each national sample separately- the
proposed three-factor model of burnout (MBI-GS), where the underlying items loaded on the proposed factors,
with the following four alternative models: a) three alternative two-factor models (where, in each case, one of
the three factors consists of a combination of two burnout dimensions); and b) a one-factor model (where all

Despoina Xanthopoulou, Arnold Bakker, Aristotelis Kantas and Evangelia Demerouti
45
items are hypothesized to load on a single burnout latent factor). The same procedure was followed for testing
Hypothesis 2, where the proposed three-factor model (vigor, dedication, and absorption) of work engagement
(UWES) was compared with four alternative models for both national samples separately.
In addition, we conducted multigroup CFAs to test the measurement and structural invariance of each scale
across the two national samples (Vandenberg & Lance, 2000). Accordingly, we compared four nested models
for both scales: 1) to test for configural invariance (i.e. the same number of factors best represents the data for
both groups), we tested a multigroup model in which the only invariance constrain was that the exact same
parameters were tested for both national groups, while all these parameters were freely estimated (Model 1); 2)
to test for metric invariance (i.e. all participants, irrespective of their group membership, respond to the items of
the scale in the same way), we tested a model where factor loadings were also constrained to be equal across the
national groups (Model 2); 3) to test for scalar invariance (i.e. participants who have the same score on the latent
construct would obtain the same score on the observed variable irrespective of their group membership), we
imposed additional constraints to Model 2 by setting the item intercepts to be the same across groups as well
(Model 3); and 4) to test for structural invariance (i.e. all latent variables have the same scores and relationships
across groups), we tested a model (Model 4) where, next to equal factor loadings and item intercepts, all factor
variances and covariances were set to be equal across groups.
We used the following indices in order to assess model fit to the data: the chi-square (χ2) statistic and the
related degrees of freedom (df), the goodness-of-fit index (GFI), the comparative fit index (CFI), the root mean
square error of approximation (RMSEA) and the standardized root mean square residual (SRMR). In general a
χ2/df less than 3.0 and GFI and CFI values above .90 indicate an acceptable fit (with >.95 being ideal; Brown,
2006). Further, RMSEA and SRMR values up to .08 indicate a reasonable fit, while values up to .05 indicate an
excellent fit to the data (Hu & Bentler, 1999). In order to compare nested models, we applied the chi-square
difference test, while in the multigroup analyses we used the CFI-difference (ΔCFI) index. Accordingly, a
decrease in the CFI value equal or higher than .01 indicates a significant decrement in model fit and lack of
invariance across groups (Cheung & Rensvold, 2002).
To test Hypothesis 3, we estimated latent mean differences. We chose “Dutch” to serve as the reference
group, and “Greek” to serve as the comparison group. We set the means of the latent factors to be fixed to zero
in the reference group, and to vary freely in the comparison group. Comparisons of latent means were based on
the critical ratio (CR) index (CR > ± 1.96 indicates statistical differences in means). A positive CR value
suggests that the comparison group has higher latent mean values than the reference group. It is important to
note that (full or partial) scalar invariance is a prerequisite first step in order to test for latent mean differences
(Vandenberg & Lance, 2000).
4 RESULTS
4.1 Descriptive Statistics
All scales of both instruments in both samples showed acceptable reliabilities (see Table 1). In the Dutch
sample, intercorrelations between the burnout dimensions and between the engagement dimensions were
significant and in the expected direction. Also, correlations between the burnout and engagement dimensions
were significant and in the expected direction. As for the Greek sample, correlations between the three
engagement dimensions were highly significant, but regarding the burnout dimensions, only exhaustion and
cynicism were correlated. Furthermore, the three engagement scales were moderately correlated with cynicism
and professional efficacy, but not with exhaustion. Likewise, the work engagement scales were stronger
interrelated than the burnout scales, in both national samples.

Int. Journal of Business Science and Applied Management / Business-and-Management.org
46
Table 1: Means, Comparisons of Means, Standard Deviations, Correlations (for Greek Employees below
the Diagonal) and Internal Consistencies (Cronbach’s alphas) of the Burnout (EX, CY, PF) and
Engagement (VI, DE, AB) Scales in the Greek (N =206) and Dutch (N = 162) sample.
Greek Dutch MANOVA results
M SD α M SD α F
EX 3.20 1.47 .88 2.30 1.36 .92 36.71***
CY 2.99 1.43 .84 1.90 1.24 .78 59.50***
PE 4.81 1.06 .85 4.22 0.89 .80 32.99***
VI 4.07 1.22 .85 3.86 1.08 .85 2.96
DE 3.84 1.47 .91 4.07 1.24 .92 2.62
AB 4.01 1.32 .86 3.69 1.06 .81 6.15*
Correlations
EX CY PE VI DE AB
EX .70** -.37** -.58** -.58** -.32**
CY .50** -.52** -.63** -.71** -.51**
PE .09 -.13 .65** .70** .53*
VI -.00 -.18* .59** .81** .80**
DE .00 -.28** .60** .80** .76**
AB .03 -.14* .55** .87** .76**
Note. EX = Exhaustion; CY = Cynicism; PE = Professional Efficacy; VI = Vigor; DE = Dedication, AB = Absorption ; * p
< .05 ; ** p < .01 ; *** p < .001.
4.2 Factor Structure and Invariance of Burnout across Greece and the Netherlands
Hypothesis 1 assumed the invariance of the three-factor structure of the MBI-GS (exhaustion, cynicism,
and professional efficacy) across Greece and the Netherlands. To test this hypothesis, we first conducted CFAs
for each national sample separately, and we compared the proposed three-factor model with four alternative
models, as described in the Method section. As shown on Table 2, the proposed three-factor model of burnout
had an acceptable fit to the data of both national samples. Also, chi-square difference tests showed that the three-
factor structure fitted better to the data of the Greek and Dutch samples than the alternative two and one-factor
models (see Table 2).
Table 2: Fit of Alternative Factor Models of the MBI-GS for the Greek (N = 206) and Dutch (N = 162)
Samples separately: Results of Confirmatory Factor Analyses.
Model χ2 df χ2/ df GFI CFI RMSEA SRMR Comparison Δχ2 df
Greece
I. 3-factor proposed 208.31 87 2.39 .88 .92 .08 .06 -
II. 2-factor (EX, CY+PE) 647.58 89 7.28 .63 .63 .18 .19 I - II 439.27* 2
III. 2-factor (CY, EX+PE) 659.78 89 7.41 .62 .62 .18 .19 I - III 451.47* 2
IV. 2-factor (PE, EX+CY) 448.47 89 5.04 .75 .76 .14 .11 I - IV 240.16* 2
V. 1- factor 892.96 90 9.92 .54 .46 .21 .20 I - V 684.65* 3
The Netherlands
I. 3-factor proposed
II. 2-factor (EX, CY+PE)
III. 2-factor (CY, EX+PE)
IV. 2-factor (PE, EX+CY)
V. 1- factor
147.61
248.33
355.08
236.96
410.28
87
89
89
89
90
1.70
2.79
3.99
2.66
4.56
.89
.79
.71
.82
.67
.95
.87
.79
.88
.75
.07
.11
.14
.10
.15
.06
.09
.13
.08
.13
-
I - II
I - III
I - IV
I - V
100.72*
207.47*
89.35*
262.67*
2
2
2
3
Note. df = degrees of freedom; GFI = goodness-of-fit Index; CFI = comparative fit index; RMSEA = root mean square error
of approximation; SRMR = standardized root mean square residual; * p < .001.
Next, we applied multigroup CFAs to test the invariance across the two national samples. Table 3 shows
that the model with no constraints (Model 1) fit well to the data, supporting configural invariance across the two
national groups. Next, the model where factor loadings were set to be equal across groups (Model 2) also fit
well to the data, while the ΔCFI test showed that the additional constraints that were imposed on this model did
not alter model fit. The next step was to test scalar invariance by setting the item intercepts to be equal across
groups (Model 3). Analyses did not support scalar invariance since the model in which item intercepts were also
set to be equal across groups did not fit well to the data and it caused a meaningful drop in fit (ΔCFI = .07).
Given that full scalar invariance was rejected, we tested whether partial invariance could be supported. In the
case of partial invariance, only a set of parameters is constrained to be invariant across groups, while the rest is
set to be estimated freely. Modifications indices showed that item 1 from the exhaustion scale, items 1, 2 and 5
from the cynicism scale, and item 6 from the professional efficacy scale lacked invariance. When the intercepts
of these items were freely estimated, partial invariance was still not supported, since Model 4 was found to be

Despoina Xanthopoulou, Arnold Bakker, Aristotelis Kantas and Evangelia Demerouti
47
different from Model 2 (ΔCFI = .03). Finally, structural invariance was also not supported (Model 5), since the
model where factor variances and covariances were set to me equal across groups did not fit well to the data. All
in all, these results partly support Hypothesis 1.
Table 3: Test of Invariance of the proposed Burnout (MBI-GS) and Work Engagement (UWES)
Structures across Greece and The Netherlands: Multigroup Confirmatory Factor Analysis (N = 368).
Model χ2 df χ2/ df CFI RMSEA SRMR Comparison ΔCFI
MBI-GS
1. No constraints 355.91 174 2.05 .93 .05 .06 -
2. Equal factor loadings 406.15 186 2.18 .92 .06 .07 1 - 2 .01
3. Equal Intercepts 604.34 201 3.00 .85 .07 .08 2 - 3 .07
4. Partial Scalar Invariance 487.65 196 2.49 .89 .06 .07 2 - 4 .03
5.Equal factor variances /
covariances
563.03 202 2.78 .87 .08 .15 4 - 5 .02
UWES
1. No constraints 553.29 174 3.18 .90 .08 .05 -
2. Equal factor loadings 567.35 186 3.05 .90 .08 .05 1 - 2 .00
3. Equal Intercepts 672.14 201 3.12 .88 .09 .05 2 - 3 .02
4. Partial Scalar Invariance 598.39 198 3.02 .90 .07 .05 2 - 4 .00
5. Equal factor variances /
covariances
626.70 204 3.07 .89 .08 .06 4 - 5 .01
Note. df = Degrees of Freedom; GFI = Goodness-of-Fit Index; CFI = comparative fit index; RMSEA = Root Mean Square
Error of Approximation; SRMR = standardized root square residual.
4.3 Factor Structure and Invariance of Work Engagement in Greece and the Netherlands
To test Hypothesis 2, we followed the same procedure as for Hypothesis 1. Table 4 shows that the
proposed three-factor structure of work engagement fit reasonably well to the data of both samples. Note that
particularly the GFI and RMSEA are sensitive to sample size, and that the values for these indices should be
interpreted with some caution. Importantly, and in line with Hypothesis 2, chi-square difference tests showed
that the proposed three-factor structure of work engagement fit significantly better to the data than all alternative
models tested in both samples (see Table 4).
Table 4: Fit of Alternative Factor Models of the UWES for the Greek (N = 206) and Dutch (N = 162)
Samples separately: Results of Confirmatory Factor Analyses.
Model χ2 df χ2/ df GFI CFI RMSEA SRMR Comparison Δ χ2 df
Greece
I. 3-factor proposed 298.79 87 3.43 .83 .91 .11 .05 - - -
II. 2-factor (VI, DE+AB) 313.07 89 3.52 .82 .90 .11 .05 I - II 14.28* 2
III. 2-factor (DE, VI+AB) 316.18 89 3.55 .83 .90 .11 .05 I - III 17.39* 2
IV. 2-factor (AB, VI+DE) 331.44 89 3.72 .80 .89 .12 .05 I - IV 32.65* 2
V. 1- factor 334.12 90 3.71 .80 .89 .12 .05 I - V 35.33* 3
The Netherlands
I. 3-factor proposed 254.49 87 2.93 .82 .90 .11 .06 - - -
II. 2-factor (VI, DE+AB) 278.12 89 3.12 .80 .89 .12 .07 I - II 23.63* 2
III. 2-factor (DE, VI+AB) 263.99 89 2.97 .81 .90 .11 .06 I - III 9.5* 2
IV. 2-factor (AB, VI+DE) 288.66 89 3.24 .80 .88 .12 .06 I - IV 34.17* 2
V. 1- factor 300.32 90 3.34 .79 .88 .12 .06 I - V 45.83* 3
Note. df = degrees of freedom; GFI = goodness-of-fit Index; CFI = comparative fit index; RMSEA = root mean square error
of approximation; SRMR = standardized root mean square residual; * p < .001.
Next, we estimated the invariance of the three-factor structure of the UWES by means of multigroup CFAs.
Table 3 shows that the model with no constraints (Model 1) fit very well to the data, suggesting that the
proposed three-factor structure of the UWES is invariant across countries. Metric invariance was also supported,
since setting the factor loadings to be equal across samples did not change the fit of the model (ΔCFI = .00;

Int. Journal of Business Science and Applied Management / Business-and-Management.org
48
Model 2). Full scalar invariance was not supported (Model 3), because adding constraints to the intercepts
across groups caused a significant decrease in the model fit (ΔCFI = .02). Examination of the modification
indices showed that item 4 of the vigor scale, item 3 of the dedication scale, and item 5 of the absorption scale
lacked invariance. Thus, we tested a partial invariance model (Model 4), where the intercepts of these items
were allowed to vary freely across groups. Results supported partial scalar invariance since the fit of the latter
model and the fit of the metric model did not vary significantly (ΔCFI = .00). Finally, results also supported
structural invariance (Model 5). Overall, results concerning the factor structure and the invariance of UWES
across Greece and the Netherlands fully support Hypothesis 2.
4.4 Differences in Burnout and Work Engagement between the Greek and Dutch samples
To test Hypothesis 3, we examined latent mean differences. Partial or full scalar invariance is a prerequisite
for testing differences between the means in the two national samples. Given that both full and partial scalar
invariance was not supported for the MBI-GS, latent mean differences could not be tested. As concerns the
UWES, for which partial scalar invariance was supported, analyses showed that the mean scores of Greek and
Dutch employees did not vary for any of the three dimensions of work engagement (for vigor: CR = 1.03, ns; for
dedication: CR = 1.15, ns; and for absorption: CR = .16, ns). These analyses reject Hypothesis 3. We further
tested potential differences between Greek and Dutch employee in the burnout and work engagement scores by
applying the less robust multivariate analyses of variance (MANOVA). As shown in Table 1 and consistent with
Hypothesis 3, Greek employees scored significantly higher than the Dutch on the exhaustion [F (1, 368) =
36.71; p < .001] and cynicism [F (1, 368) = 59.50; p < .001] dimensions of burnout. However, unexpectedly,
Greek employees also scored significantly higher than Dutch employees on the professional efficacy dimension
of burnout [F (1, 368) = 32.98; p < .001], and the absorption dimension of engagement [F (1, 368) = 6.15; p <
.05). Thus, the MANOVA results partly support Hypothesis 3.
5 DISCUSSION
The present study examined the factor structure and invariance of the most frequently used instruments to
assess burnout (MBI-GS; Schaufeli et al., 1996) and work engagement (UWES; Schaufeli & Bakker, 2010;
Schaufeli et al., 2002a; b) among heterogeneous samples of Greek and Dutch employees. In addition, we
compared employee levels of burnout and engagement in Greece and the Netherlands by estimating latent mean
differences. The innovative part of our study is that –to our knowledge- this is the first attempt to investigate the
factor structure of the Greek version of the UWES. Furthermore, despite the fact that there is a significant
number of studies focusing on the psychometric properties of the MBS-GS and the UWES (for a review see,
Schaufeli & Bakker, 2010), we are not aware of any other study investigating full invariance (including scalar
invariance) across national or occupational groups.
5.1 Measuring Burnout
Hypothesis 1 stated that the three-factor structure of the MBI-GS (exhaustion, cynicism, and reduced
professional efficacy) would be invariant across Greece and the Netherlands. As expected and in line with
previous studies (e.g., Mäkikangas et al, 2011) the results of CFAs showed that the proposed three-factor model
of burnout fit well to the data in both national samples. Moreover, the three-factor model fit better to the data
than alternative two- and one-factor models, in which items of two or all three dimensions were collapsed.
Furthermore, the results of multigroup CFAs supported configural and metric invariance. Support for configural
invariance suggests that the three underlying factors (i.e. exhaustion, cynicism, and professional efficacy) best
represent the burnout concept both in Greece and in the Netherlands, while support for metric invariance reveals
that Greek and Dutch employees respond to the items of the MBI-GS in the same way. However, the results did
not support scalar invariance suggesting that the strength of the relationship between the constructs and the
specific scale items varies across the two groups. Also, failure to provide evidence for structural invariance
indicated that -to a certain degree- the strength of the relationship between the latent variables may be different
across groups (Tsaousis & Kazi, 2013).
Despite the fact that scalar and structural invariance were not supported, our results suggest that the MBI-
GS can be used in both Greece and The Netherlands, since responses to this burnout instrument do not seem to
be strongly influenced by specific characteristics of the employees working in these countries. The results show
that the phrasing of the items is adequate for cross-cultural comparisons, which is consistent with previous
findings in a Greek sample of employees (Demerouti et al., 2003), and findings among samples from Finland,
Norway, The Netherlands (Schutte et al., 2000), and Spain (Schaufeli et al., 2002a).
5.2 Measuring Work Engagement
Hypothesis 2 stated that the three-factor structure of the UWES (vigor, dedication and absorption) would
be invariant across Greece and The Netherlands. The results of CFAs confirmed that the proposed three-factor

Despoina Xanthopoulou, Arnold Bakker, Aristotelis Kantas and Evangelia Demerouti
49
structure of the UWES fitted reasonably well to the data of both national samples, and performed better than
alternative two- and one-factor models. However, it is interesting to note that although formal chi-square
difference tests revealed that the three-factor model was superior to alternative two-factor models, the fit indices
suggested that particularly the model collapsing the vigor and absorption items into one dimension fitted also
fairly well to the data. These findings are in line with the previous studies that have been conducted in The
Netherlands and Spain (Schaufeli et al., 2002a, 2002b), as well as the multinational study of Schaufeli et al.
(2006) who showed that the one-factor model of the UWES fitted reasonably well to the data –just like the
proposed three-factor model. However, in the latter study the shorter, 9-item version of the UWES was used.
Nevertheless, Schaufeli et al. proposed that for practical purposes the total score of the UWES can be used as
the sole indicator of work engagement.
Importantly, the findings of the present study provided strong support for the invariance of the UWES
across Greece and the Netherlands since we found evidence for configural, metric, partial scalar, and structural
invariance. These findings suggest that the UWES is a very good instrument not only to measure engagement in
Greece and the Netherlands, but to also make comparisons across the two countries since Greek and Dutch
employees: a) recognize the same structure in engagement; b) respond to the items of the scale in a similar way;
3) show similar relationships between the latent constructs and the items; and 4) show similar relationship
among the latent variables. Another reason why these results are of particular importance is that none of the
previous studies on the factorial invariance of the UWES across nations or occupations has tested for and
supported scalar invariance (see Schaufeli & Bakker, 2010). Thus, this study adds to the literature by showing
for the first time that the UWES is an accurate tool if one is interested in comparing work engagement means
across groups.
5.3 Mean Differences
Hypothesis 3 stated that Greeks would be more burned out and less engaged than Dutch employees. To test
this hypothesis we examined latent mean differences for the UWES scale, since scalar invariance was supported
only for this scale (Vandenberg & Lance, 2000). The results of these analyses revealed that Greek and Dutch
employees did not differ significantly in their mean levels of vigor, dedication, and absorption. The less
elaborate results of the MANOVA suggested that Greek employees showed higher scores on exhaustion and
cynicism (the core dimensions of burnout), which is in line with previous findings (Demerouti et al., 2003).
However, contrary to expectations, Greeks also appeared to be more efficacious and more absorbed in their
work than Dutch. However, the findings of the MANOVAs should be dealt with caution since these were not
supported by the latent mean differences analyses (Tsaousis & Kazi, 2013).
5.4 Limitations of the Present Study and Suggestion for Future Research
The present study has certain limitations. First, although both samples are heterogeneous and cover a wide
range of different occupations, it is well conceivable that the Greek sample included slightly different
occupations than the Dutch. Future studies should try to recruit samples that are more comparable in terms of
occupations to enable more rigorous tests of the factor structure of burnout and engagement. Also, we have
restricted in comparing only two countries, while the study of at least three different national contexts could
allow more extensive cross-national comparisons. Another limitation of the study is its cross-sectional nature.
Thus, we cannot support structural invariance over time. Longitudinal studies are necessary to validate the
findings of the current study (for an example, see Mäkikangas et al., 2011). Finally, the present study restricted
itself to testing the factor structure of burnout and engagement, as well as comparing burnout and engagement
levels across Greece and The Netherlands, while it did not investigate similarities or differences as concerns the
psychological processes explaining employee well-being across countries.
5.5 Practical Implications
Burnout and engagement are considered to be significant indicators of employee well-being because they
relate to important outcomes for organizations (see Bakker et al., 2008; 2012; Halbesleben, 2010). Managers are
particularly interested in burnout because it relates to reduced employee performance (Bakker et al., 2008), as
well as in engagement that has been found to relate to financial profit (Xanthopoulou et al., 2009) and client
loyalty (Salanova et al., 2005). Therefore, practitioners are interested in reducing employee burnout and
increasing engagement. However, in order to do so, they first need to have valid instruments to measure these
states. The findings of this study contribute to organizational practice by showing that the MBI-GS (Schaufeli et
al., 1996) and the UWES (Schaufeli & Bakker, 2010) are valid instruments that can provide robust estimations
of employee levels of burnout and work engagement, respectively. Importantly, the results of this study suggest
that particularly the UWES may provide not only accurate estimations of engagement but also accurate mean
comparisons across different sub-samples. Despite focusing only on two countries, the fact that we have
examined heterogeneous occupational samples allows a certain degree of generalizability since our findings
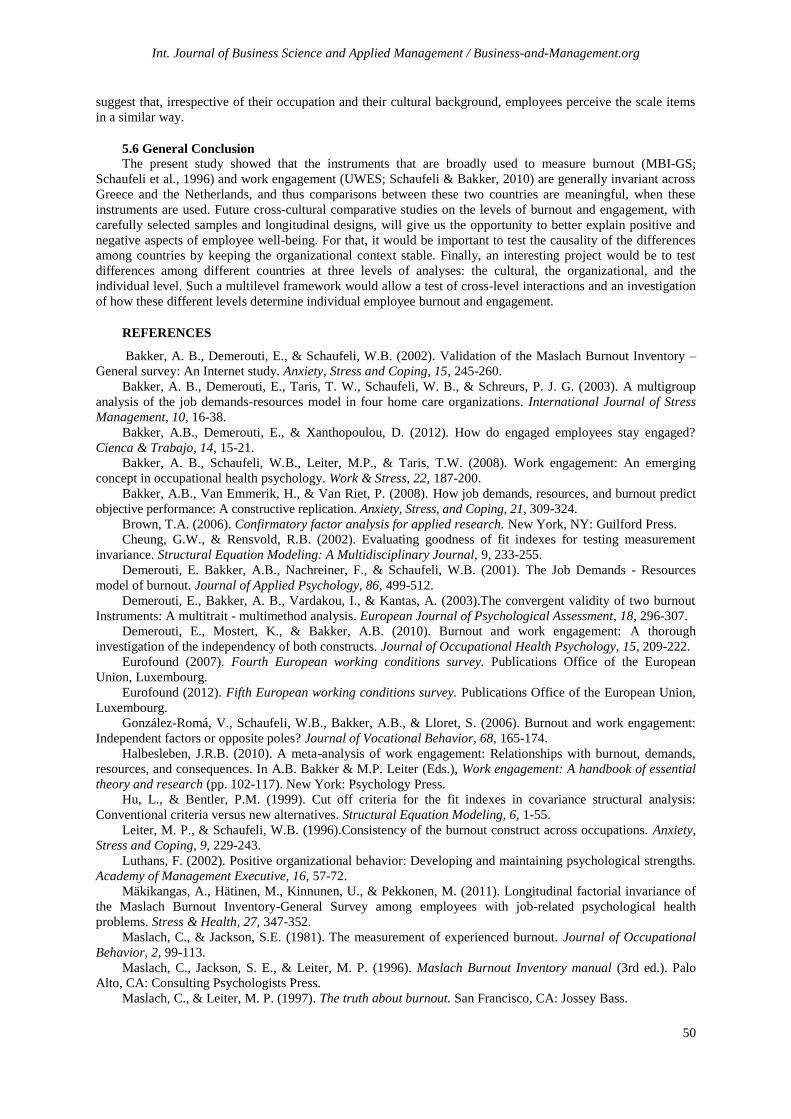
Int. Journal of Business Science and Applied Management / Business-and-Management.org
50
suggest that, irrespective of their occupation and their cultural background, employees perceive the scale items
in a similar way.
5.6 General Conclusion
The present study showed that the instruments that are broadly used to measure burnout (MBI-GS;
Schaufeli et al., 1996) and work engagement (UWES; Schaufeli & Bakker, 2010) are generally invariant across
Greece and the Netherlands, and thus comparisons between these two countries are meaningful, when these
instruments are used. Future cross-cultural comparative studies on the levels of burnout and engagement, with
carefully selected samples and longitudinal designs, will give us the opportunity to better explain positive and
negative aspects of employee well-being. For that, it would be important to test the causality of the differences
among countries by keeping the organizational context stable. Finally, an interesting project would be to test
differences among different countries at three levels of analyses: the cultural, the organizational, and the
individual level. Such a multilevel framework would allow a test of cross-level interactions and an investigation
of how these different levels determine individual employee burnout and engagement.
REFERENCES
Bakker, A. B., Demerouti, E., & Schaufeli, W.B. (2002). Validation of the Maslach Burnout Inventory –
General survey: An Internet study. Anxiety, Stress and Coping, 15, 245-260.
Bakker, A. B., Demerouti, E., Taris, T. W., Schaufeli, W. B., & Schreurs, P. J. G. (2003). A multigroup
analysis of the job demands-resources model in four home care organizations. International Journal of Stress
Management, 10, 16-38.
Bakker, A.B., Demerouti, E., & Xanthopoulou, D. (2012). How do engaged employees stay engaged?
Cienca & Trabajo, 14, 15-21.
Bakker, A. B., Schaufeli, W.B., Leiter, M.P., & Taris, T.W. (2008). Work engagement: An emerging
concept in occupational health psychology. Work & Stress, 22, 187-200. Bakker, A.B., Van Emmerik, H., & Van Riet, P. (2008). How job demands, resources, and burnout predict
objective performance: A constructive replication. Anxiety, Stress, and Coping, 21, 309-324.
Brown, T.A. (2006). Confirmatory factor analysis for applied research. New York, NY: Guilford Press.
Cheung, G.W., & Rensvold, R.B. (2002). Evaluating goodness of fit indexes for testing measurement
invariance. Structural Equation Modeling: A Multidisciplinary Journal, 9, 233-255.
Demerouti, E. Bakker, A.B., Nachreiner, F., & Schaufeli, W.B. (2001). The Job Demands - Resources
model of burnout. Journal of Applied Psychology, 86, 499-512.
Demerouti, E., Bakker, A. B., Vardakou, I., & Kantas, A. (2003).The convergent validity of two burnout
Instruments: A multitrait - multimethod analysis. European Journal of Psychological Assessment, 18, 296-307.
Demerouti, E., Mostert, K., & Bakker, A.B. (2010). Burnout and work engagement: A thorough
investigation of the independency of both constructs. Journal of Occupational Health Psychology, 15, 209-222.
Eurofound (2007). Fourth European working conditions survey. Publications Office of the European
Union, Luxembourg.
Eurofound (2012). Fifth European working conditions survey. Publications Office of the European Union,
Luxembourg.
González-Romá, V., Schaufeli, W.B., Bakker, A.B., & Lloret, S. (2006). Burnout and work engagement:
Independent factors or opposite poles? Journal of Vocational Behavior, 68, 165-174.
Halbesleben, J.R.B. (2010). A meta-analysis of work engagement: Relationships with burnout, demands,
resources, and consequences. In A.B. Bakker & M.P. Leiter (Eds.), Work engagement: A handbook of essential
theory and research (pp. 102-117). New York: Psychology Press.
Hu, L., & Bentler, P.M. (1999). Cut off criteria for the fit indexes in covariance structural analysis:
Conventional criteria versus new alternatives. Structural Equation Modeling, 6, 1-55.
Leiter, M. P., & Schaufeli, W.B. (1996).Consistency of the burnout construct across occupations. Anxiety,
Stress and Coping, 9, 229-243.
Luthans, F. (2002). Positive organizational behavior: Developing and maintaining psychological strengths.
Academy of Management Executive, 16, 57-72.
Mäkikangas, A., Hätinen, M., Kinnunen, U., & Pekkonen, M. (2011). Longitudinal factorial invariance of
the Maslach Burnout Inventory-General Survey among employees with job-related psychological health
problems. Stress & Health, 27, 347-352.
Maslach, C., & Jackson, S.E. (1981). The measurement of experienced burnout. Journal of Occupational
Behavior, 2, 99-113.
Maslach, C., Jackson, S. E., & Leiter, M. P. (1996). Maslach Burnout Inventory manual (3rd ed.). Palo
Alto, CA: Consulting Psychologists Press.
Maslach, C., & Leiter, M. P. (1997). The truth about burnout. San Francisco, CA: Jossey Bass.

Despoina Xanthopoulou, Arnold Bakker, Aristotelis Kantas and Evangelia Demerouti
51
Maslach, C., & Leiter, M. P. (2008). Early predictors of job burnout and engagement. Journal of Applied
Psychology, 93, 498-512.
Maslach, C., Schaufeli, W. B., & Leiter, M. P. (2001). Job burnout. Annual Review of Psychology, 52, 397-
422.
Nerstad, C.G., Richardsen, A.M., & Martinussen, M. (2010). Factorial validity of the Utrecht Work
Engagement Scale (UWES) across occupational groups in Norway. Scandinavian Journal of Psychology, 51,
326-333.
Salanova, M., Agut, S., & Peiró, J.M. (2005). Linking organizational resources and work engagement to
employee performance and customer loyalty: The mediation of service climate. Journal of Applied Psychology,
90, 1217-1227.
Schaufeli, W.B., & Bakker, A.B. (2001). Werk en welbevinden: Naar een positieve benadering in de
Arbeids -en Gezondheidspsychologie [Work and well-being: Towards a positive Occupational Health
Psychology]. Gedrag & Organisatie, 14, 229-253.
Schaufeli, W.B., & Bakker, A.B. (2003). The Utrecht Work Engagement Scale (UWES). Test manual.
Utrecht, The Netherlands: Department of Social & Organizational Psychology.
Schaufeli, W.B., & Bakker, A.B. (2004). Job demands, job resources and their relationship with burnout
and engagement: A multi - sample study. Journal of Organizational Behavior, 25, 1-23.
Schaufeli, W.B., & Bakker, A.B. (2010). Defining and measuring work engagement: Bringing clarity to the
concept. In A.B. Bakker & M.P. Leiter (Eds.), Work engagement: A handbook of essential theory and research
(pp. 10-24). New York: Psychology Press.
Schaufeli, W.B., Bakker, A.B., & Salanova, M. (2006).Work engagement with a short questionnaire: A
cross-national study. Educational and Psychological Measurement, 66, 701-716.
Schaufeli, W. B., & Greenglass, E. R. (2001). Introduction to special issue on burnout and health.
Psychology and Health, 16, 501-510.
Schaufeli, W. B., Leiter, M. P., Maslach, C., & Jackson, S. E. (1996). Maslach Burnout Inventory –
General Survey. In Maslach, C., Jackson, S. E., & Leiter, M. P. (Eds.), The Maslach Burnout Inventory-Test
manual (3rd ed.). Palo Alto, CA: Consulting Psychologists Press.
Schaufeli, W. B., Martinez., I. M., Marques-Pinto, A. M., Salanova, M., & Bakker, A. B. (2002a). Burnout
and engagement in university students. A cross-national study. Journal of Cross-Cultural Psychology, 33, 464-
481.
Schaufeli, W. B., Salanova, M., González-Romá, V., & Bakker, A. B. (2002b). The measurement of
engagement and burnout: A two sample confirmatory factor analytic approach. Journal of Happiness Studies, 3,
71-92.
Schaufeli, W. B., & Van Dierendonck, D. (1993). The construct validity of two measures. Journal of
Organizational Behavior, 14, 631-647.
Schutte, N., Toppinnen, S., Kalimo, R., & Schaufeli, W. B. (2000). The factorial validity of The Maslach
Burnout Inventory- General Survey across occupational groups and nations. Journal of Occupational and
Organizational Psychology, 73, 53-66.
Shirom, A. (2003). Job-related burnout: A review. In J. Campbell Quick, & L.E. Tetrick (Eds.), Handbook
of occupational health psychology (pp. 245-264). Washington, DC: Americal Psychological Association.
Seligman, M. E. P., & Csikszentmihalyi, M. (2000). Positive psychology: An introduction. American
Psychologist, 55, 5-14.
Smith, P. B., Fischer, R., & Sale, N. (2001). Cross-Cultural Industrial Organisational Psychology. In C.L.,
Cooper, & I.T., Robertson (Eds), International Review of Industrial and Organizational Psychology, 16, 147-
193.
Taipale, S., Selander, K., Anttila, T., & Nätti, J. (2011). Work engagement in eight European countries:
The role of job demands, autonomy, and social support. The International Journal of Sociology and Social
Policy, 31, 486-504.
Taris, T. W., Schreurs, P. J. G., & Schaufeli, W. B. (1999). Construct validity of The Maslach Burnout
Inventory – General Survey: A two - sample examination of its factor structure and correlates. Work and Stress,
13, 223-237.
Tsaousis, I., & Kazi, S. (2013). Factorial invariance and latent mean differences of scores on trait
emotional intelligence across gender and age. Personality and Individual Differences, 54, 169-173.
Vandenberg, R.J., & Lance, C.E. (2000). A review and synthesis of measurement of the measurement
invariance literature: Suggestions, practices, and recommendations for organizational research. Organizational
Research Methods, 3, 4-70.
Veenhoven, R. (2000). Freedom and happiness: A comparative study in forty-four nations in the early
1990’s. In Diener, E. & Suh, E.M. (Eds.), Culture and subjective well-being. MIT Press.

Int. Journal of Business Science and Applied Management / Business-and-Management.org
52
Xanthopoulou, D., Bakker, A.B., Demerouti, E., & Schaufeli, W.B. (2009). Work engagement and
financial returns: A diary study on the role of job and personal resources. Journal of Occupational &
Organizational Psychology, 82, 183-200.

Int. Journal of Business Science and Applied Management, Volume 7, Issue 2, 2012
Managing change in performance measures – An inter-company
case study approach
Mohammed Salloum
Volvo Construction Equipment, Technology, Department of Finance and Business Control
Hällby, 635 10 Eskilstuna, Sweden
Telephone: +46 737 65 63 88
Email: [email protected]
Stefan Cedergren
Mälardalen University, School of Innovation, Design and Engineering
Smedjegatan 37, 632 20 Eskilstuna, Sweden
Telephone: +46 760 50 16 54
Email: [email protected]
Abstract
The field of performance measurement and management (PMM) is well filled with frameworks, models and
guidelines addressing what to measure and how to design a performance measurement system (PMS). However,
what has been less examined so far is how to ensure that PM evolve in tandem with their environments. Further,
the few approaches available today are prescriptive and outlines how or what practitioners should do in order to
manage change in their PM. Thus, a gap exists in understanding how organisations manage change in their PM
in practice. Thus, the purpose of this paper is to outline and compare the approaches of three case companies for
managing PM change. In order to fulfil the purpose of the paper, the data presented has been collected through
the deployment of case studies. The choice of case studies as means for data collection stems from the
possibility of an in-depth and holistic examination of the formulated phenomenon. All three case companies
belong to the same company-group that operates within the transportation industry. The industrial footprint of
the company is global with operations and sales spread out over the world. The findings suggest that all three
companies have processes in place for managing change in PM. However, the approaches differ in design and
context. Even though the case companies had different approaches in place to manage change in PM, they
shared several commonalities. Commonalities were shared in the way of execution, process input and challenges
in IT and culture. Furthermore, employee involvement seemed to be the biggest challenge for all three
companies. The findings put forward in this paper are limited as they are confined to three companies from the
same company-group. More studies, both from within and outside the company-group, are needed in order to
establish a solid base of empirical data for generalisation. However, this paper makes a contribution both
through describing how three companies manage PM change and through elaborating on the underlying factors
affecting functionality.
Keywords: performance measurement, performance measurement systems, performance management

Int. Journal of Business Science and Applied Management / Business-and-Management.org
54
1 INTRODUCTION
Performance measures (PM) are used in organisations for a wide array of reasons: to gauge performance
(Slack et al., 2004), direct behaviour and improve motivation (Spitzer, 2007), continuously improve processes
(Cross and Lynch, 1992), enhance productivity (Bernolak, 1997), identify areas of attention, improve
communication, increase accountability (Waggoner et al., 1999), implement strategy (Kaplan and Norton,
2001), support goal achievement (Tapinos et al., 2005) and provide information on strategy implementation
(Neely, 1999). Regardless of the reason to why PM are deployed, it is widely recognised in the literature that
PM need to be aligned with the strategic priorities, as well as the internal and external environments of the
organisation (Neely et al., 1996; Bourne et al., 2000; Bititci et al., 2001; McAdam and Bailie, 2002; Hass et al.,
2005; Lima et al., 2009). However, as these strategies and business environments are dynamic in nature
(Simons, 1995), organisations need to ensure that they are capable of managing change in their PM (Bititci et
al., 2000; Kennerley et al., 2003). Sticking to your PM for too long has been described by Likierman (2009) as
one of the five traps of performance measurement.
The field of performance measurement and management (PMM) is well filled with frameworks, models
and guidelines addressing what to measure and how to design a performance measurement system (PMS)
(Paranjape et al., 2006), most notably the Balanced Scorecard (Kaplan and Norton, 1992). However, what has
been less examined so far, is how to ensure that PM evolve in tandem with their environments (Kennerley and
Neely 2003). Barrows and Neely (2012) argue that contemporary methods do not adequately address the
challenges associated with managing performance in an increasingly turbulent business environment. Further,
the few approaches available today are prescriptive and outlines how or what practitioners should do in order to
manage change in their PM. None of the approaches take a descriptive stance and outlines how organisations
take on the challenge today. Thus, a gap exists in understanding how organisations manage change in their PM
in practice (Bourne, 2008). This gap is further amplified by the fact that only a few organisations have
procedures in place to manage the change of their PM (Neely, 1999; Bititci et al., 2002).
With this background in mind, the purpose of this paper is to outline and compare the approaches of three
case companies for managing PM change. The motive for the paper is to bridge the knowledge gap, by
contributing to the understanding of how PM change is managed in practice and assist in the development of
adequate theoretical models by shedding light on the problems encountered in practice. The paper is divided into
six sections. The following section presents the theoretical background. The third section outlines the
methodological approach and presents the case studies. This is followed by a presentation of the empirical
findings. The succeeding section then contrasts the empirical and theoretical findings through a cross-case
analysis. The sixth section summarises the findings and discusses the necessities of a future research agenda,
highlights the contributions and underlines the limitations of the conducted research.
2 THEORETICAL BACKGROUND
Even though change in PM, in contrast to design of PM, remains an under-researched area, several
academics have addressed the topic over the last decade. The progress made so far is presented in this section.
Neely et al. (2002b) argue that a process needs to be in place in order to ensure that temporary PM are
abolished and indispensable PM are fine-tuned continuously. For this purpose, an audit with 10 questions is
provided within their Performance Prism framework. Kennerley and Neely (2002; 2003) list a process that that
reviews, modifies and deploys PM as one of four critical factors in their framework for keeping PMS up to date.
Neely et al. (2002a) argue that PMS are often allowed to expand to the extent that they become unmanageable
and thus a PM review process needs to be in place. It is underlined that the understanding of the process evolves
over time. Medori and Steeple (2000) concurs and lists periodic maintenance as the last step in their framework
for auditing and enhancing PMS. They argue that a periodical PMS review is required as PM relevant at one
particular moment in time may become redundant at another point. Meekings (2005) has developed a set of
requirements for a functional review process, including a defined structure, connection throughout the
organisation, deliver value and PM change management. Kaplan and Norton (2005; 2008) argue that two
parameters are needed for managing PM change, a clearly defined and recurring process, and the establishment
of an entity responsible for its management and success. Bourne et al. (2000) support and develop earlier
findings by arguing that four processes need to be in place to review targets of current measures, review current
measures, develop new measures and to challenge the strategy. Bititci et al. (2000) highlights in their dynamics
PMS model that a PM review mechanism is needed which uses the performance information provided by the
internal and external monitors. Further, a deployment system is also required in order to revise objectives and
priorities to business units, processes, and activities using performance measures are required.
Besides the review process, the role of organisational culture is emphasised in the literature. Waggoner et
al. (1999) underline the impact that organisational culture can have on PMS evolution. They argue that a culture,
which discourages risk taking and innovation, can block steps that are essential for successfully changing a

Mohammed Salloum and Stefan Cedergren
55
PMS. Kennerley and Neely (2002; 2003) concur and underline the need of a culture within the organisation that
ensures that the value of measurement, and the importance of maintaining relevant and appropriate PM are
appreciated (Table 1). Salloum and Wiktorsson (2011) argue that in order to realise a dynamic PMS, a culture is
needed that encourages organisational involvement, openness, information sharing, and resource availability.
Farris et al. (2011) identified two critical factors for a supportive organisational culture in their investigation of
the PM review process: employee empowerment (including focus on teamwork, ownership of problems,
participation and entrepreneurship) and a focus on continuous improvement.
Table 1: Barriers and enablers for culture (Kennerley et al., 2003)
Culture Barriers to Measures Evolution Culture Enablers of Measures Evolution
Management inertia towards measures due to other
priorities
Ad hoc approach to measurement
Measures not aligned to strategy
Actions not aligned to measures
Lack of management concern for non-investor
stakeholders
Senior management sponsorship
Consistent communication of multidimensional
performance to staff
Open and honest application of measures
No blame / No game environment
Integration and alignment of reward systems
Further, the role of management is another factor that is recurring in the literature. Waggoner et al. (1999)
highlight the impact and importance of management from several perspectives; top-level support, internal
influence, process, and transformational issues. Searcy (2011) underlines the influence that senior management
has on the change of PM. In order to succeed with the implementation of changes, senior management must
ensure that their support is apparent, their expectations are clear, and that the appropriate human, technological,
and financial resources are available for facilitating change. Spitzer (2007) concurs and underlines that PM
change has to be driven by the leader, from the top of the organisation. Kennerley and Neely (2002; 2003) argue
that management commitment and training are two factors needed in order to facilitate PMS evolution. Further,
Kennerley et al. (2003) highlight the risk of management inertia towards PM as a barrier for evolution. In an
empirical study conducted at a large manufacturing unit, it was concluded that management commitment, style,
competence, and politics are factors that have a high impact on the dynamic abilities of a PMS (Salloum and
Wiktorsson, 2011). Kennerley and Neely (2002; 2003) further stress the availability of flexible information
technology to enable the collection, analysis and reporting of appropriate data as crucial for the evolution of a
PMS (Table 2). Wettstein and Kueng (2002) argue that IT capabilities are pivotal for initiating and accelerating
PMS change. They argue that IT consistently offers new opportunities to automate processes, enhance
communication, and develop data analysis sequences. In the integrated model forwarded by Bititci et al. (2000),
the required capabilities for dynamic PMS are divided into two categories, framework capabilities and IT
platform capabilities. For the IT platform, four requirements were identified:
Able to provide an executive information system.
Capable of accommodating and incorporating all the elements of the framework.
Integrated within the existing business systems.
Capable of handling simple rules, such as alarms and warning signals, to facilitate performance
management.
Table 2: Barriers and enablers for systems (Kennerley et al., 2003)
System barriers to Measures Evolution System Enablers of Measures Evolution
Inflexible legacy systems
Poorly or partially implemented ERP systems
Difficult to tailor ‘off-the-shelf’ performance
reporting software
Poor use of graphical representation
Excess of raw data
Investment in IT hardware and software
Data mining / warehousing capability
Readily customisable information systems
Internal systems development and adaptation
capability
2.1 Synthesising the theoretical background
The advancements within the PMM field regarding PM change can be perceived through two perspectives,
structural and behavioural. The structural perspective stresses the need for processes, mechanisms and
procedures for managing PM change. Furthermore, within the structural perspective, emphasis is put on the
capabilities and flexibility of the IT-systems. The need to have a process/mechanism/procedure in place for
continuously reviewing and changing PM is a feature that the researchers in general highlight as important.
However, how the process/mechanism ought to be designed and function is not agreed upon. The previous
research ranges from only mentioning the need for a review process (Medori and Steeple, 2000) to literature

Int. Journal of Business Science and Applied Management / Business-and-Management.org
56
studies (Waggoner et al., 1999) and models for how manage PM change (Bititci et al., 2000). Some frameworks
(Neely et al., 2002a; Bourne et al., 2000) elaborate on the responsibilities of such a process but provide little
direction on how it might take shape in practice. Others (Kennerley and Neely, 2002; Neely et al, 2002a) debate
and argue more on the design by outlining important factors to consider, questionnaires to deploy, and
management tools to implement. From a behavioural perspective, the role of senior management, culture and
employee involvement/empowerment are all underlined as important factors (Waggoner et al., 1999; Kennerley
and Neely, 2002; Kennerley and Neely, 2003; Salloum and Wiktorsson, 2011; Farris et al., 2011).
Previous research generally neglects the context that PM operates in and research within manufacturing
organisations is missing. PM are deployed across organisations, from executive management teams to shop-
floor teams. The further down in the organisation you look, the more PM you will find in need of review.
Hence, any functional review process to work in practice needs to take a wide perspective and incorporate the
whole organisation. The approaches presented in the theoretical background appear to take a managerial rather
than an organisational perspective to the review of PM. Moreover, PM works in open production systems,
heavily influenced by their temporal, cultural, and social contexts. In practice, PM are surrounded by a
considerable amount of contingency (Tangen, 2005).
Thus, the final applicability and functionality can depend upon a number of factors beyond the actual
review process. In regards to the purpose of this paper the theoretical foundation is limited. None of the previous
publications neither illustrate how PM change is managed in practice nor takes an organisation-wide
perspective. Hence, no research has been found that can be contrasted with the empirics presented in this paper.
Instead, the empirics will be put in juxtaposition to the characteristics and advocacies of the theoretical
background and discussed from the basis of commonalities and divergences.
3 METHOD
In order to fulfil the purpose of the paper, the data presented has been collected through the deployment of
case studies (Table 3). The choice of case studies as means for data collection stems from the possibility of an
in-depth and holistic examination of the formulated phenomenon (Merriam, 1994; Bell, 1999). The unit of
analysis (Yin, 1994) in all three cases has been the way of working for managing change in PM. Three factors
have guided the selection of case companies; the existing procedures for handling PM change at each case
company, the knowledge about the company practices that the researcher could obtain before the case execution
and the possibility to get unrestricted access to interviewees and databases.
All three case companies belong to the same company-group that operates within the transportation
industry. The industrial footprint of the company is global with operations and sales spread out over the world.
In total the case company employs over 100 000 individuals worldwide with sales of 35 billion EURO. None of
the three case companies operate within the same business area and all case studies were executed within an 18
months span (Table 3).
The theoretical findings presented in Section 2 played several important roles in the research. It has helped
to develop sharper and more profound objectives and questions in line with the arguments by Yin (1994).
Further, it has also served as an initial guide to the case study design and data collection and as a part of the
iterative process of data collection and analysis (Eisenhardt, 1989). The interview questionnaires used within the
interview studies have been based on the literature presented in the theoretical background. The interview
questionnaires consisted of three parts. The initial part focused on the design and features of the deployed PMS.
The second part revolved around how the case company managed PM change whilst the concluding part
focused on the factors and mechanisms that, in the perception of the interviewee, affected the management of
PM change. Each case study was analysed in isolation through of data reduction, theme clustering and pattern-
matching (Miles and Huberman, 1994; Yin, 1994; Merriam 1994) before the cross-case analysis. The cross-case
analysis was executed in line with what is advocated by Eisenhardt (1989) (Table 3).
Validity and reliability are highlighted by Yin (1994) as important research quality factors to consider. In
order to ensure validity, the research conducted has been structured in a logical flow with problem statement,
current state of the art and empirical investigations. The end-result describes how the studied phenomenon acts
in real organisational settings. Further, representative case companies and triangulation between data collection
components have been after sought (Table 3). Considerations in regards to the validity and reliability have to be
made in the case study design phase as it deals to a great extent with the choice of case studies/companies. By
collecting data from several companies the risk of conducting research in an exceptional and non-generalisable
context is mitigated. Further, Yin (1994), argues that the concept of analytical generalisation is useful for
establishing validity. Analytical generalisation dictates that the concluding research findings ought to be
juxtaposed against the existing base of theory. The comparison will underline the gap between the research
findings and the existing theory and highlight, depending on the extent of the gap, if more research is needed.
Throughout this paper, the theoretical findings have been compared to their empirical dittos. Finally, all the
documentation related to respective case study was stored in specific folders as highlighted by Yin (1994).

Mohammed Salloum and Stefan Cedergren
57
Table 3: Deployed case study methodology
Case company 1 (CC1) Case company 2 (CC2) Case company 3 (CC3) Reference
Employee size 800 1000 1100
Geographical
location Oceania Europe Europe
Business area Heavy automotives Complex components Heavy machines
Number of
Interviews
20 interviews (from five
organisational levels)
19 interviews (from five
organisational levels)
21 Interviews (from six
organisational levels)
Interviewees
Site manager, production
manager, finance manager,
production engineering
manager, logistics manager
& quality manager. Six first-
line managers. Six team
leaders and two assemblers.
Overall production
manager, 2 production
function managers, 4
second-line managers, 6
first-line managers, 3 team-
leaders, 3 assemblers
Site manager, production
manager, quality manager,
logistics manager, finance
manager, HR manager,
financial controller,
logistics engineer, HR-
partner, 6 first-line
managers, 2 second-line
managers, 2 team-leaders, 2
operators.
Interview
durations 7-51 minutes per interview 4-58 minutes per interview 5-48 minutes per interview
Interview
material
Transcribed and validated by
interviewees
Transcribed and validated
by interviewees
Transcribed and validated
by interviewees
Lantz, 1993;
Denscombe,
2000
Direct
observations
Factory tours, PM review
meetings, PM reporting
meetings
Factory tours, PM reporting
meetings
Factory tours, PM review
meetings, PM reporting
meetings
Documentation
(PDF, Excel,
Word and
Powerpoint
files)
PM scorecards, PM reports,
PM process descriptions, IT-
system flowcharts,
Management system process
material
PM scorecards, PM reports,
PM process descriptions,
PM educational material,
Management system
process descriptions
PM scorecards, PM reports,
PM process descriptions,
PM presentations
Within case
data analysis
Data reduction, clustering,
pattern-matching
Data reduction, clustering,
pattern-matching
Data reduction, clustering,
pattern-matching
Miles and
Huberman,
1994; Merriam,
1994; Yin,
1994
Validity
Triangulation, representative
case study, analytical
generalisation
Triangulation,
representative case study,
analytical generalisation
Triangulation,
representative case study,
analytical generalisation
Silverman,
2002
Yin, 1994
Reliability
Choice of case
study/company,
establishment of a case study
database
Choice of case
study/company,
establishment of a case
study database
Choice of case
study/company,
establishment of a case
study database
Yin, 1994
Cross-case
analysis
Category selection, juxtapose
cases and by data source
Category selection,
juxtapose cases and by data
source
Category selection,
juxtapose cases and by data
source
Eisenhardt,
1989
4 FINDINGS
Table 4 gives an overall outline of the findings made in each case study. The findings suggest that all three
companies have approaches in place for managing change in PM. However, the approaches differ in design,
execution and context. Each approach is presented in the sections below from two aspects, structural and
behavioural. The structural aspect focuses on how the case companies report that they ought and want to work
with PM change. The behavioural aspect focuses in contrast on how the intended ways of working have
unfolded. The distinction between the structural and behavioural sides provides a useful contrast of how the case
companies want to work vis-à-vis how they actually work.
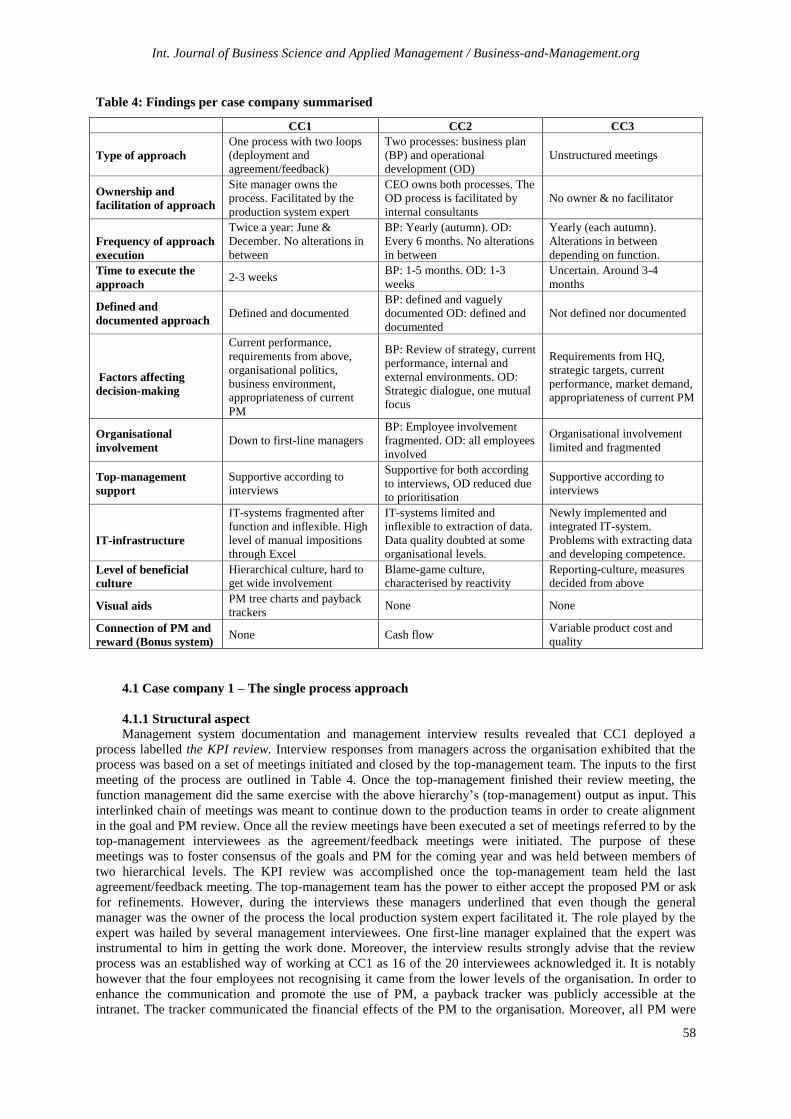
Int. Journal of Business Science and Applied Management / Business-and-Management.org
58
Table 4: Findings per case company summarised
CC1 CC2 CC3
Type of approach
One process with two loops
(deployment and
agreement/feedback)
Two processes: business plan
(BP) and operational
development (OD)
Unstructured meetings
Ownership and
facilitation of approach
Site manager owns the
process. Facilitated by the
production system expert
CEO owns both processes. The
OD process is facilitated by
internal consultants
No owner & no facilitator
Frequency of approach
execution
Twice a year: June &
December. No alterations in
between
BP: Yearly (autumn). OD:
Every 6 months. No alterations
in between
Yearly (each autumn).
Alterations in between
depending on function.
Time to execute the
approach 2-3 weeks
BP: 1-5 months. OD: 1-3
weeks
Uncertain. Around 3-4
months
Defined and
documented approach Defined and documented
BP: defined and vaguely
documented OD: defined and
documented
Not defined nor documented
Factors affecting
decision-making
Current performance,
requirements from above,
organisational politics,
business environment,
appropriateness of current
PM
BP: Review of strategy, current
performance, internal and
external environments. OD:
Strategic dialogue, one mutual
focus
Requirements from HQ,
strategic targets, current
performance, market demand,
appropriateness of current PM
Organisational
involvement Down to first-line managers
BP: Employee involvement
fragmented. OD: all employees
involved
Organisational involvement
limited and fragmented
Top-management
support
Supportive according to
interviews
Supportive for both according
to interviews, OD reduced due
to prioritisation
Supportive according to
interviews
IT-infrastructure
IT-systems fragmented after
function and inflexible. High
level of manual impositions
through Excel
IT-systems limited and
inflexible to extraction of data.
Data quality doubted at some
organisational levels.
Newly implemented and
integrated IT-system.
Problems with extracting data
and developing competence.
Level of beneficial
culture
Hierarchical culture, hard to
get wide involvement
Blame-game culture,
characterised by reactivity
Reporting-culture, measures
decided from above
Visual aids PM tree charts and payback
trackers None None
Connection of PM and
reward (Bonus system) None Cash flow
Variable product cost and
quality
4.1 Case company 1 – The single process approach
4.1.1 Structural aspect
Management system documentation and management interview results revealed that CC1 deployed a
process labelled the KPI review. Interview responses from managers across the organisation exhibited that the
process was based on a set of meetings initiated and closed by the top-management team. The inputs to the first
meeting of the process are outlined in Table 4. Once the top-management finished their review meeting, the
function management did the same exercise with the above hierarchy’s (top-management) output as input. This
interlinked chain of meetings was meant to continue down to the production teams in order to create alignment
in the goal and PM review. Once all the review meetings have been executed a set of meetings referred to by the
top-management interviewees as the agreement/feedback meetings were initiated. The purpose of these
meetings was to foster consensus of the goals and PM for the coming year and was held between members of
two hierarchical levels. The KPI review was accomplished once the top-management team held the last
agreement/feedback meeting. The top-management team has the power to either accept the proposed PM or ask
for refinements. However, during the interviews these managers underlined that even though the general
manager was the owner of the process the local production system expert facilitated it. The role played by the
expert was hailed by several management interviewees. One first-line manager explained that the expert was
instrumental to him in getting the work done. Moreover, the interview results strongly advise that the review
process was an established way of working at CC1 as 16 of the 20 interviewees acknowledged it. It is notably
however that the four employees not recognising it came from the lower levels of the organisation. In order to
enhance the communication and promote the use of PM, a payback tracker was publicly accessible at the
intranet. The tracker communicated the financial effects of the PM to the organisation. Moreover, all PM were

Mohammed Salloum and Stefan Cedergren
59
connected throughout the hierarchical levels of the organisation through the use of publicly available KPI-trees
(Figure 1). The general manager explained: “…And then we do have these KPI-trees that show how everything
is related throughout the organisation… I think that they [the KPI-trees] can play an important role in
explaining that yes it [the measures] matters”.
Figure 1: Example of one measurement tree for the cost, delivery and quality PM at a department.
4.1.2 Behavioural aspect
Even though interview results, especially from the top-management team, made it explicit that the intention
was to involve everyone, the process was never deployed on a team level in production. One team-leader
elaborated when asked how he though his team felt about working with PM: “I do not think they care…painting
is pretty much all that they are interested in that…how can I say it…their main goal is the paint and to keep
painting. So that is pretty much all that they are worried about…”
The interviewees for the top-management team were united in their view that they had not reached out fully
and had a contribution to make in order to engage the whole organisation. The general manager explained that
an attempt had been made to involve the teams but it was deferred as many others things came up that needed to
be dealt with. The general manager described the attempt as “half-hearted”. However, all six top-management
interviewees still believed that the KPI review was important and supported it. One of the managers argued that
the attempt failed due to the lack of management understanding regarding how to make the organisation to want
to get involved. The consequences of not involving the masses in the KPI review were believed to be negative
and were best expressed by the production engineering manager who argued that the involvement of the teams
was crucial for the ability of the whole organisation to get something worthwhile out of the PM. Further, another
contributing factor to the lack of involvement was the culture of the organisation. The production manager
argued: “ Here at this plant, to engage your employees equals to inform them and nothing else. No dialogue or
feedback exists. You must always control that things are getting done. This is fundamentally wrong and in order
to redeem this we must change the culture…this journey starts with us, the top-management team”.
When asked about the culture and its impact on the PM, several managers highlighted the negative
behavioural effect that the PM ownership structure had. The quality manager argued that the ownership needed
to be driven down beyond the team-leaders in order to trigger involvement. Those thoughts got support by
recently promoted team-leaders that expressed that their acquired PM responsibilities made them get involved.
Further, the organisation did not offer any PM training to the production teams. This education was given once
an operator/assembler became a team-leader. The team-leaders highlighted that the education was important for
their understanding of the PM. Moreover, direct observations and interview results indicate that that CC1 had
problems with their inflexible and disintegrated IT-systems. All five top-management interviewees underlined
that the IT-system was inflexible in regards to what they wanted to measure. High levels of manual impositions
for collecting and compiling data encroached on the time for analysis, limited the measurement scope and
amplified the risk for human errors. The general manager explained that it sometimes felt like a project to just
start measuring a new PM.

Int. Journal of Business Science and Applied Management / Business-and-Management.org
60
4.2 Case company 2 – The dual process approach
PM process documentation and interview responses exhibit that CC2 deployed two processes for managing
PM change. The first process, labelled at CC2 as the business plan and goal steering process (BP&GS) adopted
a top-down approach and was confined to all the main strategic and operational PM. In converse, the second
process, named the operational development process (OD) was designed as a bottom-up approach with focus on
a single strategic goal.
4.2.1 Structural aspect Analysis of management system guidelines and interview responses from across CC2 revealed that the first
review process adopted a top-down approach and consisted of two loops, a business planning (BP) loop and a
goal steering (GS) loop (Figure 2). According to management interviewees and documentation obtained from
the intranet, the purpose of the BP loop was to ensure that the strategy of the organisation had been reviewed
whilst the GS loop aligned the PM scorecards across the organisation with the reviewed strategy. Once the top-
management team had finished their BP loop and updated the strategic material and main PM, the objectives
and PM of the organisation were reviewed through the GS loop. The BP loop was thus the first process step and
was confined, participation wise, to the top-management. Process material and interview responses exhibit that
the GS loop was executed in a chronological fashion with output of higher hierarchical levels serving as input
for the lower dittos. Moreover, the output was meant to become more specific and detailed the further down the
GS loop was drilled (Figure 2). At, first-line management level specific actions were meant to be assigned to the
PM and goals through the development of local business plans. The GS loop was concluded once the lowest
levels of CC1 had reviewed and updated their PM and goals for the coming year.
Figure 2: The BP&GS loops and their outputs.
Analysis of interviews and archived data reveals that the OD process revolved around the notion that the
organisation cooperatively concentrates on one strategic focus. The OD process consisted of five steps, was
well-documented and had both process descriptions and educational material describing it in detail (Figure 3).
Educational material outlined that the initial step revolved around justifying the need for action to the
organisation. This was done through a seminar held by the general manager. The second step sets the direction
of the company by selecting one common strategic focus. Once the focus was set it was broken down into goals,
PM and action lists within all OD teams. Then, the output and progress was monitored through revised action
lists, recurrent team meetings and creation and finalisation of PM. The OD teams had full authority of creating
the goals, PM and action lists as long as they supported the strategic focus. It was believed by interviewees
across CC2 that all employees were members of at least one OD team. Further, all employees had been given
training in the OD philosophy and how to work within the OD teams by the internal consultants. The final step
of the process purposed to use gained insights as part of the input for the next loop of the process and to improve
it. Educational material and interview responses underline the role of the internal consultants played. From
helping the general manager with the strategic focus to support the OD groups with their PM, actions and
improving the process.

Mohammed Salloum and Stefan Cedergren
61
Figure 3: The OD process. The process steps are highlighted in rectangles and the outputs in spheres.
4.2.2 Behavioural aspect
It was underlined by several interviewees that the BP&GS process did not work as intended, some first-line
managers admitted that this was the first time in several years that they got any input from their managers.
Others acknowledged that they received their input only after they had finished reviewing their PM and
assignment of actions. The first-line managers that received input perceived it to be problematic that the upper
management absorbed much time and thus reduced the time left for them. One of top-managers acknowledged
the problem: “The further down you come the organisation the less time they have and I think that is generally
speaking…we need to get better here that thing is clear…considering the vast change in activities that this work
[the GS loop] creates I do believe that we are putting down too little resources and time…”
First-line management interviewees established that they did not have a coherent way of engaging their
production teams in the GS loop. These arguments were strengthened by the non-existence of process
documentation. A couple of first-line managers described how they gathered all the operators for an afternoon in
order to together create the business plan. In converse, other managers argued that they had no possibility to
engage their production teams in the process due to the impact on production output. One first-line manager
explained why he could not engage his production teams: “…the thought is that we should involve our teams, we
have not done that yet…it has not been possible to involve the teams because we have shift teams that work on
different hours...we cannot involve everyone because that would require paying overtime and supplementary
allowances…”
The consequence of not being involved was highlighted by one of the team-leaders: “It only becomes a
number, the culture here is that it is really cool to measure stuff, but then nothing is really done. You measure
and pile it up and then they go “bother! Let’s measure this instead”. Not many union workers [the blue collars]
are interested in it [the performance measures].”
Questions about the culture and the support that it lends to the PMS generate diversified answers.
According to the top-management a culture existed in which people did not question, challenge or improve the
operations. It was a culture characterised by reactivity, something needs to be dysfunctional in order to trigger
an action. In contrast, one blue collar respondent argued: “…we on the shop floor are not interested in
measuring anything. We know that they [the PM] are flavours of the month. We have so much fact that it is
ridiculous but no actions are taken”.
Top-management interview responses revealed that the top-management team supported the BS&GP
process. However, the support of the OD process was not as established as it had been severely reduced in
scope. CC2 was undergoing a transformation of the production system from functional to lean and the general
manager argued that the resources were not sufficient for both. The OD process was still active in some parts of
the organisation, however, the decrease in utilisation had a distinct effect on the cost savings made from, from 4,
1 to 1, 9 MUSD. Moreover, the functionality of the IT-systems was emphasised by interviewees across the
organisation. Interviewees from the higher organisational levels acknowledged that the IT-systems had
limitations, were inflexible in regards to data extraction and that the data quality was not always fully reliable.
The production manager shared an example: “…a typical and good example of this is when the hours logged in
the system are suspiciously low…after asking around you get the answer that the central finance department
made a small definition error in the system...”

Int. Journal of Business Science and Applied Management / Business-and-Management.org
62
4.3 Case company 3 – The unstructured meeting approach
4.3.1 Structural aspect
The accounts on how the review was executed differed widely across CC3. Further, no documentation was
identified nor acknowledged by the interviewees. However, several top-management interviewees
acknowledged that the approach started with a top-management meeting in which the PM and objectives were
reviewed. In the review several factors would guide the decision-making (Table 4) but it was emphasised by
several interviewees (general manager, finance manager, production manager) that much of the changes were
dictated by the company HQ. According to the general manager it was not unconventional that CC3 were
simply handed new PM and goal levels without space for questioning. Interview responses from top-
management members underlined that the execution of the review meeting would differ from year to year. The
unstructured characteristic of the process was acknowledged as burdensome by the general manager: “We need
to make it [the review process] distinct… we are in a phase in which we need to type out the process I can admit
that it does not work well today… I addressed all the leaders [managers] with the factory measures and goals
just before December…they were however not finished until March. But that is too late, it is not functional”.
Interview responses by functional managers revealed that after the top-management had decided on their
PM it was their responsibility to take the review to the next hierarchical level. It was underlined in interviews
with top and second-line managers that the involvement of the organisation in the review was something that
was often repeated as important. However, it was at the same time acknowledged as the most challenging part to
do according to the production manager: “Involving everyone is the most difficult thing to do when working with
KPI´s. You really want to get everyone to feel that they can contribute…in my world, if PM are generated by the
factory management [top-management] then it needs to be taken down to the local departments...bad PM will
lead to bad behaviour, no one will care because no one will be able to exert influence over them [the PM]”.
When asked about the autonomy to select PM in the lower levels of the organisation the general manager
explained: “SQD [Safety, Quality, Delivery], these are the measures that should be on the shop floor level and
that is enough...this is simple and contributes to the whole. SQD… first we need to get our review process
functioning and then we can look into how to give autonomy to the teams”.
4.3.2 Behavioural aspect
Interview accounts from functional managers underline that no formal requirements on how to push the PM
review to the next organisational level existed. Interview responses from the finance manager and one controller
revealed that the finance function discussed and decided on the PM at a department meeting. The controller
explained that this was a satisfactory way of working as the department only consisted of four members. In
contrast, the logistics department had a PM review day with the whole function. The logistics manager
explained why he wanted his function to work in this manner: “…I do not do this, it is the function because they
are the ones that will be working with this in there group. We do this in order to create the environment that
makes them feel “that this is my way, this is what we should do in our group”.
The logistic function´s procedure was positively perceived by interviewees across the organisation and was
referred to as a good standard by a second-line production manager. The production function, which was the
most employee heavy function, deployed a contrasting procedure according to interviewees from within the
function. The second-line managers would receive the PM and goal levels to be deployed with suggestions of
how to cascade them down further to first-line managers, team-leaders and production-teams by their superior.
Accounts from team-leaders further strengthened this notion as they were simply handed their new PM from
their managers. These accounts were strengthened by the production manager: “…I believe that we use a
commando-structure here, we do not really have that anchoring or cascading of the measures”.
Questions regarding how well the IT-system facilitated change in PM generated different responses. Two
(HR top-manager & production second-line manager) out of the 21 interviewees were positive about the IT-
system. However, the majority of the respondents felt that the IT-system inhibited their ability to measure.
Several interviewees blamed the new IT-system and argued that the structures of queries that were built around
the old system had now vanished without anything replacements. Some interviewees however believed that with
time, the new IT-system would become more flexible and better than the old system. Other argued that once the
competence of how to handle the new IT-system increased the possibilities would surpass the old system´s. The
interviewees’ perception of the culture at CC3 was diversified. On one side of the extreme the finance manager
felt that the organisation had a large quantity of PM that no one really cared about. In contrast, the HR manager
argued that the leadership at the site was very ambitious about the PM and that they understood the need to have
good measures over time. The answers were diversified throughout the organisation regardless of hierarchical
belonging. However, several responses were consistent in regards to the reporting and control characteristics of
the culture.

Mohammed Salloum and Stefan Cedergren
63
5 CROSS-CASE ANALYSIS
5.1 Structural aspect
From a structural perspective, all three approaches revolved around the notion of top-down execution with
strategy as a starting point. The top-down feature seems to be in place in order to create PM alignment across
the organisation. Both the CC1 and CC2 approaches had this feature explicitly designed through the chain of
execution. Even though CC3 lacks an explicit approach, the chain of execution is evident in how they managed
PM change. The OD process (CC2) facilitated the alignment directly between the teams and strategic focus.
Further, the input to the decision-making is similar across the case companies (Table 4). This validates the
established belief that PM and strategy need to achieve alignment. Further, the approaches were executed
annually/semi-annually and were thus seen as recurring activities as argued by Neely et al. (2002b), and Medori
and Steeple (2000). Further, the liberty to develop PM is another common feature. CC1 and CC2 allowed their
employees to develop PM if they supported the overriding organisational direction. PM autonomy seemed to be
perceived as an important function for gaining the involvement. It seems that the underlying notion was that PM
autonomy would amplify involvement that in turn would drive performance. Involvement of employees is
underlined by Spitzer (2007) as pivotal factor.
Further, the possible relationship between the level of documentation/facilitation and the execution time
needs to be highlighted. The approaches with facilitators and documentation were executed between 1-3 weeks
whilst the dittos without took between 1-5 months to execute. These findings strengthen the calls for ownership
of the PM change process (Kaplan and Norton, 2005; 2008) and a structured and defined approach (Meekings,
2005). Thus, if adequate resources are dedicated from the start the conditions for involving the organisation are
plausibly greater. Furthermore, such a proactive stance will lead, in the long-run, to a process that requires fewer
resources to execute (Neely et al., 2002a). Moreover, several researchers underlined the need of adequate IT-
capabilities (Bititci et al., 2000; Wettstein and Kueng, 2002; Kennerley et al., 2003). The IT-system was
highlighted across the case studies as an influencing factor. The challenge highlighted was not being able to
measure due to inflexibility. Further, fragmented IT-systems had consequences beyond inflexibility such as time
for data extraction, compilation and human errors. Further, another aspect is the structure built around a given
IT-system. CC3 replaced an old fragmented system with a new and integrated ditto that would enhance
flexibility. However, with both competence and supporting structures erased the new system was perceived as
less flexible and more problematic.
5.1 Behavioural aspect
Even though the role of employee involvement was underlined as sought-after and important, all three
companies had problems in making it a reality. Several plausible explanations exist based on the empirical
evidence. The rigid and hierarchical chain of execution might make more damage than good. It became evident
at CC2 that the chain of execution can become a problem if not accompanied with the appropriate level of
resources. The managers at the lowest levels did not get their input in time and were not cleared resources to try
to involve their production teams. The OD approach deviated from the hierarchical execution and allowed each
team to develop goals and PM in support of the strategic focus without any intermediaries. The OD approach of
structuring the review process required less time to execute while including the whole organisation. Moreover,
in relation to the chain of execution, size matters. At CC3, the finance function had no problems involving the
employees. The employee-wise larger logistics function could involve most of its employees but had to work
around the production planning. In contrast, the function with the highest number of employees (production),
simply deployed the changes brought to them. Thus, a negative correlation seems to exist between the
department size and the level of involvement. An increase in size equals an increase in needed resources, mainly
time and additional labour costs. However, as illustrated at CC3, if resources are not made available the
involvement will be suffocated. The need to give sufficient resources is highlighted by Spitzer (2007). Further,
the challenge of employee involvement is further amplified by the lack of top-management understanding. As
illustrated in CC2, little time was given to the lower levels. Instead, the higher management levels consumed the
larger portion of the time available leaving the organisation, at best, with time constraints. As gatekeepers of
organisational resources, top-management plays an important role in establishing a functional review approach.
Several of the major hurdles identified regarding the involvement have their roots in management action and
decision-making. The top-management needs firstly to understand the requirements of executing a PM review
approach characterised by a chain of execution and secondly to make the required resources available.
However, there are other aspects of the challenges of involvement that are evident in the empirical data.
The situation at CC1 illustrates that ownership and education can be two barriers of employee involvement.
Once these two were given to promoted individuals they got involved. These two factors built a barrier at a CC1
which had; a defined and documented process, designated facilitators, visual aids and no resource complains
(Spitzer, 2007). Thus, even though CC1 had, in contrast to the other case companies, better conditions, it was
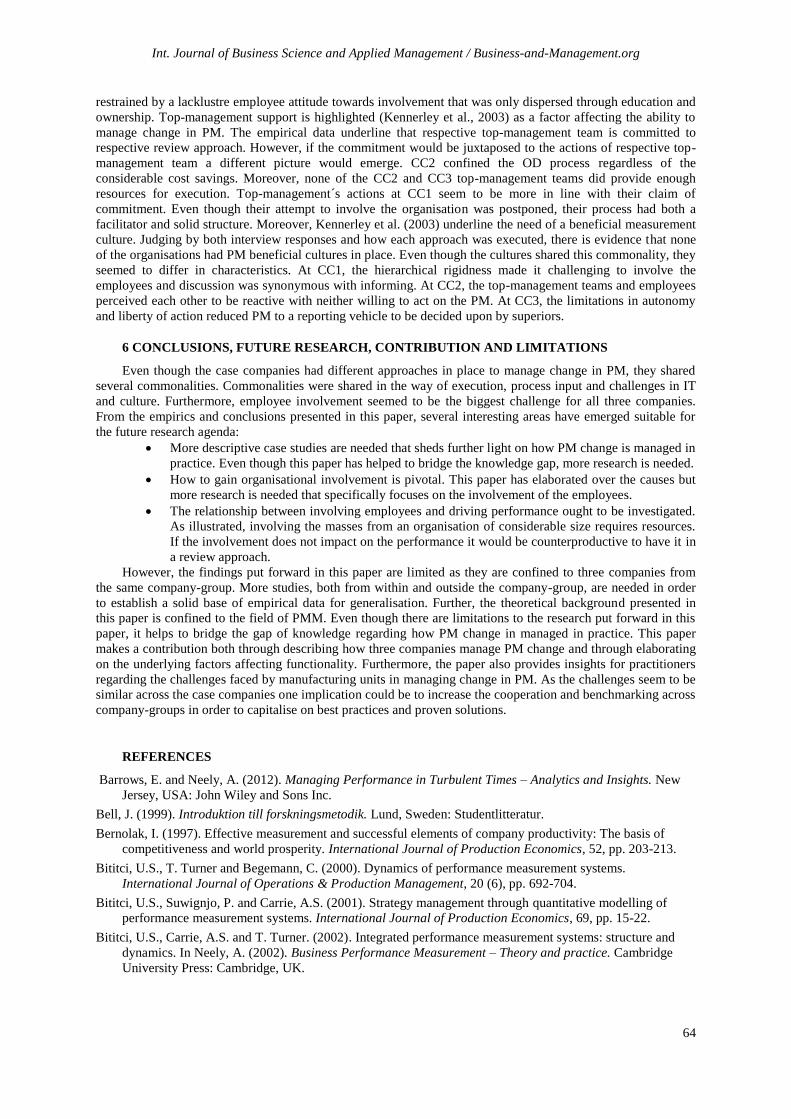
Int. Journal of Business Science and Applied Management / Business-and-Management.org
64
restrained by a lacklustre employee attitude towards involvement that was only dispersed through education and
ownership. Top-management support is highlighted (Kennerley et al., 2003) as a factor affecting the ability to
manage change in PM. The empirical data underline that respective top-management team is committed to
respective review approach. However, if the commitment would be juxtaposed to the actions of respective top-
management team a different picture would emerge. CC2 confined the OD process regardless of the
considerable cost savings. Moreover, none of the CC2 and CC3 top-management teams did provide enough
resources for execution. Top-management´s actions at CC1 seem to be more in line with their claim of
commitment. Even though their attempt to involve the organisation was postponed, their process had both a
facilitator and solid structure. Moreover, Kennerley et al. (2003) underline the need of a beneficial measurement
culture. Judging by both interview responses and how each approach was executed, there is evidence that none
of the organisations had PM beneficial cultures in place. Even though the cultures shared this commonality, they
seemed to differ in characteristics. At CC1, the hierarchical rigidness made it challenging to involve the
employees and discussion was synonymous with informing. At CC2, the top-management teams and employees
perceived each other to be reactive with neither willing to act on the PM. At CC3, the limitations in autonomy
and liberty of action reduced PM to a reporting vehicle to be decided upon by superiors.
6 CONCLUSIONS, FUTURE RESEARCH, CONTRIBUTION AND LIMITATIONS
Even though the case companies had different approaches in place to manage change in PM, they shared
several commonalities. Commonalities were shared in the way of execution, process input and challenges in IT
and culture. Furthermore, employee involvement seemed to be the biggest challenge for all three companies.
From the empirics and conclusions presented in this paper, several interesting areas have emerged suitable for
the future research agenda:
More descriptive case studies are needed that sheds further light on how PM change is managed in
practice. Even though this paper has helped to bridge the knowledge gap, more research is needed.
How to gain organisational involvement is pivotal. This paper has elaborated over the causes but
more research is needed that specifically focuses on the involvement of the employees.
The relationship between involving employees and driving performance ought to be investigated.
As illustrated, involving the masses from an organisation of considerable size requires resources.
If the involvement does not impact on the performance it would be counterproductive to have it in
a review approach.
However, the findings put forward in this paper are limited as they are confined to three companies from
the same company-group. More studies, both from within and outside the company-group, are needed in order
to establish a solid base of empirical data for generalisation. Further, the theoretical background presented in
this paper is confined to the field of PMM. Even though there are limitations to the research put forward in this
paper, it helps to bridge the gap of knowledge regarding how PM change in managed in practice. This paper
makes a contribution both through describing how three companies manage PM change and through elaborating
on the underlying factors affecting functionality. Furthermore, the paper also provides insights for practitioners
regarding the challenges faced by manufacturing units in managing change in PM. As the challenges seem to be
similar across the case companies one implication could be to increase the cooperation and benchmarking across
company-groups in order to capitalise on best practices and proven solutions.
REFERENCES
Barrows, E. and Neely, A. (2012). Managing Performance in Turbulent Times – Analytics and Insights. New
Jersey, USA: John Wiley and Sons Inc.
Bell, J. (1999). Introduktion till forskningsmetodik. Lund, Sweden: Studentlitteratur.
Bernolak, I. (1997). Effective measurement and successful elements of company productivity: The basis of
competitiveness and world prosperity. International Journal of Production Economics, 52, pp. 203-213.
Bititci, U.S., T. Turner and Begemann, C. (2000). Dynamics of performance measurement systems.
International Journal of Operations & Production Management, 20 (6), pp. 692-704.
Bititci, U.S., Suwignjo, P. and Carrie, A.S. (2001). Strategy management through quantitative modelling of
performance measurement systems. International Journal of Production Economics, 69, pp. 15-22.
Bititci, U.S., Carrie, A.S. and T. Turner. (2002). Integrated performance measurement systems: structure and
dynamics. In Neely, A. (2002). Business Performance Measurement – Theory and practice. Cambridge
University Press: Cambridge, UK.
Mohammed Salloum and Stefan Cedergren
65
Bourne, M., Wilcox, M., Neely, A. and Platts K. (2000). Designing, implementing and updating performance
measurement systems. International Journal of Operations & Production Management, 20 (7), pp. 754-
771.
Bourne, M. (2008). Performance measurement: learning from the past and projecting the future. Measuring
Business Excellence, 12 (4), pp. 67-72.
Cross, K.F. and Lynch, R.L. (1992). For good measure. Certified Management Accountants (CMA) Magazine,
66 (3), pp. 20-24.
Denscombe, M. (2000). Forskningshandboken – för småskaliga forskningsprojekt inom samhällsvetenskap [In
Swedish]. Lund, Sweden: Studentlitteratur.
Eisenhardt, K.M. (1989). Building theories from case study research. Academy of Management Review, 14 (4),
pp. 532‐550.
Farris, J., Van Aken, M.E., Letens, G., Chearksul, P. and Coleman, G.D. (2011). Improving the performance
review process - a structured approach and case application. International Journal of Operations &
Production Management, 31 (4), pp. 376-404.
Hass, S., Burnaby, P., and Bierstaker, J.L. (2005). The use of performance measures as an integral part of an
entity’s strategic plan. Managerial Auditing Journal, 20 (2), pp. 179-186.
Kaplan, R.S. and Norton, D.P. (1992). The balanced scorecard – measures that drive performance. Harvard
Business Review, January-February, pp. 71-79.
Kaplan R.S. and Norton D.P. (2001). The strategy-focused organization. Massachusetts, USA: Harvard
Business School Press.
Kaplan R.S. and Norton D.P. (2005). The office of strategy management. Harvard Business Review, October.
Kaplan R.S. and Norton D.P. (2008). The office of strategy management: emerging roles and responsibilities.
Balanced scorecard report, 10 (4), pp. 1-7.
Kennerley, M. and Neely, A. (2002). A framework of the factors affecting the evolution of performance
measurement systems. International Journal of Operations & Production Management, 22 (11), pp. 1222-
1245.
Kennerley, M. and Neely, A. (2003). Measuring performance in a changing business environment. International
Journal of Operations & Production Management, 23 (2), pp. 213-229.
Kennerley, M., Neely, A. and Adams, C. (2003). Survival of the fittest: measuring performance in a changing
business environment. Measuring Business Excellence, 7 (4), pp. 37-43.
Lantz, A. (1993). Intervjumetodik [In Swedish]. Lund, Sweden: Studentlitteratur.
Likierman, A. (2009). The five traps of performance measurement. Harvard Business Review, October, pp. 96-
101.
Lima, E.P., Gouvea Costa, S.E. and Angelis, J.J. (2009). Strategic performance measurement systems: a
discussion about their roles. Measuring Business Excellence, 13 (3), pp. 39-48.
McAdam, R. and Bailie, B. (2002). Business performance measures and alignment impact on strategy – the role
of business improvement models. International Journal of Operations & Production Management, 22 (9),
pp. 976-996.
Medori, D. and Steeple, D.S. (2000). A framework for auditing and enhancing performance measurement
systems. International Journal of Operations & Production Management, 20 (5), pp. 520-533.
Meekings A. (2005). Effective review meetings: The counter-intuitive key to successful performance
measurement. International Journal of Productivity and Performance Management, Vol. 54 No. 3, pp.
212-220.
Merriam, S.B. (1994). Fallstudien som forskningsmetod. Lund, Sweden: Studentlitteratur.
Miles, M.B, and Huberman, A.M. (1994). Qualitative Data Analysis, 2nd
Edition. California, USA: Sage
Publication Inc.
Neely, A., Mills, J., Platts, K., Gregory M. and Richards, H. (1996). Performance measurement system design:
Should process based approaches be adopted? International Journal of Production Economics, 46 (47), pp.
423-431.
Neely, A., Adams, C. and Kennerley, M. (2002a). The Performance Prism. Harlow, UK: Prentice Hall.
Neely, A., Bourne, M., Mills, J., Platts, K. and Richards, H. (2002b). Getting the measure out of your business.
Cambridge, UK: Cambridge University Press.
Neely, A. (1999). The performance measurement revolution: why now and what next? International Journal of
Operations & Production Management, 19 (2), pp. 205-228.
Int. Journal of Business Science and Applied Management / Business-and-Management.org
66
Paranjape, B., Rossiter B. and Pantano, V. (2006). Insights from the Balanced Scorecard: Performance
measurement systems: successes, failures and future - a review. Measuring Business Excellence, 10 (3), pp.
4-14.
Salloum, M. and Wiktorsson, M. (2011). Dynamic abilities in performance measurement system: a case study
on practice and strategies. Proceedings of the 18th International Annual EurOMA Conference, Cambridge,
UK.
Searcy, C. (2011). Updating corporate sustainability performance measurement systems. Measuring Business
Excellence, 15 (2), pp. 44-56.
Simons, R. (1995). Levers of Control. Massachusetts, USA: Harvard Business School Press.
Slack, N., Chambers, S. and Johnston, R. (2004). Operations Management, 4th edition. Harlow, UK: Pearson
Education.
Silverman, D. (2010). Doing Qualitative Research, 3rd
edition. London, UK: Sage Publications Inc.
Spitzer, D.R. (2007). Transforming Performance Measurement: rethinking the way we measure and drive
organizational success. New York, USA: AMACOM.
Tangen, S. (2005). Analysing the requirements of performance measurement systems. Measuring Business
Excellence, 9 (4), pp. 46-54.
Tapinos, E., Dyson, R.G. and Meadows, M. (2005). The impact of performance measurement in strategic
planning. International Journal of Productivity and Performance Management, 54 (5/6), pp. 370-382.
Waggoner, D., Neely, A.D. and Kennerley, M.P. (1999). The forces that shape organisational performance
measurement systems: An interdisciplinary review. International Journal of Production Economics, 60
(61), pp. 53-60.
Wettstein, T. and Kueng, P. (2002). A Maturity Model for Performance Measurement Systems. In Brebbia, C.
and Pascola, P. (2002). Management Information Systems - incorporating GIS and Remote Sensing.
Southampton, UK: WIT Press.
Yin R.K. (1994). Case study research: Design and methods, 2nd edition. California, USA: Sage Publications
Inc.


