Int J Pharm Bio Sci 2014 Jan; 5(1): (P) 313 - 324 This article can be downloaded from www.ijpbs.net P - 313 Research Article Analytical Chemistry International Journal of Pharma and Bio Sciences ISSN 0975-6299 DEVELOPMENT AND VALIDATION OF A RAPID AND HIGH SENSITIVE SAX- HPLC METHOD FOR ANALYSIS OF IMPURITIES IN HEPARIN SODIUM USING AMMONIUM PERCHLORATE (IN SITU) MOBILE PHASE G.KAVITHA *1,2 , G.NADAMUNI 2 , C.S.VENKATESAN 2 , K.MUKKANTI 1 AND V.N.S.M.V.G.RAJU 2 1 Centre for chemical sciences and technology, IST, JNTU, Hyderabad, India. 2 Research & Development, Gland Pharma Limited, Hyderabad, India. ABSTRACT A simple, rapid, sensitive and high resolution SAX HPLC method for the determination of Dermatan sulphate (an impurity) and Oversulphated chondroitin sulphate (a contaminant) in Heparin sodium drug substance has been developed. This method was developed to address the issues of very long runtime, poor resolution between heparin, DS & OSCS, broad peaks, high drift in the baseline and lesser sensitivity for the impurities with the existing method for determination of impurities in Heparin sodium. The newly developed analytical method employs a hydrophilic polymer resin-based strong anion exchange column which yielded a high resolution between dermatan sulphate and Heparin. Chromatographic separation was achieved using a linear gradient elution from 15% to 70% of 1.0M ammonium perchlorate (prepared in situ) containing 5mM sodium dihydrogen phosphate at pH 3.0 over a period of 22 minutes with UV detection at 202 nm. The method has been validated and the limit of detection for DS and OSCS were found to be 0.03% & 0.06% respectively. The method was found to be linear over the range of 50-150% of the specifications of the impurities with respect to the working sample concentration of 40 mg/mL. The precision, accuracy, specificity, robustness and ruggedness of the method were also established. The stability of standard and sample solutions was also determined. KEYWORDS: Heparin, Dermatan sulphate (DS), Oversulphated chondroitin sulphate (OSCS), SAX HPLC, Ammonium perchlorate. G.KAVITHA Centre for chemical sciences and technology, IST, JNTU, Hyderabad, India.
Transcript
Int J Pharm Bio Sci 2014 Jan; 5(1): (P) 313 - 324
This article can be downloaded from www.ijpbs.net
P - 313
Research Article Analytical Chemistry
International Journal of Pharma and Bio Sciences ISSN
0975-6299
DEVELOPMENT AND VALIDATION OF A RAPID AND HIGH SENSITIVE SAX-
HPLC METHOD FOR ANALYSIS OF IMPURITIES IN HEPARIN SODIUM USING
AMMONIUM PERCHLORATE (IN SITU) MOBILE PHASE
G.KAVITHA*1,2, G.NADAMUNI2, C.S.VENKATESAN2, K.MUKKANTI1 AND V.N.S.M.V.G.RAJU2
1
Centre for chemical sciences and technology, IST, JNTU, Hyderabad, India. 2
Research & Development, Gland Pharma Limited, Hyderabad, India.
ABSTRACT
A simple, rapid, sensitive and high resolution SAX HPLC method for the determination of Dermatan sulphate (an impurity) and Oversulphated chondroitin sulphate (a contaminant) in Heparin sodium drug substance has been developed. This method was developed to address the issues of very long runtime, poor resolution between heparin, DS & OSCS, broad peaks, high drift in the baseline and lesser sensitivity for the impurities with the existing method for determination of impurities in Heparin sodium. The newly developed analytical method employs a hydrophilic polymer resin-based strong anion exchange column which yielded a high resolution between dermatan sulphate and Heparin. Chromatographic separation was achieved using a linear gradient elution from 15% to 70% of 1.0M ammonium perchlorate (prepared in situ) containing 5mM sodium dihydrogen phosphate at pH 3.0 over a period of 22 minutes with UV detection at 202 nm. The method has been validated and the limit of detection for DS and OSCS were found to be 0.03% & 0.06% respectively. The method was found to be linear over the range of 50-150% of the specifications of the impurities with respect to the working sample concentration of 40 mg/mL. The precision, accuracy, specificity, robustness and ruggedness of the method were also established. The stability of standard and sample solutions was also determined. KEYWORDS: Heparin, Dermatan sulphate (DS), Oversulphated chondroitin sulphate (OSCS), SAX HPLC, Ammonium perchlorate.
G.KAVITHA
Centre for chemical sciences and technology, IST, JNTU, Hyderabad, India.
Int J Pharm Bio Sci 2014 Jan; 5(1): (P) 313 - 324
This article can be downloaded from www.ijpbs.net
P - 314
INTRODUCTION Heparins and low molecular weight heparins (LMWHs) are a heterogeneous mixture of repeating uronic acid and N-sulphated glucosamine groups. The average molecular weight of heparin is about 15000 Daltons. Considering the animal source of heparins, there are a number of potential impurities which needs to be identified and quantified during the analysis of Heparin1,2,3. Beside natural impurities formed during the isolation process, heparin was found to be contaminated with a substance called oversulphated chondroitin sulphate (OSCS) which lead to several deaths in USA during 20084. Hence, initially the goal was to develop an analytical method for the detection and quantification of Oversulphated chondroitin sulphate (a contaminant) in Heparin sodium API. The first SAX-HPLC method for the determination of OSCS in heparin sodium was presented by one of the co-authors of this article in the 2nd workshop on the characterization of Heparin products5. A slightly modified version of this SAX-HPLC method was made official by the USP in the year 20096. This monograph employs two different HPLC methods for the determination of impurities in Heparin sodium. They are: a test to determine the “limit of galactosamine in total hexosamine” for the determination of Dermatan sulphate using HPIC with amperometric detection and a degradation process prior to analysis; a test to establish the “absence of Oversulphated chondroitin sulphate” using SAX-HPLC with UV detection. However these methods are only limit tests and do not quantify the amount of the impurities.
Heparin sodium API is also official in the Ph.Eur. monograph7. Though the EP monograph employs a single method for the determination of DS and OSCS in Heparin, a degradation technique (nitrous acid digestion) is used prior to analysis of samples and this is also a limit test (less than 2.0% for DS) and does not quantify the exact amount. There were a few more SAX-HPLC methods 8,9,10 in the literature for Heparin and Crude Heparin which uses high salt concentrations of up to 2.5 M
sodium chloride in the mobile phase and a polyvinylbenzyl ammonium (divinyl benzene) resin based SAX column with medium-low hydrophobicity. Therefore to develop a single and sensitive method for simultaneous determination of DS and OSCS in heparin further method development trials were taken up. Several factors were optimized as a part of method development. The important factors are: the use of ammonium perchlorate (which is prepared in situ by treating aqueous ammonia with perchloric acid) mobile phase decreased the drift in the baseline and increased the peak response; selection of suitable strong anion-exchange stationary column to achieve high resolution between DS, Heparin and OSCS and; optimization of gradient program to achieve a shorter runtime as well as desired resolution of analytes. The HPLC method developed employs a strong anion exchange column and a gradient elution of 1.0M ammonium perchlorate (in situ) mobile phase containing 5mM phosphate buffer and adjusted to a pH of 3. A UV detector set at 202 nm was used and the sample solutions are prepared in a diluent mixture of solution A and B. The sample concentration is 40 mg/ml and an injection volume of 50µl is used. The analytical method was validated and was found to be precise, accurate and linear over a range of 50-150% of the individual specifications of the impurities. The method can be used for the determination and quantification of Dermatan sulphate and Oversulphated chondroitin sulphate in Heparin sodium.
MATERIALS AND METHODS
1.1 Reagents and materials Heparin sodium samples were obtained from Gland Pharma limited, Dundigal, Hyderabad. Dermatan sulphate and Over sulphated chondroitin sulphate standards were obtained from USP. Sodium dihydrogen phosphate monohydrate GR, Merck, Ammonia solution 25% for analysis, Merck, Orthophosphoric acid,
Int J Pharm Bio Sci 2014 Jan; 5(1): (P) 313 - 324
This article can be downloaded from www.ijpbs.net
P - 315
HPLC grade, Fisher Scientific and Perchloric acid about 70% for analysis, Merck were used. 1.2 Instrumentation A Shimadzu LC 2010A model HPLC equipped with gradient pump, eluent degasser, auto sampler, column heating oven and UV detector was used. Data acquisition was performed with a Shimadzu LC solutions software/chromatography data processor (Shimadzu Corporation, Japan). 1.3 Chromatographic conditions A GlycomixTM SAX column (250mm length x 4.6mm id) and guard column (50mm length x 4.6 mm id) manufactured by Sepax technologies inc. was used for the determination of contents of Dermatan sulphate and Oversulphated chondroitin sulphate in Heparin sodium. The mobile phase was a mixture of solution A - 5mM sodium dihydrogen phosphate monohydrate (pH adjusted to 3.0 with phosphoric acid) and solution B - 1M ammonium perchlorate (prepared in situ) containing 5mM sodium dihydrogen phosphate monohydrate (pH adjusted to 3.0 with aqueous ammonia or phosphoric acid). A linear gradient from 15 to 70% of solution B was used over a period of 22 minutes, return to 15% solution B at the end of 23 minutes and a stabilization period of 12 minutes at 15% solution B, thereby resulting in a 35 minutes runtime. The flow rate was 0.6 ml/min. The column temperature was maintained at 30°C. The sample concentration was 40 mg/ml in diluent, injection volume was 50 µL and the wavelength of detection was 202 nm. 1.4 Solution preparation 1.4.1 Mobile phase preparation Solution A: Accurately weigh about 690 mg of sodium dihydrogen phosphate monohydrate, dissolve and make up to 1000 ml with MQ water and adjust the pH to 3.0 with dilute phosphoric acid solution. Filter the solution through a 0.45µ membrane and sonicate to degas. Solution B: Accurately add about 86 ml of 70% perchloric acid to about 250 ml of MQ water and
cool the solution. Accurately add about 75 ml of 25% aqueous ammonia to about 250 ml of MQ water and cool the solution. Add the cooled ammonia solution to the cooled perchloric acid solution slowly and mix well (perform the addition under cooling in an ice bath). To this solution add about 690 mg of accurately weighed sodium dihydrogen phosphate monohydrate and sonicate to dissolve. Quantitatively make up the volume to 1000 ml with MQ water and adjust the pH to 3.0 with ammonia or dilute phosphoric acid solution. Filter the solution through a 0.45µ membrane and sonicate to degas. 1.4.2 Diluent preparation: Mix 850 ml of solution A and 150 ml of solution B. 1.4.3 System suitability solution preparation Prepare a 40mg/ml of Heparin sodium containing 1% each of DS and OSCS in diluent. (Accurately weigh about 400 mg of Heparin sodium standard in a 10 ml volumetric flask, add 2.0 ml of 2mg/ml OSCS standard solution and 2.0 ml of 2mg/ml DS standard solution, dissolve and dilute to volume with diluent.) 1.4.4 Diluted Standard preparation Prepare a solution containing 0.2mg/ml each of DS and OSCS in diluent. (Accurately pipette out 1.0 ml of 2mg/ml OSCS standard solution and 1.0 ml of 2mg/ml DS standard solution into a 10 ml volumetric flask and dilute to volume with diluent.) 1.4.5 Sample preparation Prepare a 40mg/ml solution of Heparin sodium API sample in diluent. (Accurately weigh about 400 mg of Heparin sample in a 10 ml volumetric flask, dissolve and dilute to volume with diluent.)
RESULTS AND DISCUSSION
1.5 Development of chromatographic method Initially an analytical method was developed which uses perchloric acid and sodium hydroxide in the mobile phase which in turn
Int J Pharm Bio Sci 2014 Jan; 5(1): (P) 313 - 324
This article can be downloaded from www.ijpbs.net
P - 316
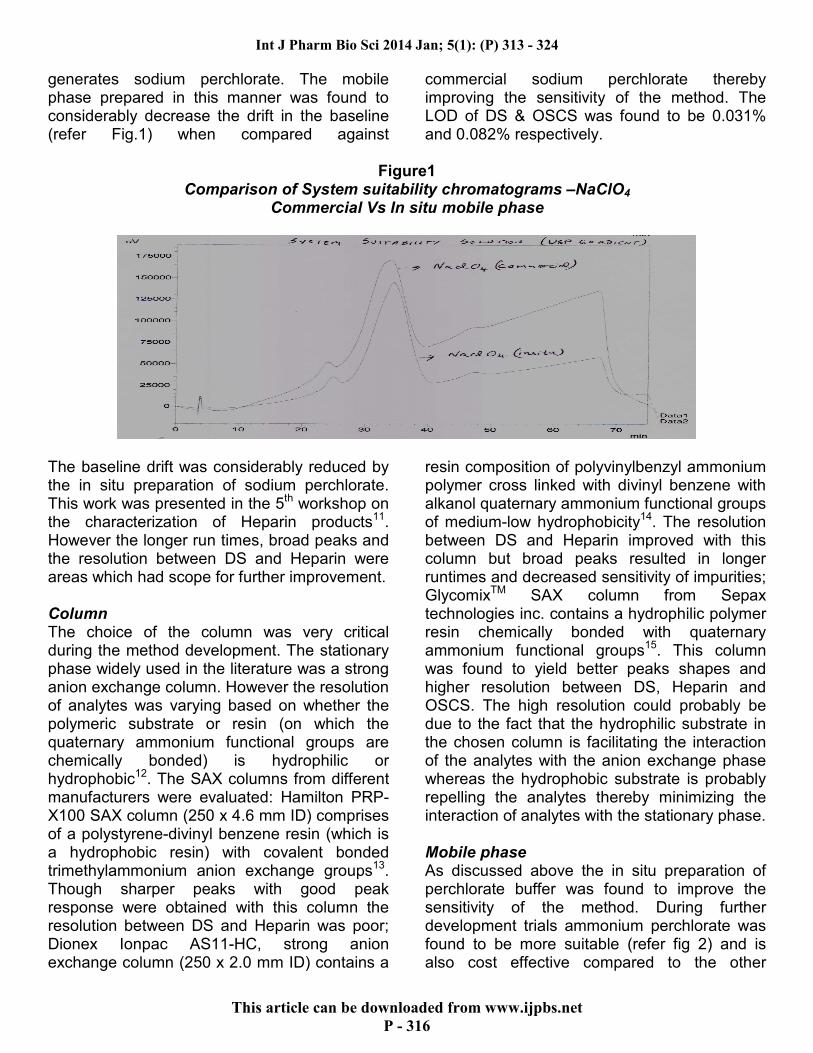
generates sodium perchlorate. The mobile phase prepared in this manner was found to considerably decrease the drift in the baseline (refer Fig.1) when compared against
commercial sodium perchlorate thereby improving the sensitivity of the method. The LOD of DS & OSCS was found to be 0.031% and 0.082% respectively.
Figure1
Comparison of System suitability chromatograms –NaClO4 Commercial Vs In situ mobile phase
The baseline drift was considerably reduced by the in situ preparation of sodium perchlorate. This work was presented in the 5th workshop on the characterization of Heparin products11. However the longer run times, broad peaks and the resolution between DS and Heparin were areas which had scope for further improvement. Column The choice of the column was very critical during the method development. The stationary phase widely used in the literature was a strong anion exchange column. However the resolution of analytes was varying based on whether the polymeric substrate or resin (on which the quaternary ammonium functional groups are chemically bonded) is hydrophilic or hydrophobic12. The SAX columns from different manufacturers were evaluated: Hamilton PRP-X100 SAX column (250 x 4.6 mm ID) comprises of a polystyrene-divinyl benzene resin (which is a hydrophobic resin) with covalent bonded trimethylammonium anion exchange groups13. Though sharper peaks with good peak response were obtained with this column the resolution between DS and Heparin was poor; Dionex Ionpac AS11-HC, strong anion exchange column (250 x 2.0 mm ID) contains a
resin composition of polyvinylbenzyl ammonium polymer cross linked with divinyl benzene with alkanol quaternary ammonium functional groups of medium-low hydrophobicity14. The resolution between DS and Heparin improved with this column but broad peaks resulted in longer runtimes and decreased sensitivity of impurities; GlycomixTM SAX column from Sepax technologies inc. contains a hydrophilic polymer resin chemically bonded with quaternary ammonium functional groups15. This column was found to yield better peaks shapes and higher resolution between DS, Heparin and OSCS. The high resolution could probably be due to the fact that the hydrophilic substrate in the chosen column is facilitating the interaction of the analytes with the anion exchange phase whereas the hydrophobic substrate is probably repelling the analytes thereby minimizing the interaction of analytes with the stationary phase. Mobile phase As discussed above the in situ preparation of perchlorate buffer was found to improve the sensitivity of the method. During further development trials ammonium perchlorate was found to be more suitable (refer fig 2) and is also cost effective compared to the other
Int J Pharm Bio Sci 2014 Jan; 5(1): (P) 313 - 324
This article can be downloaded from www.ijpbs.net
P - 317
commercially available perchlorates. Perchlorate and its concentration was the key factor affecting the separation and the concentration of sodium dihydrogen phosphate buffer was not found to be very critical and a
concentration of 5 millimolar phosphate buffer is chosen for both solution-A and solution-B. A pH of 3 was found to be ideal for the separation, though other pH values were evaluated.
Figure 2
Comparison of System suitability chromatograms - NaClO4 Vs NH4ClO4 mobile phase
Gradient optimization Several trials were performed to optimize the gradient program as it was very critical to achieve a good resolution between DS and Heparin at a shorter run time. The runtime of the previously published methods in the literature varies from 40 to 75 minutes. However with the optimized linear gradient of 15-70% of solution B the run time was cut short to 35 minutes. Diluent optimization Originally water was used as the diluent, but the response of DS was varying significantly with modifications in the diluent. DS was found to yield a false high response due to the diluent when water was used and multiple peaks when a mixture of solution-A and solution-B was used. After trying various compositions of solution-A and B it was found that 15:85 solution B:A was found to be ideal which is also the initial composition of solution A and B at the start of the gradient program.
Figure3
Optimization of diluents
Int J Pharm Bio Sci 2014 Jan; 5(1): (P) 313 - 324
This article can be downloaded from www.ijpbs.net
P - 318
Detector For detection of compounds which are devoid of a chromophore, especially when present in trace levels, derivatization would be a better choice16. However derivatization could not be opted for Heparin due to its complex nature. UV detection at 202 nm was found to be yielding good response for the analytes and the same was chosen for detection. Other parameters Other parameters such as the sample concentration, injection volume, flow rate and column temperature were also evaluated and suitably chosen to yield a method with good resolution of impurities and also sensitive enough to quantify impurities at low levels. 1.6 Method validation The optimized SAX-HPLC method was validated according to ICH guidelines17 with respect to range, accuracy, precision, linearity, ruggedness, specificity, limit of detection, limit of quantification, accuracy at LOQ and robustness. System suitability parameters were also evaluated.
1.6.1 System suitability test The acceptance criteria set was: the resolution between dermatan sulphate and heparin should be not less than 1.5 and the resolution between heparin and oversulphated chondroitin sulphate should be not less than 1.5. The results obtained were within acceptable limits. 1.6.2 Range (Accuracy, Precision & Linearity) 1.6.2.1 Accuracy Recovery solutions were prepared at concentrations spanning 50 to 150% of the proposed specification of the impurities with respect to the test concentration of 40.0 mg/ml. The % recovery for DS and OSCS were calculated for the individual runs at each level and a mean of the recovery was determined for each impurity based on the un-rounded data and reported to one decimal place. The accuracy (recovery) results are presented in Table 1. Accuracy at each level was within the acceptance criteria of 80.0 – 120.0 % of the theoretical concentration.
Table 1 Results of Accuracy Study
Level Accuracy (% recovery)
DS OSCS
50% 115.7 89.5
75% 112.3 86.6
100% 109.6 90.0
125% 110.4 87.5
150% 108.9 93.5
1.6.2.2 Precision Repeatability was determined by analyzing the sample preparation containing Heparin sodium at the method concentration and the impurities DS and OSCS spiked at 100% level of the specification with respect to the method concentration. The Heparin sodium API control sample without any spiking of impurities was analyzed to obtain the basal levels of the impurities. The content of related substances (DS and OSCS) was determined for each of the run and the mean of the related substances were determined. As shown in Table 2 percent RSD for the related substances results of six runs (containing impurities DS and OSCS at the 100% spiked level) was 0.1% and 4.2% for DS and OSCS respectively. Therefore, the method is precise and repeatable.
Int J Pharm Bio Sci 2014 Jan; 5(1): (P) 313 - 324
This article can be downloaded from www.ijpbs.net
P - 319
Table 2 Precision results
No Level Run DS (%) OSCS (%)
1 100% 1 2.219 0.51
2 100% 2 2.223 0.51
3 100% 3 2.215 0.48
4 100% 4 2.216 0.48
5 100% 5 2.216 0.47
6 100% 6 2.217 0.46
Average 2.22 0.48
% RSD 0.1 4.2
1.6.2.3. Linearity Linearity was performed as a part of range study to assess whether a linear relationship is obtained between the response and the concentration for the impurities over the intended operating range of the method. A minimum of five concentration levels were analyzed over a range of 50 to 150% of the proposed specification of each of the impurities. A linear regression analysis (without forcing through the origin) was performed on the data (concentration and peak response). The individual data points (Table 3 & 4) and plots of response versus concentration (Figures 4 & 5) are presented for impurities DS and OSCS. Index of determination (r2) was found to be 0.9984 and 0.9942 for impurity DS and OSCS respectively.
Table 3 Linearity results of DS
Level (with respect to specification)
Concentration in % (with respect to method concentration)
Concentration in mg/ml
Response (Area)
50 % 1.0% 0.4067 21996351
75 % 1.5% 0.6100 25823883
*100% 2.0% 0.8133 29338805
125% 2.5% 1.0167 33820181
150% 3.0% 1.2200 37910976
* 100% specification level of DS with respect to method concentration
Table 4
Linearity results of OSCS
Level (with respect to specification)
Concentration in % (with respect to method concentration)
Concentration in mg/ml
Response (Area)
50 % 0.250% 0.1080 1013681
75 % 0.375% 0.1620 1471260
*100% 0.500% 0.2160 2038403
125% 0.625% 0.2700 2478317
150% 0.750% 0.3240 3174991
* 100% specification level of OSCS with respect to method concentration
Int J Pharm Bio Sci 2014 Jan; 5(1): (P) 313 - 324
This article can be downloaded from www.ijpbs.net
P - 320
Figure 4: Linearity plot of DS Figure 5: Linearity plot of OSCS
1.6.3 Specificity Specificity was evaluated to ensure that no other compounds that may be present interfere appreciably with the quantitation of the analytes. Specificity of the method was demonstrated by its ability to separate Heparin sodium from its impurities. To demonstrate that the related substances/known synthetic impurities do not interfere with the quantitation of Heparin sodium, the drug substance and the impurities DS and OSCS were analyzed individually and their retention times were compared to establish separation. It was found that there were no peaks due to the diluent-blank or the impurities interfering with the quantification of Heparin sodium. (Figure 6)
Figure 6
Overlay of chromatograms from specificity study
1.6.4 Limit of detection and Limit of quantification The limit of detection and limit of quantification was established individually for the impurities (DS and OSCS) by analyzing the solutions prepared at different concentrations, ranging
from 1.0% to 0.005% with respect to the test concentration of 40.0 mg/ml. The limit of detection and limit of quantification of DS and OSCS were determined using the slope method. The LOD and LOQ obtained for DS were 0.031% and 0.095% respectively. The
Int J Pharm Bio Sci 2014 Jan; 5(1): (P) 313 - 324
This article can be downloaded from www.ijpbs.net
P - 321
LOD and LOQ obtained for OSCS were 0.061% and 0.184% respectively. A solution containing DS and OSCS was prepared around its LOQ level concentration and injected in six replicates. The RSD value obtained for the area of DS and OSCS at LOQ were 1.2% and 4.0% respectively. Recovery solutions of Heparin sodium spiked with the impurities DS and OSCS at their respective LOQ levels were prepared and analyzed to establish the accuracy at LOQ. The percent recovery for DS and OSCS at their corresponding LOQ levels were 125.2 % and 95.7 % respectively which was within the acceptance criteria of 70.0 – 130.0 % of the theoretical concentration at the LOQ level.
1.6.5 Ruggedness In order to demonstrate ruggedness, six runs of the sample preparation at the 100% level, prepared in the range study, was analyzed by another chemist on another system in a different lab. The two chemists analyzed the same sample preparations in different labs using different mobile phase lots and different HPLC systems and the content of related substances (DS and OSCS) was determined. The cumulative results of precision and intermediate precision studies and the cumulative % RSD is presented in Table 5. The similar results obtained by the two chemists and the cumulative %RSD values obtained within the acceptance criterion of 15% shows that the method is rugged and reproducible.
Table 5
Precision and Intermediate Precision Results
Content of % impurity from Chemist-1
% impurity from Chemist-2
% impurity Mean Cumulative % RSD
DS
2.219 2.328
2.26 2.22
2.223 2.315
2.215 2.321
2.216 2.323
2.216 2.292
2.217 2.287
OSCS
0.51 0.42
0.45 7.51
0.51 0.43
0.48 0.43
0.48 0.43
0.47 0.43
0.46 0.42
1.6.6 Robustness The method robustness measures the ability of the analytical method to tolerate minor variations in the method recommended parameters, demonstrating the reliability of the method under normal use. In order to demonstrate robustness a few of the parameters such as column temperature, mobile phase pH, and flow rate was varied intentionally and the system suitability parameters were evaluated with each variation. The system suitability criteria was met with all the variations; the method was found to be robust with variations of ± 5oC in the column
temperature, robust with variations of ± 0.5 in the pH of the mobile phase (solution-B) and robust with ± 0.1 ml/minute flow variations in the mobile phase. 1.6.7 Solution stability One of the standard and sample preparations at 100% level of the method concentration was stored at room temperature and was analyzed periodically to establish the solution stability. The response of DS and OSCS peaks in the standard preparation and the content of the related substances in the sample solution were measured to establish the solution stability. The
Int J Pharm Bio Sci 2014 Jan; 5(1): (P) 313 - 324
This article can be downloaded from www.ijpbs.net
P - 322
evaluations of the results obtained revealed that the standard solution and sample solutions are
stable for a minimum period of 3 days when stored at room temperature.
Figure 6 Typical System suitability Chromatogram
Figure 7 Typical Blank (Diluent) Chromatogram
Figure 8 Typical diluted Standard Chromatogram
Int J Pharm Bio Sci 2014 Jan; 5(1): (P) 313 - 324
This article can be downloaded from www.ijpbs.net
P - 323
Figure 9 Typical Chromatogram of Heparin sodium API
CONCLUSION The results of this validation study indicate that the optimized SAX-HPLC method using in situ ammonium perchlorate mobile phase is a single rapid and sensitive analytical tool for the quantification of low levels of Dermatan sulphate and Oversulphated chondroitin sulphate in Heparin sodium. This method employs an appropriate stationary phase which enhances the resolution between the analytes, is cost effective as the perchlorate salt is being prepared in situ from its basic chemicals and also is user-friendly as it employs a simple HPLC method with UV detection and a shorter run time. This method can also be used as a
single method for quantification of Heparin and its impurities. It can be easily adapted by laboratories for the quality control of marketed heparin products.
ACKNOWLEDGEMENT
The author of this article sincerely thanks the management of Gland Pharma Limited for providing complete support to carry out this development and validation and also thanks JNTUH for giving an opportunity to pursue this research work.
REFERENCES
1. Szabolcs Beni, Analysis and
characterization of heparin impurities, Anal Bioanal Chem (2011), 399:527-539
2. Albert K.Korir, Advances in the separation, sensitive detection, and characterization of heparin and heparin sulphate, Anal Bioanal Chem (2009), 393:155-169
3. David A. Keire, Analysis of crude heparin by 1H NMR, capillary electrophoresis, and strong-anion-exchange-HPLC for contamination by over sulphated chondroitin sulphate, Journal of Pharmaceutical and Biomedical Analysis 51 (2010) 921-926
4. USFDA website for information on Heparin, http://www.fda.gov/Drugs/DrugSafety/PostmarketDrugSafetyInformationforPatientsandProviders/ucm112597.htm
5. C.S.Venkatesan, Contamination of Heparin – Current situation and perspectives, 2nd workshop on the characterization of Heparin products, June 2008, EDQM, Strasbourg, France.
8. Michael L. Trehy, Analysis of heparin sodium by SAX/HPLC for contaminants and impurities, Journal of Pharmaceutical and Biomedical Analysis 49 (2009) 670-673
9. Analysis of Crude Heparin by HPLC/SAX for Oversulphated Chondroitin Sulphate, Laboratory Procedure, Document # DPA-WI-037, Food and Drug Administration, Division of Pharmaceutical Analysis, March 22, 2010.
10. Catalin E.Doneanu, Impurity evaluation of Heparin Sodium by Anion Exchange Chromatography, Biopharmaceutical Sciences Group, Waters Corp., U.S.A.
11. C.S.Venkatesan, 5th workshop on the characterization of Heparin products, August 2012, USP, Washington DC.
12. Uwe D.Neue, HPLC Columns – Theory, Technology, and Practice, Wiley-VCH, Inc. 236-238
13. Hamilton website: http://www.hamiltoncompany.com/HPLC/techInfo/resinSpecifications.php or http://www.hamiltoncompany.com/item/view/c/369/p/2505/
14. Product manual for Dionex IonPacTM
AS11-HC and AG11-HC Columns, 031333-09, February 2012,http://www.dionex.com/en-us/webdocs/4350-Man-031333-09-IonPac-AS11HC-Feb12.pdf
15. Xiaomi Xu, High Resolution Analysis of Heparin and Heparin-like Impurities on GlycomixTM – an Anion Exchange Column, Sepax Technologies, Inc., USA.
16. R.Srikanth, Development and validation of RP-HPLC pre-column derivatisation for the trace level determination of tert-butylamine in Tigecycline drug substance, International Journal of Pharma and Bio Sciences 2013 Apr; 4(2): (P) 522 - 531
17. ICH – Q2A and Q2B guidelines for validation of analytical procedures