Seismic Risk Assessments for Border Area of
Shanxi, Hebei and Inner Mongolia, China
Jianming Yu Inner Mongolia Earthquake Administration, Hohhot, China
Email: [email protected]
Abstract—With a large amount of information, materials of
seismic intensity in history include PGA, seismic intensity
attenuation and effects of site and buildings etc. By
analyzing well-recorded materials of seismic intensity in
border areas of Shanxi, Hebei and Inner Mongolia within
500 years, this paper proposes the method of seismic
tendency assessment, which is similar to seismic risk
analysis. The key to that way is establishing relation curve
of seismic intensity and average repetition period, and
applying it to the assessment of seismic risk. First, based on
ArcGIS, we built a data bank of seismic intensity, and
turned administrative map of border areas into longitude
and latitude grid line with basic unit of 0.1°×0.1°; second,
we got seismic intensity—frequency relation (namely hazard
curve) of each unit by using the least squares fitting on
seismic intensity materials; last, based on the hypothesis
that the earthquake has cycle, we use hazard curve to
estimate the repetition period of different intensities,
intensity distribution of every 100 year, and exceeding
probability of certain intensity (such as VI, VII andVIII) in
50 years in representative cities and counties of Shanxi,
Hebei and Inner Mongolia border areas;The calculation
indicates that Datong-Huairen-Hunyuan and Huailai-
Yanqing have high seismic risk and should be paid attention
to.
Index Terms—seismic intensity, hazard curve, repetition
period, exceeding probability, seismic risk
I. INTRODUCTION
The earthquake always causes huge casualties and
property loss among all the natural calamities on the
planet. There happened many destructive earthquakes [1]
in the history of China since the country locates between
the two tremendous seismic belts: Circum-Pacific
Seismic belts and Mediterranean–Himalayan Seismic
belts, such as the Shanxi Guanzhong earthquake with a
magnitude of 8.0 in 1556(over 830 thousand people died
or disappeared) and the Sichuan Wenchuan earthquake
with the same magnitude in 2008(over 80 thousand
people died or lost) [2]. The most primary factors causing
giant lives loss and property damaging are always
surrounding construction and region environment
destroying by the earthquake. So far on the fact that the
earthquake could not be predicted precisely, seismic
fortification step is the best way to reduce economy loss
and death [3], which is closely correlated to the
Manuscript received January 14, 2017; revised May 4, 2017.
technology level and the economy development of the
country according to the basic documents in seismic
subject. Rich and detailed historical seismic data offers
beneficial advantages for researching the seismic hazard.
The paper carries on the seismic hazard analyzing and
risk predicting with the seismic intensity documents from
A.D. 1500 to A.D. 2000 in Shanxi, Hebei and Inner
Mongolia bording area so as to obtain time features of the
region earthquake activeness [4].
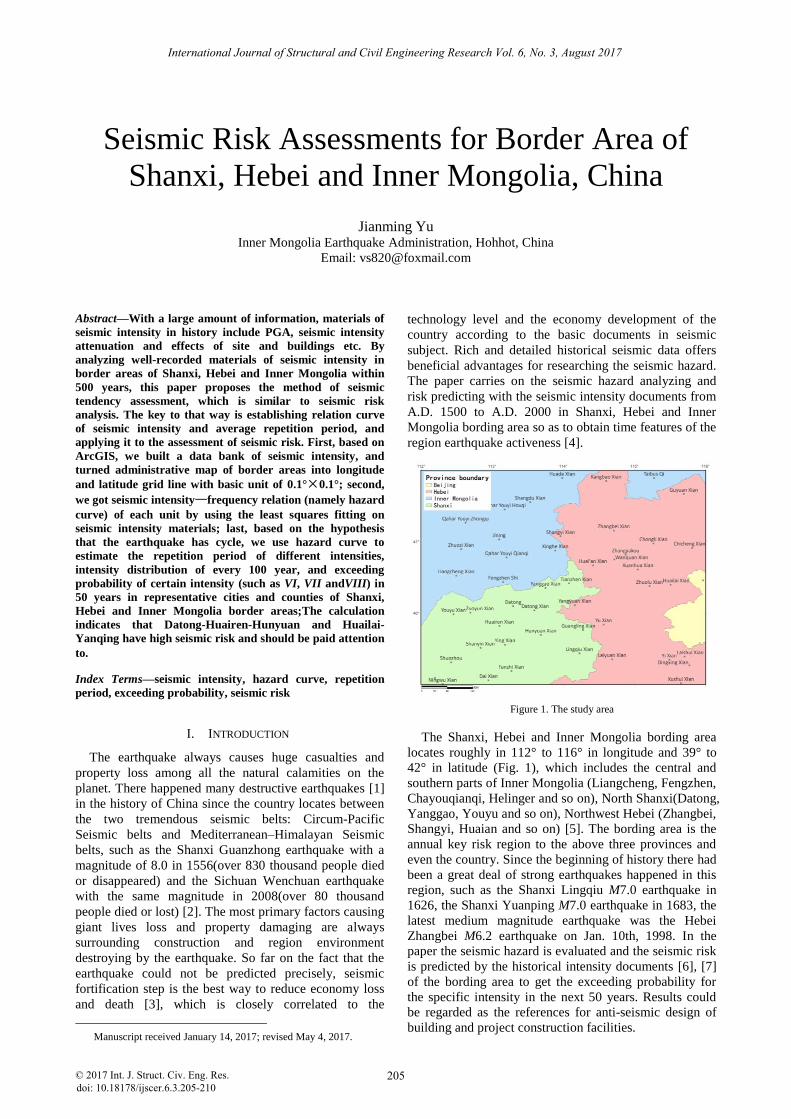
Figure 1. The study area
The Shanxi, Hebei and Inner Mongolia bording area
locates roughly in 112° to 116° in longitude and 39° to
42° in latitude (Fig. 1), which includes the central and
southern parts of Inner Mongolia (Liangcheng, Fengzhen,
Chayouqianqi, Helinger and so on), North Shanxi(Datong,
Yanggao, Youyu and so on), Northwest Hebei (Zhangbei,
Shangyi, Huaian and so on) [5]. The bording area is the
annual key risk region to the above three provinces and
even the country. Since the beginning of history there had
been a great deal of strong earthquakes happened in this
region, such as the Shanxi Lingqiu M7.0 earthquake in
1626, the Shanxi Yuanping M7.0 earthquake in 1683, the
latest medium magnitude earthquake was the Hebei
Zhangbei M6.2 earthquake on Jan. 10th, 1998. In the
paper the seismic hazard is evaluated and the seismic risk
is predicted by the historical intensity documents [6], [7]
of the bording area to get the exceeding probability for
the specific intensity in the next 50 years. Results could
be regarded as the references for anti-seismic design of
building and project construction facilities.
205
International Journal of Structural and Civil Engineering Research Vol. 6, No. 3, August 2017
© 2017 Int. J. Struct. Civ. Eng. Res.doi: 10.18178/ijscer.6.3.205-210
II. SOURCE AND DIGITALIZING OF HISTORICAL
SEISMIC INTENSITY DATA
Earthquakes after A.D. 1500 were recorded in detail as
the intensity degree reaches v [8], hence, the paper
chooses all the earthquakes with the magnitude greater or
equals to 4.75 after A.D. 1500 from the earthquake
catalogues, including 32 ancient earthquakes (A.D. 1500-
A.D. 1911) and 15 modern times’ earthquakes (A.D.
1912-A.D. 2000), parts of which are listed in Table I.
However, there are 26 earthquakes with no complete
earthquake examples, which could not lead to assured
intensity level. The experiments adopt the mean axis
intensity decaying formula [9] suitable to Shanxi and
Hebei of North China:
2.429 1.499 1.39ln( 11) =0.377I M R (1)
and the earthquake intensity decaying relation suitable to
medium and west region of Inner Mongolia [10]:
2.7517 1.2610 1.0941ln( 12) =0.519a aI M R (2)
2.5671 1.0966 0.9338ln( 6) =0.536b bI M R (3)
to estimate the intensity in the study area, where I
represents the intensity degree, M represents the
magnitude level, R represents mean-axis radius (in km),
the index a, b respectively equals to the direction of the
long axis and the short axis, Ra and Rb represents the long
axis radius and the short axis radius of the intensity
isoseismal, σ is the standard deviation.
The paper divides the study area into many square
frames with same size to reflect the spatial distribution
features for the seismic activities of the area and evaluate
the seismic risk of each place by regarding the frame as
an independent statistics unit.
Considering synthetically the region range, geology
feature, density of population and so on, the study area is
divided into many base units with 0.1°× 0.1° in latitude.
Get the sequence number of each unit by numbering it
from bottom to top and from left to right. Then
digitalizing every seismic intensity map with ArcGIS [11]
under the Xi’an 80 geographical coordinate system to get
the intensity observations distribution grid map, the
sample number for the seismic intensity in each unit is
from 3 to 45 (Fig. 2).
Figure 2. Distribution number of intensity observations
TABLE I. PART OF INTENSITY OBSERVATIONS
Province Seismogenic
data
Epicenter
(latitude longitude) Toponymy
Magnitude
Ms
Intensity
I
Spindle
direction
Shanxi 1626-06-28 39.4 114.2 Lingqiu 7.0 Ⅴ-Ⅸ 16.80
Shanxi 1683-11-22 38.7 112.7 Yuanping 7.0 Ⅴ-Ⅸ 21.50
Shanxi 1673-10-18 40.5 113.5 Tianzhen 6.5 Ⅴ-Ⅷ 16.84
Shanxi 1989-10-19 39.9 113.9 Datong 5.9 Ⅴ-Ⅶ 8.92
Hebei 1720-07-12 40.4 115.5 Shacheng 6.8 Ⅴ-Ⅷ 14.93
Hebei 1618-11-16 39.8 114.5 Yuxian 6.5 Ⅴ-Ⅷ 19.71
Hebei 1628-10-07 40.6 114.2 Huaian 6.5 Ⅴ-Ⅷ 17.59
Hebei 1998-01-10 41.1 114.3 Shangyi 6.2 Ⅴ-Ⅷ 22.36
Hebei 1658-02-03 39.4 115.7 Laishui 6.0 Ⅴ-Ⅶ 157.13
Hebei 1911-01-25 39.8 114.5 Yuxian 5.9 Ⅴ-Ⅶ 19.71
Inner Mongolia 1976-04-06 40.2 112.1 Helin 6.2 Ⅴ-Ⅷ 66.03
III. SEISMIC HAZARD ANALYZING
The seismic intensity –frequency relation, namely the
hazard curve to the unit could be obtained by analyzing
the digitalized base unit, the relation describes the
frequency of earthquake occurrence at a certain intensity
degree. According to references [12], [13], the relation
between the seismic magnitude and frequency obeys the
Gutenberg-Richter formula, which indicates seismic
events distribute adequately in all magnitude levels and
Gutenberg-Richter relationship has high goodness of fit.
Replacing the magnitude with the intensity, yields,
lg f a b I (4)
where I represents the intensity, f represents annual rate
of the intensity occurrence when it is greater than or
equals to I, a and b are parameters obtained by the least
square method. Among all units with the size 0.1°×
0.1°, a varies within the range between -3.07 and 1.73, b
varies between -0.08 and 0.68. Fig. 3 shows the intensity-
frequency fitting curves of Fengzhen, Lingqiu, Shuozhou
and Zhangjiakou, as well as the value of a and b. After
the fitting finished, the curve slope is close to zero since
the intensity observations of part units are much at one,
which runs counter to a fact that the intensity
observations distribution of any unit reduces as the
intensity degree grows. On the above basis the average
value of minus b, is seen as the average curve slope and
applied to each unit, that is the slope for the intensity-
206
International Journal of Structural and Civil Engineering Research Vol. 6, No. 3, August 2017
© 2017 Int. J. Struct. Civ. Eng. Res.
frequency relationship of each unit equals to minus 0.29.
Re-fitting the intensity-frequency curves of all the units
in the study area with a certain slope minus 0.29 keeping
the curves distribute on the two sides of the intensity-
frequency points [14] (Fig. 3).
Figure 3. The frequency-intensity curves for Fengzhen, Lingqiu, Shuozhou and Zhangjiakou cell
TABLE II. RETURN PERIOD OF DIFFERENT INTENSITY FOR VARIOUS CITIES AND COUNTIES OF THE STUDY AREA
Toponymy Epicenter
No. observations Return period (years)
Latitude longitude I Ⅴ I Ⅵ I Ⅶ I Ⅷ Jining 41.05° 113.15° 812 18 45 87 170 331
Fengzhen 40.45° 113.04° 571 21 52 102 199 389
Yanggao 40.34° 113.64° 537 25 37 72 141 275 Hunyuan 39.65° 113.76° 258 29 37 72 141 275
Yuxian 39.76° 114.45° 305 22 59 115 224 437
Lingqiu 39.45° 114.15° 182 39 38 74 145 282 Shangyi 41.04° 114.05° 821 14 68 132 257 501
Zhangbei 41.15° 114.65° 867 18 51 100 195 380 Shuozhou 39.36° 112.45° 125 25 31 60 117 229
Zhangjiakou 39.37° 114.15° 748 26 54 105 204 398
The minimum variance of the curve is given by
2(lg lg )=
i c
I
f f
N
(5)
where NI represents the intensity observation number, f
represents the annual occurrence rate (fi represents the
frequentness by intensity observations, fc represents the
frequentness by the fitting curve). The minimum variance
varies between 0.0001 and 0.8471, there will be giant
difference between the fitting value of the intensity-
frequency relation and the truth while the unit contains no
enough intensity observations, which leads to low
correlation (Fig. 4).
The annual occurrence rate f or the average return
period τ corresponding to a certain intensity could be
estimated with the slope value–b and intercept value a
according to the hazard curve formula (4), the above
process also can be used for calculating the intensity
corresponding to the certain annual occurrence rate or the
average return period [15], for example, the intensity
value corresponding to an average return period of 100
207
International Journal of Structural and Civil Engineering Research Vol. 6, No. 3, August 2017
© 2017 Int. J. Struct. Civ. Eng. Res.
years could be given by the formula (6) using the relation
that the τ and f are the inverse of each other,
2aI
b
(6)
the return periods corresponding to the intensity value V,
VI, VII and VIII in the main counties and cities of the
study area are listed in Table II, the intensity distribution
to the average return period of 100 years is shown in Fig.
5.
Figure 4. The least squares residual ( )
Figure 5. Intensity distribution for return period of 100 years
It is shown in Table II that, (a), except Shangyi area,
the return periods in the main cities and counties spread
from 60 to 100 years under the premise the intensity I
reaches VI. (b), under the premise the intensity I reaches
VII the return periods within the same region spread from
110 to 260 years. (c), when the intensity I reaches VIII,
except a minority of places, such as Yanggao, Hunyuan,
Shuozhou and so on, most counties and cities have the
return periods of over 300 years.
As shown in Fig. 5, (a), only the intensity in No. 225
unit of Lingqiu reaches VIII with the return period of 100
years. (b), the intensity in most parts of Shanxi, part of
Hebei and Beijing in the study area reaches VII. (c), the
intensity decreases when the latitude grows and the
minimum intensity value is IV.
IV. SEISMIC RISK EVALUATION
The key phases for making the anti-seismic standard or
other anti-seismic actions are evaluating the upper
magnitude limit and the criticality for the researching
place to predict the location and intensity of the
earthquake in the future several decades, the above
process is called evaluation for the seismic risk. The
paper proposed the Poisson Model to take the evaluation
under the assument that occurrence of two different
earthquakes independent to each other. The seismic risk,
namely the seismic probability P of some certain place
over a specific intensity(I) over a period of time(t) can be
calculated by,
1 exp( )tp
(7)
where τ expresses the mean return period for I is greater
than or equals to I, t expresses the existence time of the
certain buildings or facilities. The steady Poisson process
for the earthquake indicates the earthquakes could be
seen as a series of independent events in time and space.
After a massive earthquake happened, the occurrence
probability of another massive earthquake will not be
changed. The formula (7) could also be used to evaluate
the risk of other types of natural hazard, such as the flood
and hurricane.
Using the formula (4) and (7) to estimate the seismic
risk of each unit. The different exceeding probability in
the future 50 years is shown in Fig. 6 and Table III when
the intensity I is greater than or equals to VI, VII and VIII,
respectively.
The overall distribution trend for the exceeding
probability in the next 50 years with the different
intensity varying between VI and IX is described as
following: the intensity of the medium and southern part
of the study area is higher than that in the north part, the
highest intensity value is mainly in Liangcheng-Helin
district, most of Shanxi and Zhuolu-Yanqing district.
There is a high probability with the intensity greater than
of equals to VI, the value in the area south of 41.2°N
reaches more than 50%, Liangcheng-Helin district,
enclosed area by Lingqiu-Guangling-Fengzhen-Youyu-
Shuozhou and Yanqing-Xuanhua-Zhuolu district has a
probability over 70%, by comparison, the probability
value in the area north of 41.2°N decreases when the
longitude increases; the distribution areas keeping the
highest probabilities varying between 40% and 60% with
the intensity greater than or equals to VII are Liangcheng-
Helin district, enclosed area by Hunyuan-Datong-Youyu-
Shangyin-Daixian-Fanzhi, Guangling-Lingqiu district
and Zhuolu-Huailai-Yanqing district; most parts of the
study area have low probabilities under 15% with the
intensity greater than or equals to VIII except the Datong-
huairen and Yanqing district, which have the exceeding
probability over 30%.
V. CONCLUSIONS
The key to seismic risk evaluation is establishing the
curve of the seismic intensity and its frequency(in year),
208
International Journal of Structural and Civil Engineering Research Vol. 6, No. 3, August 2017
© 2017 Int. J. Struct. Civ. Eng. Res.
which mainly based on (a), rich historical seismic
intensity data is the reliable resource for evaluating
seismic risk, (b), evaluation results in the form of
probability could be applied for anti-seismic project
construction appropriately [16]. It is noted that from the
return periods to different intensity in the study area in
Table II the return periods to the intensity VIof most parts
of the study area is less than or equals to 100 years; the
return periods to the intensity VII vary between 100 and
300 years; while the return periods to the intensity VIII
change from 200 to 500 years.
TABLE III. SEISMIC RISK FOR MAJOR COUNTIES IN THE STUDY AREA
Toponymy Epicenter
No.
Exceeding
probability
to I ≥Ⅵ(%)
Exceeding
probability
to I ≥Ⅶ(%)
Exceeding
probability
to I ≥Ⅷ(%) Latitude longitude
Jining 41.00° 113.10° 812 66 36 9
Fengzhen 40.45° 113.04° 571 63 27 12 Yanggao 40.35° 113.74° 538 52 38 15
Hunyuan 39.65° 113.75° 258 72 36 18
Yuxian 39.76° 114.45° 305 57 37 14 Lingqiu 39.45° 114.15° 182 75 46 20
Shangyi 41.05° 113.95° 820 31 24 13 Zhangbei 41.15° 114.64° 867 59 34 14
Shuozhou 39.36° 112.45° 125 84 32 18
Zhangjiakou 40.85° 114.84° 748 59 39 20
Figure 6. Exceedance probability of I ≥VI, VII, VIII in 50 years in the study area
Evaluation results for seismic risk of the study area are
listed as following; (a), the exceeding probability in the
next 50 years with the intensity greater than or equals to
VI in most region of the study area except the Shangyi
area is over 50%, the highest probability value is 84% in
Shuozhou; (b), the exceeding probability in the next 50
years with the intensity greater than or equals to VII
varies between 20% and 50%, in a word, its value
decreases when the latitude increases; (c), the exceeding
probability in the next 50 years with the intensity greater
than or equals to VIII is less than or equals to 20%, the
lowest value is 9% in Jining and the highest value is 20%
in Lingqiu and Zhangjiakou. According to the seismicity
trend at present, in the future 50 years, the probability
encountering the intensity VI, VII and VIIIof the study
area is greater than 53%, 30% and 14%, respectively(Fig.
6).
The intensity-frequency relationship from G-R
empirical correlation is suitable for most types of
earthquakes. Since the actual magnitude distributions
209
International Journal of Structural and Civil Engineering Research Vol. 6, No. 3, August 2017
© 2017 Int. J. Struct. Civ. Eng. Res.
have great deviations with that by G-R relationship[17],
based on which, then intensity-frequency curve has the
same defects. The magnitude and frequency relation of
the sensible and weak shocks happened in the incubation
of the few strong earthquakes does not obey G-R
relationship[18]. The bias of the two relationships should
be discussed in the future work to provide the right
supplement.
ACKNOWLEDGEMENT
This work is supported by both the director fund of
Inner Mongolia Earthquake Administration under Grant
No. 2016YJ02 and the project for tracking the earthquake
situation in 2016 under Grant No. 2016020305.
REFERENCES
[1] Z. P. Song, J. Y. Yin, Y. Xue, et al., “The global and sub~zone
period characteristics for large earthquakes,” Chinese J. Geophys, vol. 56, no. 6, pp. 1868-1876, 2013.
[2] Y. T. Chen, Z. X. Yang, Y. Zhang, et al., “From 2008 wenchuan
earthquake to 2013 lushan earthquake,” Scientia Sinica Terrae, vol. 43, no. 6, pp. 1064-1072, 2013.
[3] M. Z. Zhang, “Reflection on the seismic fortification and design in light of the Wenchuan Earthquake,” China Civil Engineering
Journal, vol. 42, no. 5, pp. 21-24, 2009.
[4] W. Y. Li and Q. R. Zhang, “A parameter for the time-distribution of seismic activity,” Journal of Seismology, vol. 6, no. 2, pp. 54-
58, 1987. [5] H. B. Zhu, H. Li, M. J. Wu, et al., “Quiescence-seismic -
quiescence evolution of medium-earthquakes before moderate-
strong shocks in junction region of Shanxi, Hebei and Neimenggu,” Progress in Geophysics, vol. 29, no. 3, pp. 1114-
1120, 2014. [6] China Earthquake Administration, Recent earthquake catalog of
China (1912-1990, Ms ≥ 4.7), Beijing: Chinese Science and
Technology Press, 1999. [7] China Earthquake Administration. Historical strong earthquake
catalog of China (2300 B.C. -1911 A.C.), Beijing: Earthquake
Publishing House, 1999.
[8] W. Q. Huang, W. X. Li, and X. F. Cao, “Research on the integrity of seismic data in Chinese mainland,” Acta Seismologica Sinica,
vol. 16, no. 3, pp. 273-280, 1994.
[9] H. J. Sha, Research on Seismic Attenuation Relationship in North China, Beijing: Institute of China Seismological Bureau cruStal
Stress, 2004. [10] Y. M. Yang, Y. Dai, G. Q. Zhang, et al., “Attenuation relation of
seismic intensity in the middle and western regions of Inner
Mongolia Autonomous Region,” Seismological and Geomagnetic Observation and Research, vol. 37, no. 1, pp. 31-37, 2016.
[11] M. Han, B. C. Dai, D. C. Zheng, et al, “Research and application of electronic map based on ArcGIS server,” Science of Surveying
and Mapping, vol. 36, no. 3, pp. 204-206, 2011.
[12] B. Gutenberg and C. F. Richter, “Frequency of earthquakes in California,” Nature, vol. 156, no. 3960, pp. 371, 1945.
[13] Z. H. Li, J. Z. Qing, and Y. J. Su, “The relationship of earthquake magnitude and frequency under the condition of discrete
magnitude,” Chinese J. Geophys, vol. 54, no. 4, pp. 1038-1042,
2011. [14] S. B. Bozkurt, R. S. Stein, and S. Toda, “Forecasting probabilistic
seismic shaking for greater Tokyo from 400 years of intensity observations,” Earthquake Spectra, vol. 23, no. 3, pp. 525-546,
2007.
[15] J. W. Liu, Z. M. Wang, and F. R. Xie, “Seismic hazard and risk assessments for Beijing-Tianjin-Tangshan area, China,” Chinese J
Geophys, vol. 53, no. 2, pp. 318-325, 2010. [16] J. W. Liu, The Study on the Method of Seismic Hazard Assessment
Based on Historical Intensity Observations, Beijing: Institute of
Geology, China Earthquake Administration, 2011. [17] S. Okuda, T. Ouchi, and T. Terashima, “Deviation of magnitude
frequency distribution of earthquakes from the gutenberg-richter law: Detection of precursory anomalies prior to large
earthquakes,” Phys. Earth Planet. Inter., vol. 73, no. 3-4, pp. 229-
238, 1992. [18] Z. X. Li, B. Z. Tao, A. V. Ponomarev, et al., “Laboratory
experimental and seismicity analysis on deviation of magnitude-frequency relationship,” J. Wuhan Univ. (Nat. Sci. Ed.), vol. 55,
no. 6, pp. 721-727, 2009.
Jianming Yu was born in Hohhot, China, on May 24, 1987. He
received B.S. and M.S. degrees in automation from Inner Mongolia University, Hohhot, China, in 2009 and 2013, respectively. From 2013
to 2016, he was an engineer at the Inner Mongolia Earthquake
Administration in Hohhot, China. His main research interests are in the fields of earthquake emergency processing and ArcGIS application on
the Seismology.
210
International Journal of Structural and Civil Engineering Research Vol. 6, No. 3, August 2017
© 2017 Int. J. Struct. Civ. Eng. Res.