* Professor of Finance & Accounting, ICFAI Business School, Hyderabad, Telangana, India, E-mail: [email protected]** Assistant Professor, Xavier Institute of Management & Entrepreneurship (XIME), Electronics City, Phase II, Hosur Road, Bangalore 560 100, Karnataka, India, E-mail: [email protected]I J A B E R, Vol. 14, No. 6, (2016): 3841-3857 INTERNATIONAL LINKAGES OF THE INDIAN AGRICULTURE COMMODITY FUTURES MARKETS B. Brahmaiah * and Srinivasan Palamalai ** Abstract: The present paper attempts to examine the international linkage between the Indian and world futures markets with reference to five agriculture commodities, viz. Cotton, Crude Palm Oil, Refined Soya Oil, Soya Bean and Sugar, using Johansen Cointegration test and Vector Error Correction Model. The cointegration result confirms that there is a long-run relationship between the Indian futures and World futures prices of each commodity that belongs to Agricultural sector. Besides, the empirical evidence suggests that the World futures market prices leads to the Indian futures market prices for the case of Agriculture commodities such as Cotton, Crude Palm Oil, Refined Soya Oil, Soya Bean and Sugar, both in the long-run and short-run. It can be therefore, the present study concludes that the World agriculture futures markets plays a dominant role in influencing the price movement of Indian agriculture futures market prices of Cotton, Crude Palm Oil, Refined Soya Oil, Soya Bean and Sugar. JEL Codes: C32, G12, G13 Keywords: Cross Market Linkages, Agriculture Commodity, Cointegration, VECM 1. INTRODUCTION The futures markets mechanism was introduced in India started by Bombay cotton trade association in 1875. Primarily the market functions were materialized and the most of trading process were done by the manual works. In 1994, the Kapra committee had been recommended to Forward Market Commission (FMC) to create the electronic trading platform in India based on that online commodity trading operations has been begins on 2002-03 in India. The main legal framework governing Commodity Derivatives Market in India is the Forward Contracts Regulation Act 1952 (FCRA). The exchanges are regulated by the Forward Market Commission. The commodity market has been segmented into two types as forwards, and futures. Options contracts are not enforced in agricultural commodities in the market. The exchanges are offering online trading system to the investors. The online systems provide the transparency process of market
Transcript
* Professor of Finance & Accounting, ICFAI Business School, Hyderabad, Telangana, India, E-mail:[email protected]
** Assistant Professor, Xavier Institute of Management & Entrepreneurship (XIME), Electronics City,Phase II, Hosur Road, Bangalore 560 100, Karnataka, India, E-mail: [email protected]
I J A B E R, Vol. 14, No. 6, (2016): 3841-3857
INTERNATIONAL LINKAGES OF THE INDIANAGRICULTURE COMMODITY FUTURES MARKETS
B. Brahmaiah* and Srinivasan Palamalai**
Abstract: The present paper attempts to examine the international linkage between the Indianand world futures markets with reference to five agriculture commodities, viz. Cotton, CrudePalm Oil, Refined Soya Oil, Soya Bean and Sugar, using Johansen Cointegration test andVector Error Correction Model. The cointegration result confirms that there is a long-runrelationship between the Indian futures and World futures prices of each commodity thatbelongs to Agricultural sector. Besides, the empirical evidence suggests that the World futuresmarket prices leads to the Indian futures market prices for the case of Agriculture commoditiessuch as Cotton, Crude Palm Oil, Refined Soya Oil, Soya Bean and Sugar, both in thelong-run and short-run. It can be therefore, the present study concludes that the Worldagriculture futures markets plays a dominant role in influencing the price movement ofIndian agriculture futures market prices of Cotton, Crude Palm Oil, Refined Soya Oil, SoyaBean and Sugar.JEL Codes: C32, G12, G13Keywords: Cross Market Linkages, Agriculture Commodity, Cointegration, VECM
1. INTRODUCTION
The futures markets mechanism was introduced in India started by Bombay cottontrade association in 1875. Primarily the market functions were materialized andthe most of trading process were done by the manual works. In 1994, the Kapracommittee had been recommended to Forward Market Commission (FMC) to createthe electronic trading platform in India based on that online commodity tradingoperations has been begins on 2002-03 in India. The main legal frameworkgoverning Commodity Derivatives Market in India is the Forward ContractsRegulation Act 1952 (FCRA). The exchanges are regulated by the Forward MarketCommission. The commodity market has been segmented into two types asforwards, and futures. Options contracts are not enforced in agriculturalcommodities in the market. The exchanges are offering online trading system tothe investors. The online systems provide the transparency process of market
3842 � B. Brahmaiah and Srinivasan Palamalai
participants. Then agricultural commodities trading have also been included inthe existing market system.
The commodity futures market in India has achieved substantial developmentin term of transparency, technology and trading activities. The futures marketsevince huge interest to traders, market participants and exchange stakeholders inIndia and abroad. The market microstructure of commodity futures market hasundergone metamorphosis in the last decade. Commodity Derivatives Marketwitnessed huge increase in volumes after reforms in trading, clearing andsettlement processes and risk management.
Futures market development has been the focus of many studies in recent yearssince it provides important functions related to price discovery and riskmanagement through hedging. Price discovery is the process of revealinginformation about future spot prices through the futures market prices. The essenceof the price discovery function hinges on whether new information is reflectedfirst in changes of futures prices or changes of spot prices. Another interestingprospective on understanding market linkages has its origin in the efficient markethypothesis which says that all markets incorporate any new informationsimultaneously and there does not exist any lead-lag relationship across thesemarkets. However, frictions in markets, in terms of transaction costs andinformation asymmetry, may direct to lead-lag relationship between markets. Asa consequence, understanding the influence of one market on the other orexamining the cross market linkages have become increasingly important researchissue among academicians, regulators and practitioners alike as it provides anidea about the market efficiency, volatility, hedging effectiveness and arbitrageopportunities, if any. Moreover, understanding information flow across marketsis also important for hedge funds, portfolio managers and hedgers for hedgingand devising cross-market investment strategies.
The present paper attempts to examine the international linkage between theIndian and world futures markets with reference to five agriculture commodities,viz. Cotton, Crude Palm Oil, Refined Soya Oil, Soya Bean and Sugar. The remainderof the article is organised as follows: Section 2 provides the review of literature.Section 3 describes the methodology and data used for empirical analysis. Section4 offers empirical results and discussion of the study. Conclusions are presentedin section 5.
2. REVIEW OF LITERATURE
Hua and Chen (2007) studied the relationship between the Chinese and Worldfutures markets of copper, aluminum, soybean and wheat, using Johansen’scointegration test, error correction model, the Granger causality test and impulseresponse analyses. They found that the futures prices in the Shanghai Futures
International Linkages of the Indian Agriculture Commodity Futures Markets � 3843
Exchange are cointegrated with the futures prices on the London Metal Exchange(LME) for copper and aluminum. They also found that a cointegration relationshipexists for Dalian Commodity Exchange and Chicago Board of Trade (CBOT)soybean futures prices, but no such relationship for Zhengzhou CommodityExchange and CBOT wheat futures prices. They further found that while LME hasa bigger impact on Shanghai copper and aluminum futures and CBOT a biggerimpact on Dalian soybean futures, the Chinese futures markets also have a feedbackimpact on LME and CBOT futures.
Kumar and Pandey (2011) investigated the cross market linkages of Indiancommodity futures for nine commodities with futures markets outside India. Theyanalyzed the cross market linkages in terms of return and volatility spillovers forthe nine commodities, viz. two agricultural commodities: Soybean, and Corn, threemetals: Aluminum, Copper and Zinc, two precious metals: Gold and Silver, andtwo energy commodities: Crude oil and Natural gas. Return spillover is investigatedthrough Johansen’s cointegration test, error correction model, Granger causalitytest and variance decomposition techniques. They applied Bivariate GARCH model(BEKK) to investigate volatility spillover between India and other World markets.they found that futures prices of agricultural commodities traded at NationalCommodity Derivatives Exchange, India (NCDEX) and Chicago Board of Trade(CBOT), prices of precious metals traded at Multi Commodity Exchange, India(MCX) and NYMEX, prices of industrial metals traded at MCX and the LondonMetal Exchange (LME) and prices of energy commodities traded at MCX andNYMEX are cointegrated. In the case of commodities, they found that worldmarkets have bigger (unidirectional) impact on Indian markets. In bivariate model,they found bi-directional return spillover between MCX and LME markets.However, effect of LME on MCX is stronger than the effect of MCX on LME.
Berlia and Sehgal (2013) examined the process of information transmission infutures prices of bullion (gold and silver) and metals (aluminum, copper, and zinc)between India, represented by MCX, and its global counterparts trading platforms,such as COMEX, LME, and SHFE for the period of 2005 to 2012. The price discoveryresults confirmed that there is a long-term equilibrium relationship among thefutures prices of examined trading platforms in each commodity series, with theexception of aluminum. The MGARCH results of volatility spillovers indicatedthat, in the case of bullion, MCX seems to be more dominant than COMEX, implyingthat it is no longer a satellite market, while in case of metals; LME seems to playthe dominant role followed by MCX and SHFE.
Sinha and Mathur (2013) focused on the linkages in agri-processed (soy oiland crude palm oil) and energy commodities (natural gas and crude oil) traded oncommodity exchanges of India (NCDEX; MCX) and their correspondinginternational commodity exchanges (Chicago Board of Trade; Bursa MalaysiaDerivative Exchange; New York Mercantile Exchange). They examined the linkages
3844 � B. Brahmaiah and Srinivasan Palamalai
in futures price, return and volatility of a commodity across commodity exchangesusing Cointegration, Error Correction Model, Modified GARCH model and ARMA-GARCH in mean model. The study indicated that there are strong linkages inprice, return and volatility of futures contracts traded across commodity exchangesof India and their corresponding international commodity exchanges.
Pani and Jadhav (2015) analyzed the inter-linkage of international crude oilfutures markets with Indian markets as Indian crude oil futures price acts as aprice signal for the various market participants in the Crude oil industry. Theyexplored the international linkage (short run and long-run relationship) of Indiancrude oil market using various time series techniques such as Vector ErrorCorrection Model (VECM) and Granger Causality test. Commodity future pricedaily data from Multi-Commodity Exchange (MCX) and New York MercantileExchange (NYMEX) is used in the study to explore the linkage. The VECM resultssuggested both short run and long-run linkage of International Commodity futuresmarket with Indian commodity futures markets. However, Granger Causality testshowed unidirectional causality from International markets to Indian markets.
It can be seen from the existing literatures that studies on internationallinkages of commodity futures markets are meager. Considerable volume ofresearch has been conducted on the price discovery mechanism among the futuresand spot prices of emerging commodity markets. Besides, only a few notablestudies have made an attempt on cross market linkages of Indian futurescommodity market with international futures market. Though the IndianCommodity futures markets have grown in importance, they are yet to beintensively researched, especially on individual commodity futures contractspertaining to agricultural sector.
Our study attempts to investigate the international linkage between the Indianand world futures markets with reference to five agriculture commodities, viz.Cotton, Crude Palm Oil, Refined Soya Oil, Soya Bean and Sugar.
3. METHODOLOGY
Johansen’s (1988) cointegration approach and Vector Error Correction Model(VECM) have been employed to investigate the cross market linkages of Indiancommodity futures for ten commodities with futures markets outside India. Beforedoing cointegration analysis, it is necessary to test the stationary of the series. TheAugmented Dickey-Fuller (1979) test was employed to infer the stationary of theseries. If the series are non-stationary in levels and stationary in differences, thenthere is a chance of cointegration relationship between them which reveals thelong-run relationship between the series. Johansen’s cointegration test has beenemployed to investigate the long-run relationship between two variables. Besides,the causal relationship between Indian commodity futures and International futures
International Linkages of the Indian Agriculture Commodity Futures Markets � 3845
prices investigated by estimating the following Vector Error Correction Model(VECM) (Johansen, 1988):
where Xt is the 2x1 vector (It, Wt)’ of log-Indian Futures market price and log-International (World) Futures market price, respectively, � denotes the firstdifference operator, �t is a 2x1 vector of residuals (�I,t, �W,t)’ that follow an as-yet-unspecified conditional distribution with mean zero and time-varying covariancematrix, Ht. The VECM specification contains information on both the short- andlong-run adjustment to changes in Xt, via the estimated parameters �i and �,respectively.
There are two likelihood ratio tests that can be employed to identify the co-integration between the two series. The variables are cointegrated if and only if asingle cointegrating equation exists. The first statistic �trace tests the number ofcointegrating vectors is zero or one, and the other �max tests whether a singlecointegrating equation is sufficient or if two are required. In general, if rcointegrating vector is correct. The following test statistics can be constructed as:
�trace (r) = � �i
n
rinT �
����
��11
1(2)
�max (r, r+1) = � �irnT ��� ��
11 (3)
where i��
are the eigen values obtained from the estimate of the Ð matrix and T isthe number of usable observations. The �trace tests the null that there are at most rcointegrating vectors, against the alternative that the number of cointe-gratingvectors is greater than r and the �max tests the null that the number of cointegratingvectors is r, against the alternative of r + 1. Critical values for the �trace and �maxstatistics are provided by Osterwald-Lenum (1992).
Johansen and Juselius (1990) showed that the coefficient matrix Ð contains theessential information about the relationship between It and Wt. Specifically, ifrank(�) = 0, then � is 2x2 zero matrix implying that there is no cointegrationrelationship between It and Wt,t-n. In this case the VECM reduces to a VAR modelin first differences. If � has a full rank, that is rank(�) = 2, then all variables in Xtare I(0) and the appropriate modelling strategy is to estimate a VAR model inlevels. If � has a reduced rank, that is rank(�) = 1, then there is a single cointegratingrelationship between It and Wt, which is given by any row of matrix � and theexpression �Xt-1 is the error correction term. In this case, � can be factored intotwo separate matrices � and �, both of dimensions 2x1, where 1 represents the
3846 � B. Brahmaiah and Srinivasan Palamalai
rank of �, such as � = ��’, where �’ represents the vector of cointegratingparameters and á is the vector of error-correction coefficients measuring the speedof convergence to the long-run steady state.
If Indian futures and International futures prices are cointegrated then causalitymust exist in at least one direction (Granger, 1988). Granger causality can identifywhether two variables move one after the other or contemporaneously. When theymove contemporaneously, one provides no information for characterising the other.If “X causes Y”, then changes in X should precede changes in Y. Consider theVECM specification of Equation (1), which can be written as follows:
1 1
1 ,1 1
i
p p
t Ii t i I t i I t I ti i
I a I b W a z� �
� � �� �
� � � � � � � �� � (4)
�i,t |�t-1 ~ distr(0, Ht)
1 1
, 1 ,1 1
p p
t i t i w i t i w t w ti i
W aw I b W a z� �
� � �� �
� � � � � � � �� � (5)
where aI,i, bI,i, aW,i, bW,i are the short-run coefficients, zt-1 = �’Xt-1 is the error- correctionterm which measures how the dependent variable adjusts to the previous period’sdeviation from long-run equilibrium from equation (1), and �I,t and �W,t are residuals.
In the above equations of Vector Error Correction Model, the unidirectionalcausality from International Futures-to-Indian price (Wt Granger causes It) requires:(i) that some of the bI,i coefficients, i = 1, 2, …, p-1, are non zero and/or (ii) aI, theerror-correction coefficient in Equation (4), is significant at conventional levels.Similarly, unidirectional causality from Indian Futures-to-International Futuresprice (It Granger causes Wt) requires: (i) that some of the aW,i coefficients, i = 1, 2,…, p-1, are non zero and/or (ii) aW is significant at conventional levels. If bothvariables Granger cause each other, then it is said that there is a two-way feedbackrelationship between It and Wt (Granger, 1988). These hypotheses can be tested byapplying Wald tests on the joint significance of the lagged estimated coefficientsof ÄIt-i and ÄWt-i. When the residuals of the error-correction equations exhibitheteroskedasticity, the t-statistics are adjusted by White (1980) heteroskedasticitycorrection.
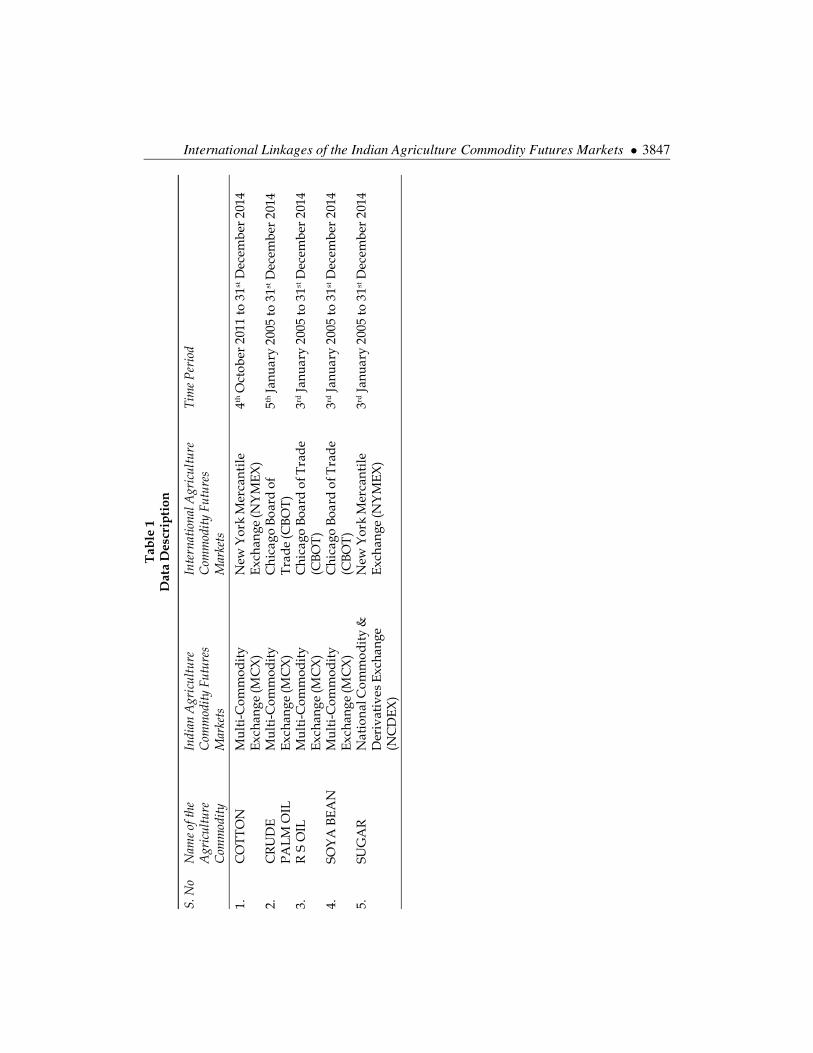
The sample data for the daily futures prices of Multi-Commodity Exchange(MCX), New York Mercantile Exchange (NYMEX), Chicago Board of Trade (CBOT)and National Commodity & Derivatives Exchange (NCDEX) for five agriculturecommodities, viz. Cotton, Crude Palm Oil, Refined Soya Oil, Soya Bean and Sugar.These are the leading exchanges for the respective commodity futures contracts interms of volume traded. All the necessary information is retrieved from theBloomberg database. Based on the availability of the data, the sample period of
International Linkages of the Indian Agriculture Commodity Futures Markets � 3847T
able
1D
ata
Des
crip
tion
S. N
oN
ame o
f the
Indi
an A
gric
ultu
reIn
tern
atio
nal A
gric
ultu
reTi
me P
erio
dA
gric
ultu
reC
omm
odity
Fut
ures
Com
mod
ity F
utur
esC
omm
odity
Mar
kets
Mar
kets
1.C
OTT
ON
Mul
ti-C
omm
odit
yN
ew Y
ork
Mer
cant
ile4th
Oct
ober
201
1 to
31st
Dec
embe
r 20
14Ex
chan
ge (M
CX
)Ex
chan
ge (N
YM
EX)
2.C
RU
DE
Mul
ti-C
omm
odit
yC
hica
go B
oard
of
5th Ja
nuar
y 20
05 to
31st
Dec
embe
r 20
14PA
LM O
ILEx
chan
ge (M
CX
)T
rade
(CB
OT
)3.
R S
OIL
Mul
ti-C
omm
odit
yC
hica
go B
oard
of T
rad
e3rd
Janu
ary
2005
to 3
1st D
ecem
ber
2014
Exch
ange
(MC
X)
(CBO
T)
4.SO
YA
BEA
NM
ulti
-Com
mod
ity
Chi
cago
Boa
rd o
f Tra
de
3rd Ja
nuar
y 20
05 to
31st
Dec
embe
r 20
14Ex
chan
ge (M
CX
)(C
BOT
)5.
SUG
AR
Nat
iona
l Com
mod
ity
&N
ew Y
ork
Mer
cant
ile3rd
Janu
ary
2005
to 3
1st D
ecem
ber
2014
Der
ivat
ives
Exc
hang
eEx
chan
ge (N
YM
EX)
(NC
DEX
)
3848 � B. Brahmaiah and Srinivasan PalamalaiT
able
2D
escr
ipti
ve S
tati
stic
s of
Agr
icu
ltur
e Fu
ture
s C
omm
odit
y M
ark
ets
Stat
istic
sC
OTT
ON
CR
UD
E P
ALM
OIL
R S
OIL
SOY
A B
EAN
SUG
AR
MC
XN
YM
EXM
CX
CBO
TN
CD
EX
CBO
TN
CD
EX
CBO
TN
CD
EX
CBO
TR
etur
ns R
etur
nsR
etur
nsR
etur
nsR
etur
nsR
etur
nsR
etur
nsR
etur
ns R
etur
nsR
etur
ns
Mea
n-0
.000
22-0
.000
73 0
.000
13 0
.000
31 0
.000
21 0
.000
22 0
.000
57 0
.000
58 0
.000
12 0
.000
23M
axim
um 0
.096
60 0
.174
46 1
.104
71 0
.926
06 0
.057
58 0
.080
38 0
.244
84 0
.077
71 0
.092
94 0
.403
53M
inim
um-0
.075
71-0
.133
92-0
.614
30-0
.110
39-0
.275
19-0
.744
67-0
.240
33-0
.207
63-0
.144
15-0
.113
27St
d. D
ev.
0.0
1431
0.0
1815
0.0
3400
0.0
2864
0.0
1253
0.0
2156
0.0
1896
0.0
1910
0.0
1433
0.0
2294
Obs
erva
tion
s 7
02 7
0216
7416
74 2
246
224
6 1
674
167
422
0122
01
International Linkages of the Indian Agriculture Commodity Futures Markets � 3849
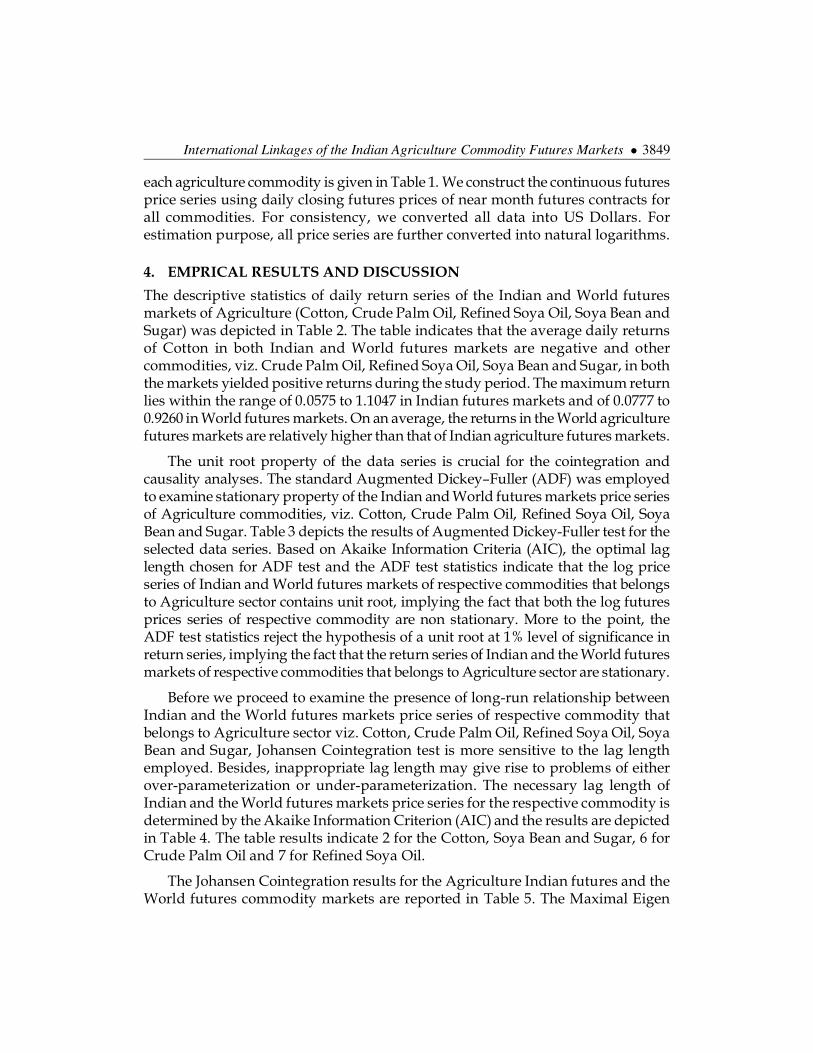
each agriculture commodity is given in Table 1. We construct the continuous futuresprice series using daily closing futures prices of near month futures contracts forall commodities. For consistency, we converted all data into US Dollars. Forestimation purpose, all price series are further converted into natural logarithms.
4. EMPRICAL RESULTS AND DISCUSSION
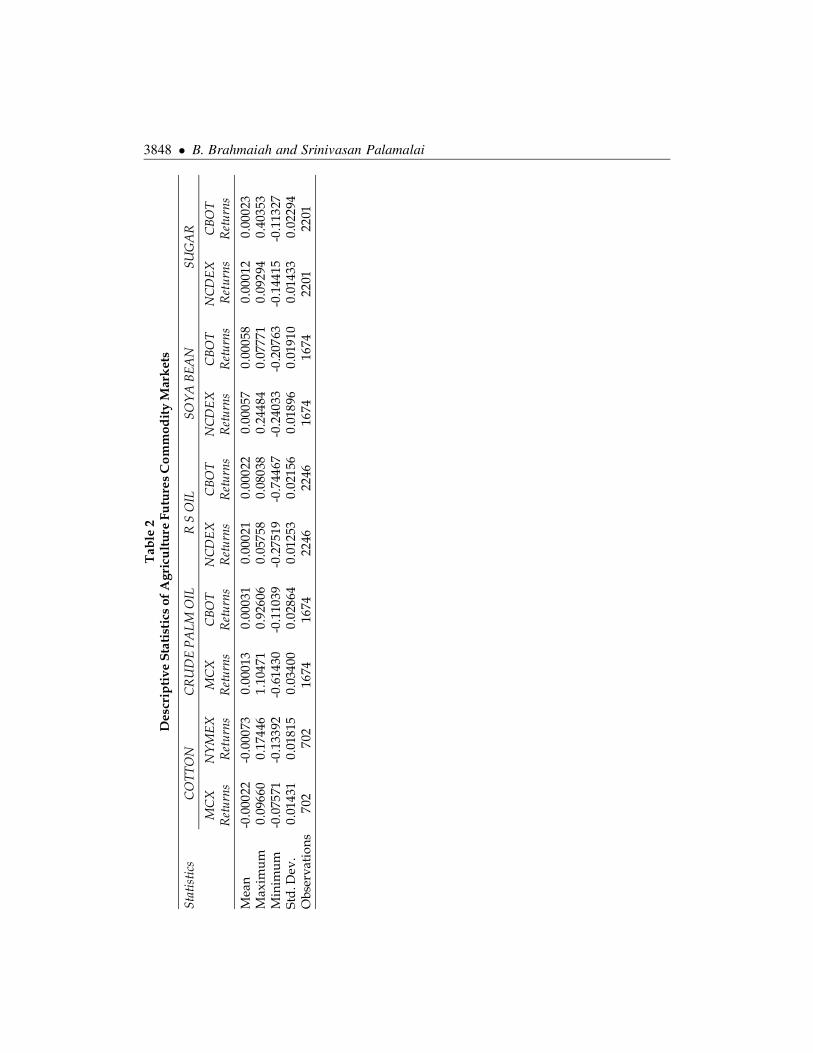
The descriptive statistics of daily return series of the Indian and World futuresmarkets of Agriculture (Cotton, Crude Palm Oil, Refined Soya Oil, Soya Bean andSugar) was depicted in Table 2. The table indicates that the average daily returnsof Cotton in both Indian and World futures markets are negative and othercommodities, viz. Crude Palm Oil, Refined Soya Oil, Soya Bean and Sugar, in boththe markets yielded positive returns during the study period. The maximum returnlies within the range of 0.0575 to 1.1047 in Indian futures markets and of 0.0777 to0.9260 in World futures markets. On an average, the returns in the World agriculturefutures markets are relatively higher than that of Indian agriculture futures markets.
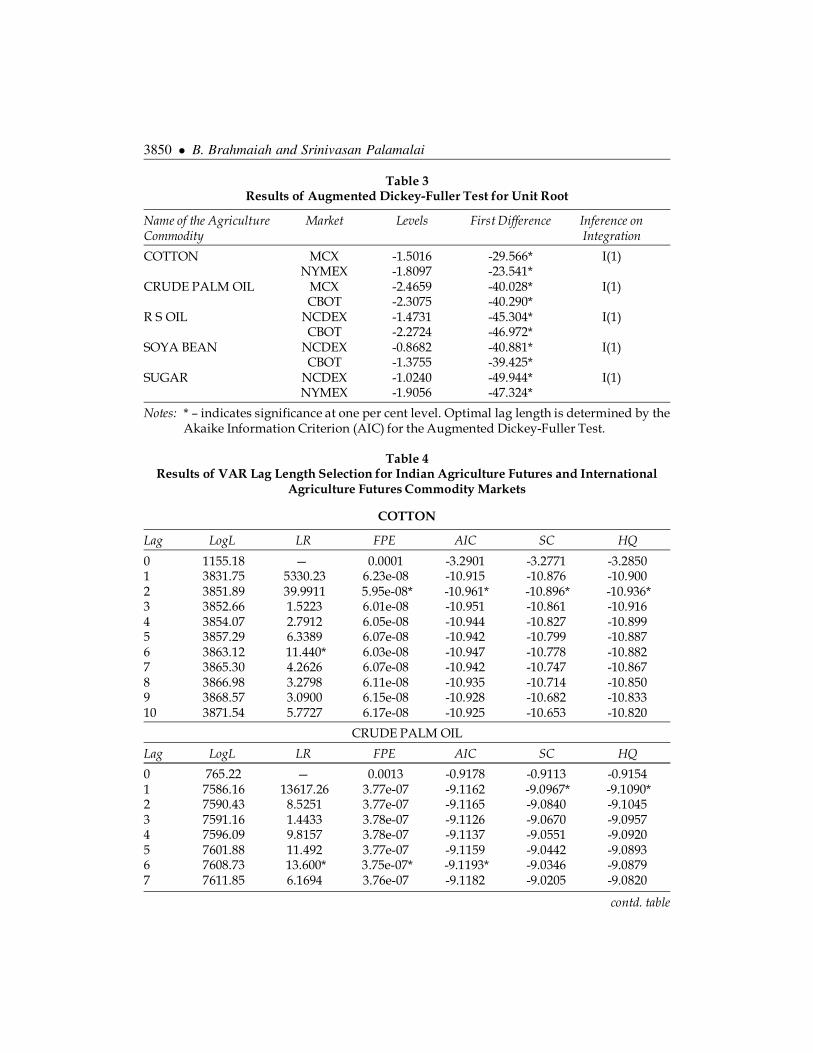
The unit root property of the data series is crucial for the cointegration andcausality analyses. The standard Augmented Dickey–Fuller (ADF) was employedto examine stationary property of the Indian and World futures markets price seriesof Agriculture commodities, viz. Cotton, Crude Palm Oil, Refined Soya Oil, SoyaBean and Sugar. Table 3 depicts the results of Augmented Dickey-Fuller test for theselected data series. Based on Akaike Information Criteria (AIC), the optimal laglength chosen for ADF test and the ADF test statistics indicate that the log priceseries of Indian and World futures markets of respective commodities that belongsto Agriculture sector contains unit root, implying the fact that both the log futuresprices series of respective commodity are non stationary. More to the point, theADF test statistics reject the hypothesis of a unit root at 1% level of significance inreturn series, implying the fact that the return series of Indian and the World futuresmarkets of respective commodities that belongs to Agriculture sector are stationary.
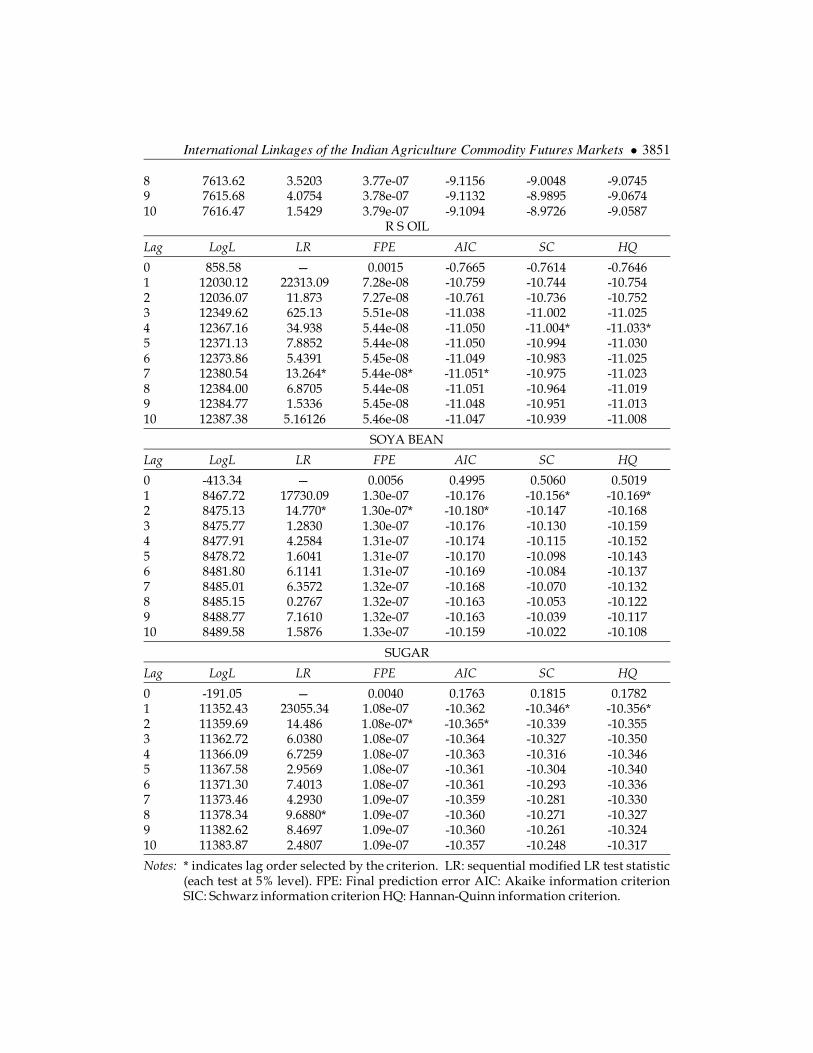
Before we proceed to examine the presence of long-run relationship betweenIndian and the World futures markets price series of respective commodity thatbelongs to Agriculture sector viz. Cotton, Crude Palm Oil, Refined Soya Oil, SoyaBean and Sugar, Johansen Cointegration test is more sensitive to the lag lengthemployed. Besides, inappropriate lag length may give rise to problems of eitherover-parameterization or under-parameterization. The necessary lag length ofIndian and the World futures markets price series for the respective commodity isdetermined by the Akaike Information Criterion (AIC) and the results are depictedin Table 4. The table results indicate 2 for the Cotton, Soya Bean and Sugar, 6 forCrude Palm Oil and 7 for Refined Soya Oil.
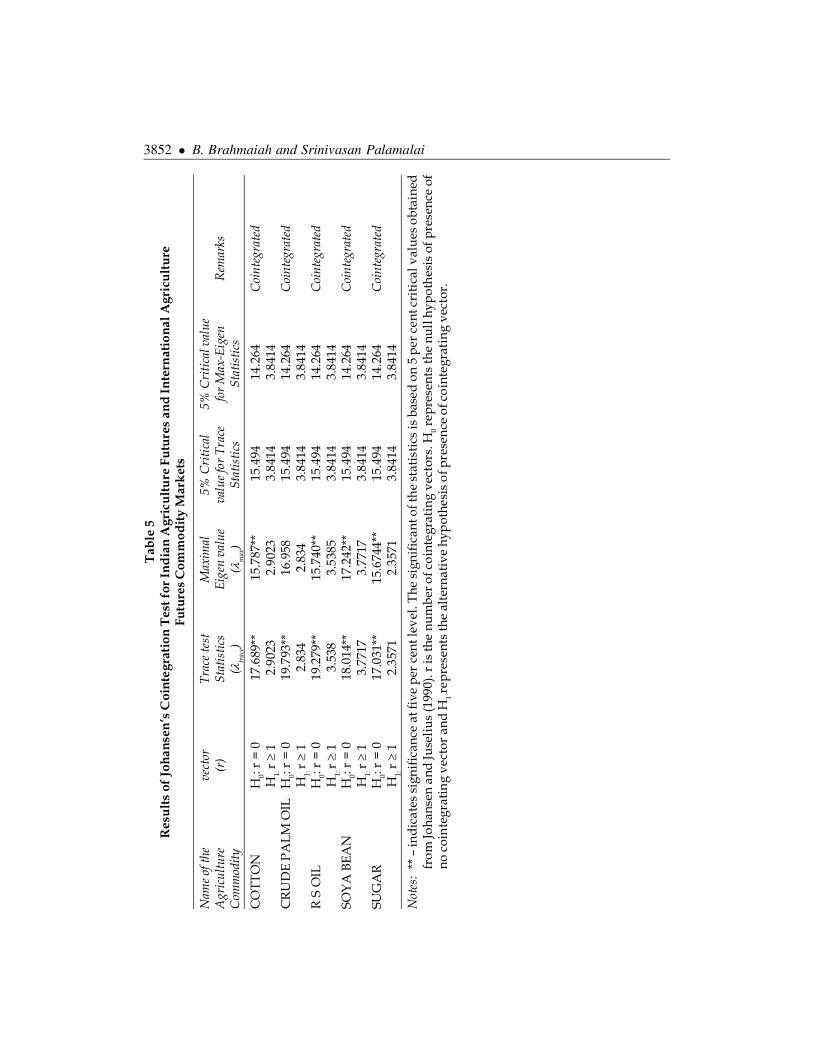
The Johansen Cointegration results for the Agriculture Indian futures and theWorld futures commodity markets are reported in Table 5. The Maximal Eigen
3850 � B. Brahmaiah and Srinivasan Palamalai
Table 3Results of Augmented Dickey-Fuller Test for Unit Root
Name of the Agriculture Market Levels First Difference Inference onCommodity Integration
Notes: * – indicates significance at one per cent level. Optimal lag length is determined by theAkaike Information Criterion (AIC) for the Augmented Dickey-Fuller Test.
Table 4Results of VAR Lag Length Selection for Indian Agriculture Futures and International
Notes: * indicates lag order selected by the criterion. LR: sequential modified LR test statistic(each test at 5% level). FPE: Final prediction error AIC: Akaike information criterionSIC: Schwarz information criterion HQ: Hannan-Quinn information criterion.
3852 � B. Brahmaiah and Srinivasan PalamalaiT
able
5R
esul
ts o
f Jo
hans
en’s
Coi
nteg
rati
on T
est f
or In
dia
n A
gric
ultu
re F
utu
res
and
Inte
rnat
iona
l Agr
icul
ture
Futu
res
Com
mod
ity
Mar
ket
s
Nam
e of t
heve
ctor
Trac
e te
stM
axim
al5%
Cri
tica
l5%
Cri
tica
l val
ueA
gric
ultu
re(r
)St
atis
tics
Eige
n va
lue
valu
e for
Tra
cefo
r M
ax-E
igen
Rem
arks
Com
mod
ity(�
trac
e)(�
max
)St
atis
tics
Stat
istic
s
CO
TTO
NH
0: r
= 0
17.
689*
* 1
5.78
7**
15.
494
14.
264
Coi
nteg
rate
dH
1: r �
1 2
.902
3 2
.902
3 3
.841
4 3
.841
4C
RU
DE
PA
LM O
ILH
0: r
= 0
19.
793*
* 1
6.95
8 1
5.49
4 1
4.26
4C
oint
egra
ted
H1:
r �
1 2
.834
2.8
34 3
.841
4 3
.841
4R
S O
ILH
0: r
= 0
19.
279*
* 1
5.74
0**
15.
494
14.
264
Coi
nteg
rate
dH
1: r �
1 3
.538
3.5
385
3.8
414
3.8
414
SOY
A B
EAN
H0:
r =
0 1
8.01
4**
17.
242*
* 1
5.49
4 1
4.26
4C
oint
egra
ted
H1:
r �
1 3
.771
7 3
.771
7 3
.841
4 3
.841
4SU
GA
RH
0: r
= 0
17.
031*
* 1
5.67
44**
15.
494
14.
264
Coi
nteg
rate
dH
1: r �
1 2
.357
1 2
.357
1 3
.841
4 3
.841
4
Not
es:
** –
indi
cate
s si
gnif
ican
ce a
t fiv
e pe
r ce
nt le
vel.
The
sig
nifi
cant
of t
he s
tati
stic
s is
bas
ed o
n 5
per
cen
t cri
tica
l val
ues
obt
aine
dfr
om Jo
hans
en a
nd Ju
seli
us (1
990)
. r is
the
num
ber o
f coi
nteg
rati
ng v
ecto
rs. H
0 rep
rese
nts
the
null
hyp
othe
sis
of p
rese
nce
ofno
coi
nte
grat
ing
vect
or a
nd H
1 rep
rese
nts
the
alte
rnat
ive
hyp
othe
sis
of p
rese
nce
of c
oint
egra
ting
vec
tor.
International Linkages of the Indian Agriculture Commodity Futures Markets � 3853
value and Trace test statistics indicates that the null hypothesis is rejected in thecase of each commodity that belongs to Agriculture sector (Cotton, Crude PalmOil, Refined Soya Oil, Cotton and Sugar) which reveals that one cointegrationrelationship exists between the Indian futures and the World futures prices. Thus,the Indian futures and World futures prices of respective commodity of Agriculturemarket shares common long-run information. The cointegration result confirmsthat there is a long-run relationship between the Indian futures and World futuresprices of each commodity that belongs to Agricultural sector.
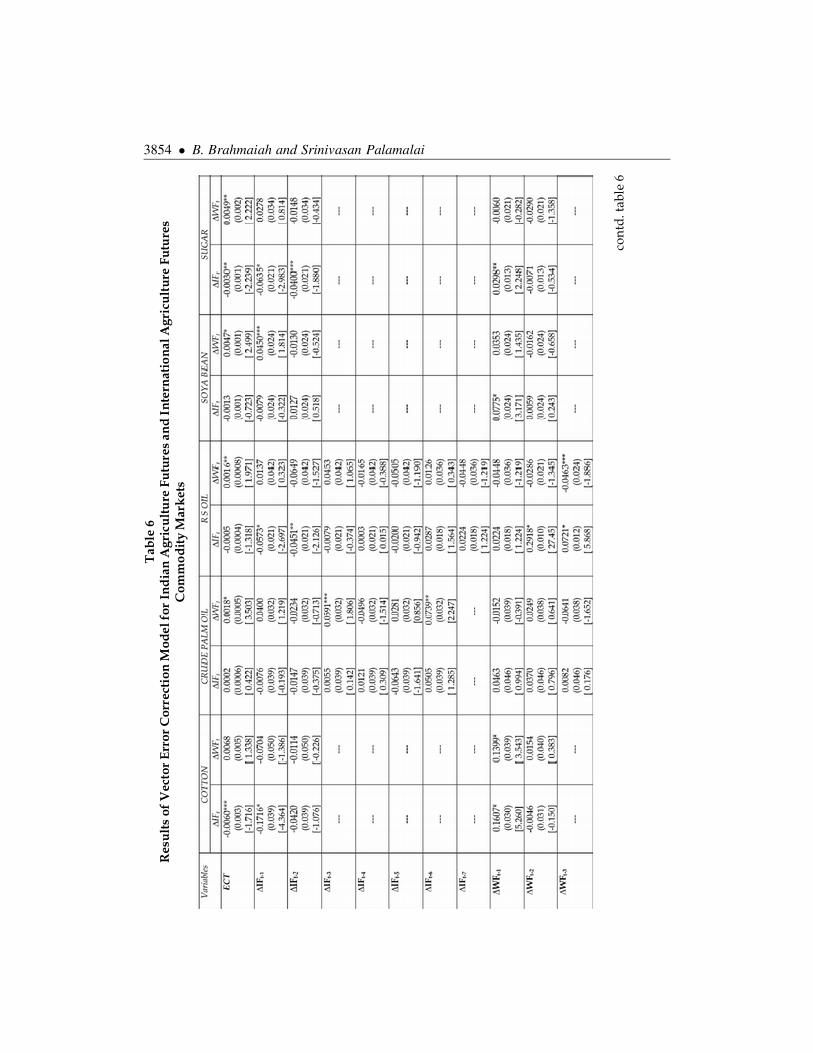
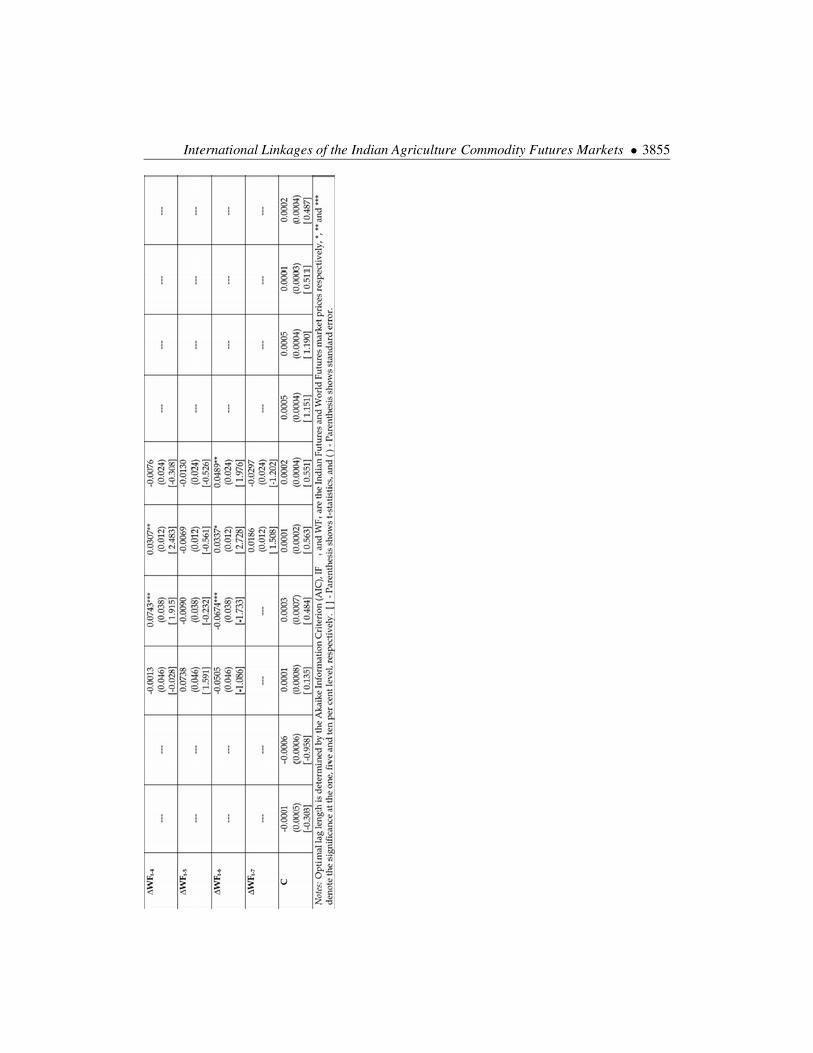
Once existence of single cointegration among the Indian futures and the Worldfutures commodity prices of respective commodity that belongs to Agriculturesector (Cotton, Crude Palm Oil, Refined Soya Oil, Soya Bean and Sugar) areconfirmed, one should search for proper Vector Error Correction Model (VECM).By using the definition of Cointegration, the Granger Representation Theorem(Granger, 1983) which states that if a set of variables are cointegrated, then thereexists valid error correction representation of the data. For this purpose the VECMare estimated for the respective commodity that belongs to Agriculture and it ispresented in Table 6. The dynamic VECM representation provides us with aframework to test for the causal dynamics in the Granger sense among the priceseries through both short-run and error-correction channels (ECTs) of causation.Short-run market causality test will determine whether Indian futures price ofrespective commodity markets respond instantaneously to changes in itscorresponding World futures prices. The coefficient of the lagged error correctionterm (ECT) shows the portion by which the long-run disequilibrium in thedependant variable is being corrected in each short period to have stable long-runrelationship. If both short-run causality coefficient and ECTs are insignificant, themarket can be treated as exogenous to the system (Masih and Masih 1997). Theapplication of Akaike Information Criterion (AIC) is used to find the optimal lagfor the vector error correction model.
The VECM estimates for the Agriculture Indian futures and the World futurescommodity markets are presented in Table 6. The coefficients of the Error Correctionterms (ECTs) in the Indian futures equations of Cotton, Crude Palm Oil, Sugarand Soya Bean are statistically significant, while the coefficients of the ECTs in thefutures equations of these commodities are not statistically significant, suggestinga unidirectional causation runs from World futures market prices to Indian futuresmarket prices in the long-run. For the Refined Soya Oil, the coefficients of ECT inthe Indian futures equation and World futures equation are statistically significant,suggesting a bidirectional relationship the Indian futures and World futures marketprices in the long-run. However, the size of the coefficient of ECT in Indian futuresequation for Refined Soya Oil is relatively greater than the ECT of World futuresequation, implying that the World futures market leads the Indian futures marketsfor Refined Soya Oil in the long-run.
3854 � B. Brahmaiah and Srinivasan PalamalaiT
able
6R
esul
ts o
f V
ecto
r E
rror
Cor
rect
ion
Mod
el fo
r In
dia
n A
gric
ultu
re F
utu
res
and
Inte
rnat
iona
l Agr
icul
ture
Fut
ure
sC
omm
odit
y M
arke
ts
cont
d. ta
ble
6
International Linkages of the Indian Agriculture Commodity Futures Markets � 3855
3856 � B. Brahmaiah and Srinivasan Palamalai
More to the point, the empirical findings reveal that the lagged coefficients ofchanges in World futures prices of Cotton, Crude Palm Oil, Refined Soya Oil, SoyaBean and Sugar in their respective Indian futures prices equation are found to bestatistically significant, implying that World futures markets of these commoditiesplays a dominant role and serve effective price discovery vehicle. The study evidencefor both long-run and short-run suggests that the World futures market prices leadsto the Indian futures market prices for the case of Agriculture commodities such asCotton, Crude Palm Oil, Refined Soya Oil, Soya Bean and Sugar.
5. CONCLUSION
In its history of commodity derivatives, commodity futures market has witnessedseveral developments since 2003. There has been tremendous growth in commodityfutures market in terms of volume of trade, number of products on offer participantsand technology. Commodity futures are diversified asset class they do not boostresources for firms to invest, rather they allow producers to gain insurance for thefuture value of their outputs. Commodity futures perform two fundamentalfunctions of the economy i.e. price discovery and risk management. Futures marketsprovide liquidity and facilitates to hedge against future price risk. It helps buyersand sellers of agricultural products to quickly manage their trade at a fair price.Commodity trading also offers a chance for financial leverage to hedgers,speculators and other traders. The present paper attempts to examine theinternational linkage between the Indian and world futures markets with referenceto five agriculture commodities, viz. Cotton, Crude Palm Oil, Refined Soya Oil,Soya Bean and Sugar, using Johansen Cointegration test and Vector Error CorrectionModel. The cointegration result confirms that there is a long-run relationshipbetween the Indian futures and World futures prices of each commodity thatbelongs to Agricultural sector. Besides, the empirical evidence suggests that theWorld futures market prices leads to the Indian futures market prices for the caseof Agriculture commodities such as Cotton, Crude Palm Oil, Refined Soya Oil,Soya Bean and Sugar, both in the long-run and short-run. It can be therefore, thepresent study concludes that the World agriculture futures markets plays adominant role and serve as effective price discovery vehicle. To the market makersand speculators in Indian agriculture futures markets, news from the Worldagriculture futures markets should be taken seriously, as the world agriculturefutures prices increasingly become an important factor in influencing the pricemovement of Indian agriculture futures market prices of Cotton, Crude Palm Oil,Refined Soya Oil, Soya Bean and Sugar.
ReferencesBerlia, N. and Sehgal, S. (2013), ‘Information Transmission between India and International
Commodities Futures Market: An Empirical Study for Bullion and Metals’, Research inApplied Economics, 5, pp.149-175.
International Linkages of the Indian Agriculture Commodity Futures Markets � 3857
Dickey, D. A. and Fuller, W. A., (1979), ‘Distribution of the Estimations for AutoregressiveTime Series with a Unit Root’, Journal of the American Statistical Association, 47, pp. 427-431.
Granger, C. W. J., (1988), ‘Some Recent Developments in a Concept of Causality,’ Journal ofEconometrics, 16, 1, pp. 121-130.
Hua, R. and Chen, B. (2007), ‘International Linkages of the Chinese Futures Markets’, AppliedFinancial Economics, 17, pp. 1275-1287.
Johansen, S. and Juselius, K. (1990), ‘Maximum likelihood estimation and inference oncointegration - with applications to the demand for money’, Oxford Bulletin of Economicsand Statistics, 52, pp. 169-210.
Johansen, S., (1988), ‘Statistical Analysis and Cointegrating Vectors’, Journal of Economic Dynamicsand Control, 12, pp. 231"254.
Kumar, B., and Pandey, A. (2011), ‘International linkages of the Indian commodity futuresmarkets’, Modern Economy, 2, pp. 213–227.
Masih, A.M.M. and Masih, R. (1997), ‘A comparative analysis of the propagation of stock marketfluctuations in alternative models of dynamic causal linkages’, Applied Financial Economics,7, pp.59-74.
Osterwald-Lenum, M., (1992), ‘A Note with the Quantiles of the Asymptotic Distribution ofthe Maximum Likelihood Cointegration Rank Test Statistics,’ Oxford Bulletin of Economicsand Statistics, 54, pp. 461-472.
Pani, U. and Jadhav, P. (2015), ‘International Linkage of Crude Oil futures Markets of India:Empirical evidences from Indian Crude Oil futures Markets’, International Journal ofMultidisciplinary Research and Development, 2, pp.297-303.
Sinha, P., and Mathur, K. (2013), ‘International Linkages of Agri-Processed and Energycommodities traded in India. MPRA Working Paper No. 50214.
White, H., (1980), ‘A Heteroskedasticity-Consistent Covariance Matrix Estimator and a DirectTest for Heteroskedasticity’, Econometrica, 48, pp. 817–838.