International International Migration and Migration and Development: The Development: The Case of China Case of China Zai Liang and Hideki Morooka Zai Liang and Hideki Morooka State University of New York at Albany State University of New York at Albany This project is supported by grants from NSF, This project is supported by grants from NSF, NICHD, and the NICHD, and the Ford Foundation Ford Foundation.
Transcript
International Migration International Migration and Development: The and Development: The
Case of ChinaCase of China
Zai Liang and Hideki MorookaZai Liang and Hideki Morooka
State University of New York at AlbanyState University of New York at Albany
This project is supported by grants from NSF, This project is supported by grants from NSF, NICHD, and the Ford FoundationNICHD, and the Ford Foundation..
How International Migration How International Migration Affects Development?Affects Development?
• Earlier studies, summarized by Taylor et al. (1996) “emigration Earlier studies, summarized by Taylor et al. (1996) “emigration undermines the prospects of economic growth.” Productive vs. non-undermines the prospects of economic growth.” Productive vs. non-productive use of remittances. productive use of remittances.
• Taylor (1999), from the perspective of new economics of migration, Taylor (1999), from the perspective of new economics of migration, argues thatargues that
– Migration decisions are part of family strategies to obtain funds Migration decisions are part of family strategies to obtain funds and to insure against income and production risk. and Massey and to insure against income and production risk. and Massey and his associates.and his associates.
– Remittances, set in motion a development dynamic by loosening Remittances, set in motion a development dynamic by loosening production and investment constraints.production and investment constraints.
• Using data from MMP, Massey and his associates suggest that we Using data from MMP, Massey and his associates suggest that we pay more attention to conditions under which remittances can be pay more attention to conditions under which remittances can be used in productive way.used in productive way.
International Migration and International Migration and Development (Continued)Development (Continued)
• One of the most important insights from this One of the most important insights from this line of reasoning is that remittances have line of reasoning is that remittances have indirect effect on the local economy.indirect effect on the local economy.
• Consumption by migrant households Consumption by migrant households generates demand for different goods generates demand for different goods (garment, appliances, eateries and (garment, appliances, eateries and entertainment…).entertainment…).
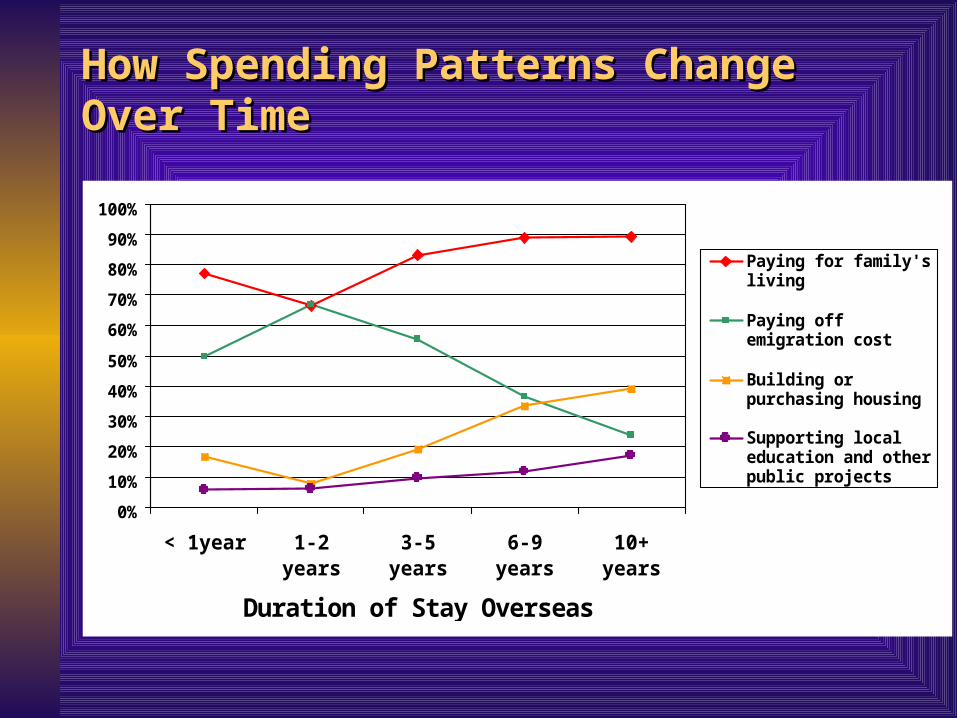
• Spending on housing generates demand for Spending on housing generates demand for house-building materials. (especially house-building materials. (especially important in the Chinese context).important in the Chinese context).
Objectives of the Current ResearchObjectives of the Current Research
• Join this debate by using newly collected data from Join this debate by using newly collected data from China’s Fujian province. China’s Fujian province.
• Focus on remittances. Focus on remittances.
• Size of remittances is big ($88 billion in 2002, Size of remittances is big ($88 billion in 2002, International Org. of Migration). International Org. of Migration).
• In one of the migrant-sending regions, Changle, In one of the migrant-sending regions, Changle, $460 million in 2003.$460 million in 2003.
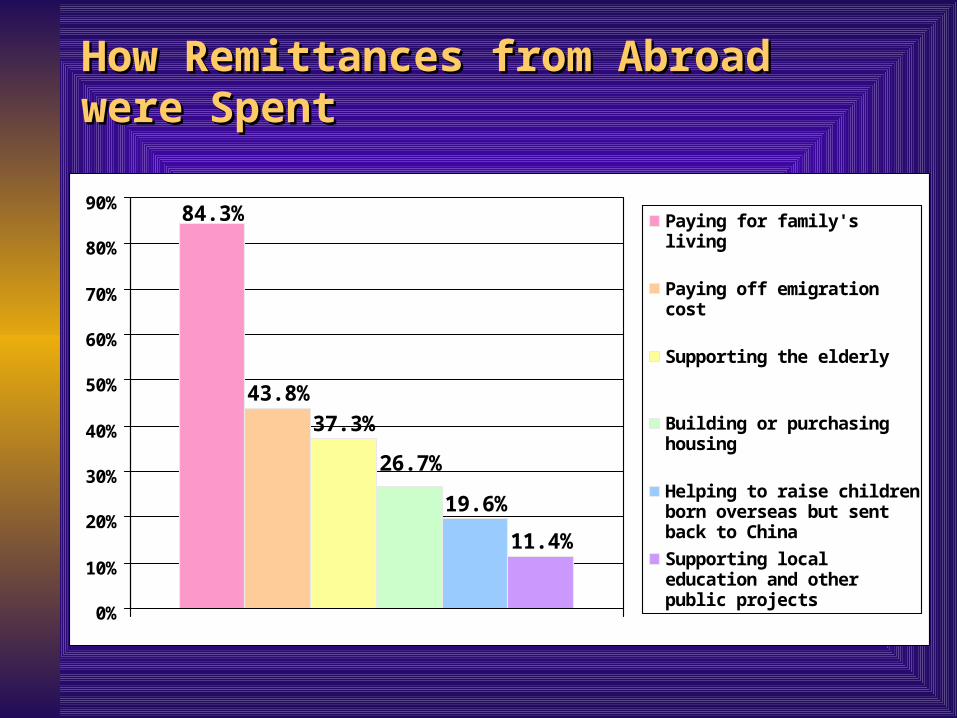
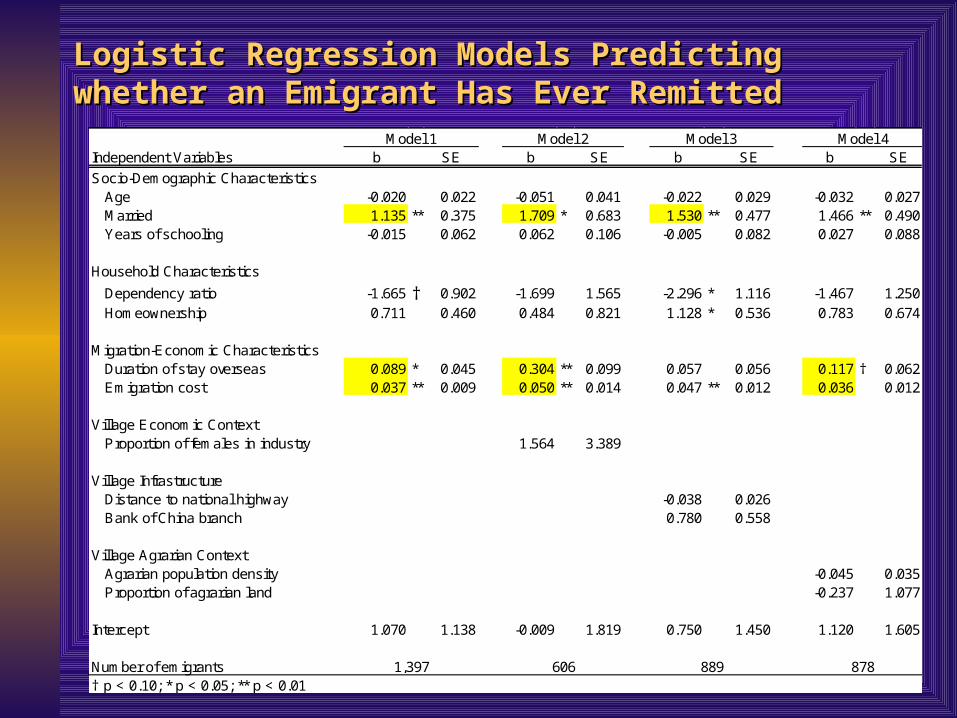
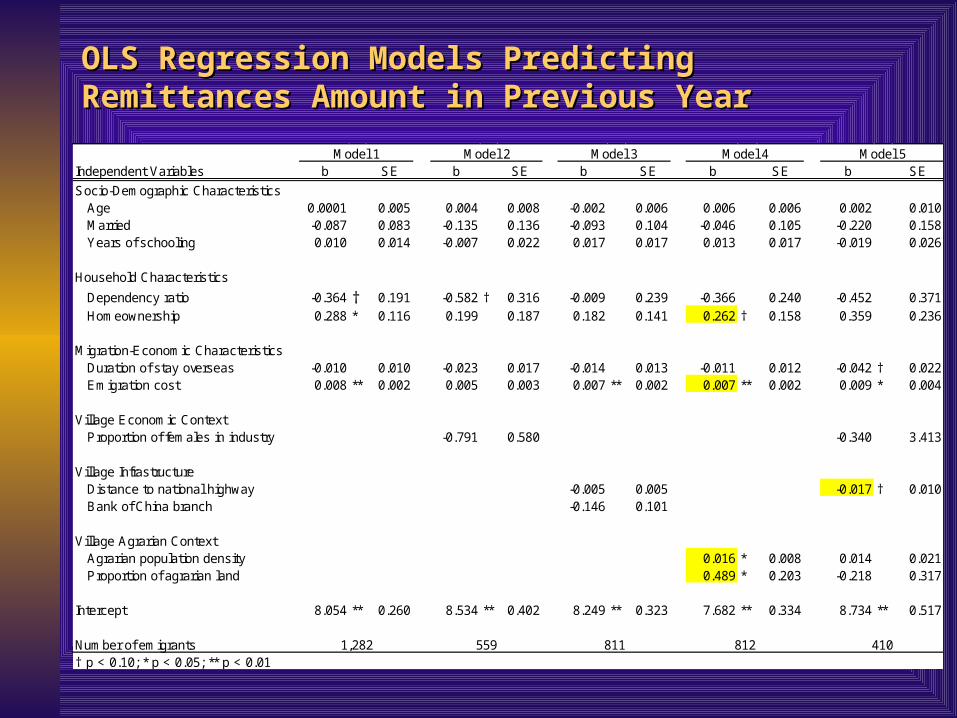
• Examine determinants of amount of remittances, Examine determinants of amount of remittances, and determinants of how remittances were used. and determinants of how remittances were used.
Research DesignResearch Design
• This project is modeled on the success of Mexican This project is modeled on the success of Mexican Migration Project, directed by Douglas S. Massey Migration Project, directed by Douglas S. Massey and Jorge Durand.and Jorge Durand.
• In Fujian province, we selected eight towns that are In Fujian province, we selected eight towns that are known to send emigrants to the U.S. For each town, known to send emigrants to the U.S. For each town, we sampled roughly 200 households using multi-we sampled roughly 200 households using multi-stage sampling technique. stage sampling technique.
• In New York metro area, we interviewed 30-40 In New York metro area, we interviewed 30-40 immigrants who came from each of the eight towns. immigrants who came from each of the eight towns. The total U.S. sample size is 410.The total U.S. sample size is 410.
Household and Community Household and Community QuestionnairesQuestionnaires
• Household questionnaire: (1) Basic socio-demographic Household questionnaire: (1) Basic socio-demographic information for each person in the household (including information for each person in the household (including individuals who emigrated). (2) Detailed information on individuals who emigrated). (2) Detailed information on internal and international migration is collected for individual internal and international migration is collected for individual who has had migration experience. In particular we have who has had migration experience. In particular we have detailed information on the first and last international detailed information on the first and last international migration experience. (3) Life history data are collected for migration experience. (3) Life history data are collected for both household heads and spouses covering information such both household heads and spouses covering information such as employment history, marriage history, and migration as employment history, marriage history, and migration history. (4) Household property ownership for each history. (4) Household property ownership for each household. Information such as ownership of land, house and household. Information such as ownership of land, house and other properties.other properties.
• Community questionnaire: immigration history, Community questionnaire: immigration history, infrastructure, remittances, and buildings/schools/senior infrastructure, remittances, and buildings/schools/senior center financed by remittances. center financed by remittances.
Why Study Fujian Province?Why Study Fujian Province?
• The rise of emigration from Fujian. The rise of emigration from Fujian. Destination countries: U.S., Europe , Destination countries: U.S., Europe , and Japan.and Japan.
• Comparative study of China and Comparative study of China and Mexico. Mexico.
The Main Innovations of the StudyThe Main Innovations of the Study
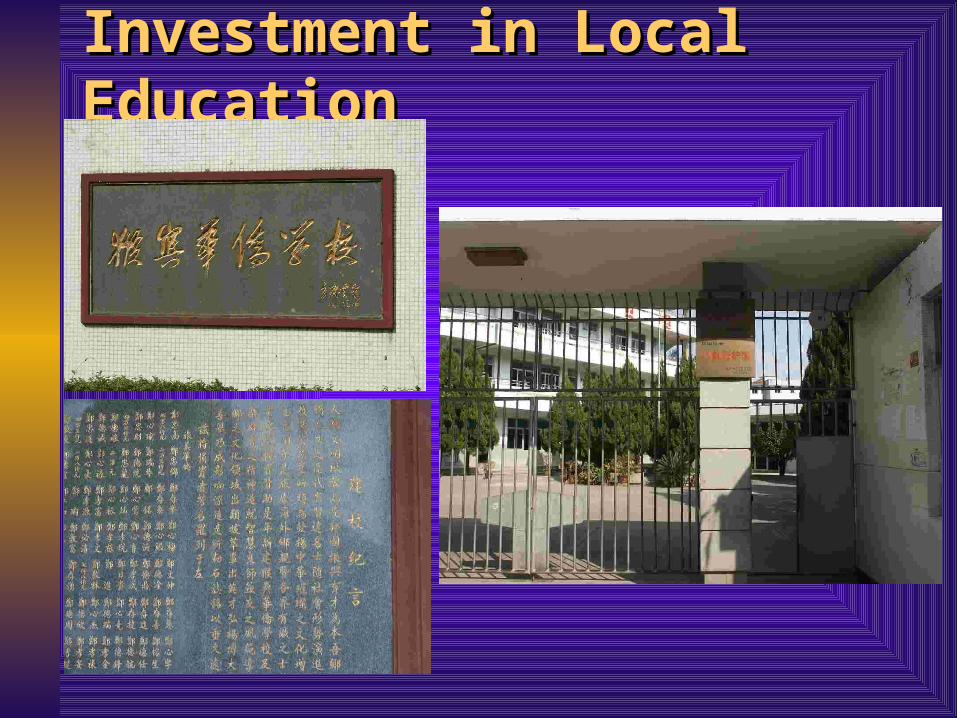
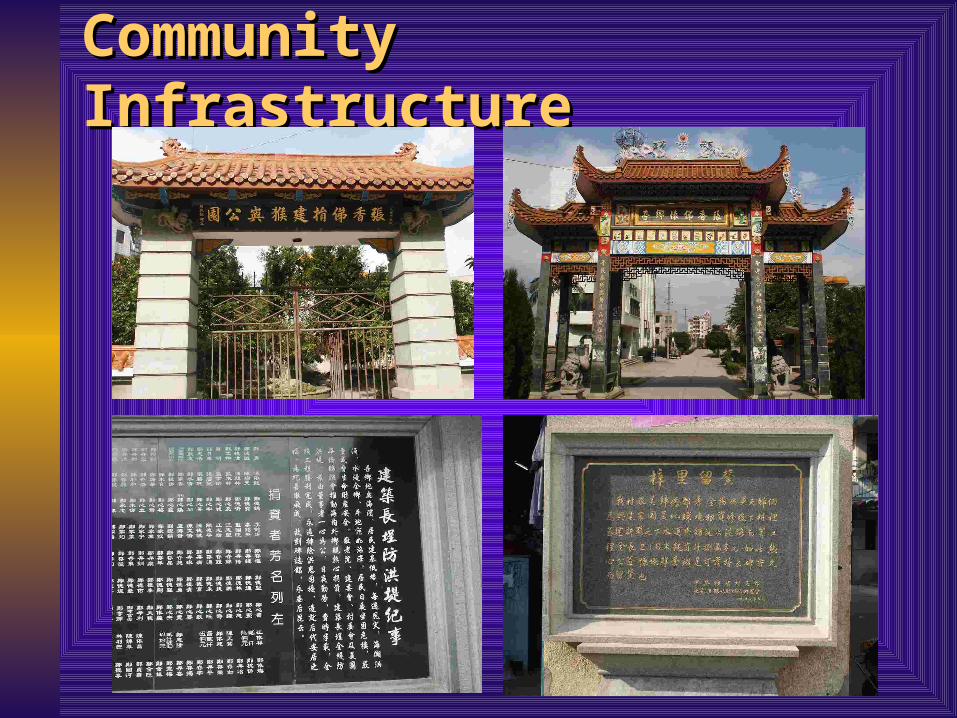
• Broaden the concept of “productive Broaden the concept of “productive investment” to include public projects such as investment” to include public projects such as supporting local educational initiatives (schools supporting local educational initiatives (schools and scholarships), infrastructure/building and scholarships), infrastructure/building roads, dam, senior citizen center, roads, dam, senior citizen center, culture/performance theater. culture/performance theater.
• Detailed information on remittances last year Detailed information on remittances last year and cumulative remittances over the course of and cumulative remittances over the course of migration.migration.
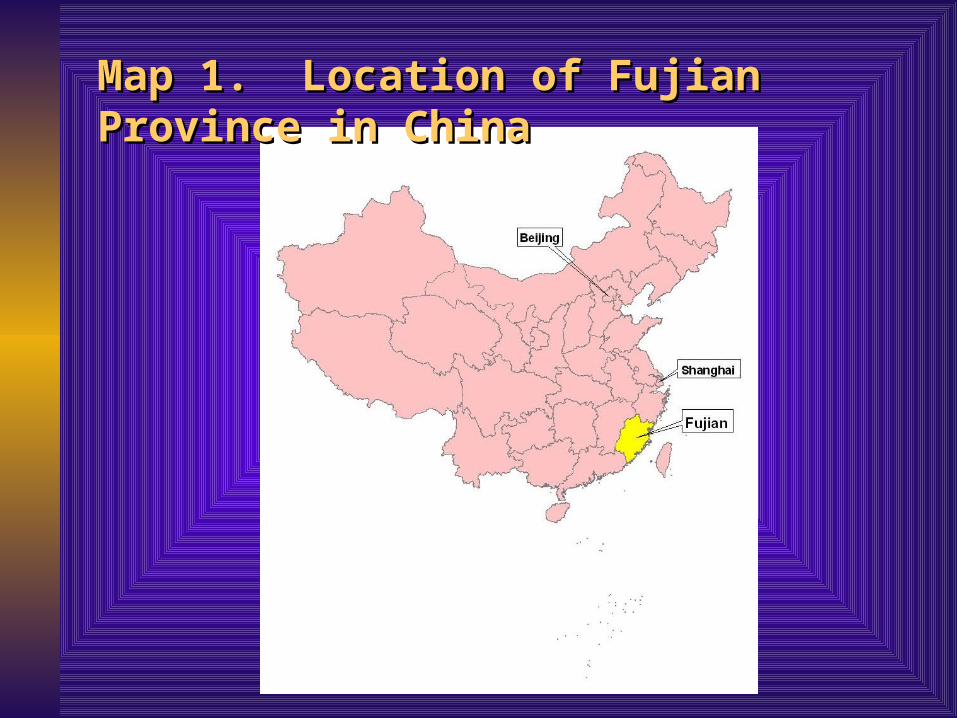
Map 1. Location of Fujian Province in ChinaMap 1. Location of Fujian Province in China
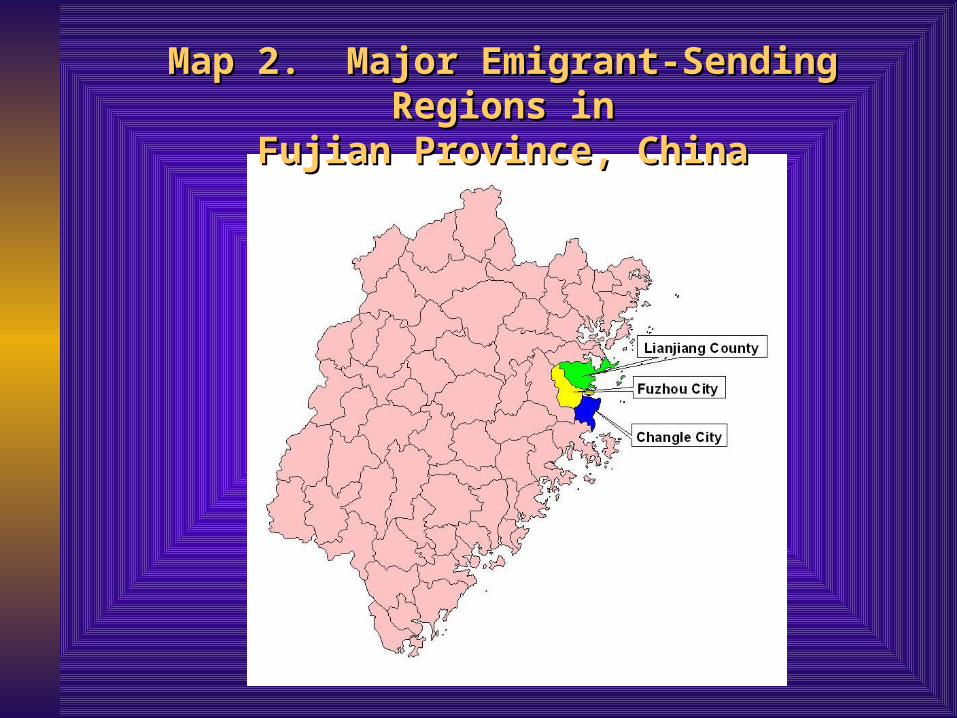
Map 2. Major Emigrant-Sending Regions inMap 2. Major Emigrant-Sending Regions inFujian Province, ChinaFujian Province, China
Investment in Local EducationInvestment in Local Education
Community InfrastructureCommunity Infrastructure
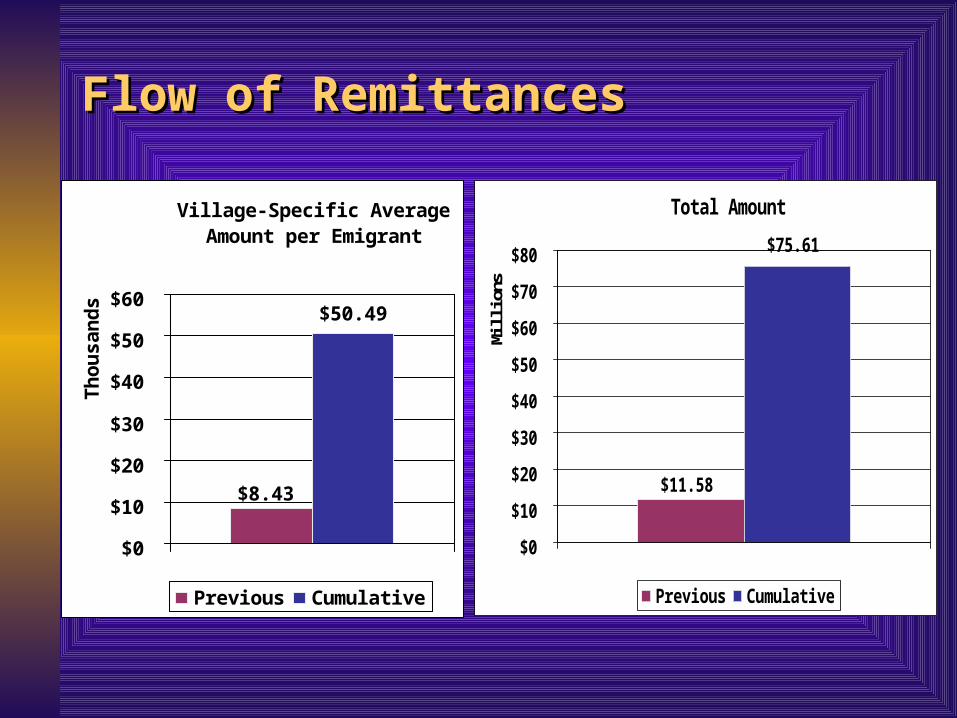
Flow of RemittancesFlow of Remittances
Vi l l age-Speci fi c Average Amount per Emi grant
$8. 43
$50. 49
$0
$10
$20
$30
$40
$50
$60
Thou
sand
s
Previ ous Cumul ati ve
Total Amount
$11. 58
$75. 61
$0
$10
$20
$30
$40
$50
$60
$70
$80
Mill
ions
Previ ous Cumul ati ve
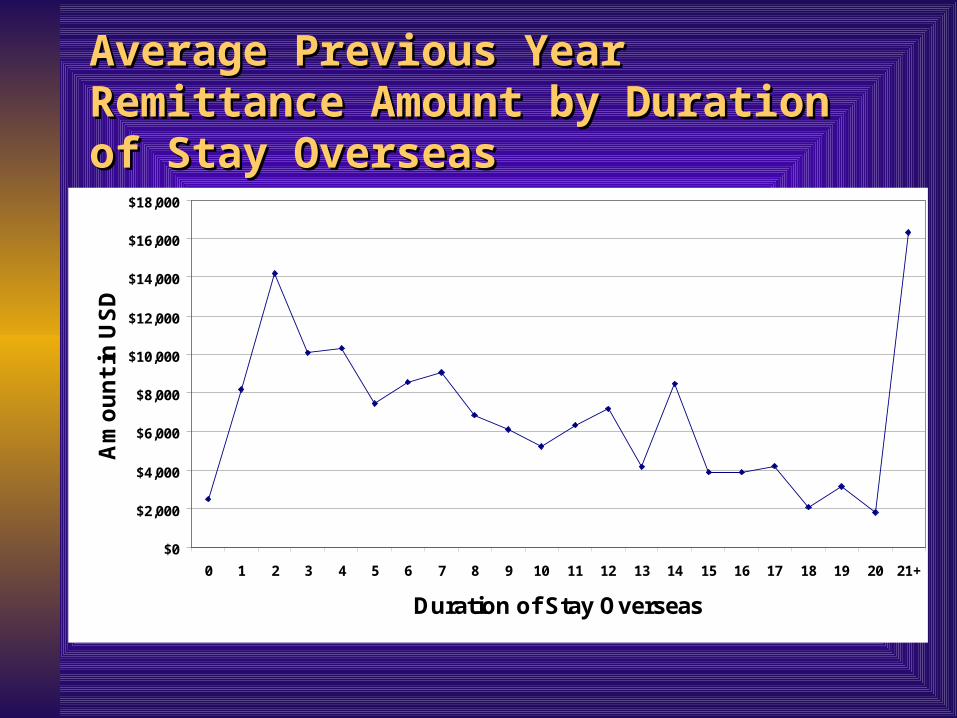
Average Previous Year Remittance Average Previous Year Remittance Amount by Duration of Stay OverseasAmount by Duration of Stay Overseas
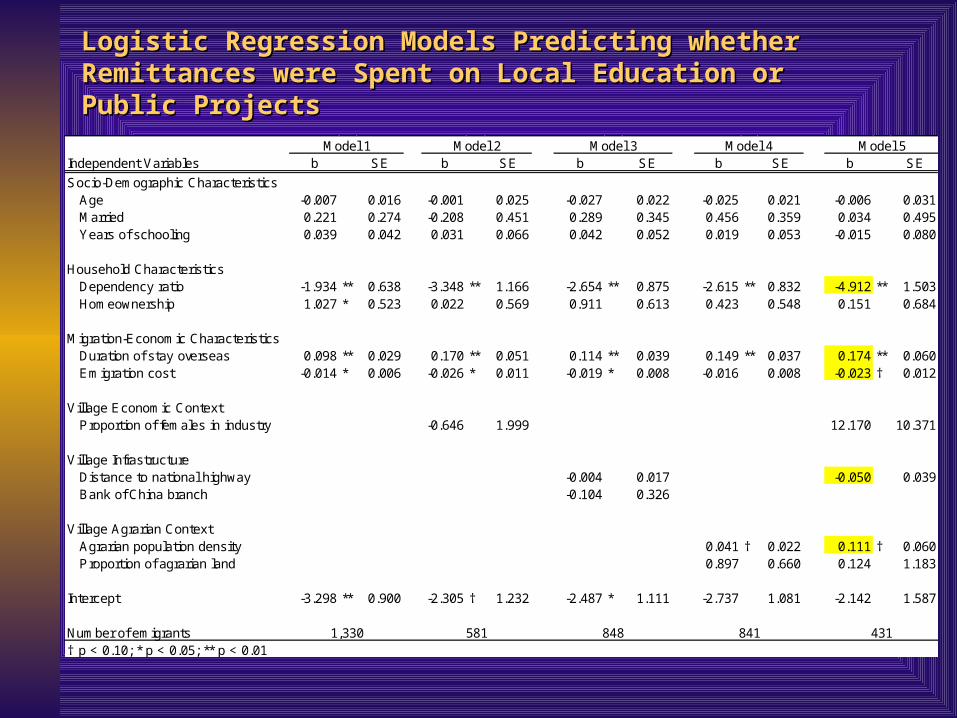
Number of emigrants† p < 0.10; * p < 0.05; ** p < 0.01
4101,282 559 811 812
Model 1 Model 2 Model 3 Model 4 Model 5
Logistic Regression Models Predicting whether Remittances were Logistic Regression Models Predicting whether Remittances were Spent on Local Education or Public ProjectsSpent on Local Education or Public Projects
Independent Variables b SE b SE b SE b SE b SE
Socio-Demographic Characteristics Age -0.007 0.016 -0.001 0.025 -0.027 0.022 -0.025 0.021 -0.006 0.031 Married 0.221 0.274 -0.208 0.451 0.289 0.345 0.456 0.359 0.034 0.495 Years of schooling 0.039 0.042 0.031 0.066 0.042 0.052 0.019 0.053 -0.015 0.080
Number of emigrants† p < 0.10; * p < 0.05; ** p < 0.01
4311,330 581 848 841
Model 1 Model 2 Model 3 Model 4 Model 5
Concluding RemarksConcluding Remarks
• Large amount of remittance led to major indirect effect on Large amount of remittance led to major indirect effect on local economy. local economy.
• Going beyond our data and beyond migrant-sending Going beyond our data and beyond migrant-sending communitycommunity
• Steel mills in other provinces (construction boom)Steel mills in other provinces (construction boom)
• Brick factoriesBrick factories
• Investment in real estimate market in nearby cities (such as Investment in real estimate market in nearby cities (such as Fuzhou city).Fuzhou city).
• Business activities, not the only yardstick for development. Business activities, not the only yardstick for development. Investment in education and local public projects.Investment in education and local public projects.
Large Picture: Overseas Chinese Large Picture: Overseas Chinese and China’s Developmentand China’s Development
• China’s special economic zones (Shenzhen, China’s special economic zones (Shenzhen, Zhuhai, Shantou, and Xiamen). Zhuhai, Shantou, and Xiamen).
• During 1979-1991, overseas Chinese investment During 1979-1991, overseas Chinese investment accounted for 66% of FDI. This built accounted for 66% of FDI. This built fundamental confidence on investing in China, fundamental confidence on investing in China, encouraging other big companies to go to encouraging other big companies to go to China. Thus if one takes a long view, the story China. Thus if one takes a long view, the story is very promising. is very promising.