34
International public health governance strategies Dr. Giampiero Favato presented at the University Program in Health Economics Ragusa, 26-28 June 2008
| Date post: | 14-Dec-2015 |
| Category: |
Documents |
| Upload: | makenna-garth |
| View: | 217 times |
| Download: | 3 times |

International public health governance strategiesDr. Giampiero Favatopresented at the University Program in Health EconomicsRagusa, 26-28 June 2008
2
Health system defined
By the ‘health system’ in a country we mean the set of agencies and relationships that lead to the delivery of health care.
– In the USA, this is a system which uses many different agencies and a variety of relationships to deliver health care. Many parts make up a single whole.
– Similarly, in the NHS-dominated UK, there is one system: a large government monopoly as one major agent with private insurers, private hospitals and alternative health providers, linked by a variety of relationships.

3
Factors influencing health systems
Government responses, past and present, to market failure. Attempts to change the country’s health care system in
response to equity and/or efficiency considerations. The operation of market forces on both the supply and the
demand side of health care. The historical factors which have shaped the main institutions
involved in health care financing and provision. Political pressures, e.g. different attitudes to equity and
efficiency The wealth of the country.
4
Reasons for collective finance and provision of health care Reasons for market failure:
– Uncertainty about the incidence of disease, both its diagnosis and its prognosis.– Uncertainty about the likelihood of recovery after treatment, that is, the
effectiveness of care.– Health is fundamental to people’s lives and their demand for health care is
derived from their demand for health. Many illnesses carry the risk of death, along with the risk that people’s social and working lives will be impaired.
– Illness is costly in itself. For example, someone may lose their earnings due to illness.
– The conduct expected of doctors is often seen as setting the market apart from those for other goods and services. There is a strong element of trust in the doctor-patient relationship and patients delegate many decisions to their doctor. This is often referred to as an agency relationship.
– Doctors face a code of ethical restrictions on their practice. – There is an ethical tradition of treating patients according to their medical need,
rather than their ability to pay.– There are many barriers to entry to the market.

5
Finance and provision of health care
Health care fund raising; Provision of health care services; Payments for health care services.
6
Health care fund raising
Tax-funding means that the majority of the cost of collectively provided health care is paid for out of direct and indirect taxes;
Social insurance means that funds are raised through mutual or nongovernmental public bodies, with fixed membership charges or membership charges linked towages. Membership is often by region or by occupation;
Private insurance includes conventional market insurance, with premiums linked to risks, and controlled private insurance, in which the market is manipulated in an attempt to achieve more socially beneficial outcomes;
Co-payments refer to the many different payments that patients must make for care. These can be found even in tax-funded systems with a strong focus on equity, though the amounts are generally relatively small.

7
Provision of health care services
Public and charitable hospitals and services providing free or subsidised services through employed or fee-earning clinical staff;
Private sector, for-profit organisations including hospitals and pharmacies;
Clinical professionals, in particular doctors, working independently, either full or part time in groups or single-handed practices, for fees or block grants;
Clinical professionals working for salaries.

8
Payments for health care services
By fee per patient or other unit of activity (e.g. day in hospital, test given). Payments may be made to hospitals and/or individual clinicians. They can be fixed prospectively as well as charged retrospectively;
By capitation funding, based on the population to be served rather than the exact level of service;
By block grants and broad contracts covering a range of services and service levels;
By direct payments from the patient to the clinical providers. Such payments typically make up a small part of total spending on collective and complex health care in industrialised countries;
Individual clinicians may receive a salary or they may receive fees per item of service or be paid by a capitation system linked to the number of patients covered for services. The latter model is particularly common in primary care.
9
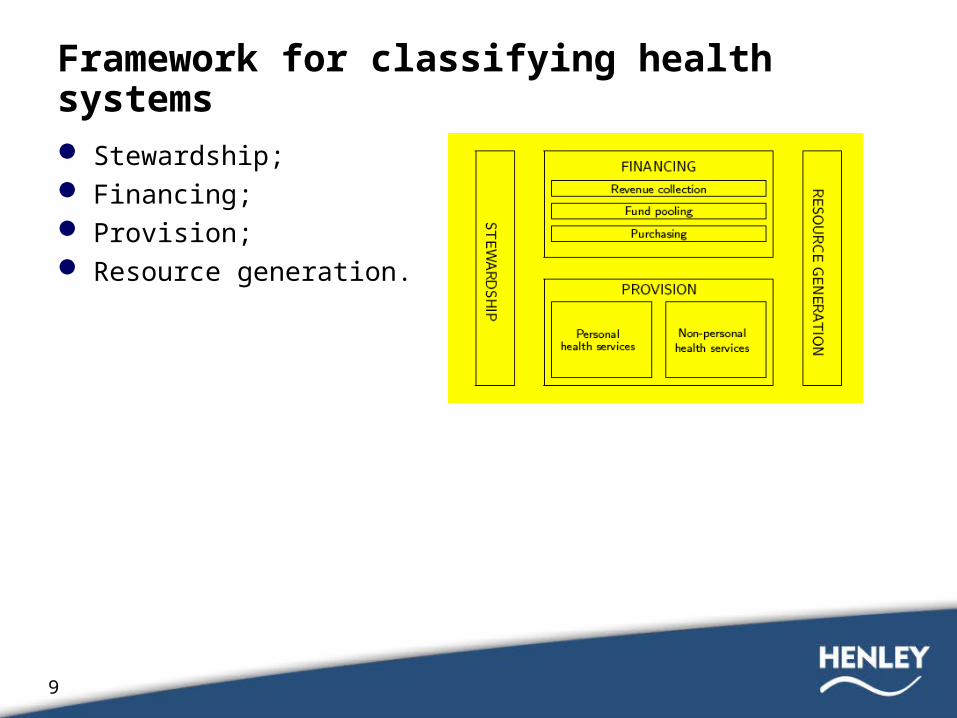
Framework for classifying health systems
Stewardship; Financing; Provision; Resource generation.
10
The four basic functions of health systems
Stewardship. Those financing health care are likely to be very interested in standards of provision and the governance of health care quality. They are less likely to leave it all to providers.
Resource generation is important for those agencies financing health care because it may affect the future cost of provision, a key concern of those raising the finance.
Financing:– Revenue collection - collecting the funds to pay for health care for large
groups of people;– Fund pooling - pooling funds to share risks;– Purchasing - deciding what services to pay for and how to pay;
Provision - providing health services.

11
Models of health systems integration
The Slab model; The Tube model; The Chunky model; The Mosaic model

12
The “Slab” model: fully integrated
Strictly, this model applies when a health agency raises the funds, pools them, plans to obtain a package of health care for all and provides that package.
The ‘Slab’ model is a completely integrated health system, in which all activities are both horizontally and vertically integrated.
The UK National Health Service, before the Thatcher reforms of the 1990s and the recent reintroduction of an internal market, is often described as being like this (though some elements, e.g. self-employed GPs, do not fit this model).
A more appropriate example might be Eastern European systems before the fall of the Iron Curtain.

13
The “Tube” model: vertically integrated- horizontally segmented In the ‘Tube’ model, different
organisations each compete to provide an integrated approach to revenue collection, pooling, purchasing and provision.
Consumers are locked into one system for all their funding and care.
Models of this kind include:– Some of the segmented systems of
Latin American countries;– Some of the local authority systems in
Scandinavia, where a local agency is responsible for elements of funding as well as delivery (though without direct competition);
– US HMOs operating alongside a more fragmented model of the insurance market, such as the Mosaic model.

14
The “Chunky” model: vertically segmented- horizontally integrated In the ‘Chunky’ model, organisations
have a high degree of horizontal integration but no vertical integration.
With the exception of provision, the model is to a degree like the NHS in England and public health care in Ireland.
– Funds are collected by the Treasury;– They are distributed after risk pooling by the
Department of Health;– Purchasing is carried out by relatively strongly
integrated agencies;– Provision is much less integrated than shown,
with a Mosaic of hospital and community trusts and GPs.
There are also aspects of the systems in Colombia, Australia and Spain that fit this model. However, this model is not frequently found.
15
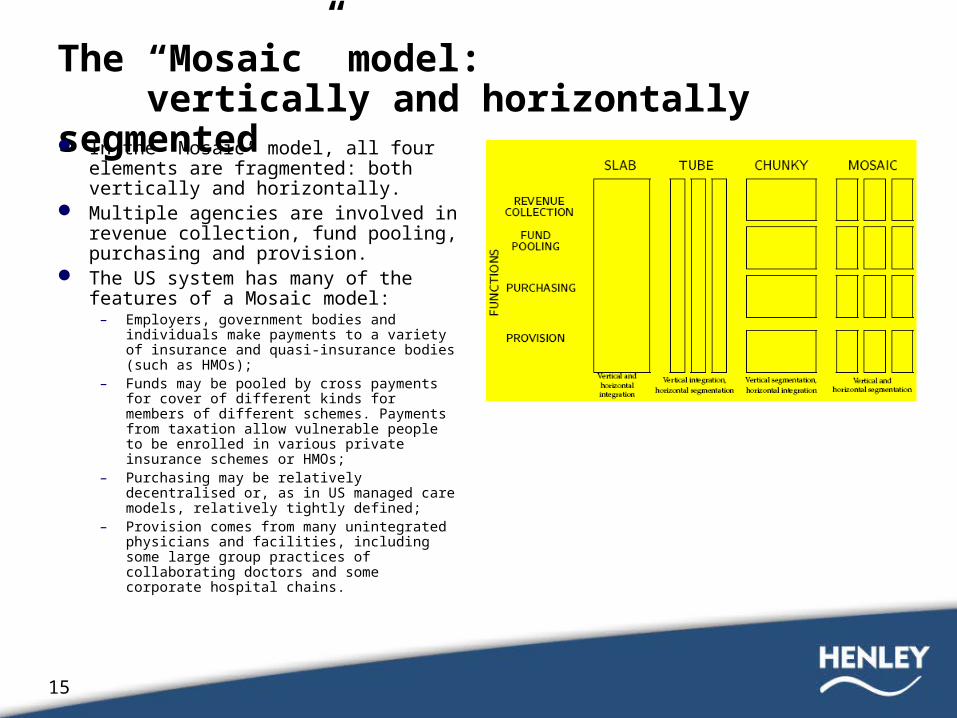
The “Mosaic” model: vertically and horizontally segmented In the ‘Mosaic’ model, all four elements
are fragmented: both vertically and horizontally.
Multiple agencies are involved in revenue collection, fund pooling, purchasing and provision.
The US system has many of the features of a Mosaic model:
– Employers, government bodies and individuals make payments to a variety of insurance and quasi-insurance bodies (such as HMOs);
– Funds may be pooled by cross payments for cover of different kinds for members of different schemes. Payments from taxation allow vulnerable people to be enrolled in various private insurance schemes or HMOs;
– Purchasing may be relatively decentralised or, as in US managed care models, relatively tightly defined;
– Provision comes from many unintegrated physicians and facilities, including some large group practices of collaborating doctors and some corporate hospital chains.
16
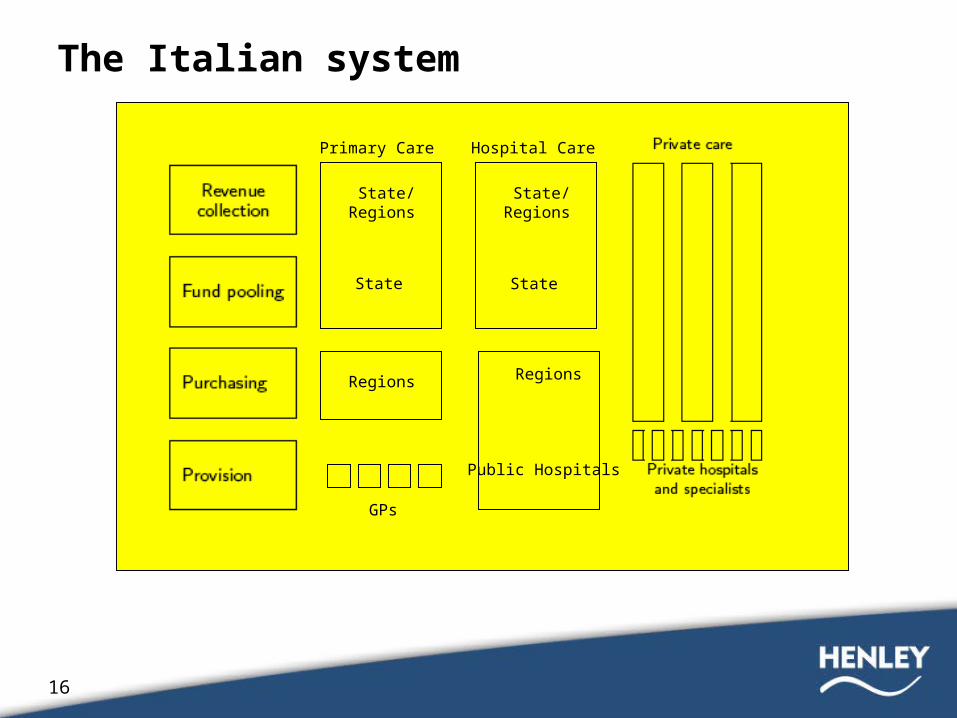
The Italian system
Primary Care
State/Regions
Regions
GPs
State
Hospital Care
State/Regions
Regions
Public Hospitals
State

17
Methods of raising funds for collective health care
ITALY
18
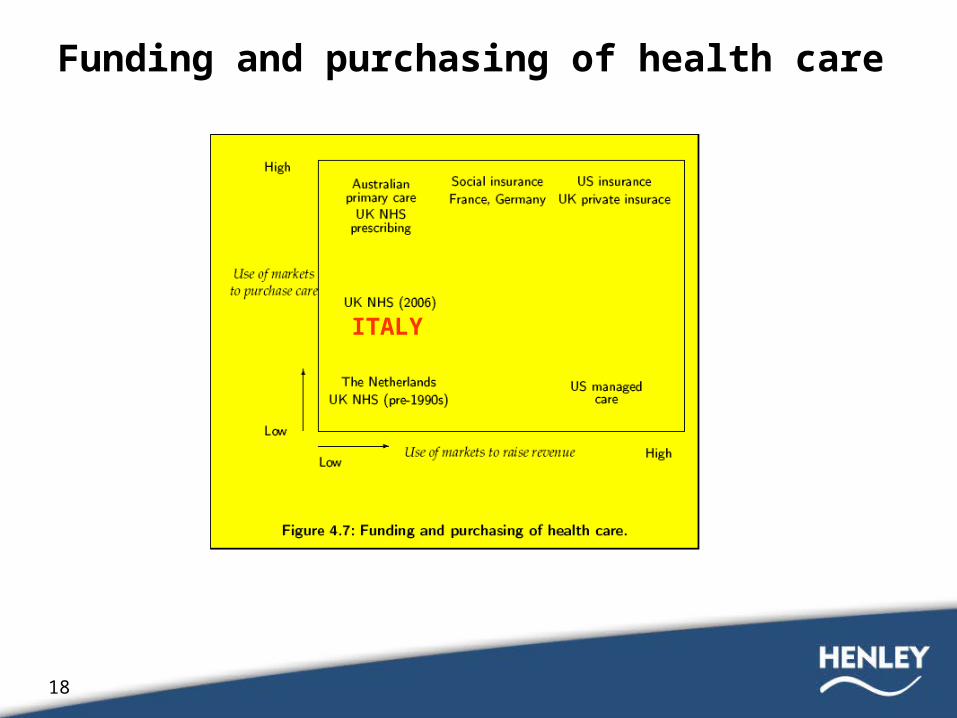
Funding and purchasing of health care
ITALY

19
Forms of fund pooling schemes
In public, vertically integrated, systems it is unlikely that total spending will be controlled centrally. Rather, funds are likely to be pooled and then delegated down to subordinate bodies:– in England, Strategic Health Authorities and Primary Care Trusts;– in Australia, State Departments of Health and local Health Boards;– in Scandinavia, local councils;– in Italy, the SSN.
To allocate funding to different subordinate purchasers, the responsible organisation needs to know:– How many people are in each separate pool;– How ill these people are likely to be;– How much it will cost to treat their illnesses efficiently, in the light of
either current practice or guidelines and protocols on treatment.

20
Allocative equity
Horizontal equity is concerned with equal treatment of individuals who are equal in all relevant respects.
Vertical equity is concerned with unequal treatment of individuals who are unequal in some relevant respects.
If the risk pooling system shifts a lot of resources towards those with the worst health, these resources may be unable to achieve major gains in health, for example, because such patients are close to death;
Funding will then be less readily available for routine treatments which can extend quality of life.

21
Two approaches to equity
Health gain maximisation. In such a situation:– All health gains are seen to be of equal value regardless of who
gains them;
– The system only spends more on cases who benefit most in health improvement achieved per unit of resource spent.
Maximise the health of the worst off. Society should aim to maximise the position of the worst off in distributing income and opportunity (termed the Difference Principle).

22
Funding in practice: risk equalisation
The estimated number of patients in each area (or fund) expected to get each medical condition at each relevant level of severity;
The treatment for each condition as specified by the health funding agency;
The cost of providing the planned treatment to the expected number of cases.
Countries with tax-funded, social or controlled market insurance schemes employ similar mechanisms to pool funds.

23
Cost differences between patients create problems for fund pooling Funds need to be redistributed, based on what members of each
age/sex group cost. In government-run systems like the NHS, more detailed analysis of
population characteristics and technical adjustments for supply and availability of services can provide an alternative.
In health care systems using social and controlled market insurance, fund pooling continues to pose major challenges.
In Switzerland, concern with the ability of funds to selectively recruit good risks has led insurers to fear the introduction of a single national insurer.
South American countries such as Chile and Colombia have adopted controlled insurance systems as part of a move to managed competition.
In Belgium, risk equalisation is seen as not yet strong enough to prevent cream skimming, leaving the social insurance system open to cream skimming and increased costs from provider inefficiencies.

24
Italian original contribution: the ASSET research group

25
Study objective
The primary objective of this study was to discuss the adoption of a knowledge-based capitation model (ASSET, Age/Sex Standardised Estimates of Treatment) and its implications for Italian healthcare policy makers.

26
Metodhs
Integration of 2 databases:– Pharmaceutical individual costs– Personal data
Sample: 3,175,691 Italian residents Timeframe: 24 months/12 analysed (October 04/ September 05) Data collected:
– Age– Sex– Drugs prescribed (ATC 5° level)– Cost paid by the Italian National Health Service (SSN)
Data privacy: all personal information were replaced by an univocal numerical code

27
ASSET’s mean cost by age group and standardised weights for overall prescribing.
Mean cost (Euro) Standardised weights
Age group Males Females Males Females < 14 0-4 5-14
41.37 36.11 43.66
35.72 31.59 37.53
0.21 0.18 0.22
0.18 0.16 0.19
15-24 44.93 40.94 0.23 0.21 25-34 52.75 62.75 0.27 0.32 35-44 80.89 90.52 0.41 0.46 45-54 146.20 149.62 0.75 0.76 55-64 300.88 277.40 1.54 1.42 65-74 505.77 431.13 2.59 2.20 >75 652.75 481.20 3.34 2.46 Total 196.13 195.12 1.00 1.00

28
Same average cost for males and females
The average annual consumption of pharmaceutical was similar for both sexes: € 196,13 for males and € 195,12 for females
In the younger population (up to 24 years of age) the consumption of medicines is lower for females than for males
In the adult population (up to 54 years) the trend revertsAfter 65, the average consumption of medicines is
significantly higher for males than for females
29
Ageing
Differently from what observed in UK, infants of age 0-4 years consume fewer medicines than the next group age (5-14)
On average, a 75 year old male consumes annualy 12 times more medicines than a 25 year old (8 times for a female)
Individuals ageing >65 years (22% of the population) consume 56% of the national public prescribing budget
30
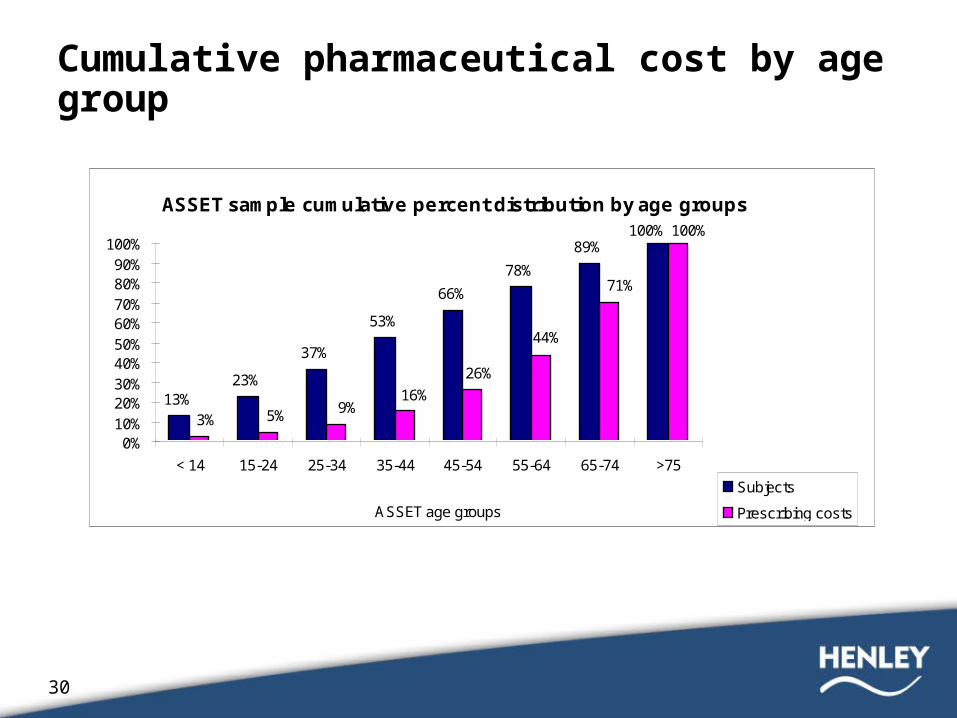
Cumulative pharmaceutical cost by age group
ASSET sample cumulative percent distribution by age groups
13%23%
37%
53%
66%
78%
89%100% 100%
71%
44%
26%
16%9%5%3%
0%10%20%30%40%50%60%70%80%90%
100%
< 14 15-24 25-34 35-44 45-54 55-64 65-74 >75
ASSET age groups
Subjects
Prescribing costs
31
Implications for the Governance of Italian public health care Policy makers not only need to know the determinants of
public prescribing expenditures, but they should also have the possibility to estimate the impact of those trends having a significant impact on pharmaceutical demand
The ASSET model confirms the strong, quasi-exponential relationship between age and pharmaceutical utilization, allowing policy makers to quantify the impact of ageing population in terms of resources needed to satisfy the incremental therapeutic needs

32
Prescribing funding: the Lombardia example
The intermediate scenario of the latest demographic projections for the Lombardia region foresees in 2051 a significant decrease in the total number of residents (8.6 million), down by 6.7% compared to the current 9.2 million inhabitants.
All else equal (prices, therapeutic alternatives, and public coverage of prescription costs), we could assume that prescription costs should progressively decline over the next forty five year period.
The ASSET model helps policy makers and demographic statisticians to actually demonstrate the opposite.
The weighted population is expected to grow from 8.8 million in 2005 to 11.5 million in 2051. All else equal, the pharmaceutical spending in 2051 is likely to be 31.3% higher than in 2005 as a result of the ageing population.
33
Allocation of resources: the Tale of the Two Regions Two Italian regions, Emilia-Romagna (North) and Puglia
(South) have a similar population of 4,15 million and 4,07 million residents respectively, but a 5.7 percent points difference in the incidence of elderly population (22.6% vs. 16.9% residents over 65 years old).
A straight capitation formula would allocate to Puglia a prescription budget just 2.0% lower than the one allocated to Emilia-Romagna.
Comparing the number of residents weighted by age and sex (3.52 million in Puglia vs. 4.26 million in Emilia-Romagna), we realise that Emilia-Romagna actually needs 20.9% more prescribing funds than Puglia to cover the therapeutic needs of its older population
34
Conclusions
The ASSET model is a knowledge-based tool, useful to support healthcare governance to equitably allocate prescribing funding to regional authorities
The major limitation of demographic adjusted healthcare cost models is represented by their tendency to lose their explanatory power when the subset of population examined gets smaller
The identification of a robust model capable to identify the drivers of individual variances should be the objective of further research
The ASSET age/sex weightings should be used as a guide, not as the ultimate determinant, for an equitable allocation of prescribing resources in conjunction with historic utilisation and cost data.


