108
International Student Barometer Autumn 2016 All materials strictly copyright © i-graduate 2016

International Student Barometer
Autumn 2016
All materials strictly copyright © i-graduate 2016

Overview
Appendix
Deliverables
Questionnaire
About i-graduate
Additional Info
Experience
Engagement
Learning
Support
Arrival
Living
Pre - Arrival
Agents
Key Influences
Application
Decision Factors
Summary
Headline Results
National Trends
Survey Response
Survey Overview
All materials strictly copyright © i-graduate 2016 2

3All materials strictly copyright © i-graduate 2016

Process summary & scale
All materials strictly copyright © i-graduate 2016
• Core questionnaire covering arrival, learning, living, support, recommendation, application and choice of institution
• Semi-standardised online questionnaire format, adapted and customised for each partner institution
• Students invited to feedback from September to December 2016
• 159,959 international students responded from 196 institutions in 17 countries
• Institution-specific results compared against comparator groups, national and international benchmarks
• Reporting: in person, confidential and customised to each institution
4

Institutions in bold surveyed international and domestic students
All participating institutions
All materials strictly copyright © i-graduate 2016 5
ISB (159,959), SB (140,593), ISBSB (188,031)Adelphi International Curtin University Hochschule Bonn-Rhein-Sieg
Algonquin College Deakin University Hochschule Deggendorf
Auburn Global Dublin City University Hochschule Furtwangen
Australian Catholic University Edith Cowan University Hochschule Koblenz
Bath Spa University European University Viadrina Hochschule Neu-Ulm
Bauhaus-Universität Weimar Fachhochschule DortmundHK Community College (HKCC)/School of Professional
Education and Executive Development (SPEED)
BINUS University Fachhochschule Frankfurt am MainHumber Institute of Technology and Advanced
Learning
Bond University Fanshawe College Indiana University Bloomington
Bournemouth University Federation University Australia Indiana University East
Brandenburgische Technische Universität Cottbus -Senftenberg
FIU Global First Year Indiana University Kokomo
Cambrian College Flinders University Indiana University Northwest
Camosun College Freie Universität Berlin Indiana University South Bend
Cardiff Metropolitan University Friedrich-Schiller-Universität Jena Indiana University South East
Centennial College George Brown College Indiana U-Purdue U Indianapolis
Chalmers University of Technology Georgian College International Accelerator at American University
Charles Darwin University Glasgow Caledonian University Jade University of Applied Sciences
Chinese University of Hong Kong Goldsmiths, University of London James Cook University
Christian-Albrechts-Universität zu Kiel Griffith University James Cook University Singapore
College of the Rockies HAN University of Applied Sciences Johannes Gutenberg-Universität Mainz
Communaute Universite Grenoble Alpes Hanze University of Applied Sciences, Groningen Jönköping University
Coventry University Heinrich Heine Universität Düsseldorf Karolinska Institute
CQUniversity Australia HKU Space Community College Kent State University

Institutions in bold surveyed international and domestic students
All participating institutions
All materials strictly copyright © i-graduate 2016 6
ISB (159,959), SB (140,593), ISBSB (188,031)KU Academic Accelerator Program Newcastle University Swedish Institute of Agricultural Sciences
La Trobe University Niagara CollegeSwinburne University of Technology (Sarawak
Campus)
Lane Community College Northeastern University Taylor's College
Leeds Beckett University Northumbria University Taylor's University, Lakeside Campus
Leiden University Osnabrück University of Applied Sciences Technische Hochschule Köln
Linköping University Ostbayerische Technische Hochschule Regensburg Technische Universität Bergakademie Freiberg
Linnaeus University Oxford Brookes University Technische Universität Chemnitz
Liverpool John Moores University Peking University Technische Universität Clausthal
London South Bank University Penang Medical College Technische Universität Dresden
Loughborough University Philipps-Universität Marburg Technische Universität Kaiserslautern
LSU Global Queensland University of Technology Teesside University
Lund University RMIT University The Australian National University
Mahidol University Royal Holloway, University of London The Hong Kong Polytechnic University
Manchester Metropolitan University Ruhr-Universität Bochum The Hong Kong University of Science and Technology
Martin-Luther Universität Halle-Wittenberg RWTH Aachen University The University of Adelaide
Maynooth University Saxion University of Applied Sciences The University of Edinburgh
Mid Sweden University Sheridan College The University of New South Wales
Mohawk College SIM Global Education (SIM GE) The University of Queensland
Monash University Southern Cross University The University of Sheffield
Murdoch University St. Lawrence College The University of Sydney
National University of Ireland, Galway Stockholm University The University of Western Australia
New Brunswick Community College Sunway University and Sunway College THEi / IVE / HKDI

Institutions in bold surveyed international and domestic students
All participating institutions
All materials strictly copyright © i-graduate 2016 7
ISB (159,959), SB (140,593), ISBSB (188,031)Trinity College Dublin University of Central Lancashire University of South Carolina IAP
UCF Global Achievement Academy University of Derby University of South Wales
Umeå University University of Dundee University of Southern Queensland
Universita Cattolica del Sacro Cuore University of Glasgow University of St Andrews
Universität Bayreuth University of Gloucestershire University of Stirling
Universität Bielefeld University of Gothenburg University of Strathclyde
Universität Hamburg University of Greenwich University of Surrey
Universität Hohenheim University of Groningen University of Sussex
Universität Konstanz University of Hong Kong University of Tasmania
Universität Leipzig University of Huddersfield University of Technology Sydney
Universität Paderborn University of Kent University of the Sunshine Coast
Universität Stuttgart University of Leeds University of the West of Scotland
Universität zu Köln University of Limerick University of Twente
Universiti Brunei Darussalam University of Melbourne University of Wales, Trinity Saint David
University College Cork University of Nebraska–Lincoln University of Wollongong
University College Dublin University of New England University of York
University of Bedfordshire University of Nottingham Uppsala University
University of Bradford University of Nottingham (China) Utrecht University
University of Bristol University of Nottingham (Malaysia) Western Michigan University
University of Calgary University of Oulu Western Sydney University
University of Cambridge University of Oxford
University of Canberra University of South Australia

ISB (161,781), SB (87,328), ISBSB (136,552)
Institutions in bold surveyed international and domestic students
Benchmark groups
8All materials strictly copyright © i-graduate 2016
Sweden ISB (7,196)
Chalmers University of Technology
Jönköping University
Karolinska Institute
Linköping University
Linnaeus University
Lund University
Mid Sweden University
Stockholm University
Swedish Institute of Agricultural Sciences
Umeå University
University of Gothenburg
Uppsala University

All materials strictly copyright © i-graduate 2016 9

Uppsala Uni
(656)
2016 vs
2013
Sweden ISB
(6093)
Europe ISB
(33655)
Global ISB
(132680)
54% 9% I would actively encourage people to apply 47% 42% 40%
34% -7% If asked, I would encourage people to apply 41% 42% 44%
8% -3% I would neither encourage nor discourage people to apply 9% 11% 13%
2% -1% If asked, I would discourage people from applying 2% 3% 3%
1% 1% I would actively discourage people from applying 1% 1% 1%
Would you recommend the institution to others thinking of applying here?
Propensity to recommend
All materials strictly copyright © i-graduate 2016 10

Uppsala Uni (656) MA (451) BA (196)
54% I would actively encourage people to apply 52% 60%
34% If asked, I would encourage people to apply 35% 31%
8% I would neither encourage nor discourage people to apply 9% 6%
2% If asked, I would discourage people from applying 2% 3%
1% I would actively discourage people from applying 1% 1%
Propensity to recommend (by study level)
All materials strictly copyright © i-graduate 2016
Would you recommend the institution to others thinking of applying here?11

0%
10%
20%
30%
40%
50%
60%
70%
80%
90%
100%
Actively encourage (ISB)
If asked, encourage (ISB) If asked, encourage (Institution)
Actively encourage (Institution)
If asked, encourage (Sweden ISB)
Actively encourage (Sweden ISB)
All materials strictly copyright © i-graduate 2016
Propensity to recommend (all institutions)
Would you recommend the institution to others thinking of applying here?12

Propensity to recommend
All materials strictly copyright © i-graduate 2016
Would you recommend the institution to others thinking of applying here?13The Fixed Benchmark only includes institutions that took part in both years
-6% -4% -2% 0% 2% 4% 6%
Overall
MA
BA
Uppsala Uni
Sweden ISB fixed
Worse in 2016 Better in 2016Worse in 2016 Better in 2016
*2016 vs 2013

12% 11% 11% 8%
42% 40% 41%
34%
43% 44% 45%54%
0%
10%
20%
30%
40%
50%
60%
70%
80%
90%
100%
2010 (1111) 2011 (1032) 2013 (604) 2016 (656)
I would activelyencourage peopleto apply
If asked, I wouldencourage peopleto apply
I would neitherencourage nordiscourage peopleto apply
If asked, I woulddiscourage peoplefrom applying
I would activelydiscourage peoplefrom applying
Propensity to recommend (compared to previous years)
All materials strictly copyright © i-graduate 2016
Would you recommend the institution to others thinking of applying here?14

4%
4%
6%
6%
57%
56%
33%
34%
0% 10% 20% 30% 40% 50% 60% 70% 80% 90% 100%
Sweden ISB (7196)
Uppsala Uni (778)
Very dissatisfied Dissatisfied Satisfied Very satisfied
Overall satisfaction
Overall satisfaction
All materials strictly copyright © i-graduate 2016
Overall, how satisfied are you with all aspects of your experience at your institution?
15

90
% 89
%
88
%
90
%
97
%
91
%
84
%
89
%
91
% 89
%
95
%
90
%
90
% 87
%
60%
65%
70%
75%
80%
85%
90%
95%
100%
Sweden ISBOverall satisfaction
Overall satisfaction
All materials strictly copyright © i-graduate 2016 16
Overall, how satisfied are you with all aspects of your experience at your institution?

All materials strictly copyright © i-graduate 2016 17
41%
0%
10%
20%
30%
40%
50%
60%
70%
80%
90%
100%Response Population Response Rate
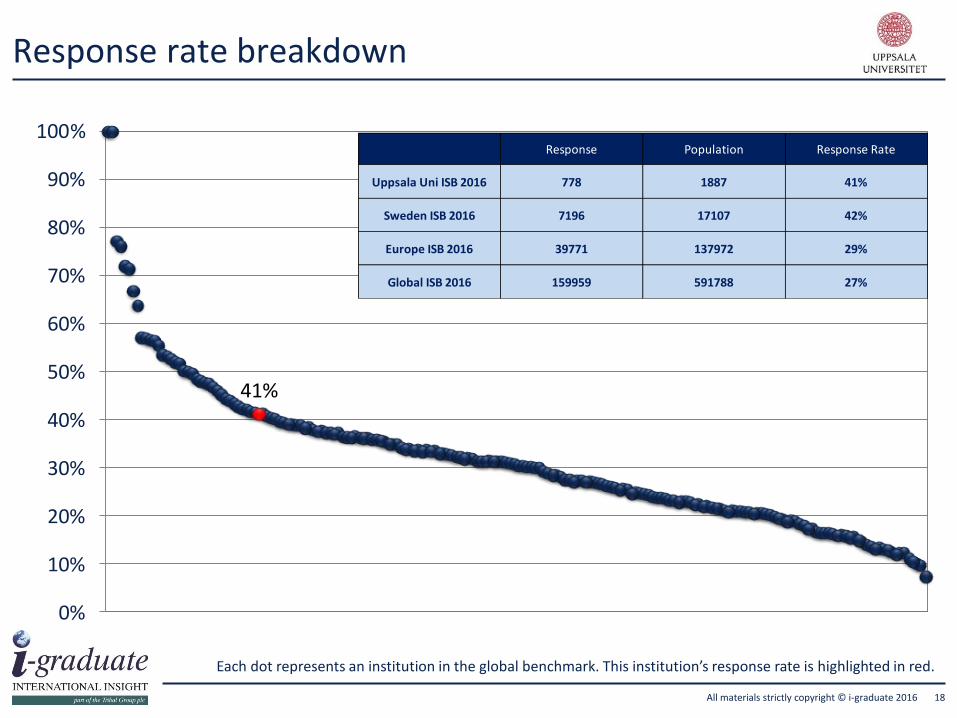
Uppsala Uni ISB 2016 778 1887 41%
Sweden ISB 2016 7196 17107 42%
Europe ISB 2016 39771 137972 29%
Global ISB 2016 159959 591788 27%
Response rate breakdown
All materials strictly copyright © i-graduate 2016
Each dot represents an institution in the global benchmark. This institution’s response rate is highlighted in red.
18

14%
10%
6%
4%
4%3%
3%3%3%
50%
15%
8%
6%
3%
4%
3%
5%2%4%
50%
Uppsala Uni (778, inner circle) vs Sweden ISB (7196, outer circle)
Germany
China
France
USA
Italy
UK
India
Greece
Finland
Other
Nationality breakdown
All materials strictly copyright © i-graduate 2016 19

69%
29%
2%
67%
30%
3%
Uppsala Uni (778, inner circle) vs Sweden ISB (7196, outer circle)
MA BA Other
Study level breakdown
All materials strictly copyright © i-graduate 2016 20

67%
12%
4%
31%
24%
43%
5%
14%
0% 20% 40% 60% 80% 100%
MA (537)
BA (227)
First/single year Other year Last/final year Short course
Study stage breakdown
All materials strictly copyright © i-graduate 2016 21

41%
37%
13%
9%
Uppsala Uni (733)
Humanities and Social Sciences
Science and Technology
Don't know
Medicine and Pharmacy
School/faculty breakdown
All materials strictly copyright © i-graduate 2016 22

All materials strictly copyright © i-graduate 2016 23

93%
93%
91%
87%
86%
85%
80%
77%
75%
74%
91%
86%
90%
86%
87%
83%
80%
79%
70%
77%
60% 65% 70% 75% 80% 85% 90% 95% 100%
Institution reputation
Research quality
Specific course title
Cost of study
Personal safety
Earning potential
Cost of living
Social life
Opps for further study
Location
Uppsala Uni (430)
Sweden ISB (3275)
How important were the following factors when deciding where to study?
Top 10 factors in study decision (% important)
All materials strictly copyright © i-graduate 2016 24**Postgraduate students only

50%
29%
19%
19%
18%
16%
14%
14%
13%
11%
52%
34%
20%
13%
16%
20%
12%
17%
12%
11%
10% 20% 30% 40% 50% 60%
Institution website
Friends
Family
Teacher/tutor where you studiedpreviously
League tables or rankings
Alumni
Host country government advisoryservice
Social networking site
Institution prospectus
Education agent
Uppsala Uni (426)
Sweden ISB (3252)
Which of the following helped you to choose this institution?
Top 10 key influences (choice of institution)
All materials strictly copyright © i-graduate 2016 25

22%
78%
Uppsala Uni (357)
No Yes
60%
31%
9%
52%
40%
8%
Uppsala Uni (357, inner circle) vs Sweden ISB (2743, outer circle)
The institution The country Don't know
Was this country your first choice for international education?
Which was most important in your decision of where to study?
Brand strength
All materials strictly copyright © i-graduate 2016 26
All materials strictly copyright © i-graduate 2016 27

3% 8%
2%
57%
47%
32%
49%
0% 10% 20% 30% 40% 50% 60% 70% 80% 90% 100%
Sweden ISB (403)
Uppsala Uni (55)
Very poor Poor Good Very goodPlease rate the service you received from the agent/representative office:
Agent rating
All materials strictly copyright © i-graduate 2016 28

55%
78%
84%
80%
85%
83%
87%
90%
65%
77%
79%
81%
83%
85%
86%
95%
The agent reduced my overall costs (application feewaivers, money exchange discounts, etc.)
The agent described the institution accurately
The agent provided helpful services for my visaapplication
The agent provided helpful pre-departure orientationservices
The agent was well informed about higher education inthis country
The agent reduced time and effort needed to completemy application
The agent was not pushy or forceful with me during theapplication/enrolment process
The agent was knowledgeable about the institution'sapplication processes
Uppsala Uni (42) Sweden ISB (287)
To what extent do you agree or disagree with the following statements:
Agents
All materials strictly copyright © i-graduate 2016 29

All materials strictly copyright © i-graduate 2016 30

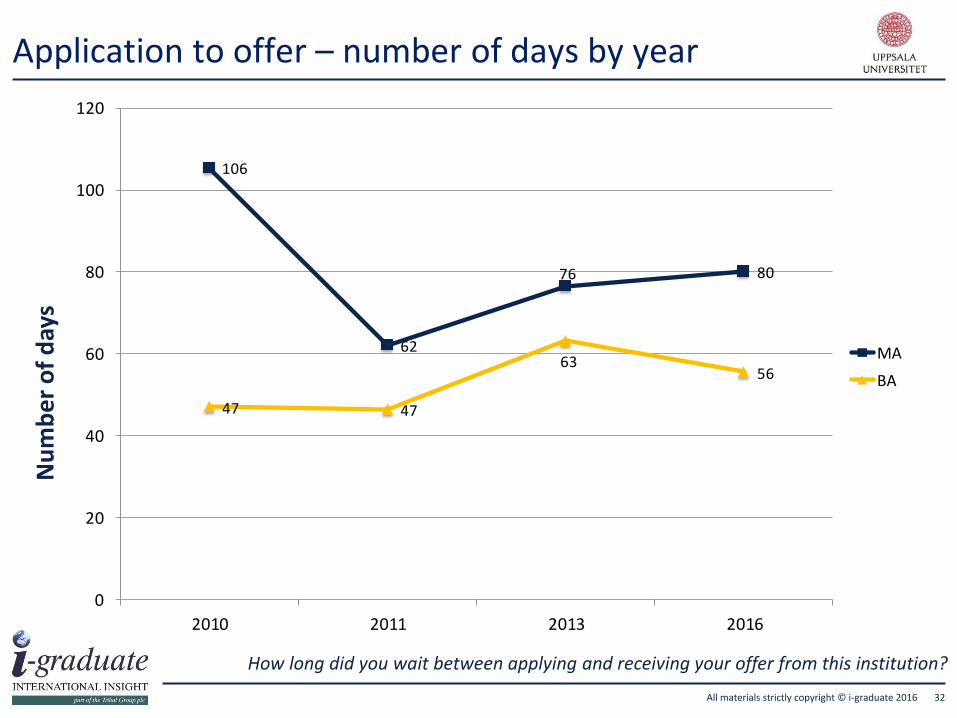
How long did you wait between applying and receiving your offer from this institution?
Application to offer – number of days and satisfaction
All materials strictly copyright © i-graduate 2016 31
Average Days Uppsala Uni Sweden ISB Europe ISB Global ISB
MA 80 79 60 47
BA 56 59 48 46
..
% Satisfaction Uppsala Uni Sweden ISB Europe ISB Global ISB
MA 81% 81% 80% 81%
BA 85% 82% 80% 82%
106
62
76 80
47 47
6356
0
20
40
60
80
100
120
2010 2011 2013 2016
MA
BA
How long did you wait between applying and receiving your offer from this institution?
Nu
mb
er
of
day
sApplication to offer – number of days by year
All materials strictly copyright © i-graduate 2016 32

All materials strictly copyright © i-graduate 2016 33

4%
5%
8%
9%
61%
58%
27%
28%
0% 10% 20% 30% 40% 50% 60% 70% 80% 90% 100%
Sweden ISB (3128)
Uppsala Uni (409)
Very dissatisfied Dissatisfied Satisfied Very satisfied
Arrival section asked to all 1st year students
Overall, how satisfied were you with the arrival experience?
Overall satisfaction - Arrival
All materials strictly copyright © i-graduate 2016 34

Other friends
Meeting staff
Registration
Introduction Days
Finance Office
Formal welcome
ARRIVAL OVERALL
First night
Home friends
Welcome
Study sense
Local orientation
Social activities
Internet accessAccommodation
conditionHost friends
Accommodation Office
Bank account
-12% -7% -2% 3% 8%
% difference to primary benchmark
Inst
itu
tio
n s
atis
fact
ion
(so
rte
d b
y %
sco
re)
Arrival section asked to all 1st year students
Arrival matrix
All materials strictly copyright © i-graduate 2016 35

Arrival section asked to all 1st year students
Benchmarking arrival
All materials strictly copyright © i-graduate 2016 36
Uppsala Uni ISB %Sweden ISB
%
Europe ISB
%ISB +/-
Sweden ISB
+/-
Europe ISB
+/-
ARRIVAL AVERAGE 80.0% 84.8% 82.4% 82.3% -4.8% -2.4% -2.3%
ARRIVAL OVERALL 86.6% 88.3% 88.0% 85.7% -1.7% -1.4% 0.9%
Other friends 92.4% 87.8% 90.9% 88.8% 4.6% 1.5% 3.7%
Meeting staff 89.3% 90.1% 90.4% 88.3% -0.8% -1.1% 1.0%
Registration 89.1% 88.4% 91.8% 87.6% 0.7% -2.8% 1.5%
Introduction Days 89.0% 88.2% 90.5% 87.4% 0.8% -1.5% 1.6%
Finance Office 88.6% 91.1% 93.5% 91.7% -2.4% -4.9% -3.1%
Formal welcome 88.3% 89.0% 93.0% 89.9% -0.7% -4.7% -1.5%
First night 83.9% 83.4% 79.3% 78.8% 0.4% 4.5% 5.1%
Home friends 83.8% 84.8% 86.9% 83.8% -1.0% -3.1% 0.1%
Welcome 83.2% 79.9% 79.7% 73.1% 3.3% 3.5% 10.1%
Study sense 82.8% 82.5% 83.5% 78.2% 0.3% -0.7% 4.6%
Local orientation 82.7% 84.5% 88.4% 85.2% -1.7% -5.6% -2.5%
Social activities 82.0% 85.1% 86.0% 84.4% -3.0% -3.9% -2.3%
Internet access 78.7% 80.5% 80.9% 78.6% -1.8% -2.2% 0.1%
Accommodation condition 74.9% 81.0% 77.3% 77.1% -6.0% -2.3% -2.2%
Host friends 69.0% 73.8% 67.6% 70.6% -4.8% 1.4% -1.6%
Accommodation Office 68.9% 83.8% 79.2% 77.7% -15.0% -10.4% -8.8%
Bank account 33.2% 77.8% 41.5% 69.6% -44.6% -8.3% -36.4%

Arrival section asked to all 1st year students
Benchmarking arrival (sorted by primary ranking group)
All materials strictly copyright © i-graduate 2016 37
Uppsala Uni ISB %Sweden ISB
%
Europe ISB
%ISB Sweden ISB Europe ISB
ARRIVAL AVERAGE 80.0% 84.8% 82.4% 82.3% 149 9 47
ARRIVAL OVERALL 86.6% 88.3% 88.0% 85.7% 82 8 18
First night 83.9% 83.4% 79.3% 78.8% 37 2 4
Welcome 83.2% 79.9% 79.7% 73.1% 28 3 4
Other friends 92.4% 87.8% 90.9% 88.8% 29 5 13
Finance Office 88.6% 91.1% 93.5% 91.7% 99 5 17
Registration 89.1% 88.4% 91.8% 87.6% 59 7 21
Host friends 69.0% 73.8% 67.6% 70.6% 145 7 49
Accommodation Office 68.9% 83.8% 79.2% 77.7% 116 7 35
Formal welcome 88.3% 89.0% 93.0% 89.9% 53 8 21
Study sense 82.8% 82.5% 83.5% 78.2% 108 8 21
Meeting staff 89.3% 90.1% 90.4% 88.3% 126 9 36
Accommodation condition 74.9% 81.0% 77.3% 77.1% 150 9 41
Home friends 83.8% 84.8% 86.9% 83.8% 107 10 36
Social activities 82.0% 85.1% 86.0% 84.4% 122 10 47
Internet access 78.7% 80.5% 80.9% 78.6% 114 10 42
Bank account 33.2% 77.8% 41.5% 69.6% 176 10 60
Introduction Days 89.0% 88.2% 90.5% 87.4% 91 11 36
Local orientation 82.7% 84.5% 88.4% 85.2% 113 12 45

-28% -24% -20% -16% -12% -8% -4% 0% 4% 8% 12% 16% 20% 24% 28%
Internet access
Welcome
Arrival Overall
First night
Registration
Introduction Days
Other friends
Study sense
Home friends
Meeting staff
Social activities
Formal welcome
Accommodation condition
Finance Office
Local orientation
Host friends
Accommodation Office
Bank account
Uppsala Uni
Sweden ISB fixed
Worse in 2016 Better in 2016
*2016 vs 2013
The Fixed Benchmark only includes institutions that took part in both years
Arrival section asked to all 1st year students
Arrival satisfaction (year on year*)
All materials strictly copyright © i-graduate 2016 38

Arrival Element Uppsala Uni Degree seeking Student Exchange
Arrival Overall (409) 87% 87% 86%
Accommodation Office 69% 72% 65%
Accommodation condition 75% 75% 77%
Bank account 33% 29% 48%
Internet access 79% 79% 80%
Finance Office 89% NA NA
First night 84% 86% 81%
Formal welcome 88% 89% 87%
Home friends 84% 81% 90%
Host friends 69% 74% 60%
Local orientation 83% 83% 83%
Meeting staff 89% 91% 85%
Other friends 92% 94% 89%
Registration 89% 90% 88%
Social activities 82% 80% 87%
Study sense 83% 84% 80%
Introduction Days 89% 88% 93%
Welcome 83% 82% 87%
Arrival – degree-seeking vs. exchange students
Arrival section asked to all 1st year students All materials strictly copyright © i-graduate 2016 39

All materials strictly copyright © i-graduate 2016 40

3%
2%
11%
12%
61%
63%
25%
23%
0% 10% 20% 30% 40% 50% 60% 70% 80% 90% 100%
Sweden ISB (6820)
Uppsala Uni (737)
Very dissatisfied Dissatisfied Satisfied Very satisfied
Overall, how satisfied are you with the learning experience at this stage in the year?
Overall satisfaction - Learning
All materials strictly copyright © i-graduate 2016 41

Academics' English
Expert lecturers
Assessment
Research
Learning support
Good teachers
Quality lectures
LEARNING OVERALL
Course content
Course organisation
Marking criteria
Performance feedback
-5% -4% -3% -2% -1% 0% 1% 2% 3% 4% 5%
Learning matrix - Teaching
All materials strictly copyright © i-graduate 2016
Inst
itu
tio
n s
atis
fact
ion
(so
rte
d b
y %
sco
re)
42
% difference to primary benchmark

Benchmarking learning - Teaching
All materials strictly copyright © i-graduate 2016 43
Uppsala Uni ISB %Sweden ISB
%
Europe ISB
%ISB +/-
Sweden ISB
+/-
Europe ISB
+/-
LEARNING AVERAGE 85.4% 84.9% 85.1% 83.7% 0.4% 0.2% 1.6%
LEARNING OVERALL 85.8% 86.5% 84.6% 85.1% -0.7% 1.1% 0.7%
TEACHING
Academics' English 95.1% 92.1% 94.3% 92.3% 3.0% 0.7% 2.8%
Expert lecturers 93.7% 92.9% 92.0% 92.7% 0.8% 1.7% 1.0%
Assessment 89.3% 88.2% 89.1% 85.7% 1.1% 0.2% 3.5%
Research 88.8% 87.2% 86.6% 85.2% 1.6% 2.2% 3.6%
Learning support 88.2% 89.1% 89.6% 86.7% -0.9% -1.4% 1.5%
Good teachers 87.8% 88.4% 84.6% 87.2% -0.6% 3.2% 0.6%
Quality lectures 86.5% 88.8% 85.4% 88.3% -2.3% 1.1% -1.7%
Course content 84.4% 88.6% 85.3% 86.7% -4.2% -0.8% -2.3%
Course organisation 82.2% 84.0% 80.6% 79.4% -1.8% 1.6% 2.8%
Marking criteria 79.1% 83.2% 80.6% 78.0% -4.1% -1.5% 1.1%
Performance feedback 76.5% 84.3% 80.0% 79.9% -7.9% -3.5% -3.4%

Benchmarking learning - Teaching (sorted by primary ranking group)
All materials strictly copyright © i-graduate 2016 44
Uppsala Uni ISB %Sweden ISB
%
Europe ISB
%ISB Sweden ISB Europe ISB
LEARNING AVERAGE 85.4% 84.9% 85.1% 83.7% 84 6 16
LEARNING OVERALL 85.8% 86.5% 84.6% 85.1% 81 6 23
TEACHING
Good teachers 87.8% 88.4% 84.6% 87.2% 95 3 26
Quality lectures 86.5% 88.8% 85.4% 88.3% 79 3 22
Research 88.8% 87.2% 86.6% 85.2% 37 4 13
Academics' English 95.1% 92.1% 94.3% 92.3% 15 6 8
Expert lecturers 93.7% 92.9% 92.0% 92.7% 52 6 19
Assessment 89.3% 88.2% 89.1% 85.7% 66 6 9
Learning support 88.2% 89.1% 89.6% 86.7% 65 6 12
Course organisation 82.2% 84.0% 80.6% 79.4% 99 6 23
Course content 84.4% 88.6% 85.3% 86.7% 129 7 39
Marking criteria 79.1% 83.2% 80.6% 78.0% 132 10 25
Performance feedback 76.5% 84.3% 80.0% 79.9% 151 10 40
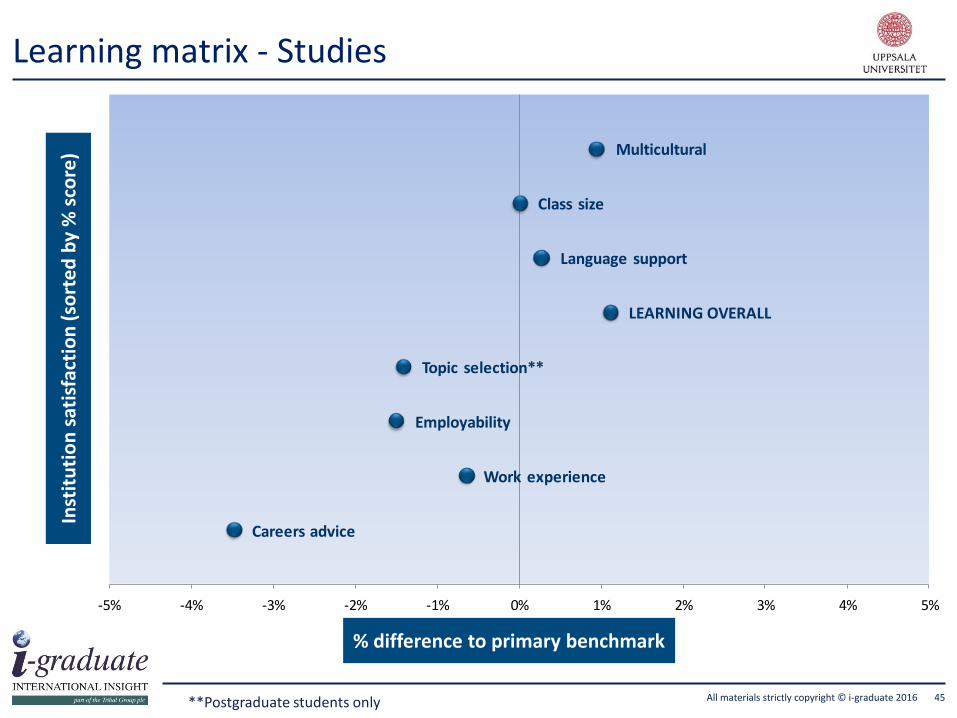
Multicultural
Class size
Language support
LEARNING OVERALL
Topic selection**
Employability
Work experience
Careers advice
-5% -4% -3% -2% -1% 0% 1% 2% 3% 4% 5%
Learning matrix - Studies
All materials strictly copyright © i-graduate 2016
Inst
itu
tio
n s
atis
fact
ion
(so
rte
d b
y %
sco
re)
**Postgraduate students only 45
% difference to primary benchmark

Benchmarking learning - Studies
All materials strictly copyright © i-graduate 2016**Postgraduate students only 46
Uppsala Uni ISB %Sweden ISB
%
Europe ISB
%ISB +/-
Sweden ISB
+/-
Europe ISB
+/-
LEARNING AVERAGE 85.4% 84.9% 85.1% 83.7% 0.4% 0.2% 1.6%
LEARNING OVERALL 85.8% 86.5% 84.6% 85.1% -0.7% 1.1% 0.7%
STUDIES
Multicultural 94.3% 90.4% 93.4% 90.4% 3.9% 0.9% 3.9%
Class size 94.1% 89.4% 94.1% 89.2% 4.7% 0.0% 4.9%
Language support 92.5% 88.4% 92.2% 86.5% 4.0% 0.3% 6.0%
Topic selection** 83.5% 86.7% 84.9% 83.1% -3.3% -1.4% 0.4%
Employability 69.7% 77.8% 71.2% 70.9% -8.1% -1.5% -1.2%
Work experience 57.3% 70.2% 57.9% 63.6% -12.9% -0.6% -6.3%
Careers advice 57.1% 71.1% 60.6% 61.9% -14.0% -3.5% -4.8%

Benchmarking learning - Studies (sorted by primary ranking group)
All materials strictly copyright © i-graduate 2016**Postgraduate students only 47
Uppsala Uni ISB %Sweden ISB
%
Europe ISB
%ISB Sweden ISB Europe ISB
LEARNING AVERAGE 85.4% 84.9% 85.1% 83.7% 84 6 16
LEARNING OVERALL 85.8% 86.5% 84.6% 85.1% 81 6 23
STUDIES
Work experience 57.3% 70.2% 57.9% 63.6%158 6 46
Multicultural 94.3% 90.4% 93.4% 90.4%12 7 10
Class size 94.1% 89.4% 94.1% 89.2%10 7 8
Topic selection** 83.5% 86.7% 84.9% 83.1%135 8 38
Careers advice 57.1% 71.1% 60.6% 61.9%161 8 44
Language support 92.5% 88.4% 92.2% 86.5%40 9 19
Employability 69.7% 77.8% 71.2% 70.9%155 9 40

Learning spaces
Online library
Laboratories
Virtual learning
Physical library
Technology
LEARNING OVERALL
-5% -4% -3% -2% -1% 0% 1% 2% 3% 4% 5%
Learning matrix - Facilities
All materials strictly copyright © i-graduate 2016
Inst
itu
tio
n s
atis
fact
ion
(so
rte
d b
y %
sco
re)
48
% difference to primary benchmark

Benchmarking learning - Facilities
All materials strictly copyright © i-graduate 2016 49
Uppsala Uni ISB %Sweden ISB
%
Europe ISB
%ISB +/-
Sweden ISB
+/-
Europe ISB
+/-
LEARNING AVERAGE 85.4% 84.9% 85.1% 83.7% 0.4% 0.2% 1.6%
LEARNING OVERALL 85.8% 86.5% 84.6% 85.1% -0.7% 1.1% 0.7%
FACILITIES
Learning spaces 93.5% 89.9% 93.5% 89.5% 3.6% 0.0% 4.1%
Online library 93.1% 90.1% 93.1% 88.5% 3.1% 0.1% 4.6%
Laboratories 92.2% 90.9% 92.6% 91.8% 1.3% -0.5% 0.4%
Virtual learning 91.4% 90.4% 91.2% 88.1% 1.0% 0.2% 3.3%
Physical library 89.5% 89.3% 91.1% 88.6% 0.2% -1.6% 0.8%
Technology 88.7% 89.8% 92.6% 89.3% -1.1% -3.9% -0.5%

Benchmarking learning - Facilities (sorted by primary ranking group)
All materials strictly copyright © i-graduate 2016 50
Uppsala Uni ISB %Sweden ISB
%
Europe ISB
%ISB Sweden ISB Europe ISB
LEARNING AVERAGE 85.4% 84.9% 85.1% 83.7% 84 6 16
LEARNING OVERALL 85.8% 86.5% 84.6% 85.1% 81 6 23
FACILITIES
Online library 93.1% 90.1% 93.1% 88.5%23 6 10
Learning spaces 93.5% 89.9% 93.5% 89.5%23 7 15
Virtual learning 91.4% 90.4% 91.2% 88.1%84 8 20
Laboratories 92.2% 90.9% 92.6% 91.8%67 10 37
Physical library 89.5% 89.3% 91.1% 88.6%90 10 32
Technology 88.7% 89.8% 92.6% 89.3%120 12 38

50%
60%
70%
80%
90%
100%MA (506) BA (220)
Learning satisfaction by study level
All materials strictly copyright © i-graduate 2016**Postgraduate students only 51

50%
60%
70%
80%
90%
100%MA (506) BA (220)
Learning satisfaction by study level
All materials strictly copyright © i-graduate 2016**Postgraduate students only 52

-8% -6% -4% -2% 0% 2% 4% 6% 8%
Employability
Careers advice
Work experience
Topic selection**
Course organisation
Good teachers
Research
Class size
Assessment
Marking criteria
Laboratories
Quality lectures
Learning support
Expert lecturers
Performance feedback
Technology
Physical library
Learning Overall
Multicultural
Virtual learning
Academics' English
Online library
Learning spaces
Course content
Language support
Uppsala Uni
Sweden ISB fixed
Worse in 2016 Better in 2016
*2016 vs 2013
The Fixed Benchmark only includes institutions that took part in both years
Learning satisfaction (year on year*)
All materials strictly copyright © i-graduate 2016**Postgraduate students only 53

Learning Element Uppsala Uni Degree seeking Student Exchange
Learning Overall (737) 86% 86% 86%
Academics' English 95% 94% 96%
Marking criteria 79% 78% 80%
Assessment 89% 89% 89%
Careers advice 57% 52% 63%
Course content 84% 86% 83%
Class size 94% 92% 97%
Expert lecturers 94% 93% 94%
Employability 70% 68% 71%
Good teachers 88% 89% 87%
Topic selection** 83% 81% 88%
Online library 93% 93% 93%
Physical library 89% 89% 91%
Learning support 88% 86% 90%
Learning spaces 94% 91% 96%
Laboratories 92% 90% 95%
Language support 92% 90% 95%
Multicultural 94% 93% 96%
Course organisation 82% 80% 84%
Performance feedback 76% 78% 74%
Quality lectures 87% 88% 85%
Research 89% 89% 89%
Technology 89% 88% 89%
Virtual learning 91% 90% 93%
Work experience 57% 55% 61%
Learning – degree-seeking vs. exchange students
All materials strictly copyright © i-graduate 2016 54

All materials strictly copyright © i-graduate 2016 55

2% 2% 2% 3% 2% 3%
24% 23% 20% 19%28% 24%
39% 40%42% 40%
39%41%
35% 35% 36% 38%31% 32%
0%
10%
20%
30%
40%
50%
60%
70%
80%
90%
100%
Uppsala Uni (673) Sweden ISB (6186) Uppsala Uni (672) Sweden ISB (6194) Uppsala Uni (671) Sweden ISB (6176)
Analyse ideas or concepts in greaterdepth
Do your best work Use information, ideas or conceptsfrom different topics to solve problems
Never Sometimes Often Very oftenThinking back over this academic year, to what extent has your course challenged you to:
Student engagement - Challenges
All materials strictly copyright © i-graduate 2016 56
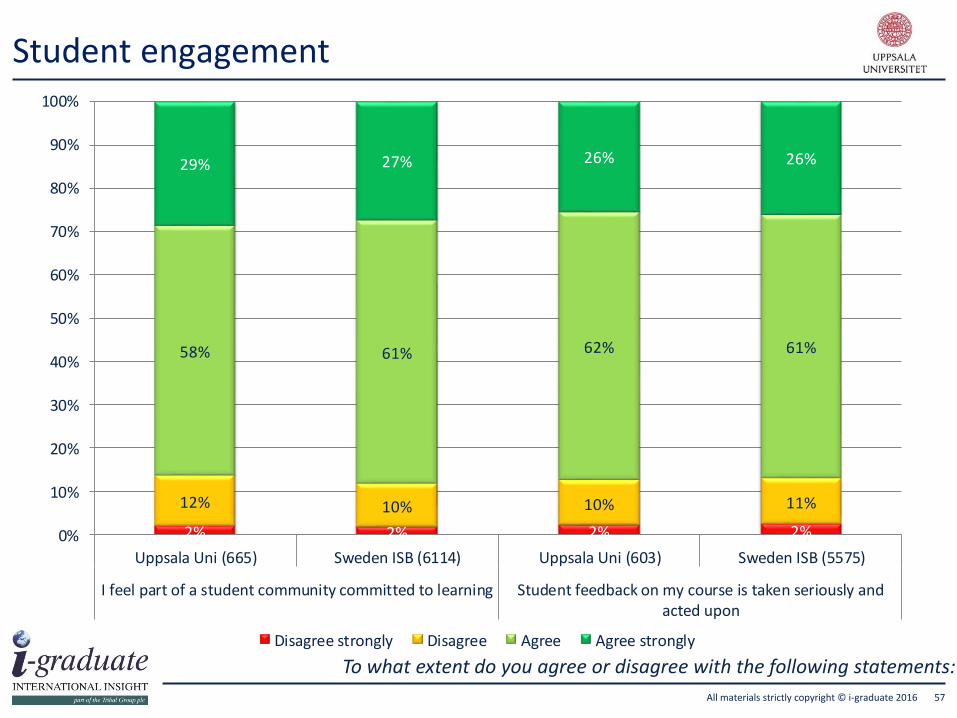
2% 2% 2% 2%
12% 10% 10% 11%
58% 61% 62% 61%
29% 27% 26% 26%
0%
10%
20%
30%
40%
50%
60%
70%
80%
90%
100%
Uppsala Uni (665) Sweden ISB (6114) Uppsala Uni (603) Sweden ISB (5575)
I feel part of a student community committed to learning Student feedback on my course is taken seriously andacted upon
Disagree strongly Disagree Agree Agree strongly
To what extent do you agree or disagree with the following statements:
Student engagement
All materials strictly copyright © i-graduate 2016 57

All materials strictly copyright © i-graduate 2016 58

4%
3%
10%
10%
59%
63%
28%
24%
0% 10% 20% 30% 40% 50% 60% 70% 80% 90% 100%
Sweden ISB (6382)
Uppsala Uni (688)
Very dissatisfied Dissatisfied Satisfied Very satisfied
Overall, how satisfied are you with the living experience at this stage in the year?
Overall satisfaction - Living
All materials strictly copyright © i-graduate 2016 59
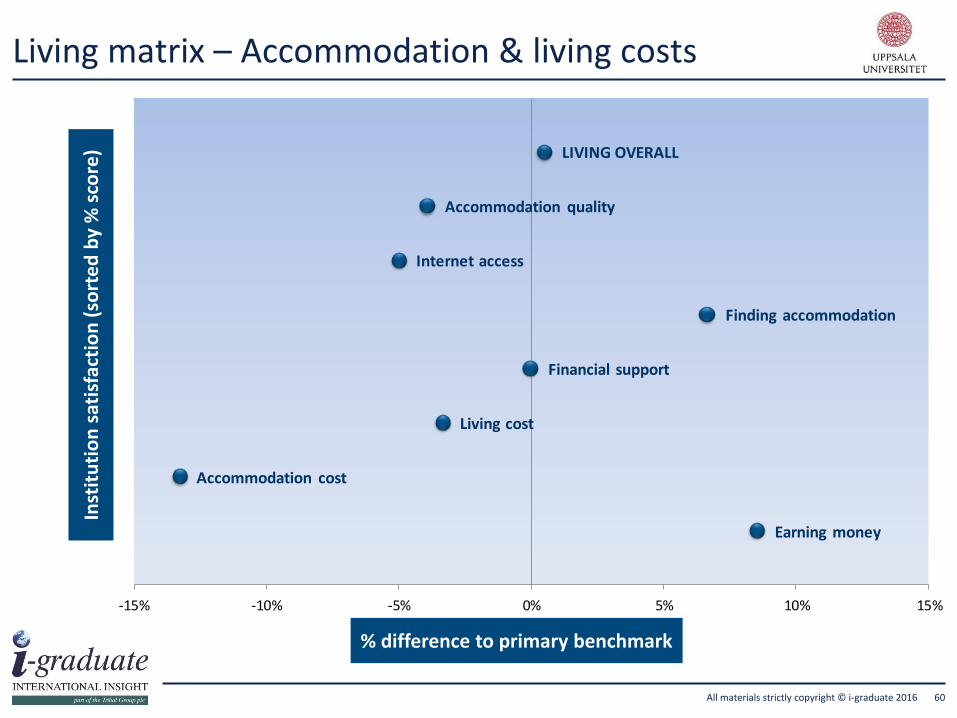
LIVING OVERALL
Accommodation quality
Internet access
Finding accommodation
Financial support
Living cost
Accommodation cost
Earning money
-15% -10% -5% 0% 5% 10% 15%
Living matrix – Accommodation & living costs
All materials strictly copyright © i-graduate 2016
Inst
itu
tio
n s
atis
fact
ion
(so
rte
d b
y %
sco
re)
60
% difference to primary benchmark

Benchmarking living – Accommodation & living costs
All materials strictly copyright © i-graduate 2016 61
Uppsala Uni ISB %Sweden ISB
%
Europe ISB
%ISB +/-
Sweden ISB
+/-
Europe ISB
+/-
LIVING AVERAGE 77.5% 79.9% 78.4% 78.5% -2.3% -0.8% -0.9%
LIVING OVERALL 86.9% 86.8% 86.4% 84.4% 0.2% 0.5% 2.5%
ACCOMMODATION and LIVING COSTS
Accommodation quality 81.2% 84.7% 85.1% 83.7% -3.6% -3.9% -2.5%
Internet access 75.8% 80.3% 80.8% 78.3% -4.5% -5.0% -2.4%
Finding accommodation 68.1% 60.9% 61.5% 60.9% 7.2% 6.6% 7.2%
Financial support 49.2% 55.4% 49.2% 48.5% -6.2% -0.1% 0.7%
Living cost 47.9% 70.9% 51.2% 72.2% -23.0% -3.3% -24.4%
Accommodation cost 47.6% 63.3% 60.9% 64.7% -15.7% -13.3% -17.1%
Earning money 35.5% 53.5% 27.0% 45.3% -18.0% 8.5% -9.8%

Benchmarking living – Accommodation & living costs (sorted by primary ranking group)
All materials strictly copyright © i-graduate 2016 62
Uppsala Uni ISB %Sweden ISB
%
Europe ISB
%ISB Sweden ISB Europe ISB
LIVING AVERAGE 77.5% 79.9% 78.4% 78.5% 93 9 33
LIVING OVERALL 86.9% 86.8% 86.4% 84.4% 49 7 13
ACCOMMODATION and LIVING COSTS
Earning money 35.5% 53.5% 27.0% 45.3% 158 4 48
Finding accommodation 68.1% 60.9% 61.5% 60.9% 18 5 18
Financial support 49.2% 55.4% 49.2% 48.5% 142 7 35
Internet access 75.8% 80.3% 80.8% 78.3% 129 10 45
Living cost 47.9% 70.9% 51.2% 72.2% 178 10 62
Accommodation quality 81.2% 84.7% 85.1% 83.7% 130 12 51
Accommodation cost 47.6% 63.3% 60.9% 64.7% 168 12 57

Other friends
LIVING OVERALL
Host culture
Home friends
Social activities
Good contacts
Social facilities
Sport facilities
Host friends
-7% -5% -3% -1% 1% 3% 5% 7%
Living matrix - Social
All materials strictly copyright © i-graduate 2016
Inst
itu
tio
n s
atis
fact
ion
(so
rte
d b
y %
sco
re)
63
% difference to primary benchmark

Benchmarking living – Social
All materials strictly copyright © i-graduate 2016 64
Uppsala Uni ISB %Sweden ISB
%
Europe ISB
%ISB +/-
Sweden ISB
+/-
Europe ISB
+/-
LIVING AVERAGE 77.5% 79.9% 78.4% 78.5% -2.3% -0.8% -0.9%
LIVING OVERALL 86.9% 86.8% 86.4% 84.4% 0.2% 0.5% 2.5%
SOCIAL
Other friends 92.7% 87.7% 92.7% 89.3% 4.9% -0.1% 3.4%
Host culture 86.0% 85.8% 84.8% 85.7% 0.2% 1.2% 0.3%
Home friends 85.7% 85.3% 87.1% 85.2% 0.4% -1.3% 0.5%
Social activities 83.4% 83.1% 85.2% 82.4% 0.3% -1.7% 1.0%
Good contacts 78.5% 78.5% 80.5% 76.1% 0.0% -2.0% 2.4%
Social facilities 76.3% 81.9% 81.5% 78.4% -5.6% -5.2% -2.1%
Sport facilities 73.5% 80.7% 76.0% 79.1% -7.3% -2.5% -5.6%
Host friends 63.1% 73.2% 63.1% 67.4% -10.0% 0.1% -4.3%

Benchmarking living – Social (sorted by primary ranking group)
All materials strictly copyright © i-graduate 2016 65
Uppsala Uni ISB %Sweden ISB
%
Europe ISB
%ISB Sweden ISB Europe ISB
LIVING AVERAGE 77.5% 79.9% 78.4% 78.5% 93 9 33
LIVING OVERALL 86.9% 86.8% 86.4% 84.4% 49 7 13
SOCIAL
Host culture 86.0% 85.8% 84.8% 85.7% 59 3 28
Other friends 92.7% 87.7% 92.7% 89.3% 11 5 8
Good contacts 78.5% 78.5% 80.5% 76.1% 55 7 18
Host friends 63.1% 73.2% 63.1% 67.4% 165 7 54
Home friends 85.7% 85.3% 87.1% 85.2% 75 8 33
Sport facilities 73.5% 80.7% 76.0% 79.1% 143 9 51
Social activities 83.4% 83.1% 85.2% 82.4% 77 10 35
Social facilities 76.3% 81.9% 81.5% 78.4% 132 10 37

Campus environment
Safety
Good place to be
Campus buildings
Eco-friendly attitude
Transport links
Transport links uni
LIVING OVERALL
Worship facilities
Visa advice
-3% -2% -1% 0% 1% 2% 3%
Living matrix – Day to day life
All materials strictly copyright © i-graduate 2016
Inst
itu
tio
n s
atis
fact
ion
(so
rte
d b
y %
sco
re)
66
% difference to primary benchmark

Benchmarking living – Day to day life
All materials strictly copyright © i-graduate 2016 67
Uppsala Uni ISB %Sweden ISB
%
Europe ISB
%ISB +/-
Sweden ISB
+/-
Europe ISB
+/-
LIVING AVERAGE 77.5% 79.9% 78.4% 78.5% -2.3% -0.8% -0.9%
LIVING OVERALL 86.9% 86.8% 86.4% 84.4% 0.2% 0.5% 2.5%
DAY TO DAY LIFE
Campus environment 98.3% 91.8% 96.8% 92.3% 6.5% 1.6% 6.0%
Safety 96.8% 92.5% 95.9% 92.6% 4.4% 1.0% 4.2%
Good place to be 96.8% 91.5% 96.0% 92.5% 5.4% 0.8% 4.3%
Campus buildings 93.7% 88.5% 94.2% 86.8% 5.2% -0.5% 6.9%
Eco-friendly attitude 93.2% 90.3% 92.7% 90.2% 3.0% 0.6% 3.1%
Transport links 89.1% 83.1% 88.7% 84.0% 6.0% 0.4% 5.1%
Transport links uni 87.6% 84.6% 89.4% 84.7% 3.1% -1.7% 2.9%
Worship facilities 84.6% 85.4% 84.7% 81.8% -0.8% -0.2% 2.8%
Visa advice 76.3% 81.3% 76.3% 77.1% -5.0% 0.0% -0.8%

Benchmarking living – Day to day life (sorted by primary ranking group)
All materials strictly copyright © i-graduate 2016 68
Uppsala Uni ISB %Sweden ISB
%
Europe ISB
%ISB Sweden ISB Europe ISB
LIVING AVERAGE 77.5% 79.9% 78.4% 78.5% 93 9 33
LIVING OVERALL 86.9% 86.8% 86.4% 84.4% 49 7 13
DAY TO DAY LIFE
Good place to be 96.8% 91.5% 96.0% 92.5% 4 3 3
Campus environment 98.3% 91.8% 96.8% 92.3% 8 5 7
Worship facilities 84.6% 85.4% 84.7% 81.8% 60 5 14
Safety 96.8% 92.5% 95.9% 92.6% 11 6 10
Campus buildings 93.7% 88.5% 94.2% 86.8% 17 8 10
Eco-friendly attitude 93.2% 90.3% 92.7% 90.2% 19 8 12
Transport links 89.1% 83.1% 88.7% 84.0% 46 8 30
Visa advice 76.3% 81.3% 76.3% 77.1% 126 8 39
Transport links uni 87.6% 84.6% 89.4% 84.7% 64 9 34

-14% -12% -10% -8% -6% -4% -2% 0% 2% 4% 6% 8% 10% 12% 14%
Financial support
Living cost
Earning money
Internet access
Sport facilities
Accommodation cost
Transport links
Living Overall
Campus environment
Social activities
Safety
Transport links uni
Good place to be
Eco-friendly attitude
Campus buildings
Accommodation quality
Good contacts
Other friends
Worship facilities
Visa advice
Host culture
Social facilities
Home friends
Host friends
Uppsala Uni
Sweden ISB fixed
Worse in 2016 Better in 2016
*2016 vs 2013
The Fixed Benchmark only includes institutions that took part in both years
Living satisfaction (year on year*)
All materials strictly copyright © i-graduate 2016 69

Living Element Uppsala Uni Degree seeking Student Exchange
Living Overall (688) 87% 86% 88%
Accommodation quality 81% 81% 81%
Accommodation cost 48% 47% 49%
Eco-friendly attitude 93% 94% 92%
Earning money 36% 33% 40%
Finding accommodation 68% 53% 84%
Financial support 49% 41% 58%
Good contacts 79% 77% 80%
Good place to be 97% 97% 97%
Host culture 86% 88% 84%
Host friends 63% 69% 57%
Internet access 76% 78% 74%
Living cost 48% 52% 44%
Other friends 93% 93% 92%
Campus buildings 94% 92% 96%
Campus environment 98% 98% 98%
Social activities 83% 80% 86%
Safety 97% 96% 98%
Home friends 86% 82% 90%
Social facilities 76% 78% 74%
Sport facilities 73% 72% 75%
Transport links 89% 89% 89%
Transport links uni 88% 89% 86%
Visa advice 76% 75% 79%
Worship facilities 85% 86% 84%
Living – degree-seeking vs. exchange students
All materials strictly copyright © i-graduate 2016 70

All materials strictly copyright © i-graduate 2016 71

3%
3%
7%
6%
75%
75%
15%
16%
0% 10% 20% 30% 40% 50% 60% 70% 80% 90% 100%
Sweden ISB (5957)
Uppsala Uni (641)
Very dissatisfied Dissatisfied Satisfied Very satisfied
Overall, how satisfied are you with the support services at this stage in the year?
Overall satisfaction - Support
All materials strictly copyright © i-graduate 2016 72

2%
2%
4%
5%
7%
8%
8%
9%
11%
13%
30%
34%
35%
37%
41%
42%
61%
17%
16%
31%
22%
17%
22%
40%
54%
39%
12%
30%
32%
45%
25%
29%
32%
24%
29%
10%
46%
44%
40%
39%
33%
26%
36%
18%
27%
23%
12%
18%
19%
18%
9%
52%
72%
19%
28%
36%
31%
19%
11%
15%
57%
14%
11%
9%
20%
12%
8%
6%
0% 20% 40% 60% 80% 100%
Faith Provision
Disability Support
Careers Service
Residential Assistants
Personal Tutors
Graduate School**
Counselling
Health Centre
Student Advisory
Fees Department
IT Support
Int'l Office (Faculty)
Students' Union
Accommodation Office
Clubs/Societies
Int'l Office (Central)
Catering
Use Aware, Not Used May Be Relevant, Unsure How To Access Not Relevant
Support usage
All materials strictly copyright © i-graduate 2016 73**Postgraduate students only

Graduate School**
Int'l Office (Central)
Int'l Office (Faculty)
Clubs/Societies
IT Support
Health Centre
Personal Tutors
Students' Union
Residential Assistants
SUPPORT OVERALL
Counselling
Student Advisory
Fees Department
Catering
Accommodation Office
-12% -7% -2% 3% 8%
Support matrix
All materials strictly copyright © i-graduate 2016
Inst
itu
tio
n s
atis
fact
ion
(so
rte
d b
y %
sco
re)
74**Postgraduate students only
% difference to primary benchmark

Benchmarking support
All materials strictly copyright © i-graduate 2016 75**Postgraduate students only
Uppsala Uni ISB %Sweden ISB
%
Europe ISB
%ISB +/-
Sweden ISB
+/-
Europe ISB
+/-
SUPPORT AVERAGE 90.8% 90.9% 92.0% 90.1% -0.1% -1.3% 0.7%
SUPPORT OVERALL 90.8% 88.4% 90.6% 87.2% 2.4% 0.2% 3.6%
Graduate School** 97.2% 94.2% 96.1% 93.7% 3.0% 1.2% 3.5%
Int'l Office (Central) 96.6% 92.6% 94.7% 92.9% 4.0% 2.0% 3.7%
Int'l Office (Faculty) 95.8% 93.4% 95.1% 93.4% 2.4% 0.7% 2.4%
Clubs/Societies 95.4% 92.8% 95.7% 92.7% 2.7% -0.2% 2.7%
IT Support 93.8% 93.7% 93.6% 93.8% 0.1% 0.2% 0.0%
Health Centre 92.9% 89.7% 88.4% 87.8% 3.2% 4.4% 5.0%
Personal Tutors 92.5% 93.5% 95.0% 91.7% -1.0% -2.5% 0.8%
Students' Union 92.4% 93.1% 92.8% 92.6% -0.7% -0.4% -0.2%
Residential Assistants 90.9% 90.2% 92.1% 86.5% 0.7% -1.2% 4.4%
Counselling 90.6% 89.2% 87.9% 87.7% 1.4% 2.7% 2.9%
Student Advisory 90.0% 92.3% 94.5% 91.1% -2.3% -4.5% -1.1%
Fees Department 87.8% 89.6% 93.2% 90.5% -1.8% -5.3% -2.7%
Catering 83.1% 83.5% 83.4% 84.0% -0.4% -0.4% -0.9%
Accommodation Office 71.5% 83.2% 81.7% 78.0% -11.6% -10.2% -6.5%

Benchmarking support (sorted by primary ranking group)
All materials strictly copyright © i-graduate 2016 76**Postgraduate students only
Uppsala Uni ISB %Sweden ISB
%
Europe ISB
%ISB Sweden ISB Europe ISB
SUPPORT AVERAGE 90.8% 90.9% 92.0% 90.1% 123 11 44
SUPPORT OVERALL 90.8% 88.4% 90.6% 87.2% 51 7 14
Counselling 90.6% 89.2% 87.9% 87.7% 25 1 5
Int'l Office (Central) 96.6% 92.6% 94.7% 92.9% 57 4 32
Residential Assistants 90.9% 90.2% 92.1% 86.5% 67 4 7
Graduate School** 97.2% 94.2% 96.1% 93.7% 87 5 27
Int'l Office (Faculty) 95.8% 93.4% 95.1% 93.4% 13 5 13
Clubs/Societies 95.4% 92.8% 95.7% 92.7% 54 6 25
Student Advisory 90.0% 92.3% 94.5% 91.1% 109 6 39
Health Centre 92.9% 89.7% 88.4% 87.8% 91 8 21
Catering 83.1% 83.5% 83.4% 84.0% 103 8 43
IT Support 93.8% 93.7% 93.6% 93.8% 107 9 41
Fees Department 87.8% 89.6% 93.2% 90.5% 122 9 32
Accommodation Office 71.5% 83.2% 81.7% 78.0% 138 10 45
Students' Union 92.4% 93.1% 92.8% 92.6% 136 11 46
Personal Tutors 92.5% 93.5% 95.0% 91.7% 60 11

-12% -10% -8% -6% -4% -2% 0% 2% 4% 6% 8% 10% 12%
Counselling
Residential Assistants
Health Centre
Support Overall
Catering
Graduate School**
IT Support
Int'l Office (Central)
Int'l Office (Faculty)
Clubs/Societies
Students' Union
Student Advisory
Fees Department
Accommodation Office
Uppsala Uni
Sweden ISB fixed
Worse in 2016 Better in 2016
*2016 vs 2013
The Fixed Benchmark only includes institutions that took part in both years
Support satisfaction (year on year*)
All materials strictly copyright © i-graduate 2016 77**Postgraduate students only

Support Element Uppsala Uni Degree seeking Student Exchange
Support Overall (641) 91% 90% 93%
Accommodation Office 72% 66% 75%
Catering 83% 80% 86%
Counselling 91% 89% NA
Fees Department 88% 86% 89%
Graduate School** 97% 97% NA
Health Centre 93% NA NA
Residential Assistants 91% NA NA
Int'l Office (Central) 97% 96% 97%
Int'l Office (Faculty) 96% 97% 95%
IT Support 94% 93% 95%
Personal Tutors 93% NA NA
Student Advisory 90% 89% 90%
Students' Union 92% 93% 91%
Clubs/Societies 95% 95% 96%
Support – degree-seeking vs. exchange students
All materials strictly copyright © i-graduate 2016 78

All materials strictly copyright © i-graduate 2016 79

Deliverables
Verbatim comments
Institution-specific data Detailed presentations Summary findings
“Great university, great teachers, great accommodation, so many way to make English and foreign friends, a very beautiful place, ecologic.
It's the best year of my life, i think I'm very lucky to study here and i will advice this university at everyone without any doubt!”
All materials strictly copyright © i-graduate 2016 80

Benchmarking Range
Student satisfaction data against
national and international benchmarks
Internal analysis of student satisfaction
data
Breakdowns Temperatures
Analysis by department/faculty Degrees of satisfaction
Wave on wave
View results compared to previous
waves
Open comments
analysis
Improved navigation
Global Views – An interactive online map, showing student
mobility in your country
Next generation tools – interact 2.2
All materials strictly copyright © i-graduate 2016 81

All materials strictly copyright © i-graduate 2016
“We are using the i-mark on our admission webpages to show potential students that we use the ISB for program quality management and service development.”
ISB University Partner
Available to HE institutions worldwide taking part in the ISB or SB
Instant and easy recognition of an institution’s dedication to the student experience
Use on website and promotional literature
82
Introducing the i-mark
All materials strictly copyright © i-graduate 2016

All materials strictly copyright © i-graduate 2016 83
About i-graduate
All materials strictly copyright © i-graduate 2016

All materials strictly copyright © i-graduate 2016
A member of the i-graduate Research Team will be in contact with details of your institution’s online password-protected Filestore (www.i-graduate.org/filestore)
Filestore contains: full PDF presentation, open comments spreadsheet, institution breakdown sheet and ranking sheets
Thank you
84All materials strictly copyright © i-graduate 2016

All materials strictly copyright © i-graduate 2016 85

Not a full list of questions
Living Experience• Overall Satisfaction• Satisfaction of living elements
Support Experience• Overall Satisfaction• Relevance of services• Satisfaction with services used
Recommendation & Reflections• Recommendation to others
Future Plans• Employment• Study
Background• Nationality• Accommodation• Funding• Level of study• Area of study• School/Faculty/Department• Year of study
Arrival Experience• Overall Satisfaction• Rating on experience
Learning Experience• Overall Satisfaction• Satisfaction of learning elements• Engagement measures
Pre-Arrival• Choice of destination• Key influences• Application process• Visa Satisfaction• Agents
Questionnaire flow
All materials strictly copyright © i-graduate 2016 86

Arrival terminology
All materials strictly copyright © i-graduate 2016 87
Terminology in Standard Questionnaire
Terminology in University Questionnaire Terminology in Report
Study sense Understanding how my course of study would work Study sense
Registration Enrolment/Academic registration RegistrationMeeting staff Meeting academic staff Meeting staff
Other friends Making friends from other countries Other friendsInternet access Internet access at my accommodation Internet access
Local orientation Introduction to the local area Local orientationHost friends Making friends from this country Host friends
Institution orientationUniversity/institution orientation (Introduction
Days) Introduction DaysFormal welcome Formal welcome at the institution Formal welcome
Accommodation condition Condition of accommodation on arrival Accommodation conditionFirst night First night - getting to where I would stay First night
Social activities The social activities (organised events) Social activitiesHome friends Making friends from my home country Home friends
Bank account Setting up a bank account Bank accountWelcome Welcome/pickup at airport, railway, coach station Welcome
Accommodation Office Accommodation Office Accommodation OfficeFinance Office Institution accounts/finance department Finance Office

Terminology in Questionnaire Terminology in Report
The quality of lectures (UG, PGT, FC, non-degree & other students only) Quality lectures
The subject area expertise of lecturers/supervisors Expert lecturers
The teaching ability of lecturers/supervisors Good teachers
The academic content of my course/studies Course content
The organisation and smooth running of the course (UG, PGT, FC, non-degree & other students only)
Course organisation
The level of research activity Research
Academic staff whose English I can understand Academics' English
Getting time from academic staff when I need it/personal support with learning Learning support
Feedback on coursework/formal written submissions Performance feedback
Explanation of marking/assessment criteria Marking criteria
Fair and transparent assessment of my work Assessment
Learning terminology - Teaching
All materials strictly copyright © i-graduate 2016 88

Terminology in Questionnaire Terminology in Report
Guidance in topic selection and refinement by my supervisor (PGT & PGR students only) Topic selection
Confidence about managing a research project as a result of my experience so far (PGR students only)
Managing research
Advice and guidance on long-term job opportunities and careers from academic staff Careers advice
Learning that will help me get a good job Employability
Opportunities for work experience/ work placements as a part of my studies Work experience
Studying with people from other cultures Multicultural
Help to improve my English language skills (if applicable) Language support
Opportunities to teach (PGR students only) Opportunities to teach
The size of classes (UG, PGT, FC, non-degree & other students only) Class size
Learning terminology - Studies
All materials strictly copyright © i-graduate 2016 89

Terminology in Questionnaire Terminology in Report
The quality of the lecture theatres and classrooms Learning spaces
The quality of laboratories (if applicable) Laboratories
The physical library facilities Physical library
The online library facilities Online library
The learning technology (PCs, networking, etc) Technology
Virtual learning environment (Blackboard/ WebCT/ Weblearn) Virtual learning
Learning terminology - Facilities
All materials strictly copyright © i-graduate 2016 90

Terminology in Questionnaire Terminology in Report
The quality of accommodation (excludes ‘living at home’/’living with friends or relatives’)
Accommodation quality
The cost of accommodation (excludes ‘living at home’/’living with friends or relatives’)
Accommodation cost
The cost of living Living cost
The opportunity to earn money while studying Earning money
The availability of financial support/ bursaries etc. Financial support
Internet access at my accommodation Internet access
Living terminology – Accommodation & Living Costs
All materials strictly copyright © i-graduate 2016 91
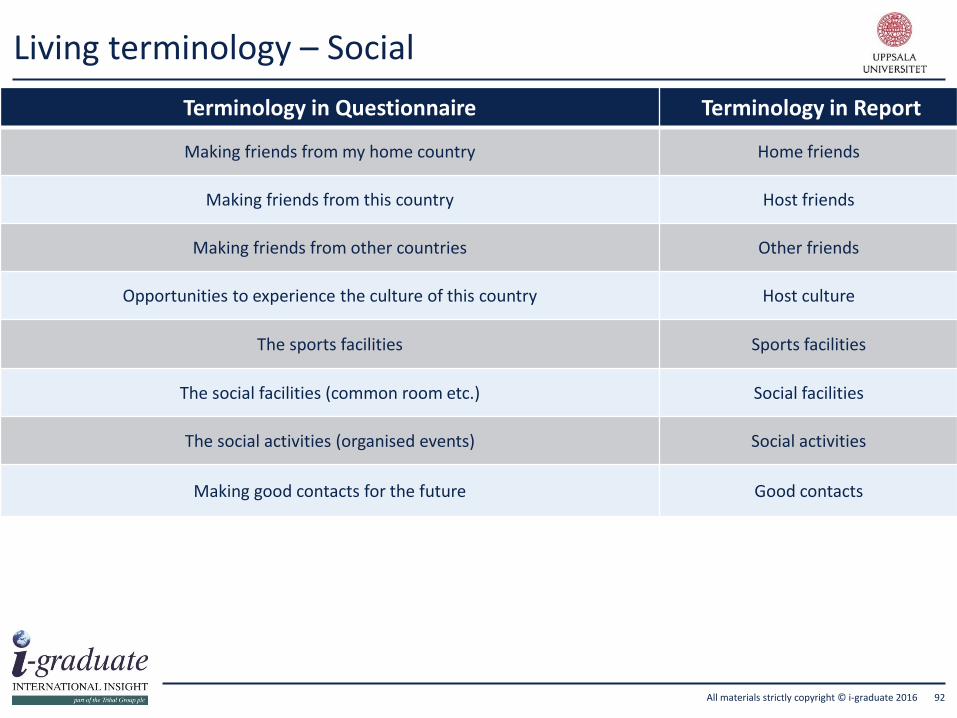
Terminology in Questionnaire Terminology in Report
Making friends from my home country Home friends
Making friends from this country Host friends
Making friends from other countries Other friends
Opportunities to experience the culture of this country Host culture
The sports facilities Sports facilities
The social facilities (common room etc.) Social facilities
The social activities (organised events) Social activities
Making good contacts for the future Good contacts
Living terminology – Social
All materials strictly copyright © i-graduate 2016 92

Terminology in Questionnaire Terminology in Report
Feeling safe and secure Safety
The surroundings outside the institution Good place to be
Transport between institution locations Transport links uni
The transport links to other places Transport links (other places)
The facilities for religious worship (quiet room/prayer room, etc.) Worship facilities
Immigration and visa advice from the institution Visa advice
The institution’s eco-friendly attitude to the environment (e.g. recycling/energy etc.) Eco-friendly attitude
The design and quality of the campus buildings (what they look like, internal quality, functionality and beauty)
Campus buildings
The quality of the external campus environment (landscaping, street furniture, litter, trees, bicycle parking, signposting)
Campus environment
Living terminology – Day to Day Life
All materials strictly copyright © i-graduate 2016 93

Terminology in Standard
QuestionnaireTerminology in University Questionnaire Terminology in Report
Catering Campus eating places Catering
International Office International Office Int'l Office (Central)
Clubs/Societies Institution Clubs/Societies Clubs/Societies
Accommodation Office Accommodation Office Accommodation Office
Students' Union Students’ Union Students' Union
Int'l Office (Faculty) International Office (Faculty level) Int'l Office (Faculty)
IT Support IT and system support IT Support
Finance Office Department where you pay your fees Fees Department
Student Advisory Student Advisory Service Student Advisory
Health Centre Health Centre Health Centre
Counselling Counselling Service Counselling
Personal Tutors Personal Tutors Personal Tutors
Graduate School** Graduate School** Graduate School**
Residential Assistants Residential Assistants Residential Assistants
Careers Service Careers Advisory Service Careers Service
Disability Support Disability Support Disability Support
Faith Provision Chaplaincy or multi-faith provision Faith Provision
Support terminology
All materials strictly copyright © i-graduate 2016 94**Postgraduate students only

All materials strictly copyright © i-graduate 2016 95

Institution Support Base Numbers
All materials strictly copyright © i-graduate 2016 96
Element University base number
Catering 390
Int'l Office (Central) 267
Clubs/Societies 263
Accommodation Office 239
Students' Union 224
Int'l Office (Faculty) 214
IT Support 193
Fees Department 82
Student Advisory 70
Health Centre 56
Counselling 53
Personal Tutors 40
Graduate School** 36
Residential Assistants 33
Careers Service 28
Disability Support 14
Faith Provision 10

Elements 2010 2011 2013 2016First year vs
2016
Accommodation condition 40% 70% 83% 75% 35%
First night 57% 73% 84% 84% 27%
Welcome 62% 67% 79% 83% 21%
Arrival Overall 72% 83% 86% 87% 14%
Accommodation Office 61% 77% 86% 69% 8%
Social activities 76% 86% 88% 82% 6%
Introduction Days 85% 86% 92% 89% 4%
Formal welcome 84% 82% 96% 88% 4%
Finance Office 85% 97% 89% 4%
Host friends 65% 67% 79% 69% 4%
Other friends 91% 90% 96% 92% 2%
Local orientation 81% 88% 93% 83% 1%
Registration 88% 81% 90% 89% 1%
Meeting staff 89% 90% 94% 89% 0%
Study sense 83% 80% 87% 83% 0%
Internet access 81% 77% 71% 79% -2%
Home friends 90% 85% 88% 84% -6%
Bank account 68% 57% 59% 33% -34%
Arrival satisfaction – Year on year comparison
All materials strictly copyright © i-graduate 2016Arrival section asked to all 1st year students 97

Elements 2010 2011 2013 2016First year vs
2016
Work experience 49% 54% 51% 57% 8%
Employability 62% 64% 62% 70% 8%
Research 84% 86% 84% 89% 5%
Class size 90% 94% 4%
Careers advice 53% 55% 50% 57% 4%
Language support 89% 90% 94% 92% 3%
Online library 91% 93% 93% 93% 2%
Good teachers 86% 88% 83% 88% 2%
Multicultural 93% 94% 94% 94% 2%
Virtual learning 90% 90% 91% 91% 1%
Physical library 88% 91% 89% 89% 1%
Expert lecturers 93% 93% 92% 94% 1%
Academics' English 94% 96% 95% 95% 1%
Learning Overall 85% 87% 85% 86% 1%
Learning support 88% 89% 86% 88% 0%
Laboratories 92% 94% 89% 92% 0%
Assessment 89% 89% 85% 89% 0%
Course organisation 82% 84% 77% 82% 0%
Learning spaces 94% 96% 94% 94% 0%
Topic selection** 84% 85% 78% 83% 0%
Technology 90% 90% 88% 89% -1%
Course content 86% 87% 85% 84% -1%
Quality lectures 88% 88% 84% 87% -1%
Marking criteria 82% 81% 76% 79% -3%
Performance feedback 82% 82% 75% 76% -5%
Learning satisfaction – Year on year comparison
All materials strictly copyright © i-graduate 2016**Postgraduate students only 98

Elements 2010 2011 2013 2016First year vs
2016
Visa advice 64% 65% 79% 76% 12%
Earning money 24% 32% 29% 36% 11%
Transport links uni 78% 83% 89% 88% 10%
Sport facilities 65% 69% 71% 73% 8%
Living Overall 79% 84% 86% 87% 8%
Worship facilities 77% 81% 87% 85% 7%
Host culture 79% 84% 90% 86% 7%
Financial support 42% 46% 40% 49% 7%
Living cost 42% 46% 40% 48% 6%
Accommodation quality 75% 82% 83% 81% 6%
Transport links 84% 87% 88% 89% 5%
Social activities 79% 82% 84% 83% 4%
Good contacts 75% 80% 81% 79% 3%
Safety 94% 96% 98% 97% 2%
Good place to be 94% 97% 98% 97% 2%
Other friends 91% 92% 95% 93% 2%
Campus environment 98% 98% 98% 1%
Campus buildings 94% 95% 94% -1%
Eco-friendly attitude 95% 94% 94% 93% -2%
Host friends 65% 65% 72% 63% -2%
Accommodation cost 51% 53% 46% 48% -4%
Social facilities 81% 87% 80% 76% -4%
Home friends 91% 89% 90% 86% -5%
Internet access 84% 82% 72% 76% -9%
Living satisfaction – Year on year comparison
All materials strictly copyright © i-graduate 2016 99

Elements 2010 2011 2013 2016First year vs
2016
Residential Assistants 78% 82% 91% 12%
Support Overall 84% 87% 85% 91% 7%
Health Centre 87% 86% 85% 93% 6%
Counselling 86% 96% 79% 91% 5%
Int'l Office (Central) 92% 93% 94% 97% 5%
IT Support 90% 93% 91% 94% 3%
Graduate School** 94% 98% 93% 97% 3%
Student Advisory 88% 91% 92% 90% 2%
Clubs/Societies 93% 96% 94% 95% 2%
Int'l Office (Faculty) 95% 96% 1%
Catering 82% 81% 78% 83% 1%
Students' Union 92% 95% 93% 92% 1%
Fees Department 88% 92% 89% 88% 0%
Accommodation Office 74% 74% 83% 72% -3%
Support satisfaction – Year on year comparison
All materials strictly copyright © i-graduate 2016 100**Postgraduate students only

48%
45%
33%
14%
11%
7%
3%
2%
1%
41%
60%
42%
40%
12%
5%
1%
3%
0%
Own funds (e.g. savings)
Family
Scholarship, bursary or grant
Government/State funding
Loan
Employment while studying
Other
Other financial assistance
Employer
MA (435)
BA (188)
How are you funding your studies?
Funding breakdown
All materials strictly copyright © i-graduate 2016 101

4%
39%
37%
18%
2%19%
44%
22%
12%
3%
Uppsala Uni (764, inner circle) vs Sweden ISB (7087, outer circle)
€200-€299
€300-€399
€400-€499
Over €500
Other
Accommodation Cost
How much do you pay for your accommodation monthly
All materials strictly copyright © i-graduate 2016 102

37%
34%
31%
31%
29%
27%
25%
25%
23%
22%
19%
13%
11%
8%
37%
32%
34%
29%
28%
27%
33%
19%
20%
22%
20%
9%
11%
8%
0% 5% 10% 15% 20% 25% 30% 35% 40%
No suitable jobs available in my chosen career
Cost of living
Employers are not interested in foreign candidates
Family commitments in my home country
Feeling unwelcome as a foreigner
Lack of information on the job market
Language barrier
Lack of suitable Master or Doctoral courses available
Visa restrictions
Work permit restrictions
Lack of job opportunities for your partner
Lack of information regarding Master or Doctoral studies
Earning potential
Other
Uppsala Uni (597)
Sweden ISB (5568)
Reasons for leaving
What would make you LEAVE your host country after graduation?
All materials strictly copyright © i-graduate 2016 103

63%
52%
43%
48%
43%
35%
33%
16%
14%
19%
59%
52%
43%
51%
44%
39%
38%
18%
15%
19%
10% 20% 30% 40% 50% 60% 70%
Advice
Information
Support
Opps to meet employers
Training
Network with Alumni
Placement
Employment
Representation
None
Uppsala Uni (632)
Sweden ISB (5914)Rec
ruit
-m
ent
Inte
ract
ion
Ad
vice
Expectations of careers support
What employment/ careers support do you expect from the institution?
All materials strictly copyright © i-graduate 2016 104
Need to make changes?
All materials strictly copyright © i-graduate 2016 105
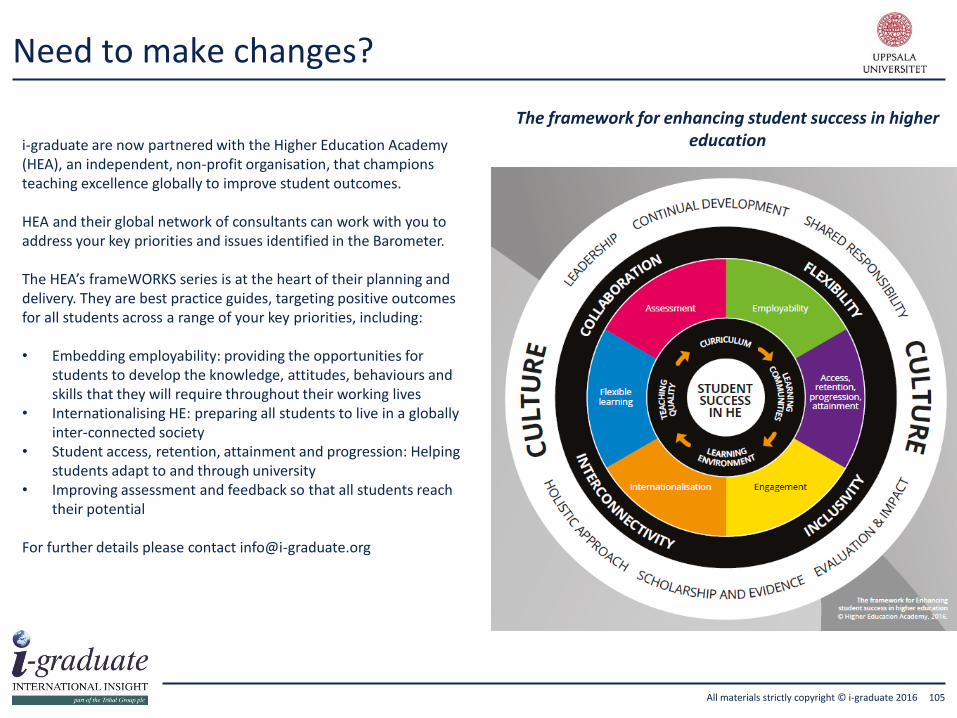
i-graduate are now partnered with the Higher Education Academy (HEA), an independent, non-profit organisation, that champions teaching excellence globally to improve student outcomes.
HEA and their global network of consultants can work with you to address your key priorities and issues identified in the Barometer.
The HEA’s frameWORKS series is at the heart of their planning and delivery. They are best practice guides, targeting positive outcomes for all students across a range of your key priorities, including:
• Embedding employability: providing the opportunities for students to develop the knowledge, attitudes, behaviours and skills that they will require throughout their working lives
• Internationalising HE: preparing all students to live in a globally inter-connected society
• Student access, retention, attainment and progression: Helping students adapt to and through university
• Improving assessment and feedback so that all students reach their potential
For further details please contact [email protected]
The framework for enhancing student success in higher education

106All materials strictly copyright © i-graduate 2016
PTES / PRES – be part of the early adopters group
Benefits of the ‘early adopters’ group
• Be seen to be leading the way in demonstrating a commitment to providing excellent post-graduate provision• 10% discount on purchase of PTES and/or PRES surveys• Free bespoke benchmarking, beyond the standard reporting package• Joint publicity and other opportunities to showcase your work at HEA/i-graduate events• A free place on the HEA Surveys Conference in May 2017. This conference brings together the UK HE sector
understand how to drive enhancement from insight from student surveys, metrics and other research
For further details please contact [email protected]

Global Education Profiler: GE-P
All materials strictly copyright © i-graduate 2016 107
Employers seek graduates who have worked in multicultural teams, across multiple languages and who can communicate effectively across cultures. Graduates need to be armed with global skills to give them the best chance in the world of work.
The GE-P deep dives key areas of student integration and global graduate skills.
Integration:
• Social integration • Academic integration
Global graduate skills:
• Communication• Foreign language learning• Global development opportunities and support
Registering for 2017. For further details, please contact [email protected]

All materials strictly copyright © i-graduate 2016
Contact details
108
For further information about the Student Barometer, please contact Nannette Ripmeester ([email protected])


