24
International Trade Issues & Texas Agriculture Parr Rosson Professor & Director Center for North American Studies Department of Agricultural Economics Texas A&M University
International Trade Issues
& Texas Agriculture
Parr Rosson
Professor & Director
Center for North American Studies
Department of Agricultural Economics
Texas A&M University
Trade Issues & Texas
Agriculture
WTO Negotiations
Complete NAFTA Implementation-
2008
Trade Agreements
Cuba Export Opportunities
Trade Disruptions

World Population
US Census Bureau
1990 2000 2001 2006 F2010 F2015 F2020 0
2
4
6
8
0
2
4
6
8
NA WE I. ASIA EE/FSU D. ASIA
ME AFR LA TOTAL
Billions
6.5
7.6
Ind. + 8%, Dev. + 31%

World Economic Output
Global Insight, Inc., World Economic Outlook, 2002.
1990 2000 2001 F2005 F2010 F2015 F2020 $0
$10
$20
$30
$40
$50
$60
$70
NA WE I. ASIA EE/FSU
D. ASIA ME AFR CSA
GDP, Trillion 1997 Dollars
Ind. + 64%, Developing + 140%
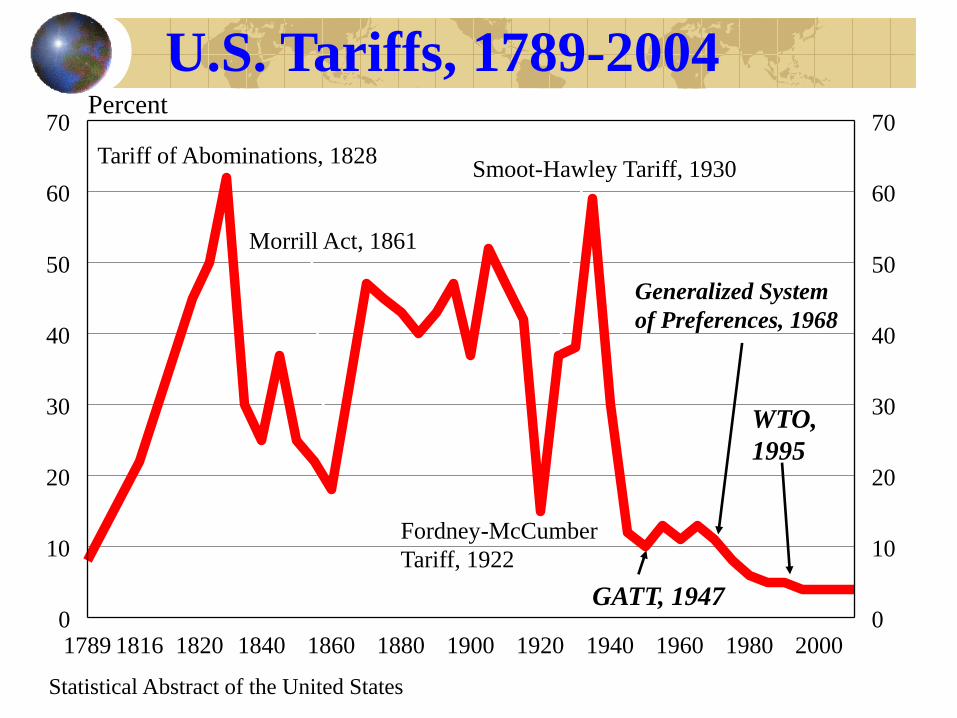
U.S. Tariffs, 1789-2004
Statistical Abstract of the United States
1789 1816 1820 1840 1860 1880 1900 1920 1940 1960 1980 2000 0
10
20
30
40
50
60
70 Percent
0
10
20
30
40
50
60
70
Tariff of Abominations, 1828
Morrill Act, 1861
Smoot-Hawley Tariff, 1930
Generalized System
of Preferences, 1968
Fordney-McCumber
Tariff, 1922
GATT, 1947
WTO,
1995

World Average Agricultural Tariffs, 2002
Source: WTO & ERS/USDA
115
85
55
40 30 25
10
0
20
40
60
80
100
120
140
Percent
Region Average
World Average
62%
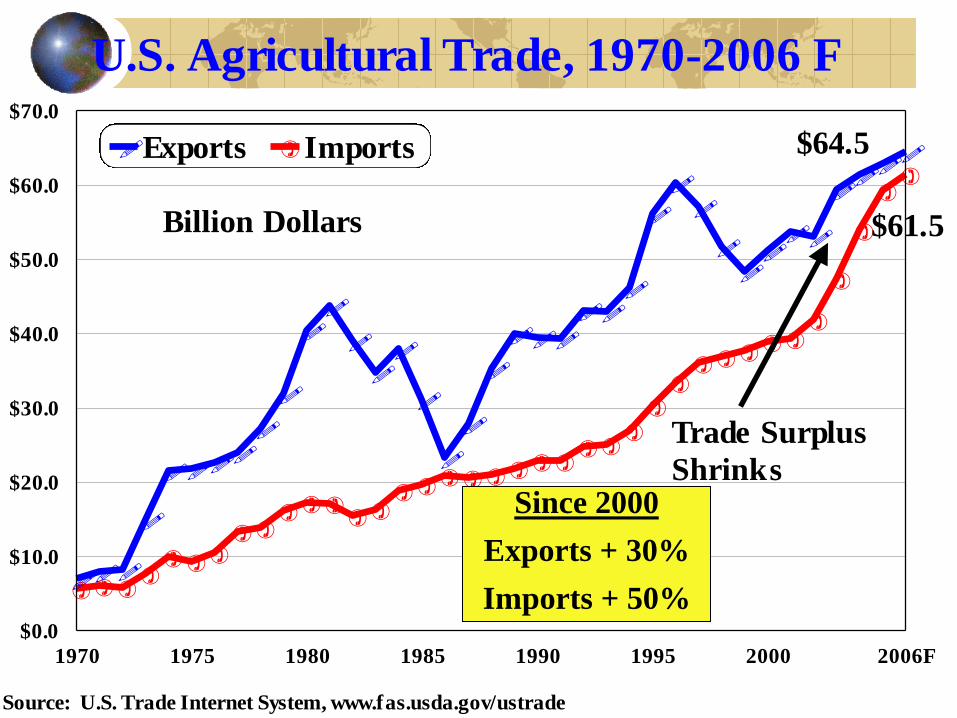
U.S. Agricultural Trade, 1970-2006 F
Source: U.S. Trade Internet System, www.fas.usda.gov/ustrade
1970 1975 1980 1985 1990 1995 2000 2006F
$0.0
$10.0
$20.0
$30.0
$40.0
$50.0
$60.0
$70.0
Exports Imports
Trade Surplus
Shrinks
Billion Dollars
$64.5
$61.5
Since 2000
Exports + 30%
Imports + 50%

World Trade Organization
Doha Development
Agenda (2001-06)?
Agreement on Reductions by April 30, 2006
Did Not Happen
Draft Schedules Due July 31, 2006?
Conclude Negotiations December 31, 2006??
Trade Promotion Authority Expires July 2007
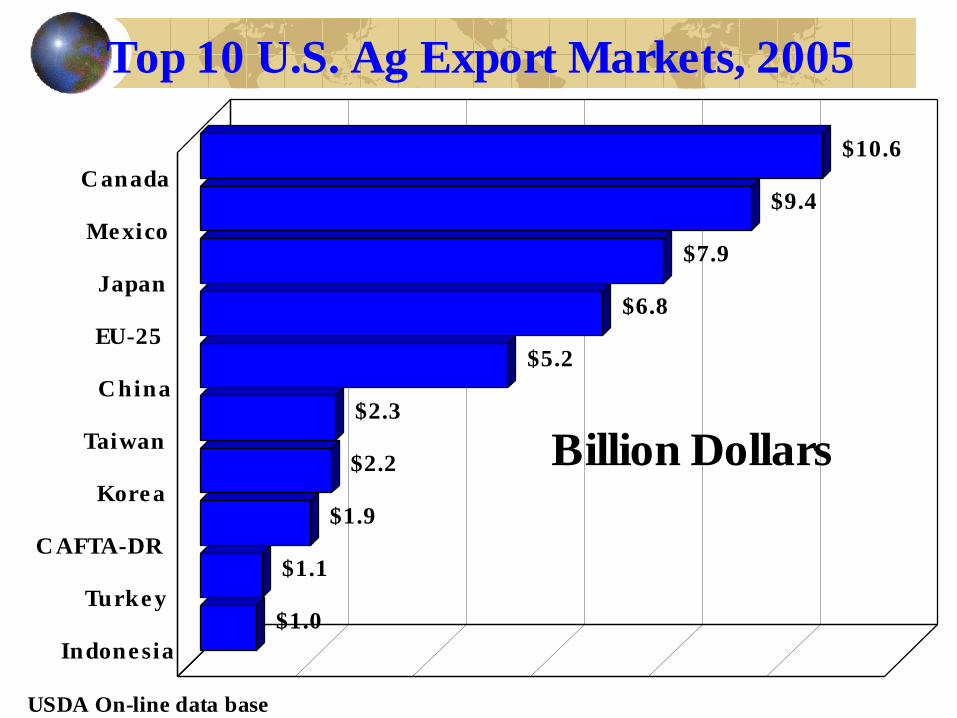
Top 10 U.S. Ag Export Markets, 2005
USDA On-line data base
$10.6
$9.4
$7.9
$6.8
$5.2
$2.3
$2.2
$1.9
$1.1
$1.0
Canada
Mexico
Japan
EU-25
China
Taiwan
Korea
CAFTA-DR
Turkey
Indonesia
Billion Dollars
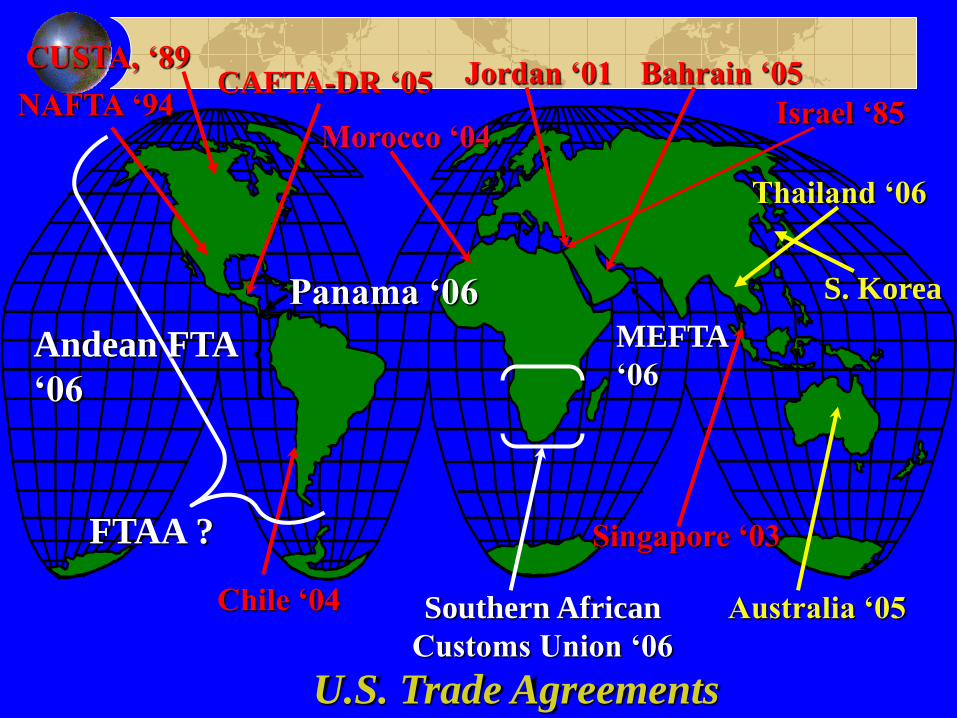
Australia ‘05
Bahrain ‘05 CAFTA-DR ‘05
Chile ‘04
FTAA ?
Morocco ‘04
Southern African
Customs Union ‘06
Singapore ‘03
Jordan ‘01
U.S. Trade Agreements
NAFTA ‘94 Israel ‘85
CUSTA, ‘89
Andean FTA
‘06
Panama ‘06
Thailand ‘06
MEFTA
‘06
S. Korea

Real Growth in U.S. Exports to China and
Rest of World, 1990-2005
USDOC, Bureau of the Census. Index reflects change in exports based on year 2000 US dollars.
1990 1995 2000 20050
100
200
300
400
500
600
China Rest of World
1990=100
2001, China Joins WTO

Foreign Holdings of U.S. Treasury Securities
Bureau of Economic Analysis, Survey of Current Business, July 2005.
$393
$550
$694
$169
$223
$281
$141 $132$173
$131$155
$239
2002 2003 2004$0
$100
$200
$300
$400
$500
$600
$700
$800
Japan China/Hong Kong Europe O ther
Bil l ion Dollars
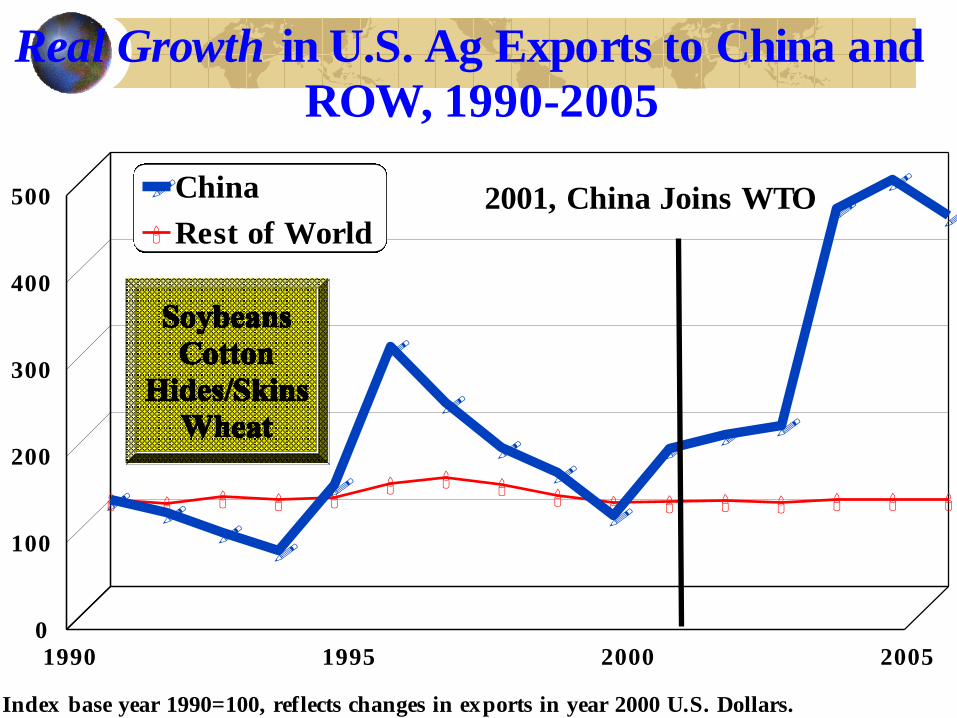
Real Growth in U.S. Ag Exports to China and
ROW, 1990-2005
Index base year 1990=100, reflects changes in exports in year 2000 U.S. Dollars.
1990 1995 2000 2005
0
100
200
300
400
500 China
Rest of World
2001, China Joins WTO

Real Growth in U.S. Ag Exports to NAFTA
and ROW, 1990-2005
1990 1995 2000 20050
50
100
150
200
250
NAFTA Rest of World
Index base year 1990=100, reflects changes in exports in year 2000 U.S. Dollars. ROW excludes NAFTA and China.
NAFTA Implemented, 1994
Asian
Financial
Crisis
Million Dollars
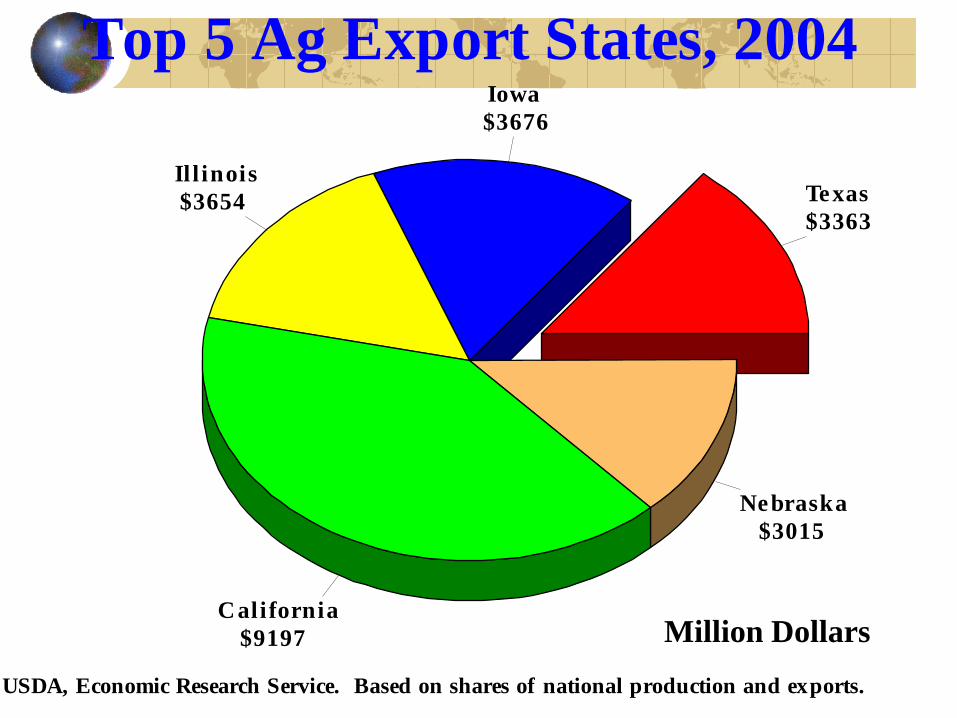
Top 5 Ag Export States, 2004
USDA, Economic Research Service. Based on shares of national production and exports.
Texas
$3363
Iowa
$3676
Il l inois
$3654
California
$9197
Nebraska
$3015
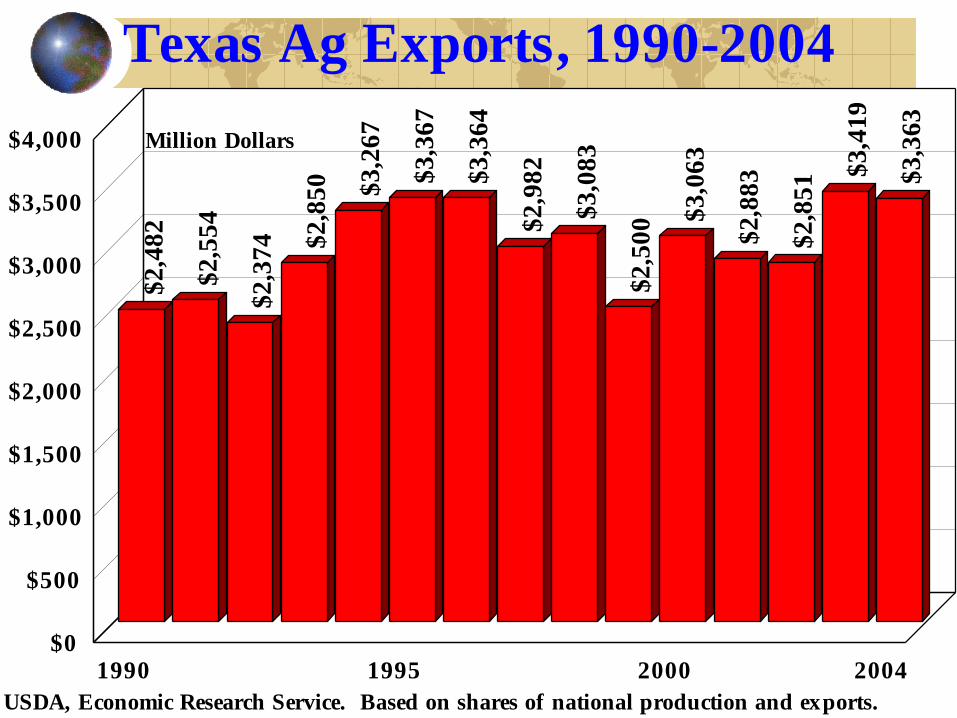
Texas Ag Exports, 1990-2004
USDA, Economic Research Service. Based on shares of national production and exports.
$2
,48
2
$2
,55
4
$2
,37
4 $2
,85
0 $3
,26
7
$3
,36
7
$3
,36
4
$2
,98
2
$3
,08
3
$2
,50
0 $3
,06
3
$2
,88
3
$2
,85
1 $3
,41
9
$3
,36
3
1990 1995 2000 2004
$0
$500
$1,000
$1,500
$2,000
$2,500
$3,000
$3,500
$4,000 Million Dollars

Composition of Texas Ag Exports, 2004
USDA, Economic Research Service. Based on national shares of production and exports.
$1,108
$706
$694
$271
$138
$136
$68
$46
$40
$156
Cotton
Feed Grains
Animals/Products
Wheat/Products
Horticulture
Poultry
Rice
Dairy
Peanuts
O ther
$0 $200 $400 $600 $800 $1,000 $1,200 $1,400
Million Dollars
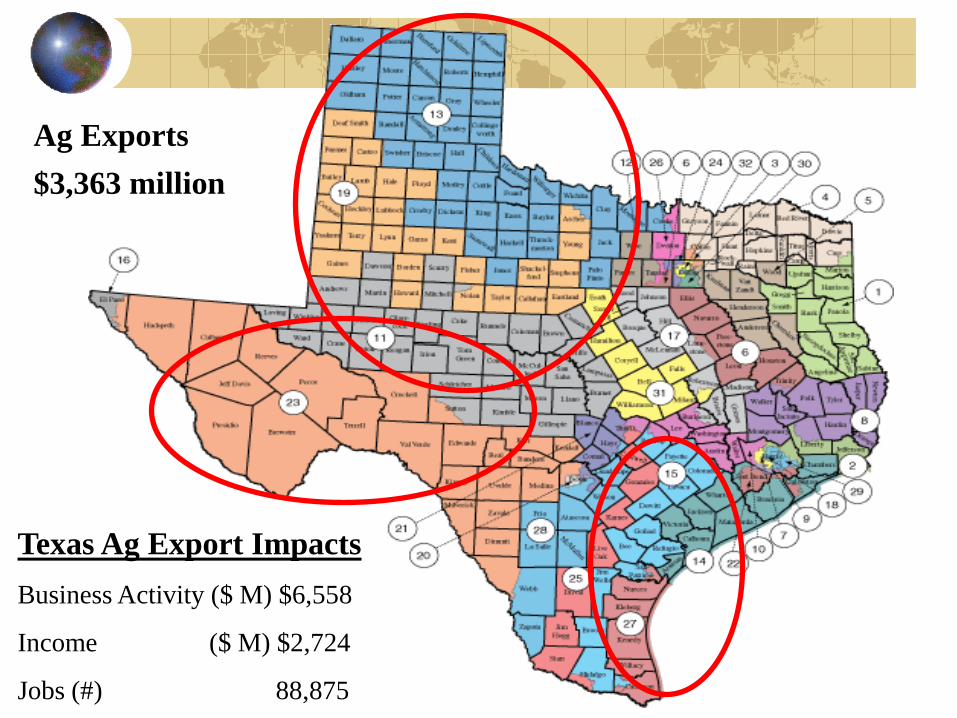
Texas Ag Export Impacts
Business Activity ($ M) $6,558
Income ($ M) $2,724
Jobs (#) 88,875
Ag Exports
$3,363 million
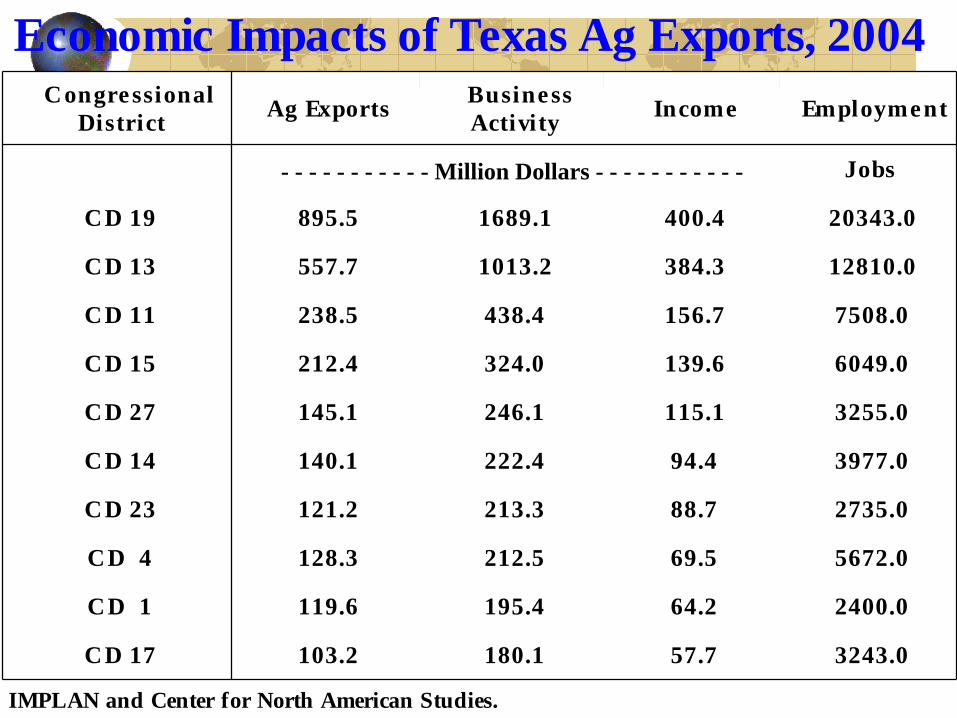
Economic Impacts of Texas Ag Exports, 2004
IMPLAN and Center for North American Studies.
Congressional
DistrictAg Exports
Business
ActivityIncome Employment
Jobs
CD 19 895.5 1689.1 400.4 20343.0
CD 13 557.7 1013.2 384.3 12810.0
CD 11 238.5 438.4 156.7 7508.0
CD 15 212.4 324.0 139.6 6049.0
CD 27 145.1 246.1 115.1 3255.0
CD 14 140.1 222.4 94.4 3977.0
CD 23 121.2 213.3 88.7 2735.0
CD 4 128.3 212.5 69.5 5672.0
CD 1 119.6 195.4 64.2 2400.0
CD 17 103.2 180.1 57.7 3243.0
- - - - - - - - - - - Million Dollars - - - - - - - - - - -

Observations
Disparity in Population & Income
Growth
Disparity in Use of Trade Barriers
Disparity in Agricultural Trade
Growth
China Emerging as Major Market &
Economic Force
Observations
Questions About Role & Future Importance of Trade
WTO Agreement Important Open Markets
Eliminate Export Subsidy Distortions
Minimize Litigation Over Farm Policy
Fruit/Vegetable Issues
Ag Exports Important to Texas Economic Growth, but Concentrated in Certain Regions
Conclusions & Implications
U.S. Market Is Open, Rest of World Is Not
U.S. Export Growth Lags Import Growth
If Trade Growth is Important, Disparities Must Be Addressed
Progress in WTO Important to U.S. & Texas for at Least 2 Reasons:
Markets
Farm Policy

Conclusions & Implications
Absent WTO Progress, Expect More
Litigation in WTO Aimed at Farm U.S.
Policy
Trade Agreements Likely Important Way
to Address Market Access
Trade is Important Growth Component
of Texas Economy

Thank You!
Parr Rosson
Department of Agricultural Economics
Texas A&M University
College Station, TX 77843-2124
Telephone: 979-845-3070


