–3.8 –0.3 Commodities and transactions, n.e.s. –4.7 –2.7 Miscellaneous manufactured articles 1.6 –1.9 Machinery and transport equipment –13.5 –4.4 Manufactured goods classified chiefly by material 5.2 0.2 Chemicals and related products, n.e.s. –11.4 –4.9 Animal and vegetable oils, fats and waxes –12.0 –5.8 Mineral fuels, lubricants and related materials –23.0 –11.7 Crude materials, inedible, except fuels 4.9 4.7 Beverages and tobacco –5.0 –0.3 Food and live animals –13.4 –6.4 Export Price Index all groups –1.5 –0.3 Commodities and transactions, n.e.s. 4.2 –0.9 Miscellaneous manufactured articles 1.0 –0.8 Machinery and transport equipment 0.4 –1.3 Manufactured goods classified chiefly by material –0.1 –1.7 Chemicals and related products, n.e.s. –13.3 –4.6 Animal and vegetable oils, fats and waxes 0.8 –9.1 Mineral fuels, lubricants and related materials –5.3 –3.7 Crude materials, inedible, except fuels –4.3 –4.6 Beverages and tobacco 1.9 –1.9 Food and live animals 1.2 –2.4 Import Price Index all groups % change % change Sep Qtr 11 to Sep Qtr 12 Jun Qtr 12 to Sep Qtr 12 KEY FIGURES IMPORT PRICE INDEX ! The Import Price Index fell 2.4% in the September quarter 2012. Through the year to the September quarter 2012, the Import Price Index rose 1.2%. EXPORT PRICE INDEX ! The Export Price Index fell 6.4% in the September quarter 2012. Through the year to the September quarter 2012, the Export Price Index fell 13.4%. KEY POINTS E M B A R G O : 1 1 . 3 0 A M ( C A N B E R R A T I M E ) T H U R S 1 N O V 2 0 1 2 INTERNATIONAL TRADE PRICE INDEXES AUSTRALIA 6457.0 S E P T E M B E R Q U A R T E R 2 0 1 2 For further information about these and related statistics, contact the National Information and Referral Service on 1300 135 070. IMPORT PRICE INDEX: all groups Quarterly % change Sep 2008 Sep 2009 Sep 2010 Sep 2011 Sep 2012 %change –10 –5 0 5 10 15 EXPORT PRICE INDEX: all groups Quarterly % change Sep 2008 Sep 2009 Sep 2010 Sep 2011 Sep 2012 %change –30 –20 –10 0 10 20 INQUIRIES www.abs.gov.au
Transcript
–3.8–0.3Commodities and transactions, n.e.s.
–4.7–2.7Miscellaneous manufactured articles
1.6–1.9Machinery and transport equipment
–13.5–4.4Manufactured goods classified chiefly by material
5.20.2Chemicals and related products, n.e.s.
–11.4–4.9Animal and vegetable oils, fats and waxes
–12.0–5.8Mineral fuels, lubricants and related materials
–23.0–11.7Crude materials, inedible, except fuels
4.94.7Beverages and tobacco
–5.0–0.3Food and live animals
–13.4–6.4Export Price Index all groups
–1.5–0.3Commodities and transactions, n.e.s.
4.2–0.9Miscellaneous manufactured articles
1.0–0.8Machinery and transport equipment
0.4–1.3Manufactured goods classified chiefly by material
–0.1–1.7Chemicals and related products, n.e.s.
–13.3–4.6Animal and vegetable oils, fats and waxes
0.8–9.1Mineral fuels, lubricants and related materials
–5.3–3.7Crude materials, inedible, except fuels
–4.3–4.6Beverages and tobacco
1.9–1.9Food and live animals
1.2–2.4Import Price Index all groups
% change% change
Sep Qtr 11 toSep Qtr 12
Jun Qtr 12 toSep Qtr 12
K E Y F I G U R E S
I M P O R T P R I C E I N D E X
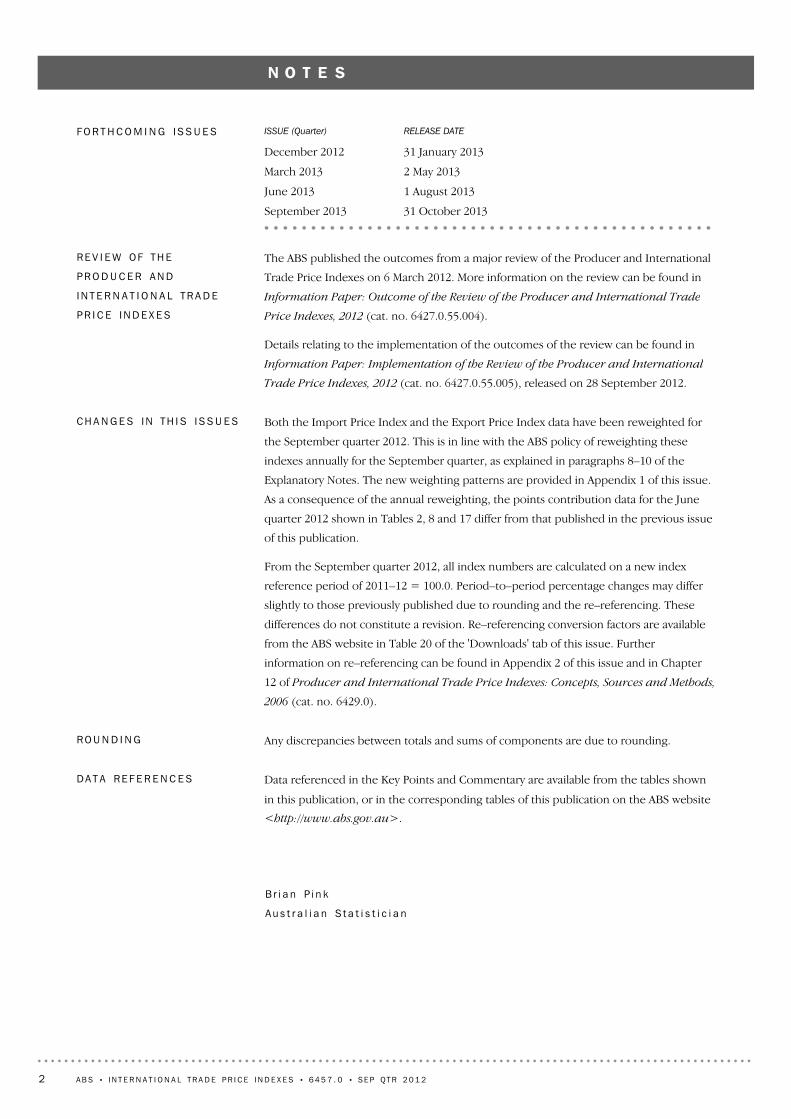
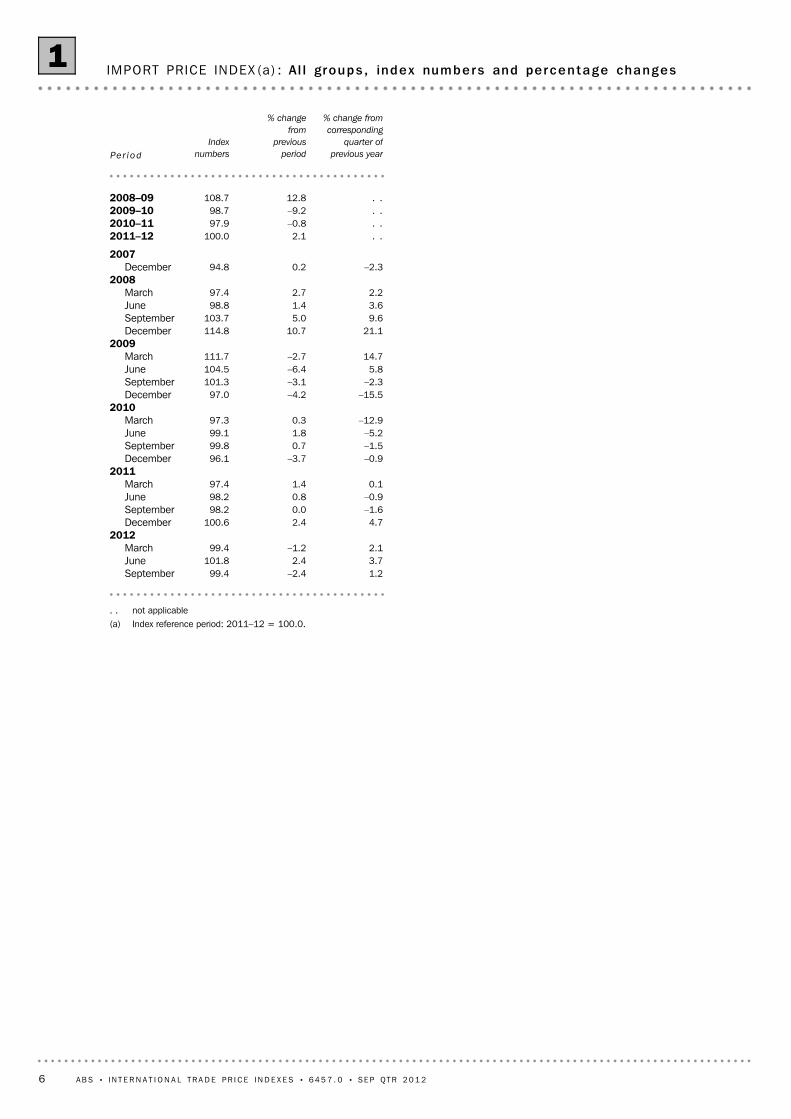
! The Import Price Index fell 2.4% in the September quarter 2012. Through the year to the
September quarter 2012, the Import Price Index rose 1.2%.
E X P O R T P R I C E I N D E X
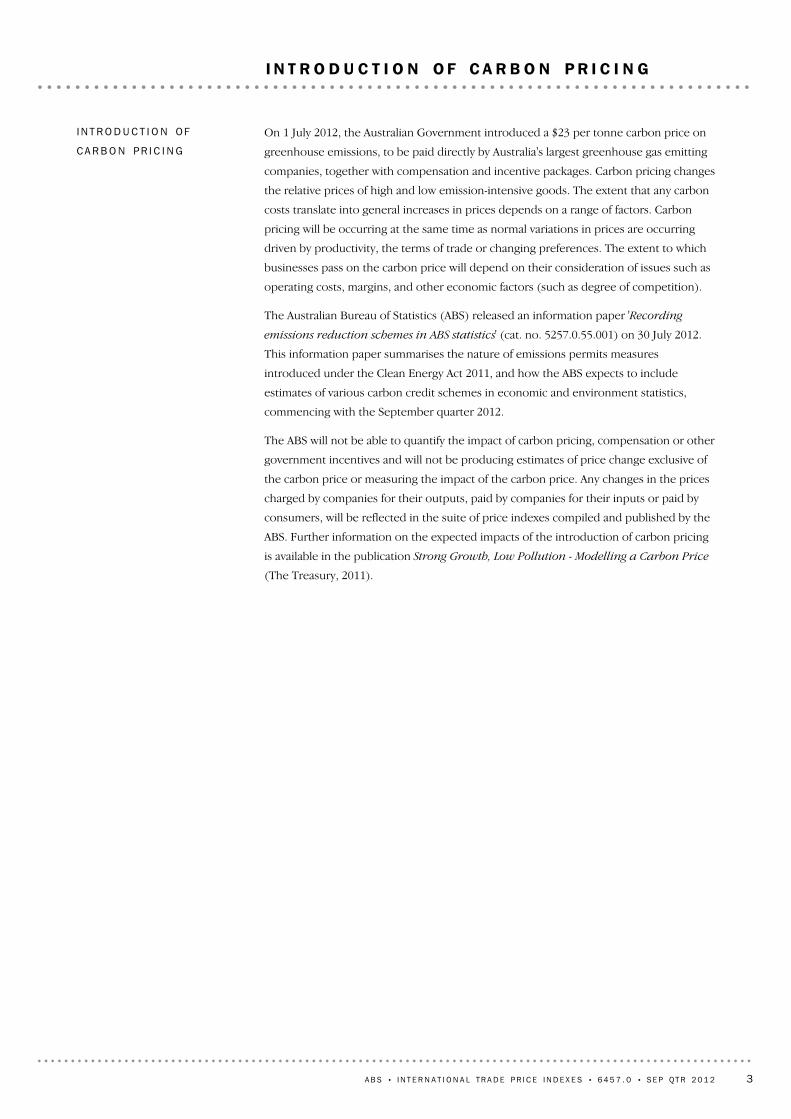
! The Export Price Index fell 6.4% in the September quarter 2012. Through the year to the
September quarter 2012, the Export Price Index fell 13.4%.
K E Y P O I N T S
E M B A R G O : 1 1 . 3 0 A M ( C A N B E R R A T I M E ) T H U R S 1 N O V 2 0 1 2
INTERNATIONAL TRADE PRICEINDEXES A U S T R A L I A
6457.0S E P T E M B E R Q U A R T E R 2 0 1 2
For further informationabout these and relatedstatistics, contact theNational Information andReferral Service on1300 135 070.
IMPORT PRICE INDEX: all groupsQuarterly % change
Sep2008
Sep2009
Sep2010
Sep2011
Sep2012
%change
–10
–5
0
5
10
15
EXPORT PRICE INDEX: all groups Quarterly % change
Sep2008
Sep2009
Sep2010
Sep2011
Sep2012
%change
–30
–20
–10
0
10
20
I N Q U I R I E S
w w w . a b s . g o v . a u
henswi
Prices stamp
31 October 2013September 2013
1 August 2013June 2013
2 May 2013March 2013
31 January 2013December 2012
RELEASE DATEISSUE (Quarter)FO R T H C O M I N G I S S U E S
B r i a n P i n k
Au s t r a l i a n S t a t i s t i c i a n
Data referenced in the Key Points and Commentary are available from the tables shown
in this publication, or in the corresponding tables of this publication on the ABS website
<http://www.abs.gov.au>.
DA T A RE F E R E N C E S
Any discrepancies between totals and sums of components are due to rounding.RO U N D I N G
Both the Import Price Index and the Export Price Index data have been reweighted for
the September quarter 2012. This is in line with the ABS policy of reweighting these
indexes annually for the September quarter, as explained in paragraphs 8–10 of the
Explanatory Notes. The new weighting patterns are provided in Appendix 1 of this issue.
As a consequence of the annual reweighting, the points contribution data for the June
quarter 2012 shown in Tables 2, 8 and 17 differ from that published in the previous issue
of this publication.
From the September quarter 2012, all index numbers are calculated on a new index
reference period of 2011–12 = 100.0. Period–to–period percentage changes may differ
slightly to those previously published due to rounding and the re–referencing. These
differences do not constitute a revision. Re–referencing conversion factors are available
from the ABS website in Table 20 of the 'Downloads' tab of this issue. Further
information on re–referencing can be found in Appendix 2 of this issue and in Chapter
12 of Producer and International Trade Price Indexes: Concepts, Sources and Methods,
2006 (cat. no. 6429.0).
CH A N G E S IN TH I S I S S U E S
The ABS published the outcomes from a major review of the Producer and International
Trade Price Indexes on 6 March 2012. More information on the review can be found in
Information Paper: Outcome of the Review of the Producer and International Trade
Price Indexes, 2012 (cat. no. 6427.0.55.004).
Details relating to the implementation of the outcomes of the review can be found in
Information Paper: Implementation of the Review of the Producer and International
Trade Price Indexes, 2012 (cat. no. 6427.0.55.005), released on 28 September 2012.
RE V I E W OF TH E
PR O D U C E R AN D
IN T E R N A T I O N A L TR A D E
PR I C E IN D E X E S
2 A B S • I N T E R N A T I O N A L T R A D E P R I C E I N D E X E S • 6 4 5 7 . 0 • SE P QT R 2 0 1 2
N O T E S
On 1 July 2012, the Australian Government introduced a $23 per tonne carbon price on
greenhouse emissions, to be paid directly by Australia's largest greenhouse gas emitting
companies, together with compensation and incentive packages. Carbon pricing changes
the relative prices of high and low emission-intensive goods. The extent that any carbon
costs translate into general increases in prices depends on a range of factors. Carbon
pricing will be occurring at the same time as normal variations in prices are occurring
driven by productivity, the terms of trade or changing preferences. The extent to which
businesses pass on the carbon price will depend on their consideration of issues such as
operating costs, margins, and other economic factors (such as degree of competition).
The Australian Bureau of Statistics (ABS) released an information paper 'Recording
emissions reduction schemes in ABS statistics' (cat. no. 5257.0.55.001) on 30 July 2012.
This information paper summarises the nature of emissions permits measures
introduced under the Clean Energy Act 2011, and how the ABS expects to include
estimates of various carbon credit schemes in economic and environment statistics,
commencing with the September quarter 2012.
The ABS will not be able to quantify the impact of carbon pricing, compensation or other
government incentives and will not be producing estimates of price change exclusive of
the carbon price or measuring the impact of the carbon price. Any changes in the prices
charged by companies for their outputs, paid by companies for their inputs or paid by
consumers, will be reflected in the suite of price indexes compiled and published by the
ABS. Further information on the expected impacts of the introduction of carbon pricing
is available in the publication Strong Growth, Low Pollution - Modelling a Carbon Price
(The Treasury, 2011).
I N T R O D U C T I O N OF
CA R B O N PR I C I N G
A B S • I N T E R N A T I O N A L T R A D E P R I C E I N D E X E S • 6 4 5 7 . 0 • SE P QT R 2 0 1 2 3
I N T R O D U C T I O N O F C A R B O N P R I C I N G
The Export Price Index fell 6.4% in the September quarter 2012. This decrease was
driven mainly by falls in the prices received for metalliferous ores and metal scrap
(–12.1%), coal, coke and briquettes (–6.1%), petroleum, petroleum products and related
materials (–9.6%), and textile fibre and their waste (–15.8%). These decreases were partly
offset by rises in the prices received for inorganic chemicals (+18.1%).
Through the year to the September quarter 2012, the Export Price Index fell 13.4%. This
decrease was driven mainly by falls in the prices received for metalliferous ores and metal
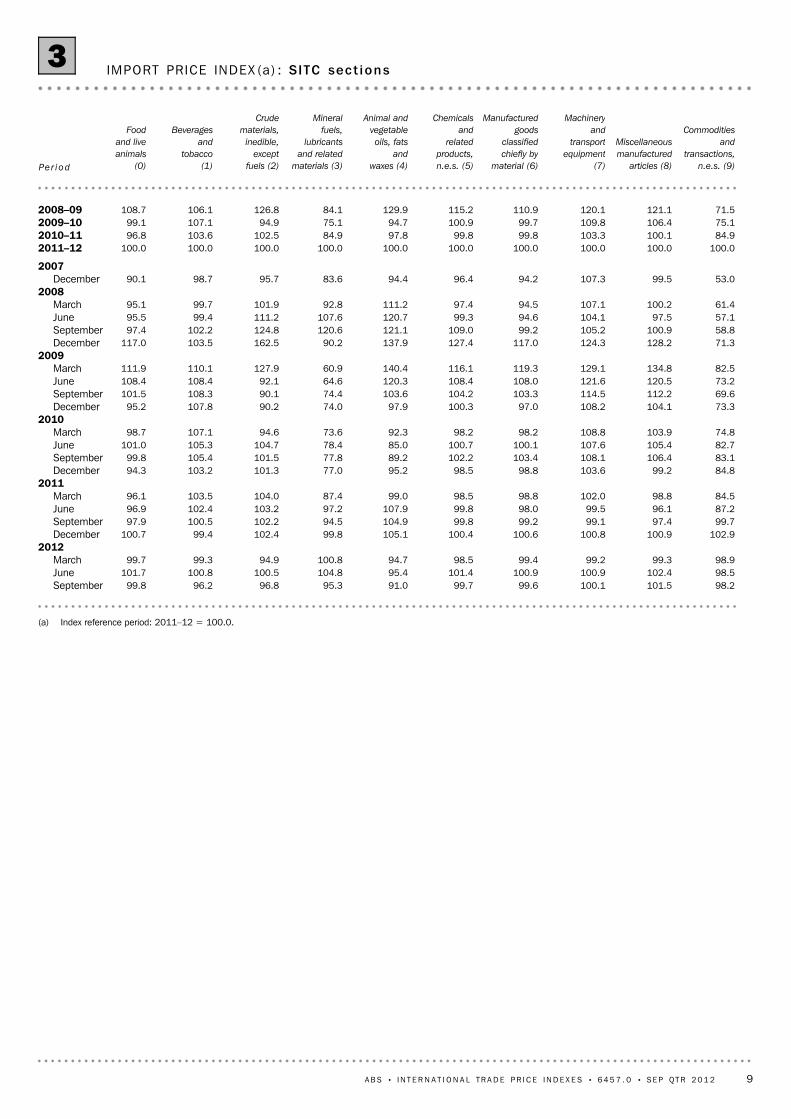
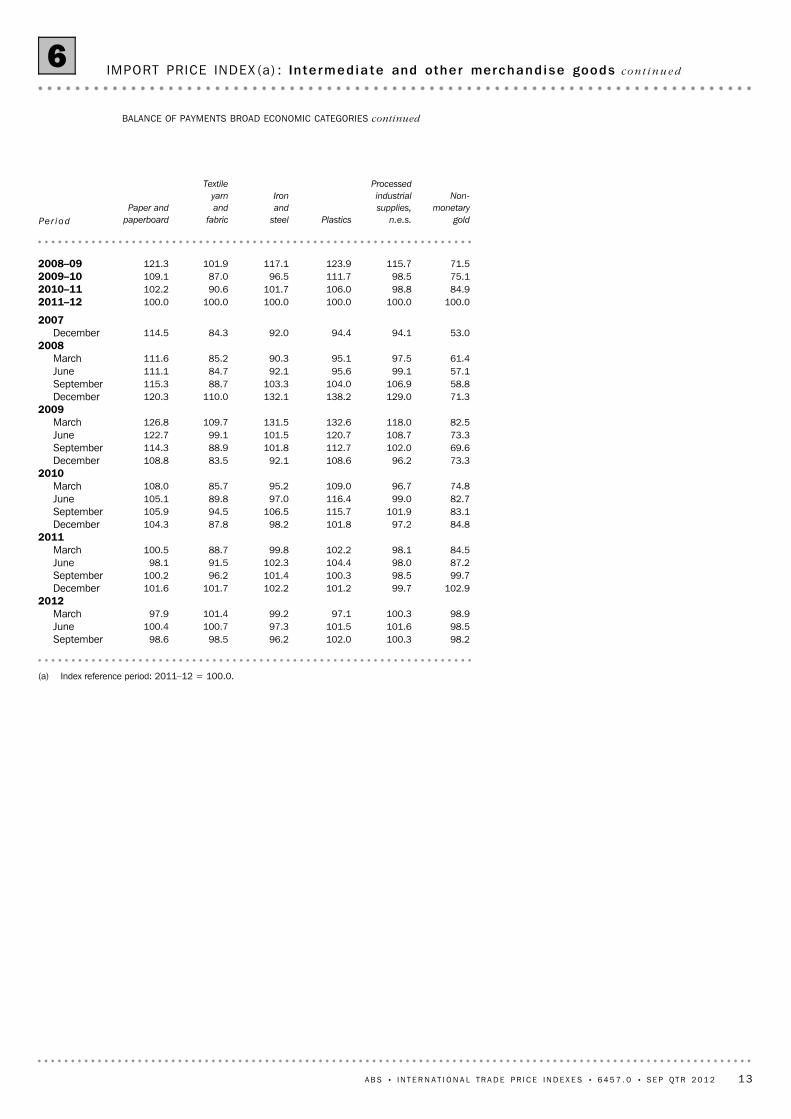
IMPORT PRICE INDEX (a) : Al l groups , index numbers and percentage changes1
6 A B S • I N T E R N A T I O N A L T R A D E P R I C E I N D E X E S • 6 4 5 7 . 0 • SE P QT R 2 0 1 2
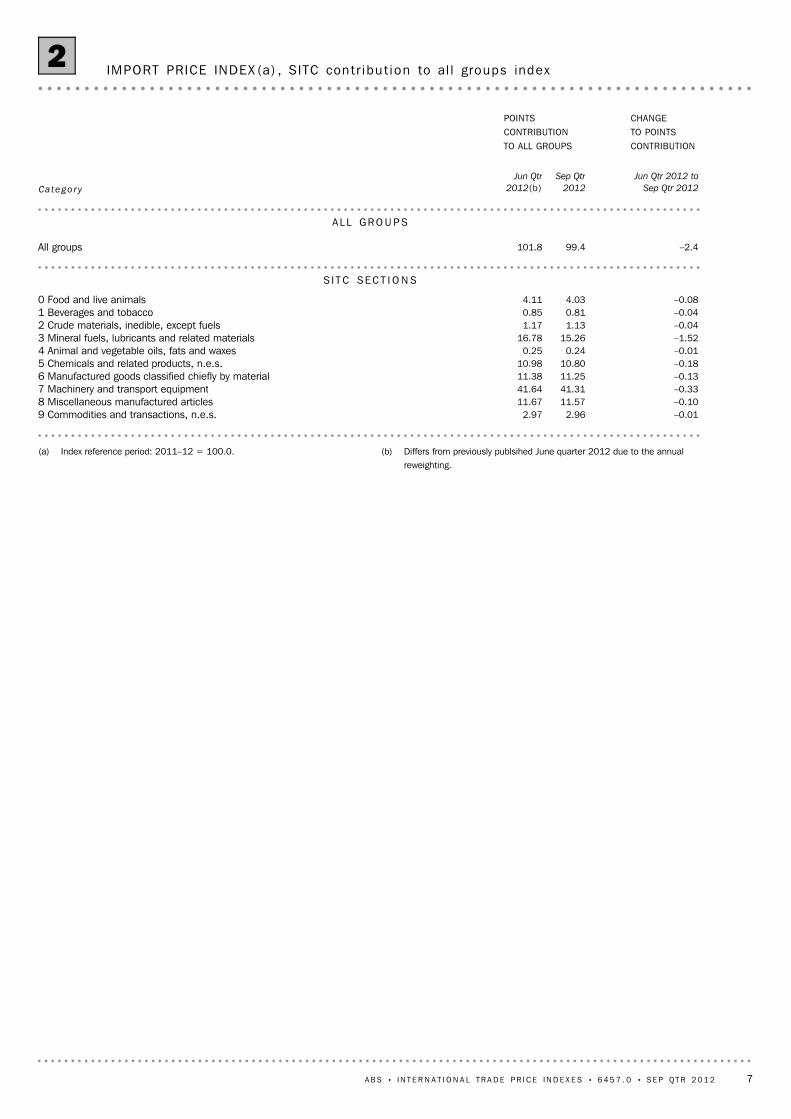
(b) Differs from previously publsihed June quarter 2012 due to the annualreweighting.
(a) Index reference period: 2011–12 = 100.0.
–0.012.962.979 Commodities and transactions, n.e.s.–0.1011.5711.678 Miscellaneous manufactured articles–0.3341.3141.647 Machinery and transport equipment–0.1311.2511.386 Manufactured goods classified chiefly by material–0.1810.8010.985 Chemicals and related products, n.e.s.–0.010.240.254 Animal and vegetable oils, fats and waxes–1.5215.2616.783 Mineral fuels, lubricants and related materials–0.041.131.172 Crude materials, inedible, except fuels–0.040.810.851 Beverages and tobacco–0.084.034.110 Food and live animals
S I T C SE C T I O N S
–2.499.4101.8All groups
AL L GR O U P S
Jun Qtr 2012 to
Sep Qtr 2012
Sep Qtr
2012
Jun Qtr
2012(b)
CHANGETO POINTSCONTRIBUTION
POINTSCONTRIBUTIONTO ALL GROUPS
Catego r y
IMPORT PRICE INDEX (a) , SITC cont r ibu t ion to al l groups index2
A B S • I N T E R N A T I O N A L T R A D E P R I C E I N D E X E S • 6 4 5 7 . 0 • SE P QT R 2 0 1 2 7
(b) Differs from previously publsihed June quarter 2012 due to the annualreweighting.
(a) Index reference period: 2011–12 = 100.0.
–0.012.962.9797 Gold, non-monetary–0.053.623.6789 Miscellaneous manufactured articles, n.e.s.–0.010.600.6188 Photographic and optical goods0.052.282.2387 Professional, scientific and controlling instruments and apparatus, n.e.s.
–0.010.570.5885 Footwear–0.042.412.4584 Articles of apparel and clothing0.000.350.3583 Travel goods and handbags
–0.021.191.2182 Furniture and parts thereof–0.010.560.5781 Prefabricated buildings and fixtures n.e.s.–0.062.082.1479 Other transport equipment0.0512.8112.7678 Road vehicles (incl. air–cushion vehicles)
–0.024.944.9677 Electrical machinery, etc. and parts thereof–0.055.145.1976 Telecommunications and sound recording equipment and reproducing apparatus and equipment0.054.254.2075 Office machines and ADP machines
–0.094.864.9574 General industrial machinery and equipment, n.e.s., and machine parts, n.e.s.–0.194.855.0472 Machinery specialised for particular industries–0.032.072.1071 Power generating machinery and equipment–0.032.692.7269 Manufactures of metals, n.e.s.–0.061.411.4768 Non-ferrous metals–0.021.871.8967 Iron and steel–0.011.021.0366 Non-metallic mineral manufacts–0.011.091.1065 Textile yarn, fabrics, made-up articles, n.e.s., and related products–0.031.101.1364 Paper, paperboard and articles of paper pulp, of paper or of paperboard–0.010.330.3463 Cork and wood manufactures0.021.691.6762 Rubber manufactures n.e.s.0.000.050.0561 Leather and leather manufactures0.030.930.9059 Chemical materials and products, n.e.s.0.000.630.6358 Plastics in non-primary forms0.000.760.7657 Plastics in primary forms
–0.164.694.8554 Medicinal products–0.010.260.2753 Dyeing and colouring materials–0.010.690.7052 Inorganic chemicals–0.061.211.2751 Organic chemicals–0.010.190.2042 Fixed vegetable fats and oils–1.5714.0715.6433 Petroleum, petroleum products and related materials0.000.120.1227 Crude fertilizers and minerals0.000.040.0426 Textile Fibres and Wastes
–0.010.070.0825 Pulp and Waste Paper–0.010.280.2924 Cork and wood–0.010.060.0723 Crude rubber–0.010.100.1112 Tobacco–0.030.710.7411 Beverages0.000.780.7809 Misc edible products
–0.020.610.6307 Coffee, tea cocoa–0.030.810.8405 Vegetables, fruit and nuts–0.010.580.5903 Fish, crustaceans, molluscs and aquatic invertebrates and preparations thereof–0.010.300.3102 Dairy products and eggs
S I T C D I V I S I O N S
Jun Qtr 2012 to
Sep Qtr 2012
Sep Qtr
2012
Jun Qtr
2012(b)
CHANGETO POINTSCONTRIBUTION
POINTSCONTRIBUTIONTO ALL GROUPS
Catego r y
IMPORT PRICE INDEX (a) , SITC cont r ibu t ion to al l groups index co n t i n u e d2
8 A B S • I N T E R N A T I O N A L T R A D E P R I C E I N D E X E S • 6 4 5 7 . 0 • SE P QT R 2 0 1 2
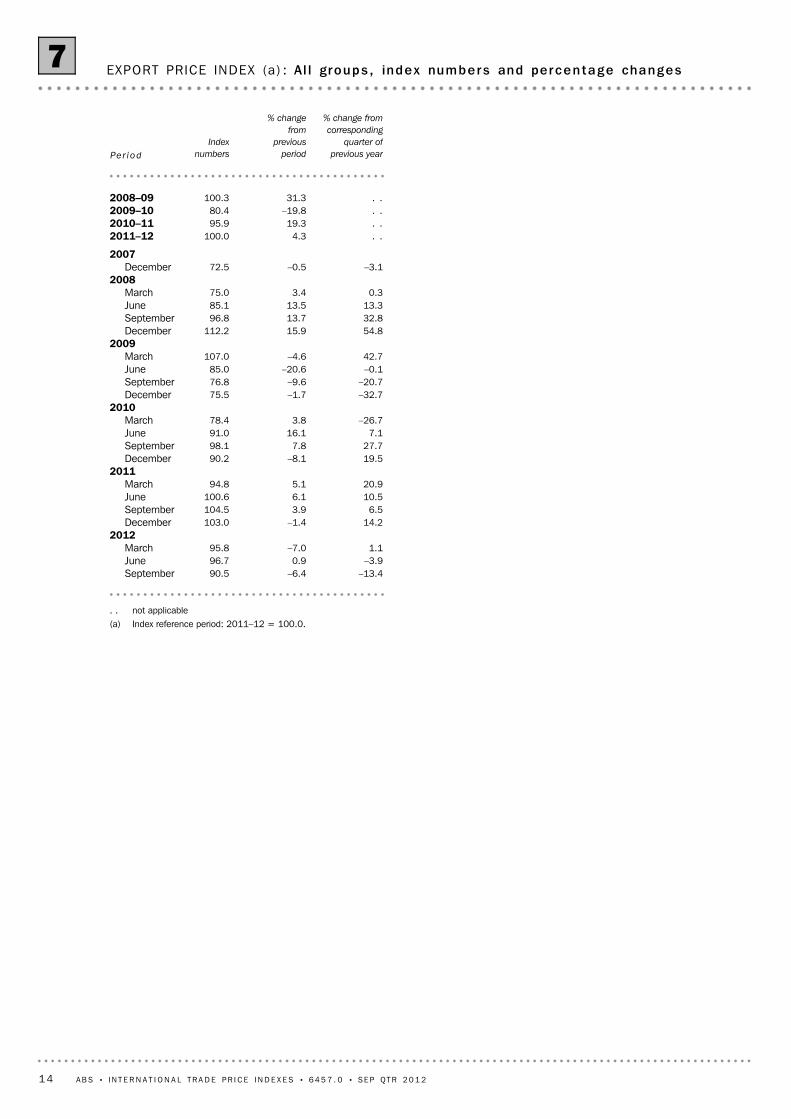
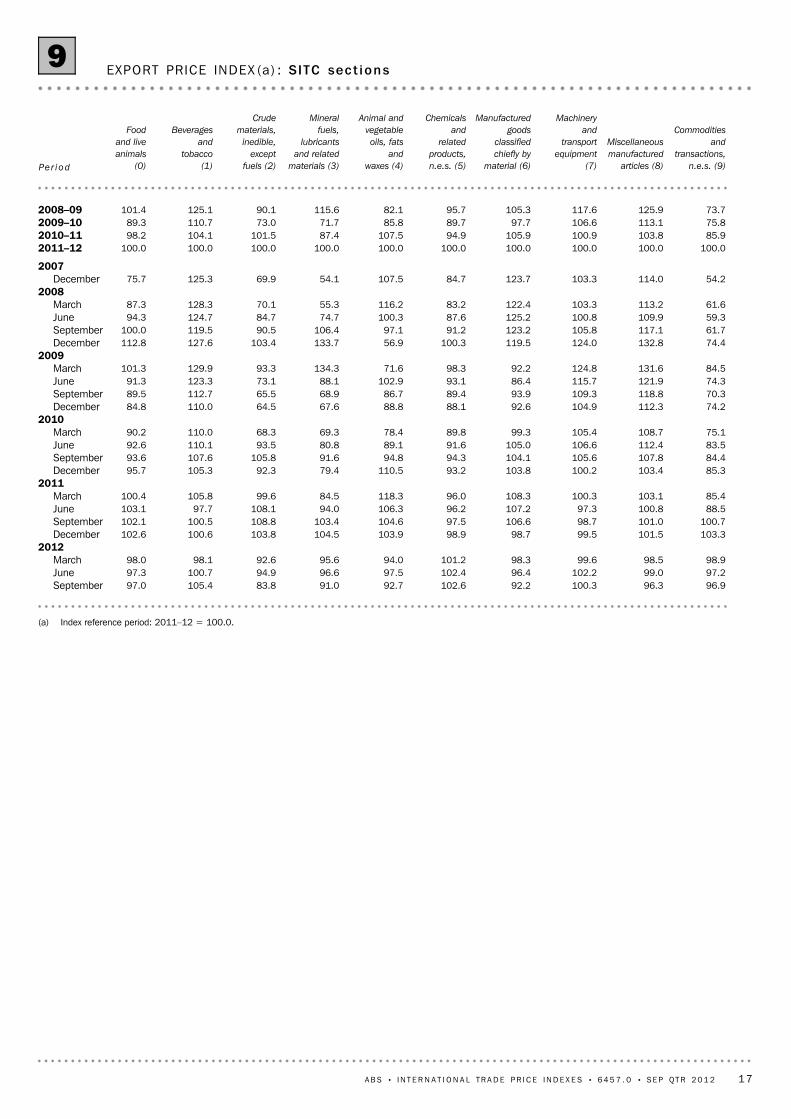
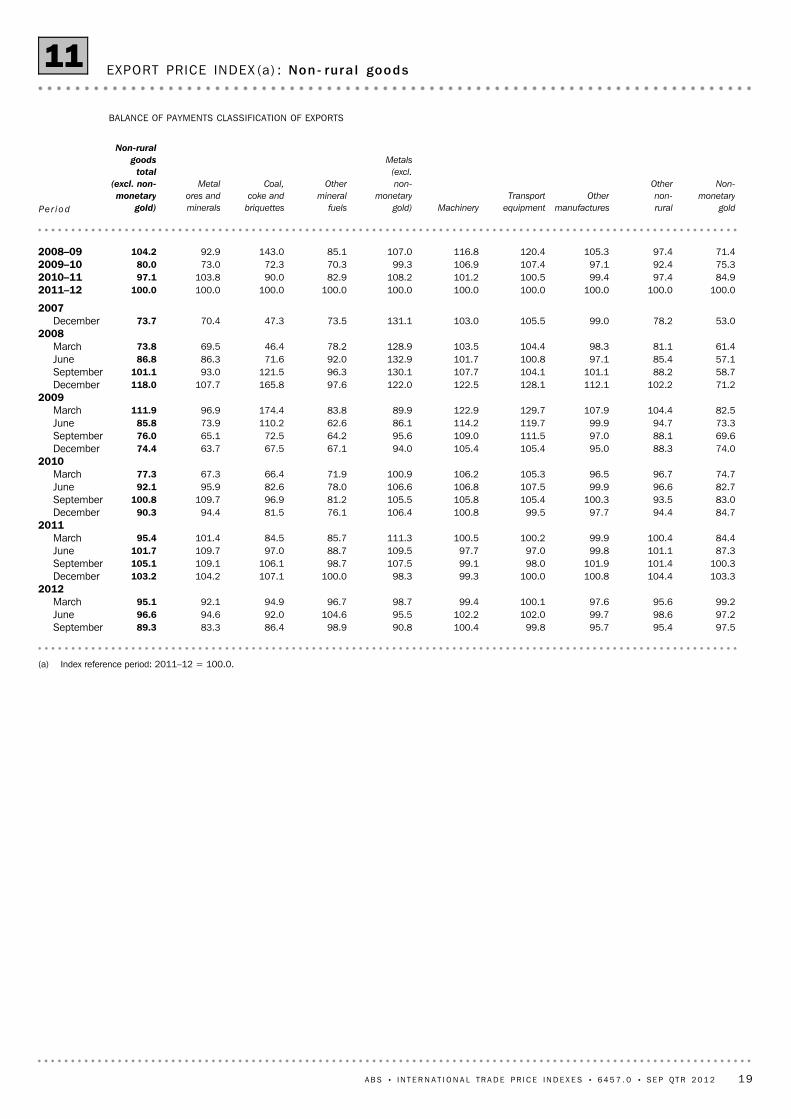
EXPORT PRICE INDEX (a) : Al l groups , index numbers and percentage changes7
14 A B S • I N T E R N A T I O N A L T R A D E P R I C E I N D E X E S • 6 4 5 7 . 0 • SE P QT R 2 0 1 2
(b) Differs from previously published June quarter 2012 due to the annualreweighting.
(a) Index reference period: 2011–12 = 100.0.
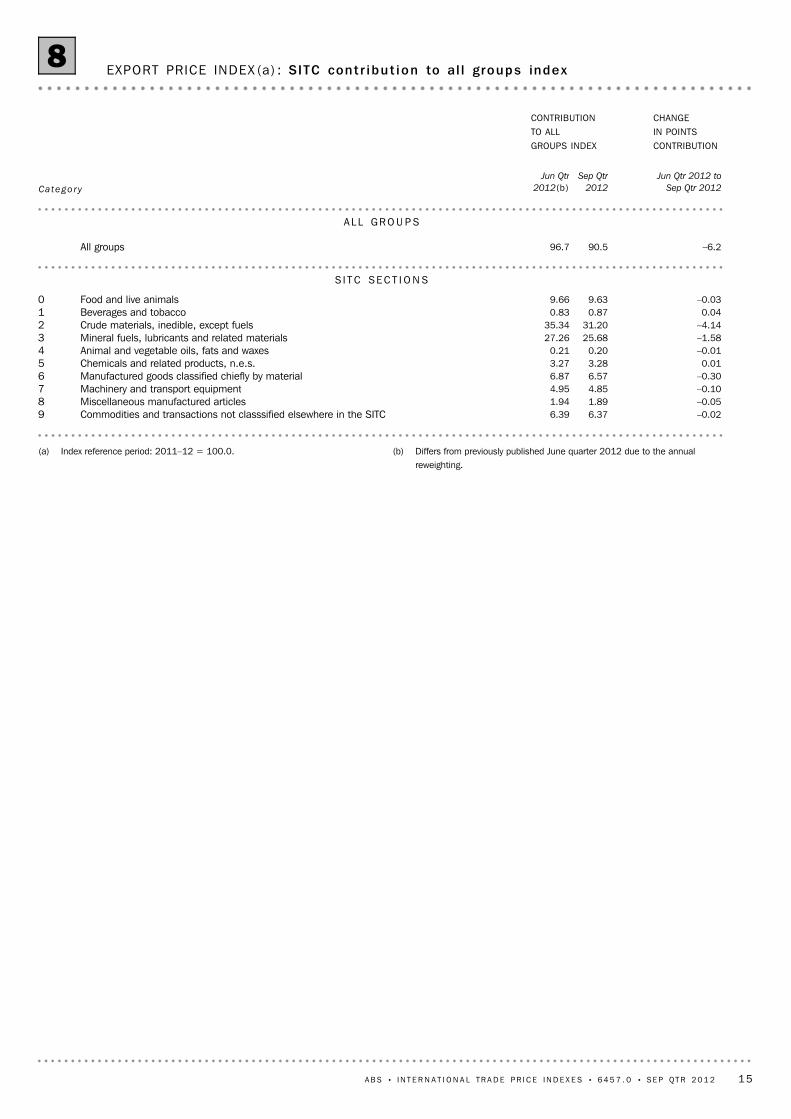
–0.026.376.39Commodities and transactions not classsified elsewhere in the SITC9–0.051.891.94Miscellaneous manufactured articles8–0.104.854.95Machinery and transport equipment7–0.306.576.87Manufactured goods classified chiefly by material60.013.283.27Chemicals and related products, n.e.s.5
–0.010.200.21Animal and vegetable oils, fats and waxes4–1.5825.6827.26Mineral fuels, lubricants and related materials3–4.1431.2035.34Crude materials, inedible, except fuels20.040.870.83Beverages and tobacco1
–0.039.639.66Food and live animals0
S I T C SE C T I O N S
–6.290.596.7All groups
AL L GR O U P S
Jun Qtr 2012 to
Sep Qtr 2012
Sep Qtr
2012
Jun Qtr
2012(b)
CHANGEIN POINTSCONTRIBUTION
CONTRIBUTIONTO ALLGROUPS INDEX
Catego r y
EXPORT PRICE INDEX (a) : SITC cont r i bu t i on to al l groups index8
A B S • I N T E R N A T I O N A L T R A D E P R I C E I N D E X E S • 6 4 5 7 . 0 • SE P QT R 2 0 1 2 15
(b) Differs from previously published June quarter 2012 due to the annualreweighting.
(a) Index reference period: 2011–12 = 100.0.
0.015.625.61Gold, non–monetary (excluding gold, ores and concentrates)97–0.020.880.90Miscellaneous manufactured articles, n.e.s.89–0.010.090.10Photographic apparatus, equipment and supplies and optical goods, n.e.s.88–0.020.720.74Professional, scientific and controlling instruments and apparatus, n.e.s.870.000.080.08Prefabricated buildings and furniture and parts thereof81–82
–0.020.610.63Other transport equipment79–0.021.011.03Road vehicles (incl. air–cushion vehicles)78–0.030.960.99Telecommunications equipment, sound–recording apparatus and electrical machinery, n.e.s.76–77–0.022.272.29Power generating, general industrial and other specialised machinery and equipment71–75–0.194.504.69Non–ferrous metals68–0.070.770.84Iron and steel67–0.010.340.35Non–metallic mineral manufactures, n.e.s.660.000.300.30Paper, paperboard, and articles of paper pulp, of paper or of paperboard64
–0.010.070.08Rubber manufactures, n.e.s.620.000.090.09Leather, leather manufactures, n.e.s., and dressed furskins61
–0.020.340.36Chemical materials and products, n.e.s.59–0.010.120.13Plastics in non–primary forms580.000.160.16Plastics in primary forms570.011.621.61Medicinal and pharmaceutical products540.000.290.29Dyeing, tanning and colouring materials530.050.320.27Inorganic chemicals520.000.080.08Organic chemicals51
–0.020.120.14Animal oils and fats41–0.054.744.79Gas, natural and manufactured34–0.494.665.15Petroleum, petroleum products and related materials33–1.0416.2817.32Coal, coke and briquettes32–3.8027.7831.58Metalliferous ores and metal scrap28–0.010.340.35Crude fertilisers, other than those of division 56, and crude minerals (excluding coal, petroleum)27–0.311.651.96Textile fibres and their wastes260.000.420.42Cork and wood240.010.510.50Oil seeds and oleaginous fruits220.000.320.32Hides, skins and furskins, raw210.040.830.79Beverages110.000.340.34Miscellaneous edible products and preparations090.030.440.41Feeding stuff for animals (not including unmilled cereals)08
–0.010.100.11Coffee, tea, cocoa, spices and manufactures thereof07–0.070.610.68Sugars, sugar preparations and honey060.050.690.64Vegetables and fruit050.033.163.13Cereals and cereal preparations040.010.370.36Fish, crustaceans, molluscs and aquatic invertebrates and preparations thereof03
–0.040.780.82Dairy products and birds' eggs020.012.732.72Meat and meat preparations01
–0.010.430.44Live animals other than animals of division 0300
SE L E C T E D S I T C D I V I S I O N S
Jun Qtr 2012 to
Sep Qtr 2012
Sep Qtr
2012
Jun Qtr
2012(b)
CHANGEIN POINTSCONTRIBUTION
CONTRIBUTIONTO ALLGROUPS INDEX
Catego r y
EXPORT PRICE INDEX (a) : SITC cont r i bu t i on to al l groups index co n t i n u e d8
16 A B S • I N T E R N A T I O N A L T R A D E P R I C E I N D E X E S • 6 4 5 7 . 0 • SE P QT R 2 0 1 2
Australian and New Zealand Standard Industrial ClassificationANZSIC
Australian Harmonised Export Commodity ClassificationAHECC
automatic data processingADP
Australian Bureau of StatisticsABSAB B R E V I A T I O N S
A B S • I N T E R N A T I O N A L T R A D E P R I C E I N D E X E S • 6 4 5 7 . 0 • SE P QT R 2 0 1 2 23
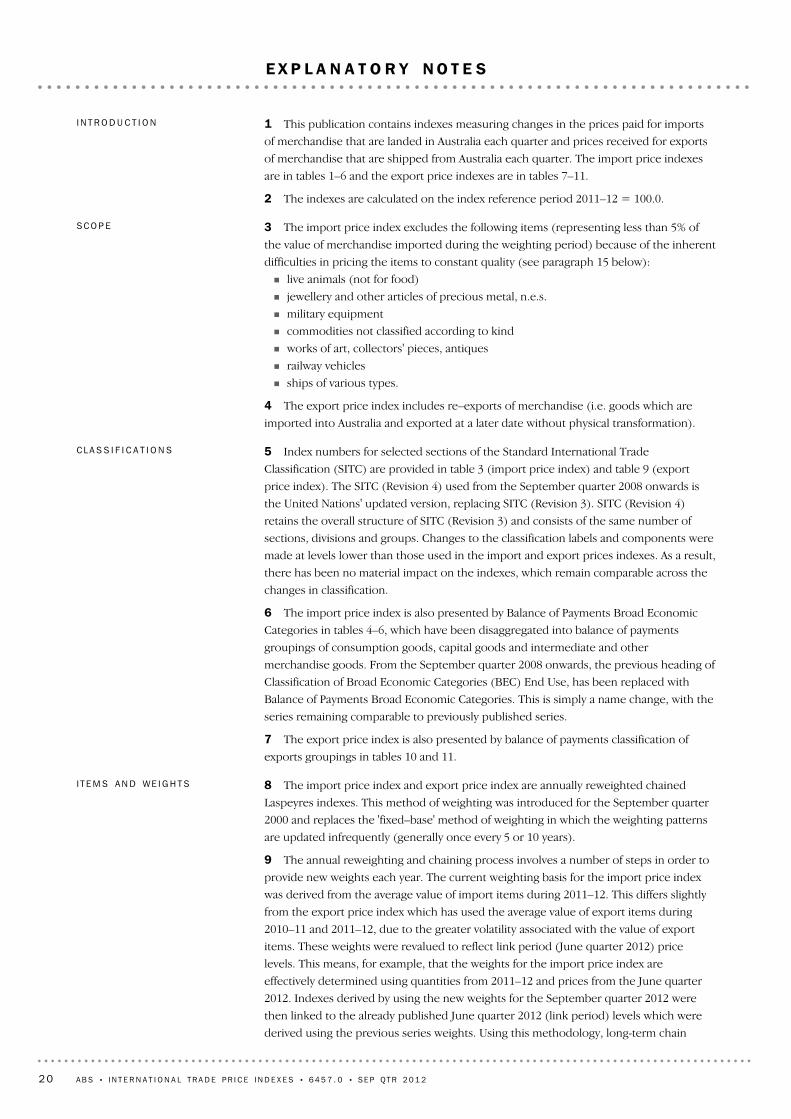
E X P L A N A T O R Y N O T E S continued
Both the Import Price Index and the Export Price Index have been reweighted in the
September quarter 2012. It is ABS practice to reweight these indexes annually each
September quarter, as explained in paragraphs 8–10 of the Explanatory Notes. The new
weighting patterns for both the Import Price Index and Export Price Index, based on the
Standard International Trade Classification (SITC) (Revision 4), are presented in this
Appendix.
All SITC sections and divisions are included in the reweighted index structure for
completeness. However, indexes for some of the lower weighted SITC divisions are not
constructed separately and so are not available for publication.
Corresponding new weighting patterns based on classification by Broad Economic
Categories (BEC), Harmonized Tariff Item Statistical Classification (HTSIC) and
Australian and New Zealand Standard Industrial Classification (ANZSIC) for the Import
Price Index and Australian Harmonised Export Commodity Classification (AHECC) and
ANZSIC for the Export Price Index can be made available on request.
CO M P O S I T I O N
24 A B S • I N T E R N A T I O N A L T R A D E P R I C E I N D E X E S • 6 4 5 7 . 0 • SE P QT R 2 0 1 2
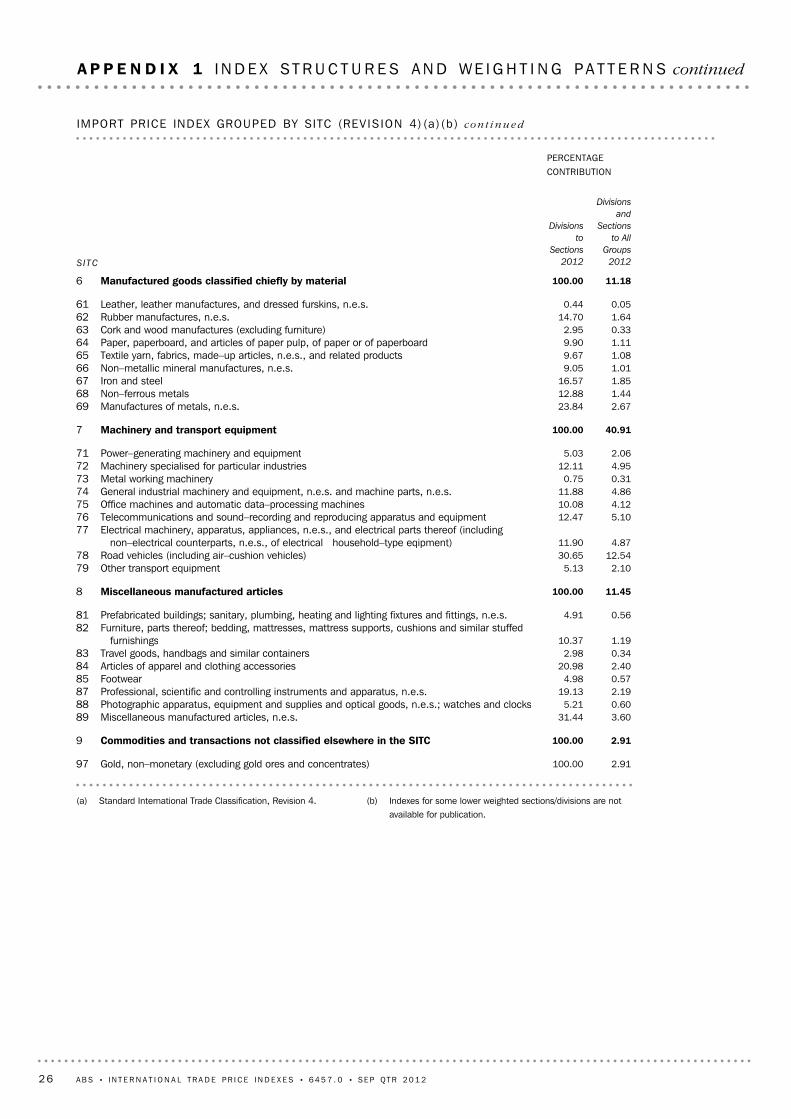
A P P E N D I X 1 I N D E X S T R U C T U R E S A N D W E I G H T I N G P A T T E R N S
(b) Indexes for some lower weighted sections/divisions are notavailable for publication.
(a) Standard International Trade Classification, Revision 4.
0.898.22Chemical materials and products, n.e.s.590.625.70Plastics in non–primary forms580.746.89Plastics in primary forms570.767.01Fertilisers (other than those of group 272)560.837.66Essential oils and resinoids and perfume materials; toilet, polishing and cleansing preparations554.7744.20Medicinal and pharmaceutical products540.262.43Dyeing, tanning and colouring materials530.686.34Inorganic chemicals521.2511.55Organic chemicals51
10.80100.00Chemicals and related products, n.e.s.5
0.0312.82Fats and oils (processed), waxes and inedible mixtures or preparations, of animal or vegetable
origin, n.e.s.43
0.1978.53Fixed vegetable fats and oils, crude, refined or fractionated420.028.65Animal oils and fats41
0.24100.00Animal and vegetable oils, fats and waxes4
1.106.67Gas, natural and manufactured3415.3893.22Petroleum, petroleum products and related materials33
0.020.11Coal, coke and briquettes32
16.50100.00Mineral fuels, lubricants and related materials3
0.1714.65Crude animal and vegetable materials, n.e.s.290.3731.85Metalliferous ores and metal scrap280.1210.57
Crude fertilisers (excluding those of Division 56) and crude minerals (excluding coal, petroleumand precious stones)
270.043.75Textile fibres and their wastes (not manufactured into yarn or fabric)260.086.53Pulp and waste paper250.2824.44Cork and wood240.076.11Crude rubber (including synthetic and reclaimed)230.021.99Oil seeds and oleaginous fruits220.000.11Hides, skins and furskins, raw21
0.1112.87Tobacco and tobacco manufactures120.7287.13Beverages11
0.83100.00Beverages and tobacco1
0.7719.04Miscellaneous edible products and preparations090.235.75Feeding stuff for animals (excluding unmilled cereals)080.6215.32Coffee, tea, cocoa, spices, and manufactures thereof070.153.76Sugars, sugar preparations and honey060.8220.42Vegetables and fruit050.307.55Cereals and cereal preparations040.5814.41
Fish (not marine mammals), crustaceans, molluscs and aquatic invertebrates, and preparationsthereof
030.317.56Dairy products and birds' eggs020.256.19Meat and meat preparations01
4.03100.00Food and live animals0
Divisions
and
Sections
to All
Groups
2012
Divisions
to
Sections
2012
PERCENTAGECONTRIBUTION
SITC
IMPORT PRICE INDEX GROUPED BY SITC (REVIS ION 4) (a) (b )
A B S • I N T E R N A T I O N A L T R A D E P R I C E I N D E X E S • 6 4 5 7 . 0 • SE P QT R 2 0 1 2 25
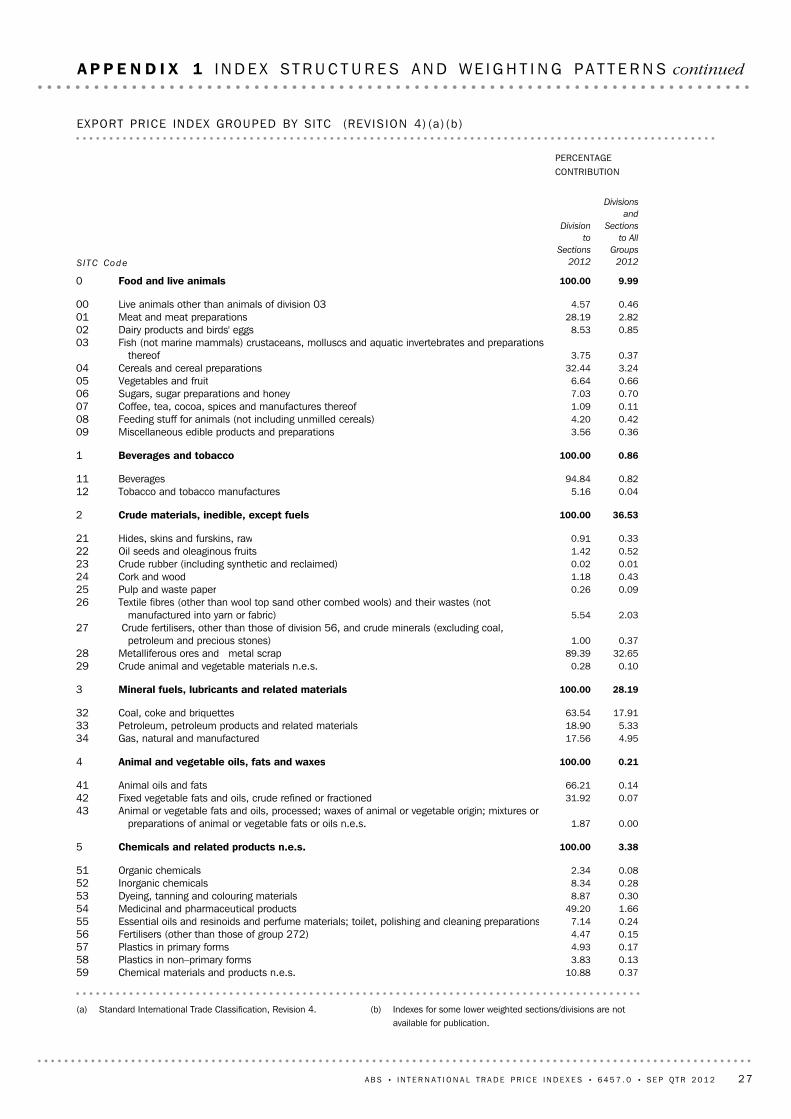
A P P E N D I X 1 I N D E X S T R U C T U R E S A N D W E I G H T I N G P A T T E R N S continued
(b) Indexes for some lower weighted sections/divisions are notavailable for publication.
(a) Standard International Trade Classification, Revision 4.
2.91100.00Gold, non–monetary (excluding gold ores and concentrates)97
2.91100.00Commodities and transactions not classified elsewhere in the SITC9
3.6031.44Miscellaneous manufactured articles, n.e.s.890.605.21Photographic apparatus, equipment and supplies and optical goods, n.e.s.; watches and clocks882.1919.13Professional, scientific and controlling instruments and apparatus, n.e.s.870.574.98Footwear852.4020.98Articles of apparel and clothing accessories840.342.98Travel goods, handbags and similar containers831.1910.37
Furniture, parts thereof; bedding, mattresses, mattress supports, cushions and similar stuffedfurnishings
820.564.91Prefabricated buildings; sanitary, plumbing, heating and lighting fixtures and fittings, n.e.s.81
11.45100.00Miscellaneous manufactured articles8
2.105.13Other transport equipment7912.5430.65Road vehicles (including air–cushion vehicles)78
4.8711.90Electrical machinery, apparatus, appliances, n.e.s., and electrical parts thereof (including
non–electrical counterparts, n.e.s., of electrical household–type eqipment)77
5.1012.47Telecommunications and sound–recording and reproducing apparatus and equipment764.1210.08Office machines and automatic data–processing machines754.8611.88General industrial machinery and equipment, n.e.s. and machine parts, n.e.s.740.310.75Metal working machinery734.9512.11Machinery specialised for particular industries722.065.03Power–generating machinery and equipment71
40.91100.00Machinery and transport equipment7
2.6723.84Manufactures of metals, n.e.s.691.4412.88Non–ferrous metals681.8516.57Iron and steel671.019.05Non–metallic mineral manufactures, n.e.s.661.089.67Textile yarn, fabrics, made–up articles, n.e.s., and related products651.119.90Paper, paperboard, and articles of paper pulp, of paper or of paperboard640.332.95Cork and wood manufactures (excluding furniture)631.6414.70Rubber manufactures, n.e.s.620.050.44Leather, leather manufactures, and dressed furskins, n.e.s.61
11.18100.00Manufactured goods classified chiefly by material6
Divisions
and
Sections
to All
Groups
2012
Divisions
to
Sections
2012
PERCENTAGECONTRIBUTION
SITC
IMPORT PRICE INDEX GROUPED BY SITC (REVIS ION 4) (a) (b ) co n t i n u e d
26 A B S • I N T E R N A T I O N A L T R A D E P R I C E I N D E X E S • 6 4 5 7 . 0 • SE P QT R 2 0 1 2
A P P E N D I X 1 I N D E X S T R U C T U R E S A N D W E I G H T I N G P A T T E R N S continued
(b) Indexes for some lower weighted sections/divisions are notavailable for publication.
(a) Standard International Trade Classification, Revision 4.
0.3710.88Chemical materials and products n.e.s.590.133.83Plastics in non–primary forms580.174.93Plastics in primary forms570.154.47Fertilisers (other than those of group 272)560.247.14Essential oils and resinoids and perfume materials; toilet, polishing and cleaning preparations551.6649.20Medicinal and pharmaceutical products540.308.87Dyeing, tanning and colouring materials530.288.34Inorganic chemicals520.082.34Organic chemicals51
3.38100.00Chemicals and related products n.e.s.5
0.001.87Animal or vegetable fats and oils, processed; waxes of animal or vegetable origin; mixtures or
preparations of animal or vegetable fats or oils n.e.s.43
0.0731.92Fixed vegetable fats and oils, crude refined or fractioned420.1466.21Animal oils and fats41
0.21100.00Animal and vegetable oils, fats and waxes4
4.9517.56Gas, natural and manufactured345.3318.90Petroleum, petroleum products and related materials33
17.9163.54Coal, coke and briquettes32
28.19100.00Mineral fuels, lubricants and related materials3
0.100.28Crude animal and vegetable materials n.e.s.2932.6589.39Metalliferous ores and metal scrap 28
0.371.00 Crude fertilisers, other than those of division 56, and crude minerals (excluding coal,
petroleum and precious stones)27
2.035.54Textile fibres (other than wool top sand other combed wools) and their wastes (not
manufactured into yarn or fabric)26
0.090.26Pulp and waste paper250.431.18Cork and wood240.010.02Crude rubber (including synthetic and reclaimed)230.521.42Oil seeds and oleaginous fruits220.330.91Hides, skins and furskins, raw21
0.045.16Tobacco and tobacco manufactures120.8294.84Beverages11
0.86100.00Beverages and tobacco1
0.363.56Miscellaneous edible products and preparations090.424.20Feeding stuff for animals (not including unmilled cereals)080.111.09Coffee, tea, cocoa, spices and manufactures thereof070.707.03Sugars, sugar preparations and honey060.666.64Vegetables and fruit053.2432.44Cereals and cereal preparations040.373.75
Fish (not marine mammals) crustaceans, molluscs and aquatic invertebrates and preparationsthereof
030.858.53Dairy products and birds' eggs022.8228.19Meat and meat preparations010.464.57Live animals other than animals of division 0300
9.99100.00Food and live animals 0
Divisions
and
Sections
to All
Groups
2012
Division
to
Sections
2012
PERCENTAGECONTRIBUTION
SITC Code
EXPORT PRICE INDEX GROUPED BY SITC (REVIS ION 4) (a) (b )
A B S • I N T E R N A T I O N A L T R A D E P R I C E I N D E X E S • 6 4 5 7 . 0 • SE P QT R 2 0 1 2 27
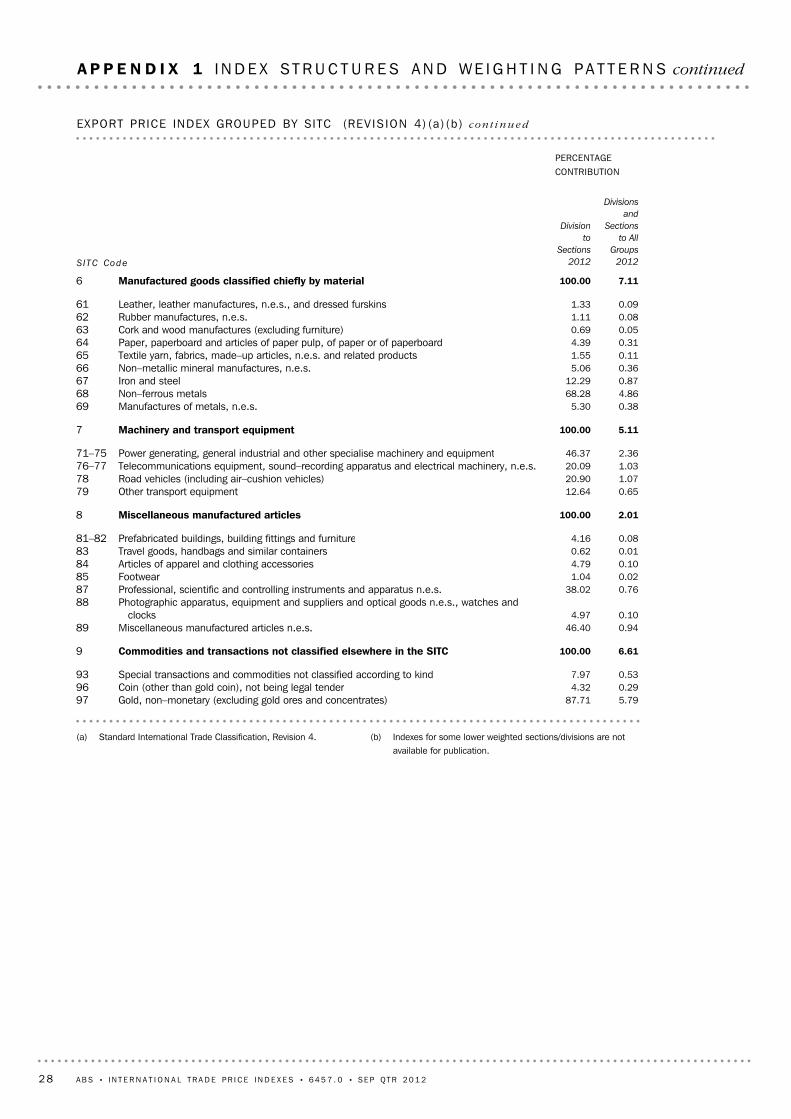
A P P E N D I X 1 I N D E X S T R U C T U R E S A N D W E I G H T I N G P A T T E R N S continued
(b) Indexes for some lower weighted sections/divisions are notavailable for publication.
(a) Standard International Trade Classification, Revision 4.
5.7987.71Gold, non–monetary (excluding gold ores and concentrates)970.294.32Coin (other than gold coin), not being legal tender960.537.97Special transactions and commodities not classified according to kind93
6.61100.00Commodities and transactions not classified elsewhere in the SITC9
Photographic apparatus, equipment and suppliers and optical goods n.e.s., watches andclocks
880.7638.02Professional, scientific and controlling instruments and apparatus n.e.s.870.021.04Footwear850.104.79Articles of apparel and clothing accessories840.010.62Travel goods, handbags and similar containers830.084.16Prefabricated buildings, building fittings and furniture81–82
2.01100.00Miscellaneous manufactured articles8
0.6512.64Other transport equipment791.0720.90Road vehicles (including air–cushion vehicles)781.0320.09Telecommunications equipment, sound–recording apparatus and electrical machinery, n.e.s.76–772.3646.37Power generating, general industrial and other specialise machinery and equipment71–75
5.11100.00Machinery and transport equipment7
0.385.30Manufactures of metals, n.e.s.694.8668.28Non–ferrous metals680.8712.29Iron and steel670.365.06Non–metallic mineral manufactures, n.e.s.660.111.55Textile yarn, fabrics, made–up articles, n.e.s. and related products650.314.39Paper, paperboard and articles of paper pulp, of paper or of paperboard640.050.69Cork and wood manufactures (excluding furniture)630.081.11Rubber manufactures, n.e.s.620.091.33Leather, leather manufactures, n.e.s., and dressed furskins61
7.11100.00Manufactured goods classified chiefly by material6
Divisions
and
Sections
to All
Groups
2012
Division
to
Sections
2012
PERCENTAGECONTRIBUTION
SITC Code
EXPORT PRICE INDEX GROUPED BY SITC (REVIS ION 4) (a) (b ) co n t i n u e d
28 A B S • I N T E R N A T I O N A L T R A D E P R I C E I N D E X E S • 6 4 5 7 . 0 • SE P QT R 2 0 1 2
A P P E N D I X 1 I N D E X S T R U C T U R E S A N D W E I G H T I N G P A T T E R N S continued
6 For example, for the Import Price Index; All Groups an arithmetic conversion factor is
Our consultants can help you access the full range ofinformation published by the ABS that is available free ofcharge from our website. Information tailored to yourneeds can also be requested as a 'user pays' service.Specialists are on hand to help you with analytical ormethodological advice.
I N F O R M A T I O N A N D R E F E R R A L S E R V I C E
www.abs.gov.au the ABS website is the best place fordata from our publications and information about the ABS.


![121319 - INDEXES - World Charting REPORT+ - INDEXES - World... · Pitchforks, Gann & Jenkins Tools”, March/April, Your Trading Edge, Sydney, Australia Dologa, Mircea [2017]. “Trading](https://static.documents.pub/doc/80x56/5ec8542ba0441d6d4b5dfde6/121319-indexes-world-charting-report-indexes-world-pitchforks-gann.jpg)
