18
International Wealth Index (IWI) Jeroen Smits Global Data Lab / Nijmegen Center for Economics Radboud University, The Netherlands [email protected]

International Wealth Index
(IWI)
Jeroen Smits
Global Data Lab / Nijmegen Center for Economics
Radboud University, The Netherlands

This presentation
• Welfare measurement in poor countries
• Asset based wealth indices
• International Wealth Index (IWI)
• Reliability tests of IWI
• Comparison with other measures
• Poverty measurement

Measuring the economic situation of households
in poor countries
• Income
- Often unstable
- Not always in cash
- Reporting errors
• Consumption/expenditure
- Expensive surveys
- Comparability issues
- Reporting errors
• Alternative: Asset based wealth index
Asset based wealth indices
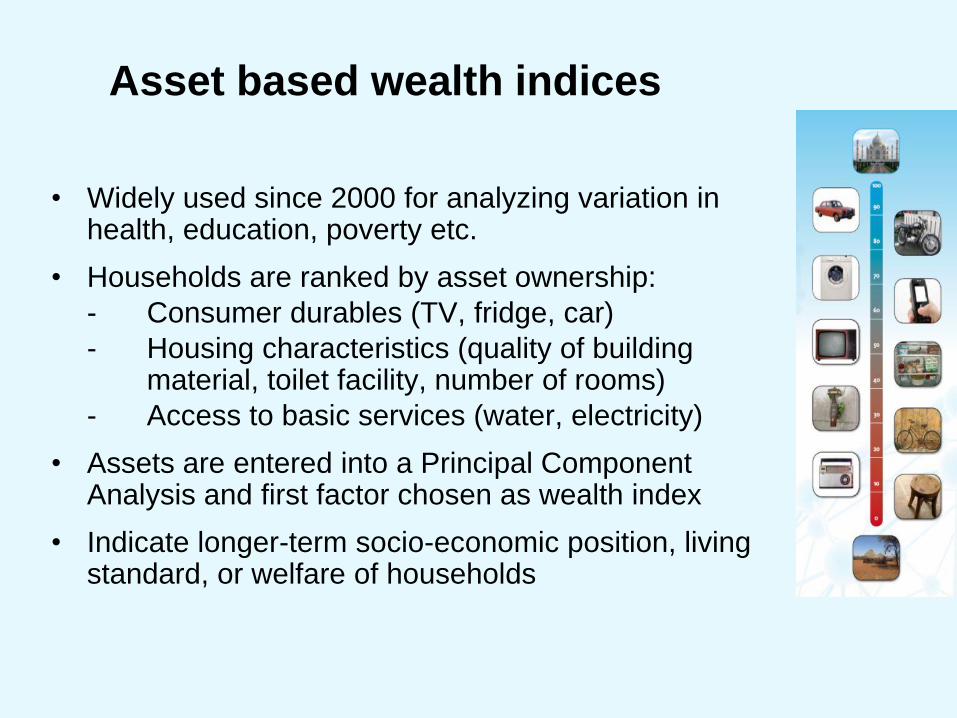
• Widely used since 2000 for analyzing variation in health, education, poverty etc.
• Households are ranked by asset ownership:
- Consumer durables (TV, fridge, car)
- Housing characteristics (quality of building material, toilet facility, number of rooms)
- Access to basic services (water, electricity)
• Assets are entered into a Principal Component Analysis and first factor chosen as wealth index
• Indicate longer-term socio-economic position, living standard, or welfare of households
Advantages of wealth indices
• Reliability of measurement: Assets included are
easily observable by interviewer
• Intuitive appeal: These are assets that the large
majority of us wants to own (or at least buys when
having the possibility)
• Ease of computation: Asset coefficients are added
up to get the index
• Widely available in household surveys for developing
countries (DHS, MICS)
• Very much used!
Disadvantages of existing indices
• For each survey a new index is constructed on the basis of the
available assets (which differ between surveys).
• Indices are completely tailored towards the situation in the
country/year for which they are made
• Wealth index is standardized variable, values of households
have no absolute meaning.
• Meaning is usually given by dividing values into quintiles, with
the lowest quintile including the 20 percent poorest households
and the highest quintile the 20 percent richest households.
• However, lowest quintile in Ethiopia much poorer than lowest
quintile in Malaysia.
Conclusion: Available indices are not comparable across
countries and years
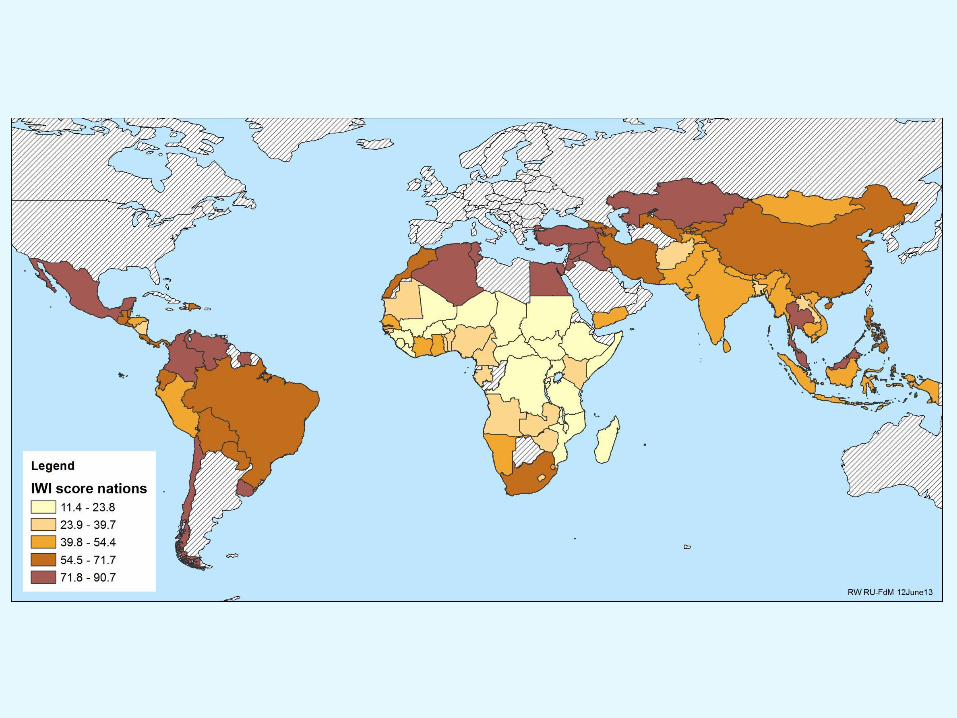
International Wealth Index (IWI)
• First strictly comparable index that can be used for all low and
middle income countries
• Construction similar to traditional wealth indices, but using data
from many surveys instead of one
• Data on 2.1 million households derived from 165 surveys held
between 1996 and 2011 in 97 developing countries
• A household’s ranking on IWI indicates to what extent the
household possesses a basic set of assets, valued highly by
people across the globe
• Any household for which the required asset information is
available can be ranked on IWI and any household with the
same combination of assets is ranked the same.

Assets included
• Whether a household or one of its members owns a
TV, Refrigerator, Phone, Car, Bicycle, Cheap utensil,
Expensive utensil (yes/no)
• Access to electricity (yes/no)
• Quality of Floor material, Toilet facility, Water supply
(low, middle, high quality)
• Number of rooms for sleeping (0 or 1, 2, 3 or more)
• 12 assets measured by 20 indicators
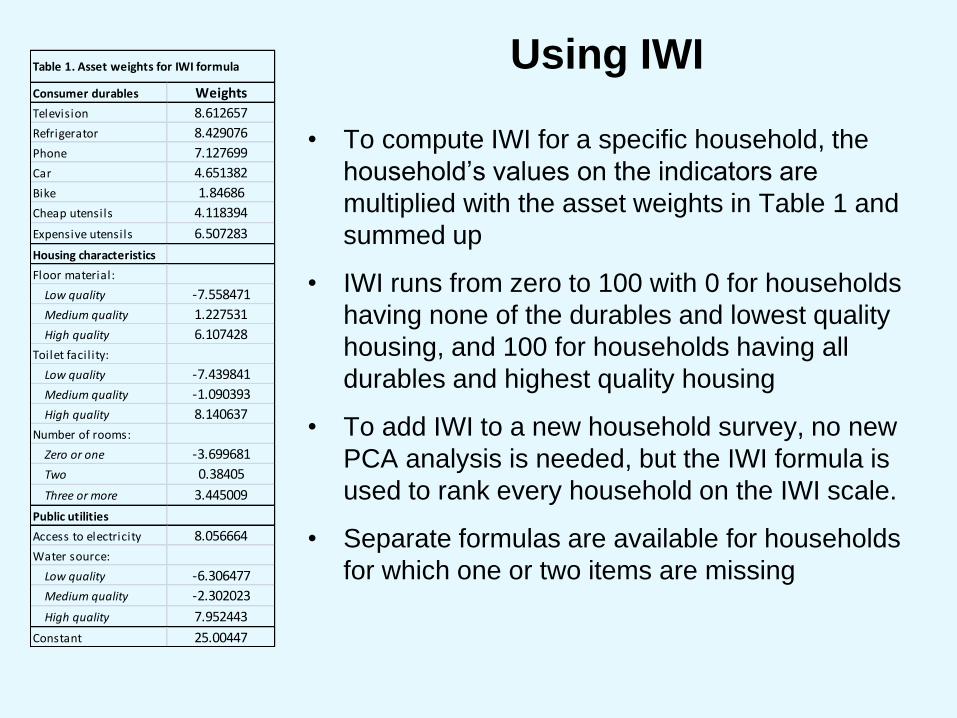
Consumer durables Weights
Television 8.612657
Refrigerator 8.429076
Phone 7.127699
Car 4.651382
Bike 1.84686
Cheap utensils 4.118394
Expensive utensils 6.507283
Housing characteristics
Floor material:
Low quality -7.558471
Medium quality 1.227531
High quality 6.107428
Toilet facil ity:
Low quality -7.439841
Medium quality -1.090393
High quality 8.140637
Number of rooms:
Zero or one -3.699681
Two 0.38405
Three or more 3.445009
Public utilities
Access to electricity 8.056664
Water source:
Low quality -6.306477
Medium quality -2.302023
High quality 7.952443
Constant 25.00447
Table 1. Asset weights for IWI formula
• To compute IWI for a specific household, the
household’s values on the indicators are
multiplied with the asset weights in Table 1 and
summed up
• IWI runs from zero to 100 with 0 for households
having none of the durables and lowest quality
housing, and 100 for households having all
durables and highest quality housing
• To add IWI to a new household survey, no new
PCA analysis is needed, but the IWI formula is
used to rank every household on the IWI scale.
• Separate formulas are available for households
for which one or two items are missing
Using IWI
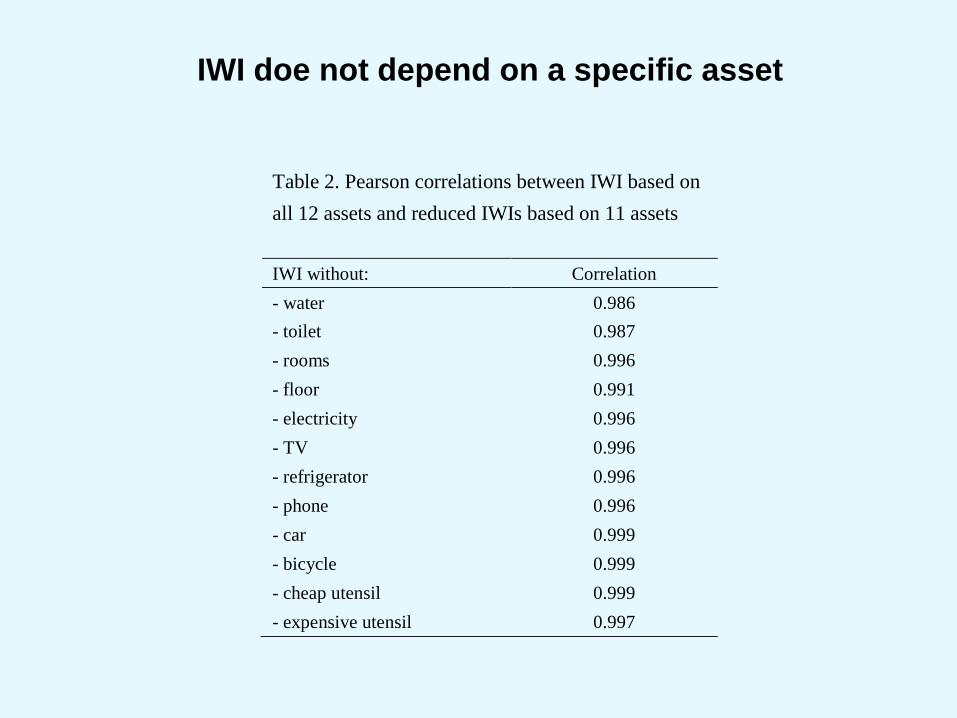
Table 2. Pearson correlations between IWI based on
all 12 assets and reduced IWIs based on 11 assets
IWI without: Correlation
- water 0.986
- toilet 0.987
- rooms 0.996
- floor 0.991
- electricity 0.996
- TV 0.996
- refrigerator 0.996
- phone 0.996
- car 0.999
- bicycle 0.999
- cheap utensil 0.999
- expensive utensil 0.997
IWI doe not depend on a specific asset
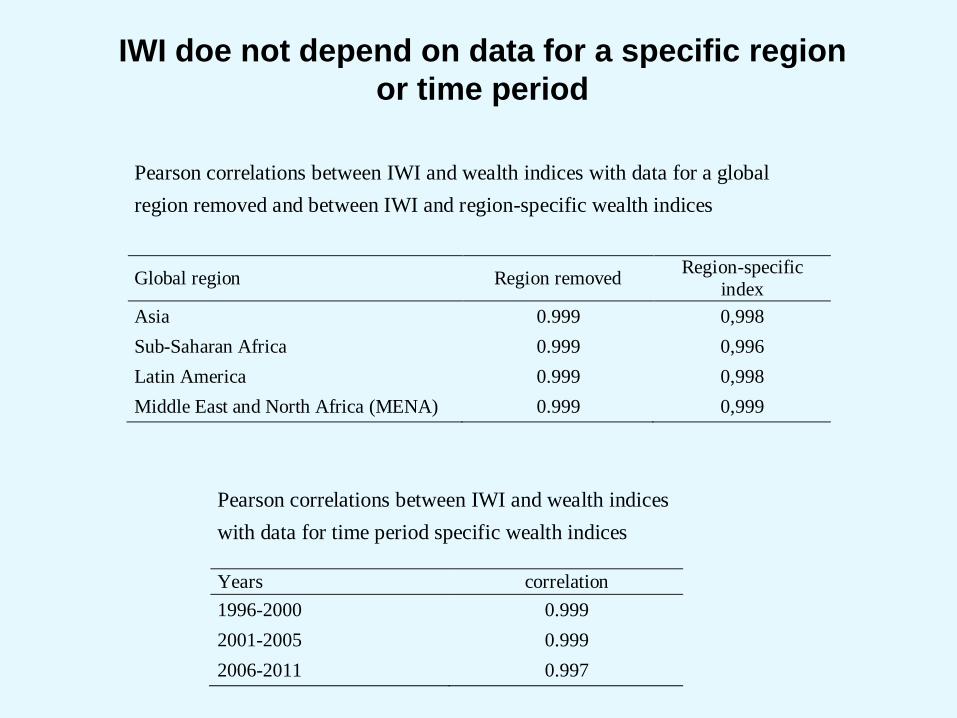
IWI doe not depend on data for a specific region
or time period
Pearson correlations between IWI and wealth indices
with data for time period specific wealth indices
Years correlation
1996-2000 0.999
2001-2005 0.999
2006-2011 0.997
Pearson correlations between IWI and wealth indices with data for a global
region removed and between IWI and region-specific wealth indices
Global region Region removed Region-specific
index
Asia 0.999 0,998
Sub-Saharan Africa 0.999 0,996
Latin America 0.999 0,998
Middle East and North Africa (MENA) 0.999 0,999

Correlations with HDI and components
Table 4. Pearson correlations of IWI with HDI and its components
IWI
Life expectancy
a .841 Life exp
GNIc
a .788 .672 GNIc
Exp. years of education
a .720 .651 .682 Exp. edu
Mean years of education
b .658 .559 .538 .728 Mean edu
HDIb .899 .870 .835 .833 .808
a N=87
b N=85
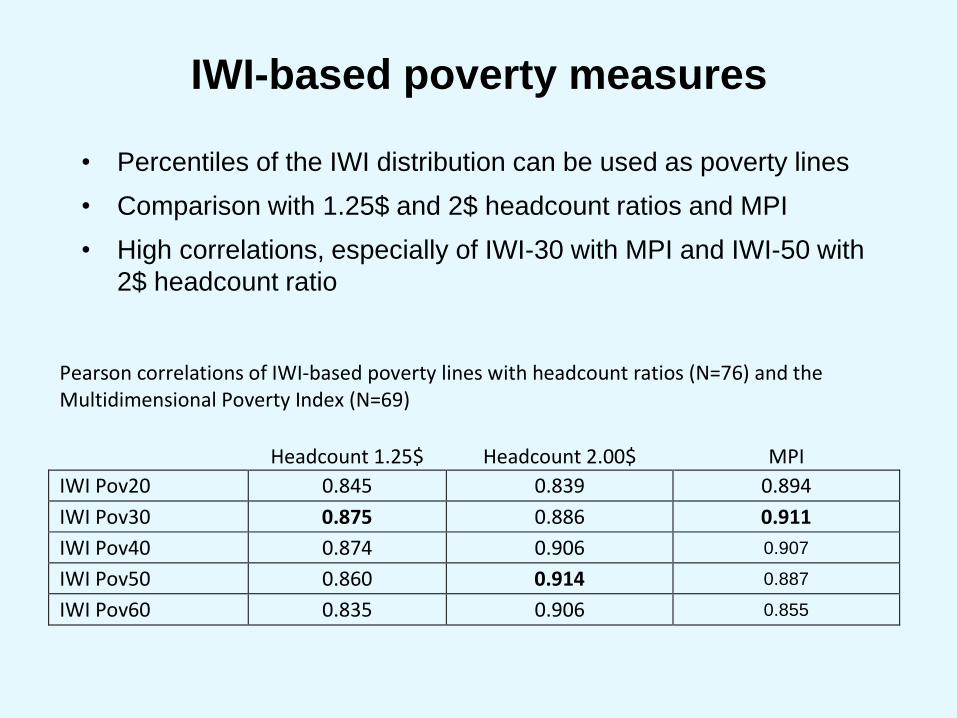
IWI-based poverty measures
• Percentiles of the IWI distribution can be used as poverty lines
• Comparison with 1.25$ and 2$ headcount ratios and MPI
• High correlations, especially of IWI-30 with MPI and IWI-50 with
2$ headcount ratio
Pearson correlations of IWI-based poverty lines with headcount ratios (N=76) and the Multidimensional Poverty Index (N=69)
Headcount 1.25$ Headcount 2.00$ MPI
IWI Pov20 0.845 0.839 0.894
IWI Pov30 0.875 0.886 0.911
IWI Pov40 0.874 0.906 0.907
IWI Pov50 0.860 0.914 0.887
IWI Pov60 0.835 0.906 0.855


Conclusions
• IWI is a simple, understandable and stable indicator of the
economic situation of households, regions and countries across
the developing world
• Test analyses show that IWI hardly depends on the inclusion of a
specific asset, nor on data for a specific region or time period
• The stability might mean that there is some kind of universal
human asset preference that does not differ much across place
and time
• IWI is highly correlated with the HDI and its components
• IWI can be used to create poverty measures that are highly
correlated with headcount ratios and MDI
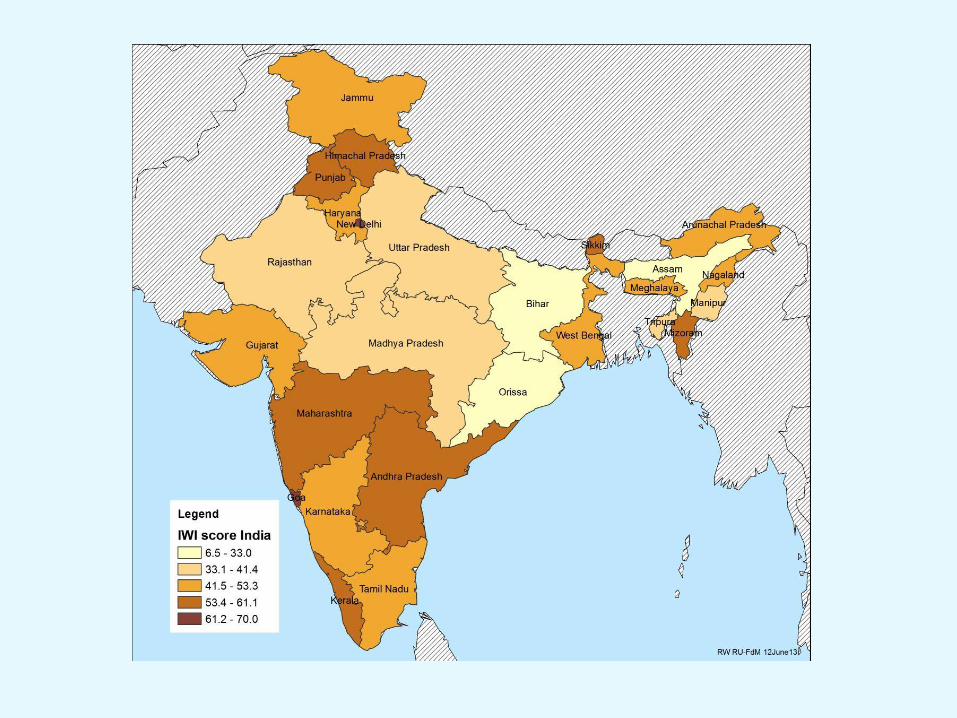
• IWI can be used for studying sub-national differences and trends
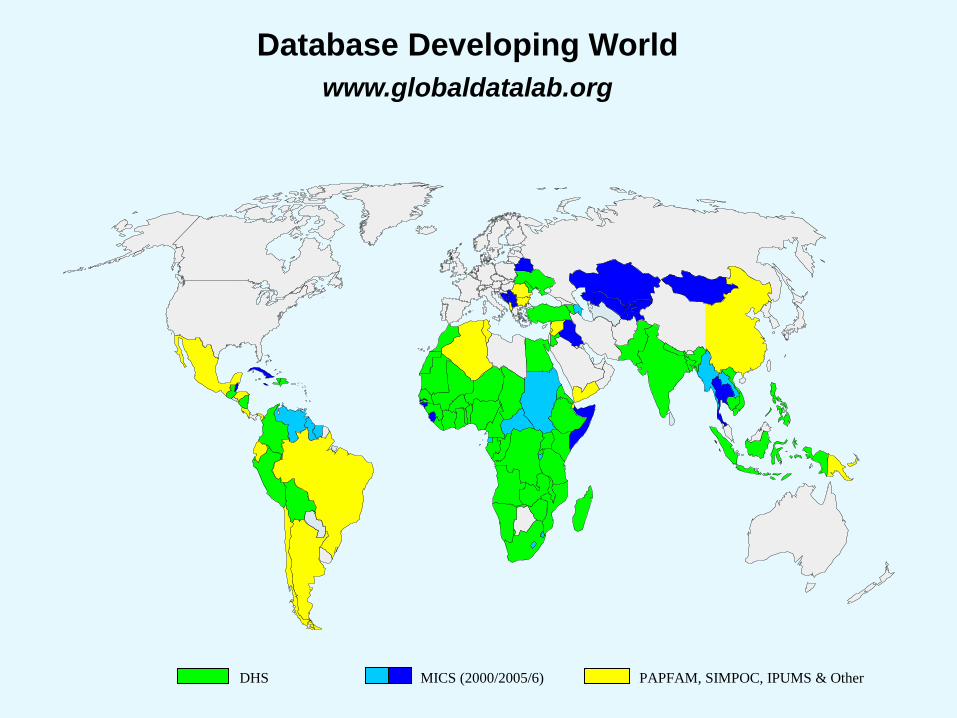
Database Developing World
www.globaldatalab.org
DHS MICS (2000/2005/6) PAPFAM, SIMPOC, IPUMS & Other


