152
18, rue d‟Aguesseau F-75008 – PARIS France Tél. + 33 01 42 68 82 48 Fax + 33 01 40 06 06 98 www.fivs.org International Wine Carbon Calculator Protocol Version 1.2

18, rue d‟Aguesseau
F-75008 – PARIS
France Tél. + 33 01 42 68 82 48 Fax + 33 01 40 06 06 98
www.fivs.org
International Wine Carbon Calculator
Protocol
Version 1.2

page 2 of 152
Acknowledgements Provisor Pty Ltd was contracted by several national agencies – The Wine Institute of California, New Zealand Winegrowers, Integrated Production of Wine South Africa and the Winemakers Federation of Australia – to develop Version 1.0 of the International Wine Carbon Calculator (IWCC) by the end of 2007 and version 1.1 by February 2008. Version 1.2 was released in July 2008.
Provisor wishes to acknowledge the help and support of several key people and organisations who have helped and participated in the development of this Protocol and Calculator. We wish to acknowledge the significant support received from our partner in this project, Yalumba Wines. The significant environmental heritage of Yalumba Wines provided us with a solid foundation on which to begin this project. In particular we acknowledge the guidance and support of Cecil Camilleri, Senior Technical Manager, Environmental Matters at Yalumba Wines. In addition, we wish to thank the Wine Industry Greenhouse Gas Project Team who initiated this project and who have offered significant help in the form of critique and as a channel for providing industry feedback throughout the project development. The Project Team members are:
Bob Calvin, Wine Institute, California, USA;
Wendy Garcia, Wine Institute, California, USA;
Allison Jordan, California Sustainable Winegrowing Alliance, California, USA.
Philip Manson, New Zealand Wine Growers, Auckland, New Zealand;
John Nagle, Wine Institute, California, USA;
Jacques Rossouw, Integrated Production of Wine in South Africa, Stellenbosch, South Africa;
Amy Russell, Winemakers‟ Federation of Australia, Adelaide, Australia; and
Chris Savage, Wine Institute, California, USA;

page 3 of 152
Summary This Protocol and associated Excel spreadsheet based Calculator form Version 1.2 of the IWCC. The Protocol and Calculator are designed primarily as an enterprise and/or facility level calculating tool for the International Wine Industry in compliance with current international standards and practices for Greenhouse Gas accounting. It is not expected that the use of this Protocol will define product level carbon emissions to the extent necessary to satisfy the expected international standards for lifecycle analysis. However, it will provide general guidance on the significant emissions associated with individual products. The Calculator breaks emissions into three levels: Scope 1; Scope 2; and Scope 3. Scope 1 emissions are those over which a company has direct control via ownership of activities. Scope 2 is purchased electricity, heat or steam and Scope 3 is the emissions from all activities that are purchased from other companies. This separation of Scopes is critical to manage mandatory reporting. Scope 1 and Scope 2 are included in almost all mandatory and voluntary reporting schemes. The separation of Scopes ensures that no double accounting occurs at the regional level when greenhouse gas emissions are aggregated from many companies. Scope 1 and Scope 2 are typically the emissions that are used when companies calculate a carbon footprint and develop plans to minimise their carbon impact. Scope 3 emissions can be included in reporting and may be included in carbon footprint processes, but are not necessary and must remain separated. Scope 3 emissions are part of the product lifecycle and critical for calculating and managing lifecycle and value-chain emissions. In the wine industry, where transport and packaging are large components of the carbon footprint, a carbon calculator will not be complete without accounting for these. A particular concern is the impact of the proposed British Standard PAS 2050 on Greenhouse Gas reporting and the Scope 3 element of the Calculator is specifically designed to meet the expected demands of this standard. The uses of the tool for Scope 1 and Scope 2 reporting, understanding value chains and setting a framework for the British Standard approach to product entrained carbon has dictated the inclusions and exclusions. Overall, we have included sources of emission that constitute more than 1% of the mass of the product or more than 1% of the Greenhouse Gas emissions. Mass is often used to estimate emissions where data are unavailable. This approach meets the requirements of PAS 2050 as currently drafted and conforms to common practice for streamlined life cycle assessment. The approach is only semi-quantitative and some rules of thumb have been applied. As a result, we have excluded: all elements of the short-term carbon cycle; land use change; infrastructure items such as tanks and machinery, including posts and wire; business travel of employees; and the majority of chemicals used in winemaking and viticulture. We have included, at this stage, bentonite, tartaric acid and barrel products. It is unknown whether these products are significant. A sensitivity analysis will be used to determine if they should be included in the long-term.

page 4 of 152
The exclusion of elements of the short-term carbon cycle results in the exclusion of carbon dioxide emissions from winemaking, sequestration into grapes, carbon dioxide from the breakdown of vine prunings, carbon dioxide (but not methane) from waste degradation and wastewater treatment. Carbon dioxide from winemaking and carbon sequestration in grapes are calculated, but not included in Scope 1, 2 or 3 reporting. Several of the items that have been included need to have data quality issues addressed. In particular nitrous oxide generation, vineyard biomass photosynthesis, and vineyard soils sequestration have been identified as areas where research is needed to improve the quality of the model. Other areas where improved data will be needed are organic waste emissions, most packaging, pallets, bentonite, tartaric acid and barrels. The tool is structured so that it can be used by several types of wine production companies including; grapegrowing only operations; winemaking only operations; bottling only operations; grapegrowing and winemaking; winemaking and bottling; and grapegrowing, winemaking and bottling. It can account for contract grown grape intake as well as estate grown, contract winemaking in addition to estate winemaking and a mix of estate and contract bottling. In version 1.1 a capability to report to the Californian AB32 requirement was added. The calculation methodology uses an activity based approach where corporate activity like fuel use or glass purchased are accounted then input into the Calculator. This activity data is then either multiplied by an emission factor or input into an emission model. This has the benefit of reducing or eliminating the need for companies to measure emissions directly and ensures that the wine industry works on a common accounting basis. Quality assurance (QA) is an important element of the Calculator. QA will be required for the emission factors and for the emission models entrained in the Calculator as well as in the activity data prepared by companies. The QA system for the data is based on a data quality ranking system, with rankings from A to F. A ranking of X has also been used to designate where inadequate data is available and more research, investigation or development is required to improve the underlying accuracy of the Calculator. Users of the Protocol and Calculator will also need to develop QA systems to ensure that they use the tool consistently and to ensure that the data they enter into the activity component of the Calculator is reliable. It is considered that activity data is the component of Calculator data that is most prone to error. We have assumed that continuous improvement will be an important component of the Calculator and have outlined specific areas where we consider the continuous improvement will need to be adopted, including: incorporation of feed-back from users; sensitivity analysis to determine if all sources currently measured are needed; effective version roll management; continuous improvement of emission data and models; ability to conduct trend analysis at a company and industry level; ability to incorporate industry KPI‟s and ongoing training of users on changes in accounting approaches and improvements in the Calculator.

page 5 of 152
The Protocol report outlines the calculation methodology used in the development of the Calculator. All assumptions and equations are outlined, for the purpose of external scrutiny or peer review. All emission factors or emission models are included for comment or revision within the appendices of this report. An instructional section is included, with the intention of providing some guidance to the use of the Calculator.

page 6 of 152
Contents 1 Introduction to Greenhouse Gas Accounting ................................................................ 12
1.1 Setting Organisational Boundaries .............................................................................. 13 1.2 Setting Operational Boundaries ................................................................................... 13 1.3 Scope and Scope Classification Defined .................................................................... 13
1.3.1 Scope 1: Direct Greenhouse Gas Emissions ..................................................... 14 1.3.2 Scope 2: Purchased Power Utility ........................................................................ 15 1.3.3 Scope 3: Indirect Greenhouse Gas Emissions .................................................. 15
1.4 Implications of the PAS 2050:2008 for the International Wine Carbon Calculator 17 1.5 Understanding the Short-term Carbon Cycle ............................................................ 18
1.5.1 The Short-term Carbon Cycle .............................................................................. 18 2 Developing a Wine Industry Specific Protocol .............................................................. 20
2.1 Understanding the Supply Chain ................................................................................. 20 2.2 Defining Organisational Boundaries ........................................................................... 21 2.3 Defining the Process Boundaries ................................................................................ 21
2.3.1 Stand Alone Vineyard Process Boundary ........................................................... 23 2.3.2 Stand Alone Winery ............................................................................................... 24 2.3.3 Standalone Packaging Centre ............................................................................... 25 2.3.4 Joint Ownership of Vineyard and Winery .......................................................... 26 2.3.5 Joint Ownership of Vineyard, Winery and Bottling Hall ................................. 27
3 Protocol Inclusions and Exclusions ................................................................................. 28 3.1 Scope 1 ............................................................................................................................ 28
3.1.1 Generation of Heat, Steam or Electricity ........................................................... 28 3.1.2 Physical or Chemical Processing .......................................................................... 28
3.2 Scope 2 ............................................................................................................................ 30 3.2.1 Purchased Electrical Power .................................................................................. 30
3.3 Scope 3 ............................................................................................................................ 30 3.3.1 Exclusion of Infrastructure .................................................................................. 30 3.3.2 Purchased Products ............................................................................................... 31 3.3.3 Contract Machinery ............................................................................................... 33 3.3.4 Wine Related Products .......................................................................................... 33 3.3.5 Transport Related Activities ................................................................................. 33 3.3.6 Transmission and Distribution Losses................................................................ 34 3.3.7 “Product In Use” Phase ........................................................................................ 34 3.3.8 Waste Disposal ....................................................................................................... 34
3.4 Packaging Mass Fractions ............................................................................................. 35 4 Reporting and Regulatory Obligations ............................................................................ 37
4.1 United States (California) .............................................................................................. 37 4.1.1 Regulations .............................................................................................................. 37 4.1.2 Reporting ................................................................................................................. 37 4.1.3 Future ....................................................................................................................... 38
4.2 Australia........................................................................................................................... 39 4.2.1 Regulation................................................................................................................ 39 4.2.2 Reporting ................................................................................................................. 39
4.3 New Zealand .................................................................................................................. 40 4.3.1 Regulations .............................................................................................................. 40

page 7 of 152
4.3.2 Reporting ................................................................................................................. 40 4.4 Republic of South Africa .............................................................................................. 41
4.4.1 Regulations .............................................................................................................. 41 4.4.2 Reporting ................................................................................................................. 42
4.5 PAS 2050 ......................................................................................................................... 42 5 Calculation Methodology ................................................................................................... 46
5.1 Mobile Fuel Quantity Consumed ................................................................................ 46 5.2 Distance Travelled ......................................................................................................... 49 5.3 Stationary Combustion ................................................................................................. 49 5.4 Fugitive Emissions......................................................................................................... 51 5.5 Winemaking Practices ................................................................................................... 52 5.6 Vineyard Practices ......................................................................................................... 53
5.6.1 Nitrous Oxide Emission ....................................................................................... 53 5.6.2 Row Cropping ........................................................................................................ 55
5.7 Biomass Photosynthesis ................................................................................................ 56 5.8 Waste Disposal ............................................................................................................... 57
5.8.1 Solid Waste .............................................................................................................. 57 5.8.2 Wastewater Treatment........................................................................................... 58
5.9 Purchased Power ........................................................................................................... 59 5.10 Packaging ...................................................................................................................... 61
5.10.1 Bottles and Containers ........................................................................................ 61 5.10.2 Wine Bags .............................................................................................................. 62 5.10.3 Closures ................................................................................................................. 62 5.10.4 Fibre Packaging .................................................................................................... 62 5.10.5 Wooden Products ................................................................................................ 62
5.11 Contract Equipment .................................................................................................... 62 5.12 Scope 3 Transport ....................................................................................................... 63
5.12.1 Road-Based Transport ........................................................................................ 63 5.12.2 Rail Transport ....................................................................................................... 64 5.12.3 Air Transport ........................................................................................................ 64 5.12.4 Shipping Transport .............................................................................................. 66
5.13 Purchased Wine Related Products ............................................................................ 66 5.14 Scope 3 Waste .............................................................................................................. 66 5.15 Summation Sheet ......................................................................................................... 66
6 AB32 Calculation Methodology ........................................................................................ 68 6.1 AB32 Stationary Combustion ...................................................................................... 68 6.2 Mobile Fuel Quantity Consumed AB32 ..................................................................... 68 6.3 AB32 Summation ........................................................................................................... 71
7 Quality Assurance, Quality Management and Uncertainty Assessment ..................... 72 7.1 Management of uncertainty in Greenhouse Gas Reporting .................................... 72
7.1.1 Scientific Uncertainty ............................................................................................. 72 7.1.2 Estimation Uncertainty ......................................................................................... 73 7.1.3 Model Uncertainty ................................................................................................. 73 7.1.4 Parameter Uncertainty ........................................................................................... 73
7.2 The IWCC Quality Assurance Approach ................................................................... 74 7.2.1 Activity data Quality Assurance ........................................................................... 74 7.2.2 Continuous improvement program for International Wine Carbon Calculator ............................................................................................................................. 75 7.2.3 Rate and document the quality of all models and emission factors ................ 75

page 8 of 152
7.2.4 Prioritised elements ................................................................................................ 76 7.3 Ranking of Existing Models and Emission Factors ................................................. 78
8 User Guidelines ................................................................................................................... 92 8.1 General Instructions to the Calculator ....................................................................... 92 8.2 Calculation Requirements and Outcomes .................................................................. 92 8.3 Flow Chart AB32 Approach ........................................................................................ 94 Flow Chart Embodied Carbon – PAS 2050 Approach ..................................................... 95 8.4 Flow Chart WRI Scope 1 and 2 Approach ................................................................ 95 8.4 Flow Chart WRI Scope 1 and 2 Approach ................................................................ 96 8.5 Calculator Instructions and Basic Methodology ....................................................... 97 8.6 Introduction Sheet ......................................................................................................... 97 8.7 Fuel Quantity Consumed .............................................................................................. 97 8.8 Distance Travelled ......................................................................................................... 98 8.9 Stationary Combustion ................................................................................................. 98 8.10 Fugitive Emissions ...................................................................................................... 98
8.10.1 Recharge Weight .................................................................................................. 99 8.10.2 Default Fugitive Losses ....................................................................................... 99
8.11 Winemaking Practices ................................................................................................. 99 8.12 Biomass Photosynthesis ............................................................................................. 99 8.13 Vineyard Practices .................................................................................................... 100 8.14 Scope 1 Waste Disposal ........................................................................................... 100 8.15 Scope 2 Purchased Power ....................................................................................... 100 8.16 Scope 3 Packaging .................................................................................................... 100 8.17 Scope 3 Contract Machinery ................................................................................... 101 8.18 Scope 3 Transport .................................................................................................... 101 8.19 Scope 3 Purchased Wine Products ........................................................................ 101 8.20 Scope 3 Waste Disposal ........................................................................................... 102
9 Bibliography ...................................................................................................................... 103 10 Appendices ........................................................................................................................ 106
10.1 Appendix A: Fuel Emission Factors ...................................................................... 106 10.2 Appendix B: Vehicle Efficiency ............................................................................. 107 10.3 Appendix C: Stationary Combustion ..................................................................... 122 10.4 Appendix D: Fugitive Emissions ........................................................................... 123 10.5 Appendix E: Electrical Generation Emission Factors ........................................ 124 10.6 Appendix F: Packaging Emission Factors ............................................................ 126 10.7 Appendix H: Full Size Diagrams Supply Chains ................................................. 128 10.8 Appendix I: Excel Calculator .................................................................................. 135

page 9 of 152
Figures
Figure 1: Pictorial Representation of Scope (World Resources Institue 2004) ................... 14
Figure 2: The Carbon Cycle (NASA) ........................................................................................ 18
Figure 3: Vineyard Supply Chain Highlighting Fuel and Energy Inputs (See Appendix H) ........................................................................................................................................................ 20
Figure 4: Supply Chain Overview for Winery and Packaging Centre (See Appendix H) . 21
Figure 5: Vineyard Operation Only Process Boundaries (See Appendix H) ...................... 23
Figure 6: Standalone Winery Process Boundaries (See Appendix H) .................................. 24
Figure 7: Standalone Packaging Centre (See Appendix H) .................................................... 25
Figure 8: Vineyard and Winery Combined Process Boundary Excluding Bottling (See Appendix H) ................................................................................................................................. 26
Figure 9: Vineyard, Winery and Bottling Centre Process Boundaries (See Appendix H) . 27
Figure 10: AB32 Flow Chart ...................................................................................................... 94
Figure 11: Embodied Carbon Flow Chart ................................................................................ 95
Figure 12: WRI Scope 1 & 2 Flow Chart ................................................................................. 96
Figure 13: Vineyard Supply Chain - Full Size ....................................................................... 128
Figure 14: Industy Supply Chain - Full Size .......................................................................... 129
Figure 15: Vineyard Scope Boundaries - Full Size ............................................................... 130
Figure 16: Winery Scope Boundaries - Full Size .................................................................. 131
Figure 17: Packaging Centre Scope Boundaries - Full Size................................................. 132
Figure 18: Vineyard and Winery Scope Boundaries - Full Size .......................................... 133
Figure 19: Vineyard, Winery and Packaging Centre Scope Boundaries - Full Size ......... 134

page 10 of 152
Tables
Table 1: Container Mass Fraction (percentage of total packaged product) ......................... 35
Table 2: Closure Mass Fraction (percentage of total packaged product)............................. 35
Table 3: Secondary / Tertiary Packaging Mass Fraction (percentage of total packaged product) ......................................................................................................................................... 36
Table 4: Greenhouse Gas Reporting thresholds for Australia .............................................. 39
Table 5: Greenhouse Gas Reporting thresholds for an Australian entity ............................ 39
Table 6: Schedule of proposed regulations for Air Quality Act ............................................ 42
Table 7: Overview of Greenhouse Gas Programs .................................................................. 43
Table 8: Volumetric Conversion Factors (Perry 2002) ........................................................... 46
Table 9: Calorific Value of Fuel (Lower Heating Value) American Petroleum Institute 2001 ................................................................................................................................................ 47
Table 10: Fuel Emission Factors (Intergovernmental Panel on Climate Change 2006) ... 48
Table 11: Typical Vehicle Fuel Efficiencies (US EPA 2000) ................................................. 49
Table 12: CH4 and N20 emission contributions within stationary combustion equipment ........................................................................................................................................................ 50
Table 13: Gas Species Global Warming Potential in CO2 Equivalents (DEH AGO 2006) ........................................................................................................................................................ 51
Table 14: Default HFC Losses (Australian Greenhouse Office 2006) ................................ 52
Table 15: Symbol Explanation ................................................................................................... 55
Table 16: Nitrous Soil Emission Factors (Intergovernmental Panel on Climate Change 2006) ............................................................................................................................................... 55
Table 17: Vine Carbon Partitioning (Williams 1995) .............................................................. 56
Table 18: Equation 14 Symbols ................................................................................................. 57
Table 19: Default Degradable Organic Carbon Content (DEH AGO 2006)..................... 58
Table 20: Wine Industry Specific Solid Waste DOC .............................................................. 58
Table 21: Equation 15 Symbols ................................................................................................. 59
Table 22: Scope 2 Power Emission Factors – Example (Modified from: Pechan, E.H & Associate 2003) ............................................................................................................................. 60
Table 23: Scope 3 Emission Factors - Transmission and Distribution Losses (DEH AGO 2006) ................................................................................................................................... 60
Table 24: Helicopter Sizing Specifications (Avaiation Management 2006) ......................... 63
Table 25: Road Freight Emission Factors (Apelbaum Consulting n.d.) ............................. 64
Table 26: Rail Freight Emission Factors (Australian Greenhouse Office 2006) ................ 64
Table 27: Air Freight Emission Factors (DEFRA 2005) ....................................................... 65

page 11 of 152
Table 28: Ship Type Emission Factors (CE Delft 2006) ........................................................ 66
Table 29: Stationary Combustion Emission Factors (California Environmental Protection Agency 2007) ............................................................................................................. 68
Table 30: AB32 CH4 and N2O Emission Factors (California Environmental Protection Agency 2007) ................................................................................................................................ 70
Table 31: Emission Factor ranking used in the IWCC ........................................................... 77
Table 32: Fuel Quantity Uncertainty Assessment ................................................................... 78
Table 33: Distance Based Uncertainty Assessment ................................................................ 79
Table 34: Stationary Combustion Uncertainty Assessment ................................................... 80
Table 35: Fugitive Emissions Uncertainty Assessment .......................................................... 81
Table 36: Wine Making Practices Uncertainty Assessment ................................................... 82
Table 37: Biomass Photosynthesis Uncertainty Assessment ................................................. 83
Table 38: Vineyard Practices Uncertainty Assessment ........................................................... 84
Table 39: Scope 1 and 3 Waste Uncertainty Assessment ....................................................... 85
Table 40: Purchased Power Uncertainty Assessment ............................................................. 86
Table 41: Scope 3 Packaging Uncertainty Assessment ........................................................... 88
Table 42: Contract Machinery Uncertainty Assessment ........................................................ 89
Table 43: Purchased Wine Products Uncertainty Assessment .............................................. 91
Table 44: Fuel Emission Factors (RETEC Group 2003) ................................................... 106
Table 45: Vehicle Mileage Efficiency (RETEC Group 2003) ............................................ 107
Table 46: Various Passenger Vehicles and Fuel Efficiencies (US EPA 2000) ................. 121
Table 47: Stationary Combustion Emission Factors (Department of the Environment and Heritage, Australian Greenhouse Office 2006) ............................................................. 122
Table 48: Gas Species Global Warming Potential (Department of the Environment and Heritage, Australian Greenhouse Office 2006) .................................................................... 123
Table 49: Australian grid electrical power Emission Factors (Department of Climate Change, 2008) ............................................................................................................................ 124
Table 50: Other Electrical Power Emission Factors (Pechan, E.H & Associate 2003) . 125
Table 51: Packaging Emission Factors .................................................................................. 126
Table 52: Road Based Transport Emission Factors (RETEC Group 2003) .................. 127
Table 53: Ship Based Transport Emission Factors (CE Delft 2006) ................................ 127
Table 54: Rail Based Emission Factors (Department of the Environment and Heritage, Australian Greenhouse Office 2006) ..................................................................................... 127
page 12 of 152
1 Introduction to Greenhouse Gas Accounting
Section 1 of this report provides background information regarding Greenhouse Gas accounting principles. Although some wine industry examples are used, it is not intended to be specific to the wine industry. The development of a Carbon Accounting Protocol for the International Wine Industry has been based on the methodology outlined by the World Resources Institute (WRI) and the World Business Council for Sustainable Development in their Greenhouse Gas Protocol. Other reference material has also been extensively consulted including the International Standard, ISO 14064 1-3: 2006, for Greenhouse Gas Accounting. In addition, Life Cycle Assessment literature has been consulted and used. The International Standard for Life Cycle Assessment, ISO 14044: 2006, has been used to identify realistic process boundaries. Product specific Life Cycle Assessments have been useful in developing emission factors for specific items. Where possible, regionally based material has be utilised to identify regional specific emission concerns or factors. Every effort has been made to ensure that this Protocol is well thought out and suitable for the Wine Industry internationally providing the necessary guidance to report domestic emissions at the enterprise, facility and product level. However, there are many aspects of the Protocol still in the development phase. It is intended that this Protocol will undergo significant review hurdles and will be updated as appropriate in coming years. Version 1.2 of the calculator includes reporting for Scope 1, Scope 2 and Scope 3 that will meet the requirements of most international voluntary Greenhouse Gas programs. An outline of these is given in the report. In addition reporting specific to the Californian AB32 process has been added in version 1.1. Greenhouse Gas emissions are not well understood or documented in many sectors of the wine industry. In some cases there is almost no information available to use in the development of a model. In such instances, place holders have been used, clearly identifying where future work needs to be focused. An uncertainty analysis has been carried out on the calculation methodology, emission factors and data sources, in order that each aspect of the model can be rated with a reliability factor. This highlights areas in which future work needs to be conducted to develop more accurate information or data. The Protocol in development is intended to be used from a whole of company, or enterprise perspective. It can be used equally effectively to gain an understanding of the carbon footprint of a company or of a facility. It is not intended to perfectly model emissions from the product perspective, although work has been done to ensure that it sets the framework for such calculations. The emission sources and sinks have been chosen to accurately represent the overall carbon footprint of a winery, vineyard and bottling centre. Although never the primary intention, the level of detail in this Protocol enables it to be used to gain a broad understanding of the entrained or emitted carbon produced in the manufacture and supply of an individual product. Care has been taken to include many

page 13 of 152
of the items considered significant from this perspective. A robust framework has been established for individual product Life Cycle Assessments. In addition, the extended level of detail provides a framework or starting point for the industry to use when looking to satisfy the requirements of the British Standard‟s Publicly Available Specification 2050:2008, relating to the measurement of embodied greenhouse gas emissions. It is intended that the use of this Protocol will define an enterprise‟s carbon emissions to the extent, and level of detail, that when combined with accounting practices and relatively straightforward protocols, emissions could be apportioned to individual products with a moderate degree of confidence. Finally, the tool is able to be used by companies to conduct sensitivity analysis of their operations. A sensitivity analysis will enable companies or facilities to gauge their ability to manage Greenhouse Gas emissions with changes to practices or inputs. It is hoped that this will help in addressing environmental stewardship priorities and goals.
1.1 Setting Organisational Boundaries
The definition of a company or business is broad. It covers a wide range of organisational structures from large multinational conglomerates, to small family run organisations. The WRI recommend two options in setting organisational boundaries, the „control‟ approach or the „equity‟ approach (World Resources Institue 2004). In accounting for Greenhouse Gas emissions from companies within the wine industry it is logical to adopt a „control‟ approach. Under this approach a company accounts for Greenhouse Gas emissions over which it has total control. For the wine industry it has been assumed that „control‟ refers to operational control and ensures that the reporting company is in a position of power to alter its emission habits and tendencies. A company with full operational control has the sole authority to introduce policy, technology or operational changes with the potential to reduce overall emissions.
1.2 Setting Operational Boundaries
Within Greenhouse Gas Accounting, the concept of an operational boundary is used to help companies better manage the full spectrum of risks and opportunities that exist along its value chain (World Resources Institue 2004). The operational boundary is also used to distinguish between direct emissions and indirect emissions. Direct Greenhouse Gas emissions arise from sources that are owned or controlled by the company. Indirect Greenhouse Gas emissions are classified as emissions that are a consequence of the activity of the company, but occur at sources owned or controlled by another company (Florence 2006).
1.3 Scope and Scope Classification Defined
In order to delineate between direct and indirect emission sources, and to help in the development of emission policies and business goals, the WRI has defined three Scopes, namely Scope 1, Scope 2 and Scope 3. These Scopes, particularly Scope 1 and 2, have been clearly defined to ensure that double counting is never a possibility at the National,

page 14 of 152
State or industry level (World Resources Institue 2004). Although the definition between Scopes is theoretically clear, much confusion has arisen around the issues relating to who „owns‟ each of the emissions. Every effort has been used to ensure that this Protocol clarifies the Wine Industry‟s Greenhouse Gas responsibilities. Greenhouse Gas accounting methodologies are continually evolving and progressing, meaning that this Protocol must remain a living document, adjusted into the future as necessary.
Figure 1: Pictorial Representation of Scope (World Resources Institue 2004)
The required level of detail to be used when reporting Greenhouse Gas emissions has not been decided within many of the jurisdictions which this tool will be used, however, it is recommended that as a minimum Scopes 1 and 2 are reported (World Resources Institue 2004). It must be noted that the when reporting Greenhouse Gas emissions within the facility or enterprise approach, each Scope should always be reported separately. If companies elect to report Scope 3 emissions to regulators they must take care to ensure that they do not create unnecessary regulatory or compliance burdens for themselves.
1.3.1 Scope 1: Direct Greenhouse Gas Emissions
Direct Greenhouse Gas emissions, or Scope 1 emissions, occur from items controlled by and owned by the company. For the wine industry typical examples of Scope 1 emissions will occur from tractors within company controlled vineyards, forklifts within company controlled wineries, water heaters within the winery or bottling halls and onsite electricity generation. Scope 1 emissions generally occur from one of the following types of activities.

page 15 of 152
Emissions produced through the generation of heat, steam or electricity via the
combustion of fuels in stationary equipment such as boilers or water heaters.
Emissions that arise from chemical or physical processing. Within the wine
industry the fermentation of sugar which produces carbon dioxide1 is a good
example.
Emission produced from burning fuel in mobile operating equipment such as
cars forklifts and tractors. To be classified as a Scope 1 emission, the mobile
equipment must be owned by the company.
Unintentional emissions of Greenhouse Gases from within a company through
leaks and spills. These emissions are known as fugitive emissions. Within the
wine industry fugitive emissions are most likely to be limited to leaks from HFC
based refrigeration systems.
1.3.2 Scope 2: Purchased Power Utility
Many companies are heavily reliant on electrical power. The emissions that occur from the production of electricity in facilities not owned by the company are categorised as Scope 2 emissions. They are regarded as indirect emissions because they occur in equipment owned by another company, generally a power station. Scope 2 also includes emissions generated from purchased steam or heat, but this has not been considered as important for the wine industry. Purchased electricity is separated from other indirect Greenhouse Gas emissions as electricity generation is considered to significantly contribute to Global Warming. For many organisations purchased electricity is the largest component of Greenhouse Gas emissions and a necessary component of Greenhouse Gas management strategies. Although difficult and sometimes costly to achieve, reductions in electrical consumption will result in less emissions of Greenhouse Gases. Reductions can take the form of utilising more energy efficient equipment or alternatively switching to electricity providers that are less carbon intensive. When considering the enterprise or facility, Scope 2 emissions should always be reported separately from Scope 1 emissions.
1.3.3 Scope 3: Indirect Greenhouse Gas Emissions
For the wine industry emissions categorised as Scope 3, are emissions that occur as a consequence of producing a finished saleable wine product, emitted from equipment or plant owned by another company. By definition the classification of Scope 3 is dependent upon the operational boundary. For example, if a vineyard owns a harvester and uses it to harvest grapes, then the emissions generated from the harvester engine will
1 Although fermentation is a direct emission source, CO2 generated as a result of fermentation is not reported. Fermentation is part of the “short-term carbon cycle” and is not considered to contribute to global warming. Refer to section 1.5.1 of this report for more detail.

page 16 of 152
be classified as Scope 1. If the vineyard does not own a harvester and instead utilises a harvesting contractor then the emissions from the contract harvester will be classified as Scope 3. In most jurisdictions and voluntary programs, when reporting on the carbon footprint of an enterprise or facility, emissions categorised as Scope 3 are excluded. However, in order to understand the embodied carbon within a particular product, all carbon sources and sinks associated with that product must be included.
1.3.3.1 Scope 3 Inclusions
The WRI state that the inclusion of Scope 3 into Carbon Accounting can be optional. However, understanding the indirect emissions involved in producing wine is an important aspect of Greenhouse Gas management for the industry as a whole because transport and packaging in particular are significant contributors to the overall industry impact. In addition, in order to understand the embodied carbon of a product, Scope 3 items must be considered. For the wine industry emission sources categorised as part of Scope 3 contribute significantly to the total product Greenhouse Gas footprint. It is not necessary, or possible, to account for all of the Scope 3 items. The WRI recommend that the following be considered when selecting which Scope 3 items to include:
Is the emission considered to be large relative to the Scope 1 and 2 emissions;
Does the emission contribute to the company‟s overall Greenhouse Gas risk
exposure;
Are there potential ways in which to reduce the emission; and
Is the emission deemed critical by key stakeholders?
In developing the Protocol for the wine industry care has been taken to ensure that most items thought to be significant in their Greenhouse Gas emission contribution have been included within the Protocol. This will ensure that differences in production methods, packaging options, transport scenarios and waste disposal methods can be accounted for. Broadly the following aspects have been considered within Scope 3.
Transport related activities;
Electricity not accounted for in Scope 2;
Extraction and production of purchased materials; and
Waste disposal.
This Protocol is intended for use at the enterprise rather than product level, but it has been deemed necessary to include all of the significant Scope 3 items to ensure that future product Life Cycle Assessments could also be based upon the frame work of this

page 17 of 152
Protocol. In addition, it is thought that most or all of the included Scope 3 issues are important to significant industry stakeholders. When conducting a life cycle analysis, the components that contribute to a product but are thought to be insignificant are excluded (International Standards 2006). This significance level is based on a mass faction of a component when compared to the product. Components that contribute less that 1% to the products overall mass are generally discarded from calculations. We have selected a value of 1% due to this being currently used in many streamlined LCA‟s. In addition it is thought that a 1% mass value will approximate to a 1% Greenhouse Gas emission of the product overall (per PAS 2050). Care has been taken to ensure that exceptions to this rule, such as aluminium closures, are not overlooked. As Greenhouse Gas accounting for industrial sectors evolves, and standards change, it may be necessary to adopt a different de minimis value.
1.4 Implications of the PAS 2050:2008 for the International Wine Carbon Calculator
The British Standards Institute has recently released a draft Publicly Available Specification 2050:2008. This specification outlines the approach they require when accounting for embodied carbon in a product or service (British Standards PAS 2050:2008 2007). In the development of the Wine Industry Protocol, care has been taken to incorporate the important aspects of the PAS 2050 in the accounting methodology. Specifically this has been done by:
Using a supply chain process map to identify inputs and outputs relating to Greenhouse Gas emissions;
Defining boundary conditions and data requirements consistent with the PAS 2050; and
Ensuring that items defined for inclusion by the PAS 2050 are included within this Protocol or where not included the exclusion is specifically noted.
Utilising a 1% by mass and 1% by entrained Greenhouse Gas approach, to determine the minimum range of inclusion, rather than a lesser standard such as the European Standard Emissions Trading Scheme‟s 3% de minimis approach.

page 18 of 152
1.5 Understanding the Short-term Carbon Cycle
The WRI Protocol excludes the short-term carbon cycle from its Greenhouse Gas reporting protocol. For this reason it is important to understand what contributes to the short-term carbon cycle and what is classified as part of the long-term carbon cycle. Figure 2 shows the full carbon cycle, including both the long-term and short-term.
Figure 2: The Carbon Cycle (NASA)
1.5.1 The Short-term Carbon Cycle
The short-term cycle includes the rapid exchange of carbon between plants and animals through respiration and photosynthesis, and through gas exchange between the oceans and the atmosphere. The short-term carbon cycle extends into the wine industry to include fermentation, emissions of CO2 from waste water and landfill and sequestration into non-permanent structures and sources within the vineyard. Emissions of CO2 that arise directly from the combustion or degradation of biomass are treated as part of the short-term carbon cycle. This includes burning wood2 and other biomass as a fuel.
2 Waste cork is often used as a fuel within the cork manufacturing process. The emissions generated from cork combustion are not to be attributed to the manufacturer as they are part of the short-term carbon cycle.

page 19 of 152
Emissions of other Greenhouse Gases from the combustion of biomass are not part of the short-term carbon cycle and are included for reporting purposes. This means that the generation of methane within waste systems is not part of the short-term carbon cycle. The following emission sources and sinks are excluded on from reporting as they are part of the short-term carbon cycle.
Fermentation;
Non-permanent vineyard growth;
Grape growth;
CO2 emissions from aerobic waste treatment both solid and liquid; and
CO2 emissions from the combustion of biomass fuels. Please note that methane (CH4) and nitrous oxide (N2O) emissions from vineyards, wastewater, solid waste and the combustion of biomass fuels are not part of the short-term carbon cycle and are included as emissions sources.

page 20 of 152
2 Developing a Wine Industry Specific Protocol
2.1 Understanding the Supply Chain
The first step in developing a Carbon Calculator is to understand the process inputs and outputs that play a role in contributing to the overall Greenhouse Gas emissions of a company. One way to do this is to map out a supply chain for the company, ensuring that all energy and fuel related inputs are accounted for. The inclusion of purchased components needed to produce the final product should also be included.
Figure 3: Vineyard Supply Chain Highlighting Fuel and Energy Inputs (See Appendix H)
Figure 3 shows the major energy inputs and outputs required to grow grapes. The map is not a comprehensive overview of the supply chain but does include the major Greenhouse Gas emission or sink contributors.

page 21 of 152
Figure 4: Supply Chain Overview for Winery and Packaging Centre (See Appendix H)
Figure 4 illustrates the main fuel and energy inputs associated with winery and packaging operations. Head office activities such as marketing, administration and information technology will have an impact on Greenhouse Gas emissions but are not included in the Calculator, in line with generally accepted practices.
2.2 Defining Organisational Boundaries
The WRI guidelines suggest two methods for identifying or setting organisation boundaries, they include the equity approach or the control approach. For the wine industry it has been assumed that the control approach will be more applicable. „Control‟ refers to operational control. For most wine industry companies, they will have control over equipment such as tractors, forklifts and boilers. At a plant level, items under control are likely to include owned and leased cars3, tank farms, fermenters, vineyards and bottling halls. Wine companies are not likely to own helicopters, rail and shipping systems and large power generation facilities. Any emissions generated via these types of equipment are classified as Scope 2 and Scope 3 emissions.
2.3 Defining the Process Boundaries
It is intended that this Protocol be accepted by the wine production industry as a whole and as such has been developed to be suitable for growers, wineries and contract bottlers. The Protocol has been designed to accommodate a company whose operations consist of any combination of these processing or growing operations. When calculating the carbon footprint of a wine industry company, a common accounting formula can be
3 When adopting the „control‟ approach leased items, although not owned by the company, may be completely controlled by the company and should therefore be included within any Scope 1 emissions. An example is a company leased car. The company can chose what type of car to lease pays for the fuel and controls how often that car is used. It is in a position of control to alter those emissions.

page 22 of 152
applied to any combination of processing options; however, care needs to be taken in selecting the process boundaries as this will be different in each case. For example, a company that owns a vineyard and winery and makes wine from its own grapes, will include the production (or growth) of grapes within its process boundary. Any emission generated in the growth of those grapes will be included within Scope 1. A winery that does not own the vineyard will need to purchase grapes from a grower. As this winery does not own the vineyard any emissions generated in growing these grapes will be classified as Scope 3 for the winery. In both cases the actual emission value generated will be the same, but it is classified as belonging to a different entity. Examples of possible processes boundaries within the wine industry are illustrated in Figure 5, 6, 7, 8 and 9.

page 23 of 152
2.3.1 Stand Alone Vineyard Process Boundary
Figure 5 is used to represent the process boundaries within a stand-alone vineyard. Larger versions of the figures in this chapter can be found in Appendix H.
Figure 5: Vineyard Operation Only Process Boundaries4 (See Appendix H)
For a Vineyard the end point boundary is when the fruit is delivered to the winery. Within the vineyard, significant emission sources arise from fertiliser use, fuel use and tillage practices. Sinks are thought to exist in the form of soil sequestration and permanent vine growth.
† Modelled with place holder values.

page 24 of 152
2.3.2 Stand Alone Winery
The following example considers the situation of a standalone winery. In this example the emissions that result from growing grapes will now be categorised into Scope 3. The end point boundary is delivery of the wine to the bottling centre post blending.
Figure 6: Standalone Winery Process Boundaries (See Appendix H)
In all cases it is assumed that the end point boundary is the point of sale by the enterprise. For vineyards this end point is the point at which grapes are sold to a winery. For a winery and bottling centre this end point is more likely to be the point of sale to the retailer of the finished product. It must be noted that the disposal of packaging is included within this Protocol.

page 25 of 152
2.3.3 Standalone Packaging Centre
The following example considers the situation of a standalone packaging centre. There are less Scope 1 items in this example due to the absence of chemical or biological processing.
Figure 7: Standalone Packaging Centre (See Appendix H)

page 26 of 152
2.3.4 Joint Ownership of Vineyard and Winery
A company that owns both a vineyard and winery may categorise its emissions using a template similar to Figure 8. Note that the process boundary may not include the transport of grapes from the vineyard to the winery if the truck used to transport the fruit is not owned or operated by the company. In most cases external transport companies will be contracted for this particular job and for the job of transporting finished wine to a packaging centre, hence emissions from these transport sources will be classed as Scope 3. Companies that include a winery and vineyard will have a greater Greenhouse Gas emission due to the more extensive processing.
Figure 8: Vineyard and Winery Combined Process Boundary Excluding Bottling (See Appendix H)

page 27 of 152
2.3.5 Joint Ownership of Vineyard, Winery and Bottling Hall
The inclusion of a bottling centre is unlikely to add many more items into the Scope 1 category. However, the packaging of wine will involve many extra Scope 3 items. Although not an exhaustive list, Figure 9 displays a process boundary situation for a company that has control over a vineyard, winery and bottling hall. Note that the boundary finishes at the point of customer wholesale and that transport is a major component of interest to stakeholders.
Figure 9: Vineyard, Winery and Bottling Centre Process Boundaries (See Appendix H)
†
† Modelled with place holder values.

page 28 of 152
3 Protocol Inclusions and Exclusions
3.1 Scope 1
3.1.1 Generation of Heat, Steam or Electricity
The generation of heat within stationary combustion devices is modelled using a consumed fuels approach. All Greenhouse Gases are considered and used to develop a carbon dioxide equivalent (CO2e) emission factor. Companies need to understand their fuel consumption using either a volume or energy basis. All normally available fuels are modelled, including methane, LPG, diesel, gasoline / petrol, fuel oil, coal and wood. The generation of steam is incorporated into this section of the model. If companies generate electricity from the combustion of fuels, the emissions are modelled within the stationary combustion section of the Calculator. Companies who generate electricity from green sources such as solar or wind, would see reductions in their Scope 2 emissions.
3.1.2 Physical or Chemical Processing
The term Physical or Chemical Processing is used to explain emission sources or sinks that arise from physically or chemically manufacturing a product. An example is seen in the production of glass. Glass is produced predominantly from sand, soda ash and limestone. At very high temperatures these components react to form glass. As a result of this „chemical process,‟ carbon dioxide is released. The processing operations with the vineyard are more „biological‟ than strictly chemical, but these „biological‟ sources and sinks need to be understood.
3.1.2.1 Vineyard
The source of emissions and sinks within the vineyard is an area that requires considerable research or investigation. We have modelled vineyard carbon emissions and sinks with a combination of place holder values and basic models. Of particular importance within the vineyard are the emissions of N2O from the application of fertiliser and through soil cultivation. These emissions could potentially contribute as much as 5% of the total Greenhouse Gas emissions within the wine industry. In addition the sequestration of carbon into the soil through permanent row cropping and from the breakdown of vine prunings are included in the Protocol. The sequestration of carbon into the permanent vine structures via photosynthesis is also included. Both of these items are included only as placeholders. Some of the short-term carbon cycle emissions and sinks within the vineyard are also considered. As part of the short-term carbon cycle these emissions need not be reported. They are considered separately within the model and not added to the emission total. The short-term carbon cycle emissions and sinks considered within this Protocol include:
Sequestration into the grapes;
Sequestration into the non-permanent vine structures; and
Emissions from the breakdown of vine prunings within the vineyard (currently estimated to occur though aerobic breakdown).

page 29 of 152
3.1.2.2 Winery
The chemical process of converting sugar to ethanol releases CO2. Fermentation is included within the model for completeness but not added to the emissions total. WRI guidelines state that this emission need not be reported in Scope 1 as it is assumed to be in balance with the vineyard sequestration. However, the sequestration and emission balance may take place between two different enterprises and so it is pertinent to understand this aspect for the industry as a whole. Primary and malo-lactic fermentation are considered. The direct use of CO2 within the winery is also included. Wineries need an understanding of annual CO2 consumption and or generation. The inclusion of a bottling centre into a company‟s operational boundary is not currently considered likely to alter the physical or chemical processing emissions.
3.1.2.3 Transport
All emissions generated from mobile equipment owned by an enterprise are included within this section. The emissions are modelled in two separate ways, either by a quantity of fuel consumed approach or a distance travelled approach. Users are encouraged to use the quantity consumed approach whenever possible as it is considered to result in a higher level of accuracy. Users need to exercise caution if utilising both approaches, to ensure that double counting does not occur. Non-rail, land-based transportation modes only, have been included in this section as it is assumed that wine industry companies do not own rail, air or sea transport systems.
3.1.2.4 Fugitive Emissions
Fugitive emissions from HFC related cooling systems have been included in the model. Two calculation approaches have been chosen. Users can adopt either a default loss value based on the HFC charge size or enter an annual recharge volume. Due to their extreme Global Warming Potential, more than twenty three thousand times that of CO2, SF6 fugitive emissions are included within the Protocol and Calculator. SF6 compounds are used for insulation in gas insulated electrical switchgear, due to its high dielectric capacity.
Fugitive emissions from other sources have not been included as they are not considered significant.
3.1.2.5 Waste Disposal
Scope 1 waste disposal is included in this Protocol. Scope 1 waste treatment includes all waste treatment conducted in areas and equipment under direct control of the company. Both solid and liquid waste treatment has been included. Please note that carbon dioxide generated as part of aerobic digestion is not counted as this contributes to the short-term

page 30 of 152
carbon cycle. Only methane generation is considered, this is converted to an equivalent carbon dioxide emission using document global warming potential emission factors.
3.2 Scope 2
3.2.1 Purchased Electrical Power
Scope 2 is defined as purchased power utility. Purchased electrical power is included, all other forms of purchased utility are excluded on the basis that they are not considered to be significant for the industry as a whole. Purchased electrical power emissions have been modelled using region specific CO2e emission factors. Opportunity to modify the emission factors exists for companies who wish to purchase some or all of their electrical power though greener suppliers. Transmission and distribution losses are not included within Scope 2. They are modelled under Scope 3 emissions.
3.3 Scope 3
Scope 3 emissions are not typically included when reporting on the carbon footprint of an enterprise or facility. In the development of this Protocol items thought to contribute more that 1% towards total emissions have been included within Scope 3. This methodology is consistent with the PAS 2050 and streamlined LCA design recommendations. For the purpose of identifying items or areas that may contribute to more that 1% of total emissions it is assumed that emissions will be roughly proportional to mass. This approach is used with some flexibility, for example, metal screw caps are considered within this Protocol even though they typically contribute less than 1% of the product mass; the production of metals is energy, and therefore emission intensive. Our decision to use 1% of product mass as our cut off point for inclusion into the Protocol is based on currently accepted practice. If future reporting requirements only require a 2% or 3% de minimis approach to Greenhouse Gas accounting then we can exclude some items from this current Protocol and Calculator. For simplicity and ease it is ideal to calculate Scope 3 emissions using an all encompassing product emission factor for each item included within the Protocol. In order to have an all encompassing emission factor, a full LCA needs be published on that particular product. In most cases this information is not currently available. There is therefore a high level of uncertainty involved in modelling emission factors. The values used within the Calculator are based on currently available information and engineering assumptions. Users of this tool must understand the high level of uncertainly involved with all Scope 3 emissions calculations. As more work is done towards understanding individual product LCA‟s this work can be incorporated into the model.
3.3.1 Exclusion of Infrastructure
Infrastructure has been excluded from this Protocol as it does not play in role in any of the international Greenhouse Gas accounting standards or the WRI‟s Greenhouse Gas

page 31 of 152
Protocol. Capital items that contain embedded carbon such as metal tanks, tractors, forklifts, pipe work, vineyard posts, wires and bottling lines have been excluded from the calculations. Repair and maintenance work to capital items has also been excluded from the Protocol. Land clearing is similarly excluded from this Protocol.
3.3.2 Purchased Products
The following section of this Protocol details which purchased products used within the wine industry have been included or excluded and a working justification for their status.
3.3.2.1 Bottles and Containers
3.3.2.1.1 Glass
Emissions resulting from the production and use of glass are included. Currently the information relating to emissions from the production of glass are not well known. Generic place holder emission factors are used until further information about glass becomes available. Future work is needed to understand glass, we recommend investigating a model which incorporates furnace design and firing technology, cullet percentage, furnace age, glass colour and electo-boost to top fire mix ratio. Other factors dictated by customers may also prove significant. Transport of the packaging material to the site of use also needs to be included.
3.3.2.1.2 PET
Emissions resulting from the production and use of PET are included in the Protocol and Calculator. PET emissions are currently calculated based on an LCA analysis by the manufacturer. PET is included within the Protocol and Calculator predominantly for the purpose of comparison. Users of the Protocol and Calculator are able to model various packaging combinations while observing the influence this has on a product level Greenhouse Gas emission basis.
3.3.2.1.3 Tetra Pak
Emissions resulting from the production and use of Tetra Pak are included in the Protocol and Calculator. Tetra Pak emissions are currently calculated based on an LCA analysis completed by the manufacturer. The inclusion of Tetra Pak allows users to model the impact this type of packing material will have for product level comparisons.
3.3.2.1.4 Aluminium Cans
Emissions resulting from the production and use of Aluminium Cans are included in the Protocol and Calculator. Aluminium Can emissions are modelled with a place holder value based on general aluminium production.
3.3.2.1.5 Wine Bags
Wine bags are included within Scope 3. Wine bags are modelled using a combined approach, where the carton, aluminium component of the bag and the plastic component of the bag are individually calculated to give the overall emission from the use and production of wine bags.

page 32 of 152
3.3.2.1.6 Closures
An analysis of empty packaging weight shows that closures generally comprise less than 1% of the total product mass (see section 3.4 of this report). Further analysis using available emission factors shows that closures are responsible for about 1% of the Greenhouse Gas emissions from packaging alone. When combined with the wine product, closures are likely to contribute less than 1% of total Greenhouse Gas emissions with the exception, of 187ml PET bottles with an aluminium screw cap closure. Closures have been included in this version of the Protocol so that a further understanding of their Greenhouse Gas emission contribution can be understood. Later versions of the Protocol may be able to rule out closures on the 1% basis.
3.3.2.1.7 Aluminium Screw Caps
Although likely to be less than 1% of the product mass, aluminium has been included in the form of closures and as a component of the bag in box. Where possible emission factors related to the particular type rather than the product material will be used. If a 2% or 3% de minimis approach is taken then metals in the form of closures are likely to be excluded from the model and Protocol.
3.3.2.1.8 Natural Cork
Cork plus a PVC capsule is included within the model. The emission factors are based upon manufacturers LCA information.
3.3.2.1.9 Agglomerate Cork
Agglomerate cork with a PVC or Aluminium capsule is included within the Protocol and Calculator. Separate emission factors are available for agglomerate cork with a PVC capsule or aluminium capsule from manufacturers LCA information.
3.3.2.1.10 Glass Stoppers
Glass stoppers are included in the Protocol and model. Place holder emission factors are used until the emissions from the glass manufacturing process can be modelled.
3.3.2.1.11 Synthetic Corks
Synthetic corks are included in the Protocol. Placeholder emission factors are used until detailed LCA data is available on these products.
3.3.2.1.12 ZORKs
ZORKs and similar plastic closures are included in the Protocol. Placeholder emission factors are used until detailed LCA data is available on these products.
3.3.2.2 Fibre packaging
Fibre based packaging, such as corrugated card and box material are included. Various carton size and box dividers have been included within the Calculator. An analysis needs to be conducted to determine if these exceed the 1% threshold values based on both Greenhouse Gas emissions and mass.

page 33 of 152
3.3.2.3 Wooden Products
Wooden packaging materials in the form of pallets are included within the Protocol. Both returnable and non-returnable pallets have been considered. An analysis needs to be conducted to determine if these exceed the 1% threshold values based on both Greenhouse Gas emissions and mass.
3.3.3 Contract Machinery
Emissions from the use of contact machinery are included. Helicopter and tractor use has been modelled on an hours used basis. Helicopters are modelled using their size, small, medium, large and extra large. The emissions from contract tractors are based on their PTO horsepower rating. Harvesters should be modelled using the horsepower method.
3.3.4 Wine Related Products
3.3.4.1 Juice, Grapes, Spirit and Bulk Wine
Emissions from the production of grapes, juice, juice concentrates, distillates, bulk wine and spirits have all been included. Emission factors for these items are still to be understood. An iterative approach will be taken to developing these emission factors. As the industry begins to use the Calculator and Protocol we will develop a set of emission factors for wine related products.
3.3.4.2 Barrels
Barrels are also included in the wine related products section of the Protocol. Place holder emission factors are used, based on dimensional lumber emission factors as reliable and robust emission factors are still to be developed or understood for oak. Although barrels could arguably be regarded as capital equipment, their short average life has resulted in their inclusion. The large weight of barrels and the great distances they often travel to be used within the process suggest that they could have a significant contribution to the overall carbon footprint of a winery.
3.3.4.3 Wine Making Additives
Two wine making additives are considered in this Protocol, tartaric acid and bentonite. These additives have been included within the Protocol using place holder values. They are included for „road testing‟ purposes. The use of this Protocol and Calculator will lead to an understanding of the significance of wine making additives and their overall Greenhouse Gas impact. Their future inclusion within the Protocol will be based on the level of significance experienced with this Protocol and Calculators use.
3.3.5 Transport Related Activities
Transport is widely considered to be a significant contributor to overall carbon footprint. The following items included within transport:
Transport of purchased products to the location in which they are used;
Transport of intermediate products between value adding steps;
Transport of finished wine products to the point of sale; and
Transport of waste to the point of disposal.

page 34 of 152
Items which are to be excluded from the Protocol are:
Employee travel to work;
Travel of the consumer to the point of sale (outside the process boundary); and
Business travel of employees.
For freight transport, emission factors are based on a weight multiplied by distance travelled approach. Different emission factors are available for air, rail, truck and ship. Air freight calculations will be based on short, medium and long haul destination emission factors. We have simplified currently available transport factors to make the Calculator and Protocol more user friendly. Future versions of the Protocol may include more complex transport models that incorporate factors such as the number of take offs and landings used in distributing the product via air freight. A variety of shipping types have been included within the model. It is expected that the finished wine product will be shipped within cargo or a RoRo type vessel. A bulk dry vessel type has been included to facilitate calculations surrounding the distribution of some wine making inputs
3.3.6 Transmission and Distribution Losses
The transmission and distribution of electrical power is not completely efficient. Within a transmission grid there is a loss of power manifested as heat and noise. This power loss has an associated emission factor, which is dependent upon the condition or efficiency of the electrical grid distributing the power and the original emission factor that results from combusting fuel to produce power. Transmission and distribution losses are included in Scope 3. Factors for all regions are still being sought and so placeholder values are currently being used.
3.3.7 “Product In Use” Phase
There are two main emission sources that could be associated with the „in use‟ phase of a wine product, they are the biological consumption of wine and any associated emissions and the energy requirement associated with refrigerating white or sparkling wine products. The in „use phase‟ emission have been excluded from the model due to the location of the process boundary at the point of sale. This is in contrast to the PAS 2050 which includes retail refrigeration requirements. This could potentially be included with later versions of the Protocol or Calculator.
3.3.8 Waste Disposal
Offsite waste disposal needs to be accounted for as a Scope 3 emission. This includes waste water treatment or processing that is done in plant or equipment not owned by the company such as town sewerage system or a municipal water service. Solid waste processing also needs to be accounted for. Both solid and liquid waste processing are included. Industrial average treatments systems are assumed to be used in offsite waste processing.

page 35 of 152
3.4 Packaging Mass Fractions
In order to determine the inclusion / exclusion of packaging items, a 1% mass fraction approach was used. Table 1, Table 2 and Table 3, show the percentage mass fractions of various packaging types and components of the total packaging. Total packaging is assumed to include, the container, a closure, boxes, separators and pallets. Please note that these percentages are based on the packaging only, the mass of the wine has been excluded from the calculations. The following table considers 750ml glass wine bottles of average shape and weight. The wine bags are assumed to contain 2 litres of wine.
Wine Container
Paper board Aluminium Polyethylene / Polypropylene Glass PET
Glass with Aluminium Closure
5
0 0 0 91.7 0
Glass with Cork 0 0 0 91.2 0
PET with Aluminium Closure
0 0 0 0 61.8
Tetra Brik (1ltr) 44.6 2.4 8.2 0 0
Tetra Prisma (1ltr) 37.6 3 13.3 0 0
Aluminium Cans 0 100 0 0 0
Wine Bag 76 0.1 11.1 0 0
Table 1: Container Mass Fraction (percentage of total packaged product)
Using Table 1 it can be seen that the container itself should be included on the basis of a 1% de minimis approach. Future approaches which may use a de minimis approach of 3% will not alter the inclusion status of the container within the Protocol.
Wine Closure
Polypropylene High Density Polyethylene Cork Aluminium
Glass with Aluminium Closure
0 0 0 0
Glass with Cork 0 0 1 0
PET with Aluminium Closure
0 0 0 5.2
Tetra Brik (1ltr) 1.9 1.9 0 0
Tetra Prisma (1ltr) 1.7 1.7 0 0
Aluminium Cans 0 0 0 0
Wine Bag 12.8 0 0 0
Table 2: Closure Mass Fraction (percentage of total packaged product)
5 A single glass bottle is assumed to weigh 527 grams.

page 36 of 152
Using Table 2 it can be seen that the mass fraction contribution of closures to the overall packaging solution is small. Closures have been included in this Protocol as they are considered important when used and compared with Tetra Pak and PET packaging options. A 3% de minimis approach could result in excluding closures from this Protocol completely; however, it would reduce the completeness of packaging comparisons.
Secondary / Tertiary Packaging
Paper board Corrugated Box Recycled Paperboard
Glass with Metal Closure
0 5 3.3
Glass with Cork 0 4.5 3.3
PET 0 33 0
Tetra Brik (1ltr) 0 41 0
Tetra Prisma (1ltr) 0 42.7 0
Aluminium Cans 0 0 0
Wine Bag 0 0 0
Table 3: Secondary / Tertiary Packaging Mass Fraction (percentage of total packaged product)
Table 3, demonstrates the importance of including secondary and tertiary packaging components such as corrugated boxes and paper board. These items are currently included within the Protocol and are likely to remain in the Protocol even if a 3% de minimis approach was taken. The use of lightweight glass containers and the consideration of smaller packaging options such as „single serve‟ 187ml glass containers will lead to an increase in closure significance.

page 37 of 152
4 Reporting and Regulatory Obligations
Greenhouse Gas policy is in a state of flux. Greenhouse Gas regulatory obligations are new to companies and are likely to undergo significant modification or change over the next decade. This chapter presents a snapshot of the international regulatory situation at the time of publication. The Calculator provided as a part of this project has been designed to produce specific outputs necessary for wine related companies to report to their relevant jurisdictions. Easy to follow flowcharts have been developed to assist in the data input requirements for each type of regulatory framework. For the wine industry it is also important to have an understanding of export market regulations and requirements. It is likely that the most important standard relating to export markets is the British Standards Institute draft PAS 2050:2008, as described in section 1.4 of this report. This document outlines the calculation approach used to quantify embodied Greenhouse Gas emissions, in products, throughout the supply chain. It is expected that the results from using the Calculator will be used by companies in the following ways:
Mandatory and/or voluntary reporting;
Calculating Carbon Footprint;
Providing information to customers about carbon impact;
As a decision tool in reaching carbon neutrality;
Developing an understanding of the wine industry emission for industry information and advocacy purposes; and/or
Responding to market demands for information on product entrained carbon.
4.1 United States (California)
4.1.1 Regulations
4.1.1.1 Current
In September, 2006 the Governor of California approved Assembly Bill No. 32 Global Warming Solutions Act (Fabian Nunez 2006), commonly referred to as AB32. This bill establishes a state-wide goal of reducing global warming emissions to 1990 levels by 2020. This reduction will be accomplished through an enforceable state-wide cap on global warming emissions, commencing in 2012. AB32 directs the California Air Resources Board (CARB) to develop appropriate regulations and establish a mandatory reporting system to track and monitor global warming emission levels within California. These regulations have been released in a draft form and should become final in February, 2008.
4.1.2 Reporting
The reporting requirements for the CARB draft regulations have been incorporated into the Calculator. It is unlikely that most wine related companies will be required to report
page 38 of 152
on Greenhouse Gas emissions for the 2008 calendar year. The reporting threshold is based on annual CO2 emissions from stationary combustion sources and must be greater than, or equal to, 25,000 metric tonnes to qualify for compulsory reporting. Wineries may elect to report on a voluntary basis. AB32 is based on a facility by facility approach and is not to be used in understanding entity or product carbon emissions. A summary page is generated as part of the Calculator which presents data in the correct form and units, required to report according to the draft regulations. The flow chart in Section 8.3, Figure 10, of this report, steps users through the data input stages required to complete the reporting summary If a facility does exceed the 25,000 metric tonne reporting threshold, they will be required to report their 2008 calendar year emissions as presented in the Calculator by April 1st, 2009. Emission estimates submitted to CARB will be subjected to a full independent verification at least every three years with a less intensive verification in the interim years. All data relating to the emissions must also be retained for a period of five years. Currently, there are a number of voluntary Greenhouse Gas emissions reporting programs in the United States. Some of the better known programs and their basis for reporting are summarised in Table 7, at the end of this section.
4.1.3 Future
CARB plans to review the scope of the regulations to the extent necessary to ensure the required future reductions in GHG emissions for AB32 are met. This will possibly include the compulsory inclusion of mobile combustion emission sources which form a part of the transportation sector (currently optional). Suggested changes are not likely to be put forward until at least 2009 and not expected to require reporting until April 2010.

page 39 of 152
4.2 Australia
4.2.1 Regulation
The National Greenhouse and Energy Reporting Act (Parliament 2007) proscribe the thresholds at which a controlling corporation‟s group is required to make an application to the Greenhouse and Energy Data Officer. These thresholds are summarised in Table 4. If one or more of the thresholds are exceeded, a corporation is required to register.
2008/2009 FY 2009/2010 FY Later FY’s
Greenhouse
Emissions in
000’s tonnes of
CO2e
Greater than 125 Greater than 87.5 Greater than 50
Energy produced
in terajoules (TJ)
Greater than 500 Greater than 350 Greater than 200
Energy
consumed in
terajoules (TJ)
Greater than 500 Greater than 350 Greater than 200
Table 4: Greenhouse Gas Reporting thresholds for Australia
In addition, if any entity which is a member of a corporate group exceeds any of the thresholds in Table 5, it is required to register separately.
Threshold 25,000 tonnes
CO2e
100 TJ energy
produced
100 TJ energy
consumed
Table 5: Greenhouse Gas Reporting thresholds for an Australian entity
Some large or multiple-site wine producers in Australia could exceed these thresholds, particularly beyond the 2010 financial year.
4.2.2 Reporting
The system that has been developed to effect legislative reporting requirement is called the Greenhouse Challenge Plus program. This program does not stipulate the Greenhouse Gas accounting system a company should implement, but defines requirements for organisations to report Greenhouse Gas emissions to the Australian Government. The reporting requirements for OSCAR (Online System for Comprehensive Activity Reporting) have been incorporated into the Calculator. A summary page will be generated to produce the data required to report to the requirements of the current regulations. The flowchart in Section 8.5, Figure 12, of this report, steps users through the data input requirements, to complete the final reporting summary. Greenhouse Challenge Plus is the current voluntary agreement between industry and the Australian Greenhouse office. Within this agreement, members are required to report Scope 1, Scope 2 and selected Scope 3 emissions. There is also a requirement to provide

page 40 of 152
an action plan, public statement, and greenhouse performance measures. The act specifies that a registered corporation must keep records of activities for their group, and members of their group for at least seven years.
4.3 New Zealand
In 1993, New Zealand ratified the United Nations Framework Convention on Climate Change (UNFCCC). In 2002, New Zealand ratified the Kyoto Protocol as an Annex 1 Party. The individual targets for Annex 1 parties add up to a total cut in greenhouse gas emissions of at least 5% from 1990 levels in the commitment period 2008 to 2012 (CP1). New Zealand‟s target is 0% from 1990 levels (Ministry for the Environment 2005). The Protocol establishes three flexible mechanisms:
Joint Implementation;
Clean Development Mechanism; and
International Emissions Trading. Should New Zealand fail to achieve the CP1 target of 0% increase from 1990 levels by 2012, it will have an opportunity to make up the difference through these mechanisms. If this is not achieved, the difference (plus a penalty) will be added to the target for the second commitment period. It is believed that there may be a slight surplus of Kyoto “emission units” due to offsets provided by forest sinks as a result of plantings since 1990.
4.3.1 Regulations
4.3.1.1 Current
Within the Climate Change Response Act 2002, the Minister has the power to set regulations requiring persons to keep and provide information to the inventory agency for the purpose of estimating New Zealand‟s human-induced emissions by sources and removals by sinks of Greenhouse Gases.
4.3.1.2 Future
On December 4th, 2007 the “Climate Change (Emissions Trading and Renewable Preference) Bill” (H. D. Parker 2007) was tabled in Parliament. The bill has two parts:
Part 1 amends the Climate Change Response Act 2002 to introduce a greenhouse gas emissions trading scheme covering all sectors and all gases.
Part 2 amends the Electricity Act 1992 to create a preference for renewable electricity generation by implementing a 10-year restriction on new base-load fossil-fuelled thermal electricity generation, except to the extent required to ensure the security of New Zealand‟s electricity supply.
4.3.2 Reporting
Present reporting of Greenhouse Gas emissions and sinks is performed on a national scale by the Ministry of the Environment who is responsible for overall development,

page 41 of 152
compilation and submission of the annual inventory to the UNFCCC. The Ministry for the Environment relies on contributions made by experts from industry, central and local government and science organisations to evaluate and compile this information. There are voluntary Greenhouse Gas emissions reporting programs in New Zealand. The better known programs and their basis for reporting are summarised in Table 6 at the end of this section. The Calculator associated with this Protocol will produce a summary of emissions which will enable the user to readily provide data to most voluntary programs internationally.
4.4 Republic of South Africa
South Africa is exempt from making legally binding commitments for the first commitment period of the Kyoto Protocol, which ends in 2012.
4.4.1 Regulations
4.4.1.1 Current
The current legislation covering Greenhouse Gas emissions is the National Environmental Management: Air Quality Act, 2004 with Notice 1138 of 2007 to establish the national framework in terms of the national environmental management (Marthinus Van Schalkwyk 2007). This act covers all forms of air quality with sections on Greenhouse Gases, climate change, emission inventory, the use of “Best Available Technology/Techniques (BAT)” and controlled emitters. The South African Air Quality Information System (SAAQIS) will provide access to information that is necessary for the production of an emission inventory. The information set will include:
Norms and standards for emission inventories;
Examples of emission inventories compiled in South Africa;
Search tools to interrogate the inventories;
Details of licensed emissions;
Details of emissions from point sources;
Details of emissions from mobile sources;
Details of emissions from area sources;
Details of emission factors for various activities; and
Documentation on Best Available Techniques (BAT).

page 42 of 152
4.4.1.2 Future
There are a number of regulations that are scheduled for promulgation in terms of the Air Quality Act in the foreseeable future. These are summarised in Table 6 below.
Ref. Description Proposed date for public comment
Proposed date for publication
AQA S23(1)
Notice declaring motor vehicles as Controlled Emitters and their associated emission standards
2007/8 2007/8
AQA S53(a)
Possible regulations relating to greenhouse gas information management
2007/8 2007/8
AQA S53(e)
Possible regulations on the management of Ozone-Depleting substances.
2008/9 2008/9
AQA S53(p)
To provide a revenue stream through the “polluter pays” principle to municipal air quality governance
2008/9 2008/9
AQA S53(p)
Possible regulations on fee calculator for atmospheric emission licence
2007/8 2008/9
Table 6: Schedule of proposed regulations for Air Quality Act
4.4.2 Reporting
Current reporting on Greenhouse Gas emissions is voluntary and predominately by larger companies through facilities such as the Carbon Disclosure Project. It has been reported (Schalkwyk 2007) that 74 percent of the Johannesburg Stock Exchange‟s (JSE) Top 40 companies have participated in this project. At this stage only major emitters including power providers are actively reporting on emissions and improvements. There are voluntary Greenhouse Gas emissions reporting programs accessible from South Africa. The better known programs and their basis for reporting are summarised in Table 6 at the end of this section. The Calculator associated with this Protocol will produce a summary of emissions which will enable the user to readily provide data to most voluntary programs internationally.
4.5 PAS 2050
The Publically Available Specification 2050, currently in draft form is likely to have major implications for wine producers exporting to the United Kingdom. This Specification dictates the methodology the United Kingdom gate keepers are likely to adopt in seeking product specific embodied carbon values to be included on all food product labels. See Section 1.4 of this report for more information on the PAS 2050 documentation.

page 43 of 152
Table 7: Overview of Greenhouse Gas Programs
Name of Program Type of Program
Focus (Organisation,
project, facility)
Gases Covered
Organisational Project
Boundaries
Operational Boundaries
Nature / Purpose of Program
Base Year Target Verification Countries Adopting
California Climate Action Registry
www.climateregistry.org
Voluntary registry
Organisation and project
Organisations report CO2 for first three years of participation, all six GHG‟s
thereafter
Equity share or control for
California or US operations
Scope 1 and Scope 2
required, Scope 3 to be decided
Baseline protection,
public reporting,
possible future targets
Specific to each organisation, recalculation
consistent with GHG Protocol corporate standard required
Encouraged but optional
Required through
certified third party verifier
United States / California
US EPA Climate Leaders
www.epa.gov/climateleaders
Voluntary reduction program
Organisation Six
Equity share or control for US operations at a
minimum
Scope 1 and Scope 2
required, Scope 3 optional
Public recognition, assistance
setting targets and achieving
reductions
Year that organisation joins
program, recalculation
consistent with GHG Protocol corporate standard required
Required, specific to each
organisation
Optional, provides
guidance and checklist of components
that should be included if undertaken
United States
Chicago Climate Exchange
www.chicagoclimateexchange.com
Voluntary allowance
trading scheme
Organisation and project
Six Equity share
Direct combustion and process emission
sources and indirect
emissions optional
Achieve annual targets
through tradable
allowance market
Average of three years
TBC Third party
verifier United States
WWF Climate Savers
www.worldwildlife.org/climatesavers
Voluntary registry
Organisation CO2
Equity share or control for worldwide operations
Scope 1 and Scope 2
required, Scope 3 optional
Achieve targets, public recognition,
expert assistance
Chosen year post 1990, specific to each
organisation, recalculation
consistent with GHG Protocol corporate standard required
Required, specific to each
organisation
Third party verifier
International

page 44 of 152
Name of Program Type of Program
Focus (Organisation,
project, facility)
Gases Covered
Organisational Project
Boundaries
Operational Boundaries
Nature / Purpose of Program
Base Year Target Verification Countries Adopting
World Economic Forum Global GREENHOUSE GAS Register
www.weforum.org
Voluntary registry
Organisation Six
Equity share or control for worldwide operations
Scope 1 and Scope 2
required, Scope 3 optional
Baseline protection,
public reporting,
targets encouraged but optional
Chosen year post 1990, specific to each
organisation, recalculation
consistent with GHG Protocol corporate standard required
Encouraged but optional
Third party verifier or spot
checks by WEF
International
EU GREENHOUSE GAS Emissions Allowance Trading
Scheme
www.europa.eu.int/comm/environment/
Mandatory allowance
trading scheme
Facility Six Facilities in
selected sectors Scope 1
Achieve annual caps
through tradable
allowance market, initial period from 2005 to2007
Determined by member country for allowance allocation
Annual compliance
with allocated and traded
allowances, EU committed to
8% overall reduction
below 1990
Third Party verifier
European Union
European Pollutant Emission Registry
www.europa.eu.int/comm/environment
/ippc/eper/index.htm
Mandatory registry for
large industrial facilities
Facility Six Kyoto gases as well as other
pollutants
Facilities that fall under EU IPPC
directive Scope 1 required
Permit individual industrial facilities
Not applicable Not applicable Local
permitting authority
European Union
Respect Europe BLICC
www.respecteurope.com/rt2/blicc/
Voluntary reduction program
Organisation Six
Equity share or control for worldwide operations
Scope 1 and Scope 2
required, Scope 3 encouraged
Achieve targets, public recognitions,
expert assistance
Specific to each organisation, recalculation
consistent with GHG Protocol corporate standard required
Mandatory, specific to each
organisation
Third Party verifier
European Union
Australian Greenhouse Office GREENHOUSE GAS
Challenge Plus (OSCAR)
www.greenhouse.gov.au
Mandatory registry for
large industrial facilities
Organisation and facility
Six
Equity share or control for Australian operations
Scope 1 and Scope 2 required
and selected Scope 3
Achieve targets, public recognition
Specific to each organisation
Mandatory, specific to each
organisation
Yes but not every year
Australia

page 45 of 152
Name of Program Type of Program
Focus (Organisation,
project, facility)
Gases Covered
Organisational Project
Boundaries
Operational Boundaries
Nature / Purpose of Program
Base Year Target Verification Countries Adopting
British Standard Institute PAS 2050: 2008 - DRAFT
Voluntary Embodied Carbon Six Specified by the
Protocol Scope 1, Scope 2
and Scope 3
Provides supply chain/
product emissions assesment
Specific to each organisation
Not applicable United
Kingdom
New Zealand CarboNZero
www.carbonzero.co.nz
Voluntary reduction program
Organisation and project
Six but mainly CO2
Equity share
Scope 1 and Scope 2
required, Scope 3 where
applicable
Achieve targets, public recognition
Specific to each organisation
Mandatory, specific to each
organisation
Yes
New Zealand
Carbon Disclosure Project
www.cdproject.net/
Voluntary reduction program
Organisation Six
Equity share or control for worldwide operations
Scope 1, Scope 2 and Scope 3
Achieve targets, public recognitions
Specific to each organisation
Mandatory, specific to each
organisation
Required to state if verified independantly
International

page 46 of 152
5 Calculation Methodology
5.1 Mobile Fuel Quantity Consumed
Emissions that arise from the combustion of fuel within mobile operating equipment including vehicles and plant or farming machinery are modelled using an approach similar to that used by the WRI in their Mobile Equipment model. In order to calculate the quantity of Greenhouse Gas emissions generated from fuels consumed within mobile equipment the following approach is taken. The fuel quantity normally measured as a volume, is converted into the Standard International unit for volume using the values in Table 8.
Volume Unit Conversion Factor to
Litres
L 1
scM 1000
scf 28.317
scy 764.559
quart 0.9475
Gal (US) 3.79
Gal (imp) 4.55179
Barrel 159.18 Table 8: Volumetric Conversion Factors (Perry 2002)
The volume of fuel is then converted into an energy value. Gigajoules are used as the emission factors assume this notation of units.

page 47 of 152
Fuel Type Fuel Energy (GJ /
Litre)
Gasoline / petrol 0.0344
Kerosene 0.0357
Jet Fuel 0.0000
Aviation gasoline 0.0343
Diesel 0.0371
Distillate fuel oil No.1 0.0371
Distillate fuel oil No.2 0.0371
Residual Fuel oil#4 0.0379
Residual Fuel oil#5 0.0397
Residual Fuel oil#6 0.0405
LPG 0.0249
Lubricants 0.0382
Anthracite 0.02860 GJ / kg
Bituminous coal 0.03023 GJ/kg
Butane 0.0258
Propane 0.0240
Natural gas 0.039 GJ / standard
cubic meter Table 9: Calorific Value of Fuel (Lower Heating Value) American Petroleum Institute 2001

page 48 of 152
All volumes of fuel are converted into Gigajoules in order to make use of published fuel emission factors.
Fuel Type EFfuel (kg CO2 /
GJ)
Gasoline / petrol 69.25
Kerosene 71.45
LPG 63.20
Natural gas 56.06
Diesel 74.01
Aviation gasoline 69.116
Butane 33.12
Propane 62.996
Distillate fuel oil 74.01
Residual Fuel oil#4 74.01
Residual Fuel oil#5 77.30
Residual Fuel oil#6 77.30
Lubricants 73.28
Anthracite 98.30
Bituminous coal 94.53
Wood, wood waste 100.446
Sub-bituminous coal 96.00
Table 10: Fuel Emission Factors (Intergovernmental Panel on Climate Change 2006)
This Gigajoule value is then multiplied by an emission factor to calculate the carbon dioxide equivalent.
CO2e fuel = Fuel Energy · EFfuel
Equation 1: Fuel Emission Calculations
This method or approach is based on the WRI‟s Greenhouse Gas Protocol method for calculating emissions from mobile operating equipment (vehicles) based on a volume consumed basis.
6 Source Data: Energy Information Administration

page 49 of 152
5.2 Distance Travelled
Occasionally organisations may not have complete records kept to indicate the volume of fuel consumed in their Scope 1 mobile operating equipment. In some cases it may be possible to gain some information by understanding the distance travelled. This might come in the form of odometer readings or log book records. It is critical to ensure that companies, who adopt this method and the quantity based method at the same time, do not double count emission sources. There must be a clear internal standard accounting principle to differentiate between the quantity-based method and the distance travelled method. The distance travelled approach is similar to that of the quantity-based method, but an efficiency value is used to relate the distance travelled to a fuel quantity consumed. Various types of vehicles have been included within the model. Some examples of fuel efficiency values are included below in Table 11.
Vehicle Type mpg (City Travel) mpg (Highway
Travel)
Small Gasoline Automobile 26.00 32.00
Medium Gasoline Automobile 22.00 30.00
Large Gasoline Automobile 18.00 25.00
LPG Automobile 60.00 60.00
Mini Van Gasoline 18.00 24.00
Large Van Gasoline 14.00 18.00
Light Truck Gasoline 14.00 14.00
Light Truck Diesel 15.00 15.00
Heavy Truck Gasoline 6.00 6.00
Heavy Truck Diesel 7.00 7.00
Bus Diesel 6.70 6.70
Motor Cycle Gasoline 60.00 60.00
Table 11: Typical Vehicle Fuel Efficiencies (US EPA 2000)
5.3 Stationary Combustion
Stationary combustion, as defined in the Protocol, is all combustion related activities that occur in fixed items, examples include hot water heaters, boilers and generators. Combustion is defined as the rapid oxidation of substances with the release of energy in the form of heat (Gillenwater 2005). The combustion of fuels produces the Greenhouse Gases carbon dioxide CO2, nitrous oxide N2O and methane CH4. Carbon dioxide is the predominate emission from combustion equipment and accounts for over 99% of total emissions even after factoring in the global warming potentials7 of nitrous oxide and methane (Gillenwater 2005).
Fuel
fuelGHGGHG EmissionsEmissions ,
Equation 2: Stationary Combustion Summation
7 The global warming potential of individual gas species is listed in Table 13.

page 50 of 152
efefefFuel COFuelONFuelCHFuelEmissions ,22,4
Equation 3: Single Fuel Summation Instructions (Australian Greenhouse Office 2006)
All fuels used within stationary combustion devices must be accounted for. In the case of using biomass as a combustion fuel, the Calculation Methodology does not account for the CO2 emissions but does include CH4 and N2O. The IPCC Guidelines provide default stationary combustion emission factors for CH4 and N2O. The default values depend upon the type of combustion equipment. It has been assumed that using industrial/commercial emission factors rather than power generation or domestic factors is most appropriate for the wine industry. The calculation methodology is similar to that adopted for use in mobile combustion systems for vehicles. The fuel use is initially converted from a volumetric basis to an energy basis. Due to the expected large volumes of fuel consumed within stationary combustion devices and the readily available information, Greenhouse Gases other than CO2 are also considered in generating an overall CO2e emission output. Standard stationary combustion emission factors are displayed in Table 12. .
Fuel Type
Emission Factors
CH4 (kg/GJ) N20 (kg/GJ) CO2e kg/GJ
Gasoline/Petrol 0.0002 0.0004 69.38
Kerosene 0.0002 0.0004 71.58
LPG 0.0009 0.0040 64.46
Natural gas 0.0010 0.0010 56.39
Diesel 0.0002 0.0004 74.14
Aviation gasoline 0.0002 0.0004 69.24
Butane 0.0009 0.0040 34.38
Propane 0.0009 0.0040 64.25
Distillate fuel oil No.2 0.0030 0.0003 74.17
Residual Fuel oil#4 0.0030 0.0003 74.17
Residual Fuel oil#5 0.0030 0.0003 77.46
Residual Fuel oil#6 0.0030 0.0003 77.46
Lubricants 0.0030 0.0003 73.44
Anthracite 0.0140 0.0007 98.81
Bituminous coal 0.0140 0.0007 95.04
Wood, wood waste 0.0110 0.0070 2.40
Table 12: CH4 and N20 emission contributions within stationary combustion equipment
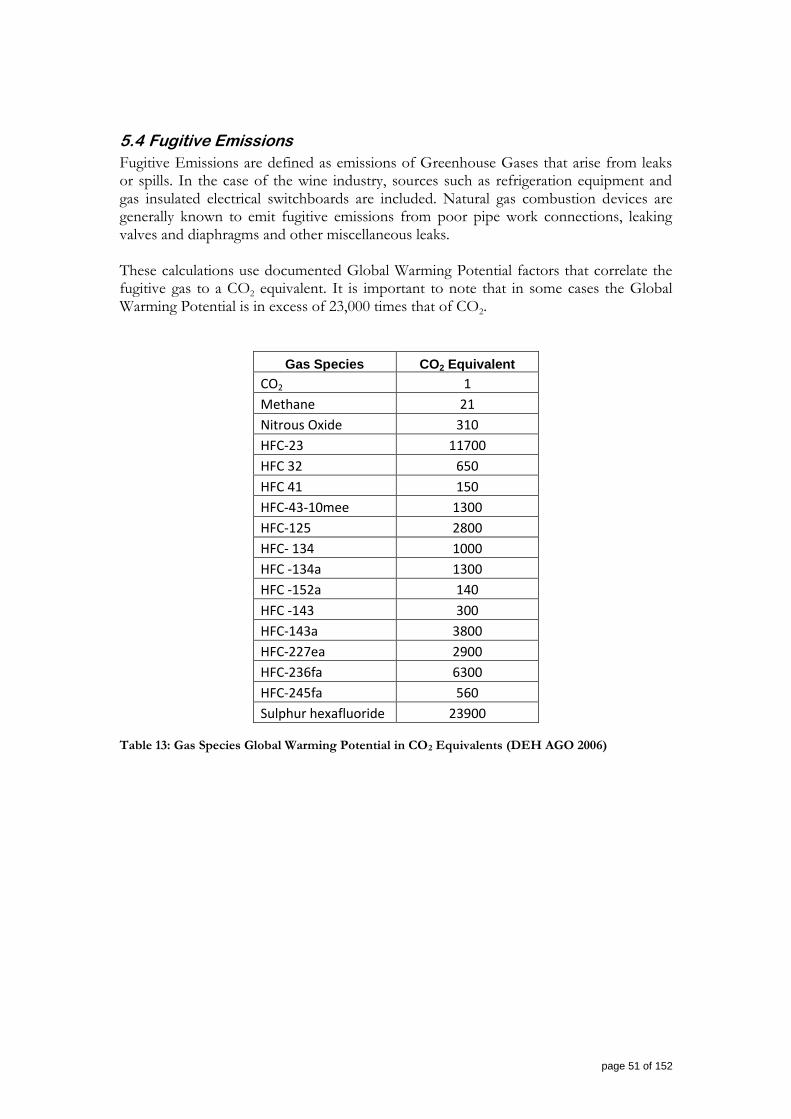
page 51 of 152
5.4 Fugitive Emissions
Fugitive Emissions are defined as emissions of Greenhouse Gases that arise from leaks or spills. In the case of the wine industry, sources such as refrigeration equipment and gas insulated electrical switchboards are included. Natural gas combustion devices are generally known to emit fugitive emissions from poor pipe work connections, leaking valves and diaphragms and other miscellaneous leaks. These calculations use documented Global Warming Potential factors that correlate the fugitive gas to a CO2 equivalent. It is important to note that in some cases the Global Warming Potential is in excess of 23,000 times that of CO2.
Gas Species CO2 Equivalent
CO2 1
Methane 21
Nitrous Oxide 310
HFC-23 11700
HFC 32 650
HFC 41 150
HFC-43-10mee 1300
HFC-125 2800
HFC- 134 1000
HFC -134a 1300
HFC -152a 140
HFC -143 300
HFC-143a 3800
HFC-227ea 2900
HFC-236fa 6300
HFC-245fa 560
Sulphur hexafluoride 23900 Table 13: Gas Species Global Warming Potential in CO2 Equivalents (DEH AGO 2006)

page 52 of 152
Two methods have been used to model emissions from fugitive sources. The first is based on a known recharge weight; users establish their yearly recharge weight of HFC which is then converted into a CO2e emission using the factors from Table 13. The second method relies upon a default loss rate where users estimate the total HFC charge in their refrigeration system and the emissions will be calculated using the default emission values from Table 14.
Unit Type Default Loss Rate
Domestic refrigeration 0.03
Domestic window/wall air conditioning 0.03
domestic split system 0.03
Commercial air conditioning chiller 0.085
Commercial air conditioning non chiller based 0.03
Transport Refrigeration 0.33
Mobile Refrigeration Systems 0.15
Gas insulated switchgear 0.005 Table 14: Default HFC Losses (Australian Greenhouse Office 2006)
5.5 Winemaking Practices
The majority of carbon dioxide emitted as part of the winemaking process is due to the fermentation of sugar to ethanol and carbon dioxide. Although part of the short-term carbon cycle, and therefore not reported, understanding the CO2 produced in the winemaking process provides valuable information for the industry as a whole. Emphasis must be placed on the fact that as fermentation is part of the short-term carbon cycle and is by definition never reported as a Greenhouse Gas emission. The calculation methodology is based on Equation 4, in which the sugar, contained within the grapes is converted into ethanol with the release of carbon dioxide. This industry is thought to have a good understanding of both the crush size and the sugar level within the fruit, often expressed in terms of Baume.
C6H12O6 → 2 C2H5OH + 2 CO2
Equation 4: Fermentation Equation
In order to understand the total release of carbon dioxide during the fermentation process, all ferments, including those done with bulk or purchased juice are included. The residual sugar content of the finished wine is included in the calculations. Calculations are done stoichiometrically; for every mole of sugar fermented two moles of carbon dioxide are generated.
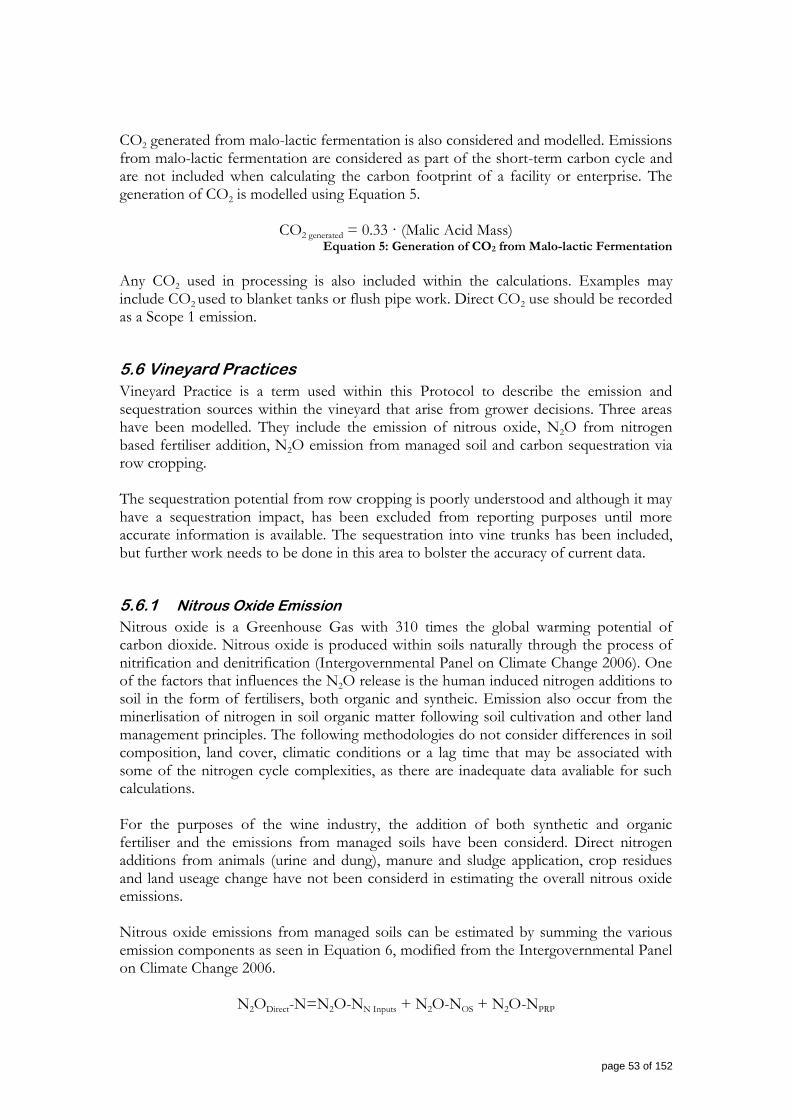
page 53 of 152
CO2 generated from malo-lactic fermentation is also considered and modelled. Emissions from malo-lactic fermentation are considered as part of the short-term carbon cycle and are not included when calculating the carbon footprint of a facility or enterprise. The generation of CO2 is modelled using Equation 5.
CO2 generated = 0.33 · (Malic Acid Mass) Equation 5: Generation of CO2 from Malo-lactic Fermentation
Any CO2 used in processing is also included within the calculations. Examples may include CO2 used to blanket tanks or flush pipe work. Direct CO2 use should be recorded as a Scope 1 emission.
5.6 Vineyard Practices
Vineyard Practice is a term used within this Protocol to describe the emission and sequestration sources within the vineyard that arise from grower decisions. Three areas have been modelled. They include the emission of nitrous oxide, N2O from nitrogen based fertiliser addition, N2O emission from managed soil and carbon sequestration via row cropping. The sequestration potential from row cropping is poorly understood and although it may have a sequestration impact, has been excluded from reporting purposes until more accurate information is available. The sequestration into vine trunks has been included, but further work needs to be done in this area to bolster the accuracy of current data.
5.6.1 Nitrous Oxide Emission
Nitrous oxide is a Greenhouse Gas with 310 times the global warming potential of carbon dioxide. Nitrous oxide is produced within soils naturally through the process of nitrification and denitrification (Intergovernmental Panel on Climate Change 2006). One of the factors that influences the N2O release is the human induced nitrogen additions to soil in the form of fertilisers, both organic and syntheic. Emission also occur from the minerlisation of nitrogen in soil organic matter following soil cultivation and other land management principles. The following methodologies do not consider differences in soil composition, land cover, climatic conditions or a lag time that may be associated with some of the nitrogen cycle complexities, as there are inadequate data avaliable for such calculations. For the purposes of the wine industry, the addition of both synthetic and organic fertiliser and the emissions from managed soils have been considerd. Direct nitrogen additions from animals (urine and dung), manure and sludge application, crop residues and land useage change have not been considerd in estimating the overall nitrous oxide emissions. Nitrous oxide emissions from managed soils can be estimated by summing the various emission components as seen in Equation 6, modified from the Intergovernmental Panel on Climate Change 2006.
N2ODirect-N=N2O-NN Inputs + N2O-NOS + N2O-NPRP
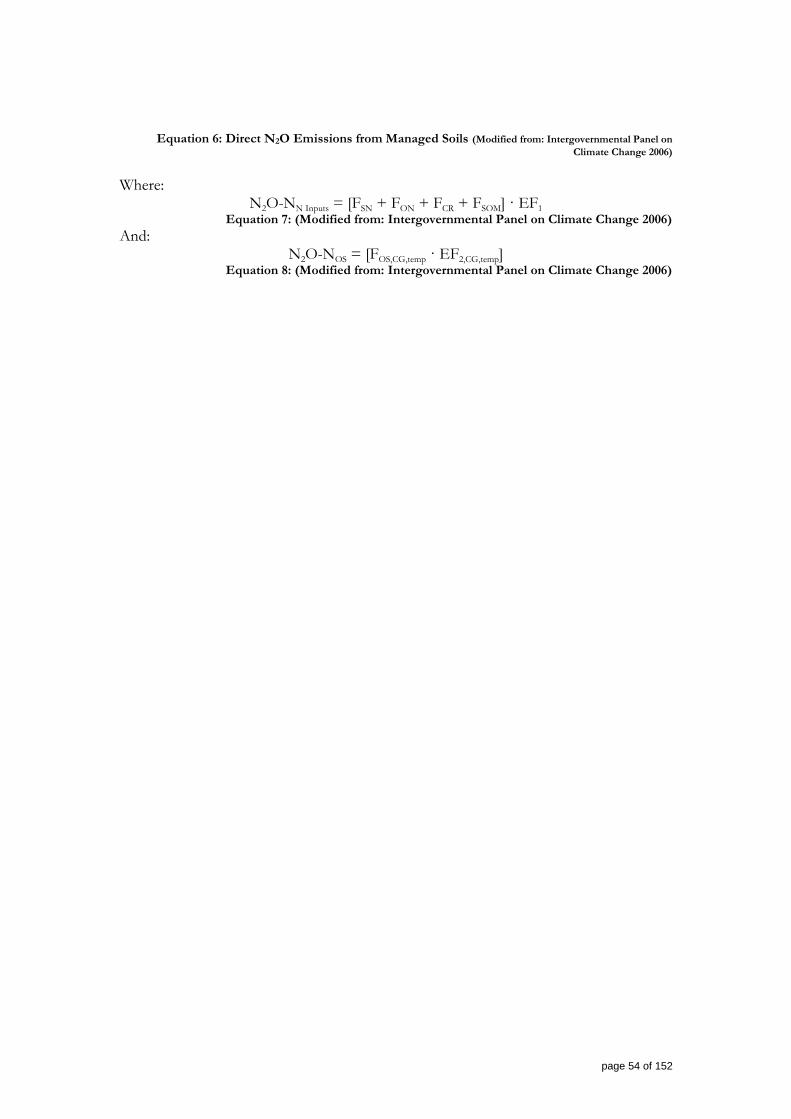
page 54 of 152
Equation 6: Direct N2O Emissions from Managed Soils (Modified from: Intergovernmental Panel on
Climate Change 2006)
Where:
N2O-NN Inputs = [FSN + FON + FCR + FSOM] · EF1 Equation 7: (Modified from: Intergovernmental Panel on Climate Change 2006)
And: N2O-NOS = [FOS,CG,temp · EF2,CG,temp]
Equation 8: (Modified from: Intergovernmental Panel on Climate Change 2006)

page 55 of 152
Given:
Symbol Explanation
N2ODirect-N Annual direct N2O-N emissions (kg N2O-N yr-1)
N2O-NN
Inputs Annual direct N2O-N emissions from N addition (kg N2O-N yr-1)
N2O-NOS Annual direct N2O-N emissions from managed soil (kg N2O-N yr-1)
FSN Annual amount of synthetic fertiliser addition (kg N yr-1)
FON Annual amount of organic N addition, manure, sludge etc. (kg N yr-1)
FCR Annual amount of N in crop residue (generally for N fixing crops) (kg N yr-1)
FOS,CG,temp Annual area of managed/drained organic soils (ha)
EF1 Emission factor for N inputs
EF2,CG,temp Emission factor for managed/drained soils Table 15: Symbol Explanation
There is currently an absence of published work on nitrous oxide emissions within vineyards, so in order to estimate the emissions, the following default values have been used in Equation 6 to Equation 8.
Emission Factor Default Value Uncertainty Range Choice
EF1 (kg N2O-N yr-1) 0.01 0.003-0.03 0.01
EF2 (kg N2O-N ha-1) 8 2-24 3 Table 16: Nitrous Soil Emission Factors (Intergovernmental Panel on Climate Change 2006)
The default value of 0.01 is used for EF1. In the case of EF2, we have opted for a lower value than the default value owing to the less intensive cultivation of soil within vineyards than other farmed crops. The final quantity of nitrous oxide emitted from a vineyard is then calculated using Equation 9.
N2O = (N2O – N) · (44/28) Equation 9: N2O Quantity (Intergovernmental Panel on Climate Change 2006)
5.6.2 Row Cropping
The growth of permanent crops between rows within the vineyard is thought to offer potential for carbon sequestration, by increasing soil carbon content. There are very few data and published work available on which to model this process. For this reason the carbon sequestration from this source has not been included within the reportable scope 1 emissions. A brief model is suggested as a placeholder for this process.

page 56 of 152
CSoil Increase = [15% (Carbon Content of Crop) ]/ 15 years Equation 10: Row Cropping Carbon Addition (Camilleri, Cecil 2006)
We assume 50 tonnes of carbon present per hectare of row crops. Therefore the equation becomes:
CSoil Increase= (Cropped hectares) · (0.15 · 50)/15 Equation 11: Row Cropping in Hectares (Camilleri, Cecil 2006)
CO2equivalent = CSoil Increase · (44/12)
Equation 12: Conversion of Soil Carbon to CO2e
5.7 Biomass Photosynthesis
Biomass photosynthesis may be considered part of the short-term carbon cycle but is included within the Calculator to give a better understanding of emission and sink sources within the industry. These calculations are included as place holders. The sugar content of the fruit can be measured and is assumed to be known. Using the photosynthesis equation, the amount of CO2 needed to produce the sugar is calculated. Sugar is only a portion of the total effect of photosynthesis. Other items include, fruit cluster growth, shoots and leaves, permanent vine structure and root growth. These items are known to occupy a certain proportion of the vine, allowing the total CO2 utilised in growing a vine to be calculated. We have assumed that the root mass is related to the above ground biomass. We have assumed that part of the prunings from the vine is sequestered into the soil and part is emitted as CO2 via the decomposition process. Sequestration is thought to occur into the fruit, into the permanent structures, into the root biomass and partly into the ground via the shoot pruning decomposition. We have assumed aerobic decay of the prunings on the vineyard floor.
CO2(gas) + 12 H2O(liquid) + photons → C6H12O6(aqueous) + 6 O2(gas) + 6 H2O(liquid)
carbon dioxide + water + light energy → sugars + oxygen + water Equation 13: Photosynthesis Equation
Vine Component Portion of CO2 Consumed %
Sugar content in grapes 10.6
Carbohydrate reserves 5.2
Permanent structures 2.3
Current seasons shoots and leaves 19.1
Cluster biomass 12.8
Vine respiration 50
Total 100 Table 17: Vine Carbon Partitioning (Williams 1995)
It is thought that the root biomass can be approximated as 25% of the above ground biomass with a carbon content of 48%.

page 57 of 152
Although the shoots and leaves will sequester carbon dioxide during their growth phase it thought that there is also an associated emission factor with the breakdown of this vine component in the form of prunings. This process is not well understood but is modelled, as a placemarker, by assuming that 45% of the carbon in the shoots and roots is sequestered into the ground as an increase in soil humus, with the remainder emitted as carbon dioxide to the atmosphere.
5.8 Waste Disposal
Waste disposal is only categorised as part of Scope 1 if it done within your operating boundary. If the waste processing is done offsite, at a premise controlled by another company, any emissions occurring will be categorised as Scope 3 emissions. The breakdown of waste material releases two Greenhouse Gases, carbon dioxide and methane. The generation of carbon dioxide from waste within waste water systems and landfill sites is not attributed to the industry as it is regarded as part of the short-term carbon cycle (Intergovernmental Panel on Climate Change 2006). The Wine Industry Protocol considers emmsions of methane from both solid and liquid waste treatment centres. If methane is collected (for combustion applications) or flared, it is subtracted from the emissions.
5.8.1 Solid Waste
It is assumed that solid waste disposal occurs in well managed landfill sites and we have treated land application of marc within the vineyard as a placemarker. The generation of methane emitted from the landfill sites can be approximated using Equation 14.
GHG Emissions (t CO2e) = [(Q·DOC)/3-R)]·(18.9) Equation 14: Methane Generation from Landfill (DEH AGO 2006)
Symbol Identification
Q Quantity of solid waste expressed in tonnes
DOC Degradable Organic Carbon – see Table 19
R Recovered methane (tonnes) Table 18: Equation 14 Symbols

page 58 of 152
The DOC content is dependent upon the nature of the waste. In the absence of more accurate data the default values in Table 19 are used within Equation 14.
Waste Type Default DOC
Paper and Paper Board 0.4
Wood and Straw 0.5
Garden and Park 0.17
Food 0.15
Co-mingled 0.15
Concrete, metals, plastics and glass
0
Table 19: Default Degradable Organic Carbon Content (DEH AGO 2006)
Specific default DOC values have not been published for waste sources commonly seen within the wine industry. For the purpose of generating a placemarker we have assumed that wine industry solid waste can be approximated using the broad categories listed in Table 19. The following default DOC values for wine industry specific solid waste have been used.
Waste Type Default DOC
Paper and Paper Board 0.4
Vineyard woody pruning’s, 0.5
Vineyard leafy waste 0.17
Grape marc, pomace, grape stalks and stems
0.17
Lees 0.15
Co-mingled 0.15
Metals, plastics and glass 0
Table 20: Wine Industry Specific Solid Waste DOC
The emission values generated when using this methodology are potentially high. Solid waste takes a long time to degrade often up to fifty years. This calculation methodology assumes total digestion in only 12 months, allowing for a single year calculation. Where Possible users should endeavour to understand if methane is collected or flared from landfill sites.
5.8.2 Wastewater Treatment
The total Greenhouse Gas emissions occurring from wastewater systems are calculated by the summation of emissions from the waste water treatment and the sludge treatment. The generation of methane is considered; the generation of carbon dioxide is not. The emissions of methane from waste water are dependent upon the organic concentrations within the water. This organic carbon concentration is measured using the Chemical Oxygen Demand. In the absence of specific data on sludge removal, a

page 59 of 152
simplified formula is used to approximate methane generation within industrial type waste water (DEH AGO 2006).
GHG Emissions (t CO2e) = [Wgen·CODcon·(0.1949)- R]·(21/1000) Equation 15: Waste Water Methane Generation (DEH AGO 2006)
Symbol Identification
Wgen Waste water generation in kL or cubic meters
CODcon Chemical Oxygen Demand in kg per kL
R Recovered methane (tonnes) Table 21: Equation 15 Symbols
Recovered methane is either flared or used for on-site power generation. Within each company there may be a number of different waste water treatment options. Examples may include winery waste water disposal systems, ablutions septic systems and ground water runoff systems.
5.9 Purchased Power
Scope 2 purchased power is clearly defined within the Protocol. It relates to the emissions generated to produce the quantity of power paid for by a company. Transmission and distribution of power has an associated inefficiency, which results in electrical losses. These losses have an associated emission factor, which is categorised within Scope 3. Emission factors are known for each of the electricity grids in the areas in which this tool will be used. These emission factors come in two forms. The first relates to the actual power generation and is categorised as Scope 2, refer to Equation 16.
Scope 2 GHG Emissions (t CO2e) = [(EFregion specific scope 2)·(kWhpurchased)] Equation 16: Scope 2 Power Use
The second emission factor relates to the electrical loss due to transmission and distribution inefficiencies
Scope 3 GHG Emissions (t CO2e) = [(EFregion specific scope 3)·(kWhpurchased)] Equation 17: Scope 3 Power Transmission and Distribution Losses
Scope 2 emission factors for purchased power vary widely between regions. Regions with abundant „green‟ energy solutions such as wind, solar and hydro power generally have lower Scope 2 emission factors. Examples of this can be seen in the Californian, Tasmanian and New Zealand power networks. In most regions companies are now being offered options to purchase „greener‟ power, often but not always, at a premium price. This option of purchasing „green‟ power can lead to Greenhouse Gas emission reductions. An example of Scope 2 emission factors are displayed in Table 22. All Scope 2 emission factors can be seen in Appendix E.

page 60 of 152
Area Electrical
Grid
Emissions Factor (grams of CO2/
kWh)
United States
Scope 2
ASCC ASCC
ASCC Alaska Grid AKGD 635.0164128
ASCC Miscellaneous AKMS 343.7444304
ECAR ECAR
ECAR Michigan ECMI 740.3006016
ECAR Ohio Valley ECOV 892.0166472
ERCOT All ERCT 638.7921792
FRCC All FRCC 630.522144
HICC HICC
HICC Miscellaneous HIMS 772.4472336
HICC Oahu HIOA 780.9599448
MAAC All MAAC 497.850948
MAIN MAIN
MAIN North MANN 798.830424
MAIN South MANS 561.2338368 Table 22: Scope 2 Power Emission Factors – Example (Modified from: Pechan, E.H & Associate 2003)
Scope 3 emission factors are can be presented in the same way. We have emission factors relating to transmission and distribution losses for the grid network within Australia and have used an average value for other regions until improved data is sourced.
Region Scope 3 Emission
Factor (grams of CO2/ kWh)
South Australia 0.177
Western Australia 0.096
Northern Territory 0.034
Queensland 0.143
New South Wales 0.176
Victoria 0.086
Tasmania 0.01 Table 23: Scope 3 Emission Factors - Transmission and Distribution Losses (DEH AGO 2006)

page 61 of 152
5.10 Packaging
Packaging is a complex area to model. There are many subtleties that influence the overall accuracy of the calculations. We have simplified this Protocol and model to consider five main packaging areas. They are bottles and containers, wine bags, closures, fibre packaging and wooden products. In order to correctly estimate the Greenhouse Gas emissions due to these items each needs to have undergone a comprehensive Life Cycle Analysis (LCA). Even if a product does have a full LCA understanding, the distribution of that product to its point of use, may not be understood, but may influence the overall footprint. The lack of information on which to base the calculations has resulted in the need to make significant assumptions in estimating the Greenhouse Gas impact of packaging components. In all cases the best approximation of emission factors has been used within this calculation page. In some cases this means that we have adopted the „average‟ emission factor based on multiple information sources. Emissions from the production and supply of packaging equipment are calculated using an all encompassing emission factor. This factor is generally calculated from conducting a LCA. The emission factor considers all aspects of Greenhouse Gas emission involved within using that particular product. This all encompassing emission factor is multiplied by the quantity of product used.
5.10.1 Bottles and Containers
We have initially considered glass, PET, Tetra Pak and aluminium cans. The information provided by suppliers of these is varied in detail, independence and quality. In all cases we have sought to use an encompassing emission factor which can be used within Equation 18.
GHGemissions (CO2e)= EF · Quantity of Packing Material Equation 18: Packaging Emission Calculation
Glass offers a particular challenge in understanding the Greenhouse Gas emissions. Currently we have modelled glass using a simple emission factor. Significant future work will need to be carried out on glass, possibility including factors such as furnace design, cullet percentage, furnace fuel type, furnace age, glass colour, run length and product weight. In larger companies glass is often purchased from suppliers on a mass basis, rather than a unit basis. We have elected to use a unit and unit mass basis for our calculations to allow for the easy comparison between packaging product types. In some cases this will mean that users will need to back calculate the number of units purchased and the average weight of those containers.

page 62 of 152
5.10.2 Wine Bags
The Greenhouse Gas impact of wine bags have been calculated by summing the individual impact of the bag in box components, including the paper/cardboard carton, the aluminium component of the bag and the plastic component of the bag.
GHGwine bag = EFcardboard·Cardboardmass + EFaluminium·Aluminiummass + EFplastic·Plasticmass
Equation 19: Wine Bags Calculation
5.10.3 Closures
We have endeavoured to include all common closures in our calculations of the Greenhouse Gas impact from this packaging component. In all cases average emission factors from the combined sources have been used.
GHGclosure = EF · Closure Quantitymass
Equation 20: Closure Calculations
Where emission factors are not currently available a place holder value has been used in its place. Closures listed include, metal screw caps, natural cork with a PVC capsule, agglomerate cork with a PVC capsule, agglomerate cork with an aluminium capsule, glass stoppers, synthetic corks and ZORKs. As data becomes available we expect to be able to differentiate in increasing detail.
5.10.4 Fibre Packaging
Fibre packaging is used to describe the cartons and dividers used for packaging the finished wine product. Currently the same emission factor is used for all fibre packaging regardless of type. The emission factor is assumed to be all encompassing and can be used within an equation such as Equation 18. It is possible that a sensitivity analysis will result in this being dropped from the model after beta testing.
5.10.5 Wooden Products
Wooden packaging products include both returnable and non-returnable pallets. In calculating the emission factors only the in-use and disposal impacts have been considered. In the case of returnable pallets, it is assumed that the pallet will have a life span that we can estimate as infinite and hence has an emission factor of zero. A large number of assumptions have been made in selecting this emission factor, including neglecting the transport impact of pallets.
5.11 Contract Equipment
This section of the Calculator considers the emissions that arise from contract vehicles used within the vineyard. Specifically the uses of various tractors and helicopters have been modelled. Please note that this section of the tool is to be used for contract machinery or equipment only.
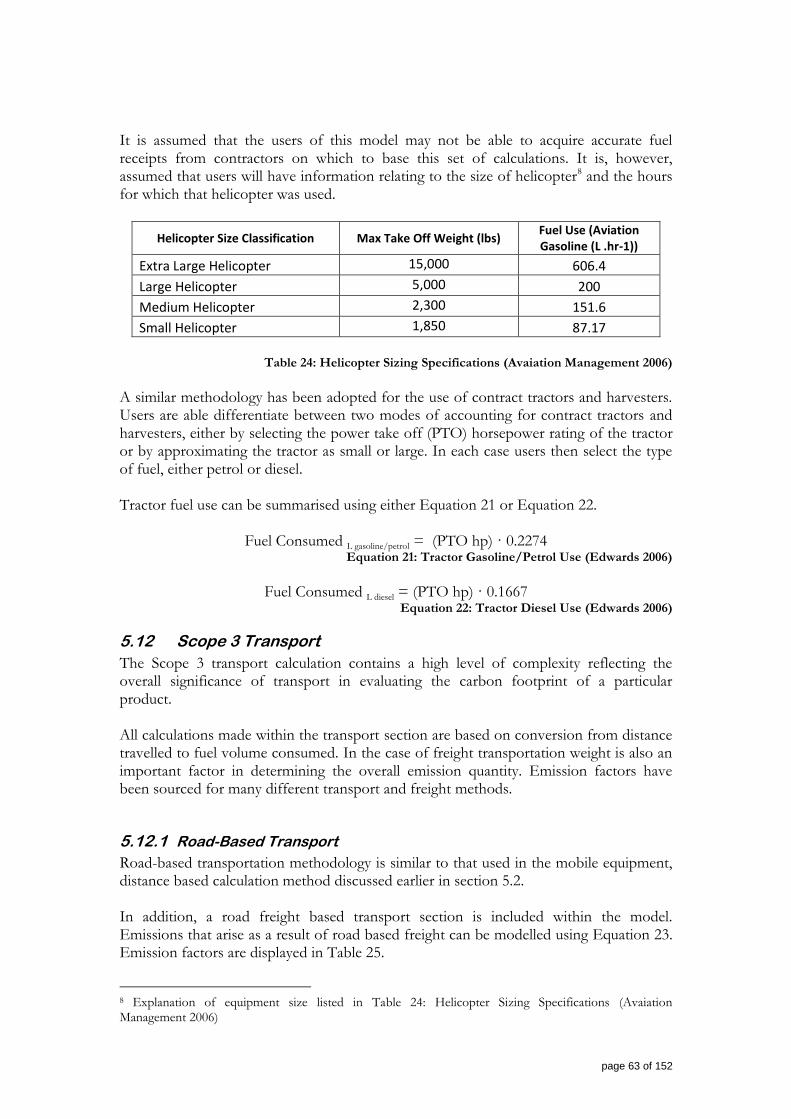
page 63 of 152
It is assumed that the users of this model may not be able to acquire accurate fuel receipts from contractors on which to base this set of calculations. It is, however, assumed that users will have information relating to the size of helicopter8 and the hours for which that helicopter was used.
Helicopter Size Classification Max Take Off Weight (lbs) Fuel Use (Aviation Gasoline (L .hr-1))
Extra Large Helicopter 15,000 606.4
Large Helicopter 5,000 200
Medium Helicopter 2,300 151.6
Small Helicopter 1,850 87.17
Table 24: Helicopter Sizing Specifications (Avaiation Management 2006)
A similar methodology has been adopted for the use of contract tractors and harvesters. Users are able differentiate between two modes of accounting for contract tractors and harvesters, either by selecting the power take off (PTO) horsepower rating of the tractor or by approximating the tractor as small or large. In each case users then select the type of fuel, either petrol or diesel. Tractor fuel use can be summarised using either Equation 21 or Equation 22.
Fuel Consumed L gasoline/petrol = (PTO hp) · 0.2274 Equation 21: Tractor Gasoline/Petrol Use (Edwards 2006)
Fuel Consumed L diesel = (PTO hp) · 0.1667
Equation 22: Tractor Diesel Use (Edwards 2006)
5.12 Scope 3 Transport
The Scope 3 transport calculation contains a high level of complexity reflecting the overall significance of transport in evaluating the carbon footprint of a particular product. All calculations made within the transport section are based on conversion from distance travelled to fuel volume consumed. In the case of freight transportation weight is also an important factor in determining the overall emission quantity. Emission factors have been sourced for many different transport and freight methods.
5.12.1 Road-Based Transport
Road-based transportation methodology is similar to that used in the mobile equipment, distance based calculation method discussed earlier in section 5.2. In addition, a road freight based transport section is included within the model. Emissions that arise as a result of road based freight can be modelled using Equation 23. Emission factors are displayed in Table 25.
8 Explanation of equipment size listed in Table 24: Helicopter Sizing Specifications (Avaiation Management 2006)

page 64 of 152
GHGRoad freight = Freight weighttonnes · Freight distancekm · EFTruck type
Equation 23: Road Based Freight Emissions
Vehicle Type
Emission Factor (kgCO2 / Tonne
Km)
Light Commercial Vehicle 1.800
Medium or Rigid Truck 0.178
Heavy or Articulated Truck 0.115
Table 25: Road Freight Emission Factors (Apelbaum Consulting n.d.)
5.12.2 Rail Transport
Three factors are used to determine the Greenhouse Gas emissions from rail freight; distance travelled, freight weight and locomotive type. In most cases users will not be able to determine the exact type of locomotive to transport their goods. In the absence of better data, users can select the „average locomotive‟ emission factors. Emissions that arise as a result of rail freight can be modelled using Equation 24. Emission factors are displayed in Table 26.
GHGRail freight = Freight weighttonnes · Freight distancekm · EFlocomotive type
Equation 24: Rail Freight Emissions
Train Model
Emission Factor
(kgCO2 / Tonne Km)
EMD SD-40 0.0296
EMD SD-60 0.0263
EMD SD-70 0.0255
EMD - SD75 0.0246
GE Dash 8 0.0263
GE Dash 9 0.0257
2TE116 0.0256
2TE10M 0.0270
TEII60 0.0283
TEII70 0.0253
Average Locomotive 0.0264 Table 26: Rail Freight Emission Factors (Australian Greenhouse Office 2006)
5.12.3 Air Transport
Air travel is very energy intensive and consequently has a high Greenhouse Gas impact. Complex algorithms have been published to calculate the emissions that arise from air transport as significantly more fuel is consumed during the take off and climb section of

page 65 of 152
the flight when compared to the cruise section. Emission models are available that account for the number of take offs on a particular freight path, however, it is thought that users of this Protocol will not be able to get accurate data in which to use a more complex model. For this reason we have selected a simple model for air travel which considers two flight options, short haul and long haul9. Emissions arising from passenger air travel can be modelled using Equation 25 and Equation 26.
GHGLong Haul = Passenger distance travelled · EFLong Haul
Equation 25: Passenger Air Travel Long Haul
GHGShort Haul = Passenger distance travelled · EFShort Haul
Equation 26: Passenger Air Travel Short Haul
Three factors are used to determine the Greenhouse Gas emissions from air freight, they are distance travelled, freight weight and selection of long or short haul flight path. These factors are combined in the
GHGHaul Short or long = Freight Weighttonnes · Freight distancekm · EFHaul
Equation 27: Air Freight Emissions (DEFRA 2005)
Long and short haul emission factors are displayed in
Table 27. wrong numbers again
Distance Emisson Factor (kg CO2 tonne. km -1)
Short haul 0.57
Long Haul 1.58 Table 27: Air Freight Emission Factors (DEFRA 2005)
9 Short Haul is defined as a journey under 500km. Long haul is defined as a journey over 500km (DEFRA 2005).

page 66 of 152
5.12.4 Shipping Transport
Three factors are used to determine the Greenhouse Gas emissions from shipping freight they are distance travelled, freight weight and ship type. In order to calculate the emissions due to shipping freight Equation 28 is used.
GHGShipping freight = Freight weighttonnes · Freight distancekm · EFShip type
Equation 28: Shipping Emission Equation
Ship Type EF (kg CO2
Tonne km -1)
Container 0.014
Refrigerated Cargo 0.074
RoRo Cargo (Small) 0.056
RoRo Cargo (Large) 0.02
Bulk Dry 0.045 Table 28: Ship Type Emission Factors (CE Delft 2006)
5.13 Purchased Wine Related Products
All components in this section of the Calculator are modelled using an emission factor approach similar to that seen in Equation 29.
GHGWine making product = Product mass · EFspecific product
Equation 29: Wine Related Product
In the case of juice, wine, grapes and spirit an iterative approach will be needed to develop more accurate emission factors. It is expected that as the Calculator is used, data will be built up that will help in refining these emission factors. Currently these items are modelled using place holder values. Barrels are modelled using an emission factor taken from dimensional lumber. This will need further refinement. Tartaric acid and bentonite are modelled with place holder values. Future work is needed to develop these factors.
5.14 Scope 3 Waste
The calculation methodology used for Scope 3 waste is similar to that used for Scope 1 waste. Refer to section 5.8 for more detail.
5.15 Summation Sheet
The summation sheet is intended to be as simple as possible to understand and interpret. The data from the calculation pages are represented in four separate categories. Scope 1

page 67 of 152
for reporting purposes, Scope 2 for reporting purposes and Scope 3. A separate section includes the short-term carbon cycle.
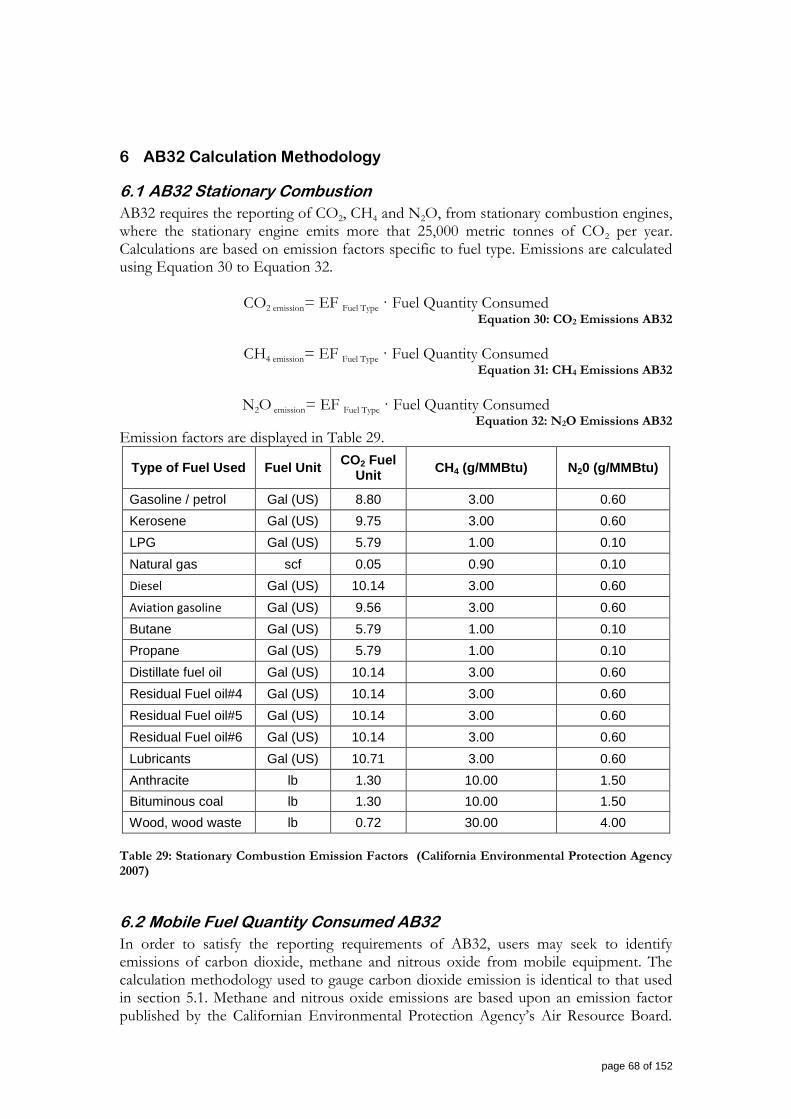
page 68 of 152
6 AB32 Calculation Methodology
6.1 AB32 Stationary Combustion
AB32 requires the reporting of CO2, CH4 and N2O, from stationary combustion engines, where the stationary engine emits more that 25,000 metric tonnes of CO2 per year. Calculations are based on emission factors specific to fuel type. Emissions are calculated using Equation 30 to Equation 32.
CO2 emission= EF Fuel Type · Fuel Quantity Consumed Equation 30: CO2 Emissions AB32
CH4 emission= EF Fuel Type · Fuel Quantity Consumed
Equation 31: CH4 Emissions AB32
N2O emission= EF Fuel Type · Fuel Quantity Consumed
Equation 32: N2O Emissions AB32
Emission factors are displayed in Table 29.
Type of Fuel Used Fuel Unit CO2 Fuel
Unit CH4 (g/MMBtu) N20 (g/MMBtu)
Gasoline / petrol Gal (US) 8.80 3.00 0.60
Kerosene Gal (US) 9.75 3.00 0.60
LPG Gal (US) 5.79 1.00 0.10
Natural gas scf 0.05 0.90 0.10
Diesel Gal (US) 10.14 3.00 0.60
Aviation gasoline Gal (US) 9.56 3.00 0.60
Butane Gal (US) 5.79 1.00 0.10
Propane Gal (US) 5.79 1.00 0.10
Distillate fuel oil Gal (US) 10.14 3.00 0.60
Residual Fuel oil#4 Gal (US) 10.14 3.00 0.60
Residual Fuel oil#5 Gal (US) 10.14 3.00 0.60
Residual Fuel oil#6 Gal (US) 10.14 3.00 0.60
Lubricants Gal (US) 10.71 3.00 0.60
Anthracite lb 1.30 10.00 1.50
Bituminous coal lb 1.30 10.00 1.50
Wood, wood waste lb 0.72 30.00 4.00
Table 29: Stationary Combustion Emission Factors (California Environmental Protection Agency 2007)
6.2 Mobile Fuel Quantity Consumed AB32
In order to satisfy the reporting requirements of AB32, users may seek to identify emissions of carbon dioxide, methane and nitrous oxide from mobile equipment. The calculation methodology used to gauge carbon dioxide emission is identical to that used in section 5.1. Methane and nitrous oxide emissions are based upon an emission factor published by the Californian Environmental Protection Agency‟s Air Resource Board.

page 69 of 152
Emission factors are categorised by vehicle type and age and are based on a distance travelled factor according to Equation 33.
CH4 emission= EF vehicle age and type · Distance Travelled
Equation 33: AB32 Methane from Mobile Equipment
N2O emission= EF vehicle age and type · Distance Travelled
Equation 34: AB32 Nitrous Oxide from Mobile Equipment
The emission factors used to calculate methane and nitrous emissions for AB32 are displayed in Table 30.

page 70 of 152
Vehicle Type CH4 (g/mile) N2O (g/mile)
Passenger Car Gasoline 1966 - 1972 0.22 0.02
Passenger Car Gasoline 1973 - 1974 0.19 0.02
Passenger Car Gasoline 1975 - 1979 0.11 0.05
Passenger Car Gasoline 1980 - 1983 0.07 0.08
Passenger Car Gasoline 1984 - 1991 0.06 0.08
Passenger Car Gasoline 1992 0.06 0.07
Passenger Car Gasoline 1993 0.05 0.05
Passenger Car Gasoline 1994 - 1999 0.05 0.04
Passenger Car Gasoline 2000 - 0.04 0.04
Passenger Car Diesel All Years 0.01 0.02
Passenger Car LPG 2000 - 0.04 0.04
Passenger Car CNG 2000 - 0.04 0.04
Passenger Car E85 0.04 0.04
Light Gasoline Truck (<5750 GVWR) 1966 - 1972 0.22 0.02
Light Gasoline Truck (<5750 GVWR) 1973 - 1974 0.23 0.02
Light Gasoline Truck (<5750 GVWR) 1975 - 1979 0.14 0.07
Light Gasoline Truck (<5750 GVWR) 1980 - 1983 0.12 0.13
Light Gasoline Truck (<5750 GVWR) 1984 - 1991 0.11 0.14
Light Gasoline Truck (<5750 GVWR) 1992 0.09 0.11
Light Gasoline Truck (<5750 GVWR) 1993 0.07 0.08
Light Gasoline Truck (<5750 GVWR) 1994 - 1999 0.06 0.06
Light Gasoline Truck (<5750 GVWR) 2000 - 0.05 0.06
Light Truck (<5750 GVWR)LPG 2000 - 0.05 0.06
Light Truck (<5750 GVWR)CNG 2000 - 0.05 0.06
Light Truck (<5750 GVWR)E85 0.05 0.06
Light Truck (<5750 GVWR)Diesel All Years 0.01 0.03
Heavy Duty Vehicle (>5751 GVWR) Gasoline - 1981 0.43 0.04
Heavy Duty Vehicle (>5751 GVWR) Gasoline 1982 - 1984 0.42 0.05
Heavy Duty Vehicle (>5751 GVWR) Gasoline 1985 - 1986 0.2 0.05
Heavy Duty Vehicle (>5751 GVWR) Gasoline 1987 0.18 0.09
Heavy Duty Vehicle (>5751 GVWR) Gasoline 1988 - 1989 0.17 0.09
Heavy Duty Vehicle (>5751 GVWR) Gasoline 1990 - 0.12 0.2
Heavy Duty Vehicle (>5751 GVWR) Diesel 1966 - 1982 0.1 0.05
Heavy Duty Vehicle (>5751 GVWR) Diesel 1983 - 1995 0.08 0.05
Heavy Duty Vehicle (>5751 GVWR) Diesel 1996 - 0.06 0.05
Table 30: AB32 CH4 and N2O Emission Factors (California Environmental Protection Agency 2007)

page 71 of 152
6.3 AB32 Summation
The AB32 Summation Sheet is intended to supply all required information to satisfy reporting requirements under AB32. Please note that reporting is obligatory only if emissions exceed 25,000 metric tonnes of carbon dioxide from stationary combustion devices.

page 72 of 152
7 Quality Assurance, Quality Management and Uncertainty Assessment
7.1 Management of uncertainty in Greenhouse Gas Reporting
The Calculator uses company generated activity data and an applied emission factor or a model to determine the estimated Greenhouse Gas emission for each source or sink. This results in two overarching sources of error:
1. Calculator tool error. 2. Activity Data error.
The uncertainty in activity data inputs are not considered as part of this Calculator uncertainty analysis. Our data quality system, described below, deals only with the elements of the Calculator. Companies will need to develop their own Quality Assurance systems to eliminate systemic uncertainty from their activity data inputs. The GHG Protocol on uncertainty assessment in GHG inventories and calculating statistical parameter uncertainty identifies the following sources of uncertainty associated with Greenhouse Gas inventories.
1. Scientific uncertainty. 2. Estimation Uncertainty.
2.1 Model Uncertainty. 2.2 Parameter Uncertainty.
2.2.1 Statistical Uncertainty. 2.2.2 Systematic Uncertainty.
In the Greenhouse Gas Accounting Tool, we have simplified the approach to uncertainty by utilising a quality oriented approach for describing uncertainty.
7.1.1 Scientific Uncertainty
Scientific uncertainty describes the situation where the science of the process is insufficiently understood. As we cannot effectively analyse this uncertainty, no attempt is made to do so. In the Calculator documentation, those elements with a high degree of scientific uncertainty include:
N2O emissions from fertiliser application in vineyards;
Soil carbon sequestration;
Vineyard pruning sequestration;
Vineyard pruning CO2 emissions;
Waste emissions from marc/pomace, stalks and leaves; and
Vineyard trunk sequestration.

page 73 of 152
7.1.2 Estimation Uncertainty
Estimation uncertainty refers to error in estimates whenever Greenhouse Gas emissions are calculated. All estimates contain uncertainty, described as either as model uncertainty or parameter uncertainty.
7.1.3 Model Uncertainty
Model uncertainty is the uncertainty associated with the models used to characterise the relationships between parameters and emission processes. Model uncertainty arises from incorrect or inaccurate mathematical models or inappropriate parameters. We have dealt with model uncertainty by incorporating the quality of each underlying model parameter and assumption into the overall uncertainty assessment system.
7.1.4 Parameter Uncertainty
Parameter uncertainty arises from uncertainty associated with model inputs, such as activity data and emission factors. Parameter uncertainty is analysed by statistical analysis, precision determinations of measurement equipment and expert judgement. As there is a significant element of judgement in estimating some of these uncertainties, it is recognised that there is a degree of subjectivity and that expert judgement has to be relied upon in many instances. Generally, parameter uncertainty is considered the only element that can be effectively managed by companies reporting Greenhouse Gas emissions. Parameter uncertainty is further divided into statistical uncertainty and systemic uncertainty.
7.1.4.1 Parameter Uncertainty – Statistical Uncertainty
Statistical uncertainty results from natural variations such as human errors in the measurement process and fluctuations in measurement equipment. Statistical uncertainty is ignored in the Calculator because the approach of an industry-wide calculator avoids direct measurement of emissions. The approach taken in the Calculator is to use emission factors or emission models that generate effective emission estimates, using activity as the input, not direct measurement.
7.1.4.2 Parameter Uncertainty – Systemic Uncertainty
Systemic Uncertainty occurs if data are systemically biased. Systemic bias can occur as a result of:
Emission factors being constructed from non-representative samples;
Relevant source activities or categories not being identified;
Incorrect or incomplete estimation methods; or
Faulty measurement. Expert judgement can also be a source of systemic bias.

page 74 of 152
It is recommended in the Measurement and Uncertainty Guidance that systemic bias should always be identified and the direction of biases and relative magnitude should be discussed. This will give direction to the quality management of data. Our quality management model is built primarily around the effective analysis of systemic error as this is the critical source of error in an activity based Greenhouse Gas calculation system.
7.2 The IWCC Quality Assurance Approach
The nature of the Calculator as an activity multiplied by emission factor or input into a model, means that a Quality Assurance of data is the most appropriate way of managing uncertainty. This differs from the approach that would be taken if we were using data based on direct measurement of emissions, where the major sources of error are human error and statistical uncertainty. An industry wide tool has many benefits including, ensuring that all measurements are conducted on a uniform basis, that consolidation into reports is simplified and that learning from any user is consolidated into all users during the version rolling process. It also contains all the necessary documentation on:
Description of emission sources;
List of and justification for specific inclusions and exclusions of sources;
Identification of all models and identification factors to be used; and
Identification and discussion of uncertainties in the emission factors and models. In addition, with the further development of the Calculator it will also allow:
Comparative information from previous reporting periods;
Trend analysis against company history and company KPI‟s; and
Trend analysis against industry-wide KPI‟s. The weaknesses are:
The need for underlying activity data to be reliable and consistent; and
The dependence on the model emission factors. Our approach to managing the weaknesses of the system is to:
1. Recommend the implementation of Activity Data Quality Assurance by all users of the Calculator;
2. Recommend the implementation of a continuous improvement program into the Calculator, based on version revision and version improvement to increase the functionality of the system;
3. Rate and document the quality of all emission factors and models used in the Calculator; and
4. Develop systems for effective version roll.
7.2.1 Activity data Quality Assurance
The collection of activity data is considered in The Greenhouse Gas Protocol – a Corporate Accounting and Reporting System Revised Edition to often be the most significant limitation for Greenhouse Gas inventories.

page 75 of 152
Activity data is the responsibility of the Calculator user. Users need to develop and document QA procedures for data collection and recording that fit into their existing QA systems. As a minimum these should include:
Data collection procedures that allow the same data to be effectively collected in future years;
Maintenance of records from previous reporting periods;
Trend analysis of KPI‟s (expected to be included in a future version of the Calculator);
Identification of business targets;
Identification and discussion of the uncertainties in activity data;
Recording events and changes in the business that will have an impact on the Greenhouse Gas data; and
Clear records of any calculations used to arrive at activity data inputs. Quality Assurance is discussed in detail in The Greenhouse Gas Protocol – A Corporate Accounting and Reporting System Revised Edition.
7.2.2 Continuous improvement program for International Wine Carbon Calculator
Continuous improvement is critical to the success of the Calculator. The areas where continuous improvement will be needed in the short-term are:
1. Incorporation of feed-back from users; 2. Sensitivity analysis to determine if all sources currently measured are needed; 3. Functionality; 4. Effective version roll management; 5. Continuous improvement of emission data and models; 6. Ability to conduct trend analysis at company and industry level; 7. Ability to compare with industry KPI‟s; and 8. Ongoing training of users on changes in accounting approaches and
improvements in the Calculator.
7.2.3 Rate and document the quality of all models and emission factors
The continuous improvement of all models and emission factors requires that the baseline data of the Calculator is accurately recorded. The ranking procedure used for models and emission factors is shown in Table 1. In Section 3 all inputs to the Calculator are identified and quantitatively assessed. The X designator is used to note all data that should be prioritised for improvement. Where the designator is an X alone, a placeholder value has been added to the model, but not summed in the final analysis page. In some of the analysis of data quality the ranking of the data is low but no change is recommended. In some cases this is due to the inherent variability of data from this source or the high level of difficulty imposed by improving that data, relative to the overall benefit of a change in data quality.

page 76 of 152
7.2.4 Prioritised elements
The elements prioritised for improvement and marked with X are those that require either:
Additional science to develop effective models or emission factors;
Additional investigation of a technical nature, but not research, to improve emission factors or models;
Input of international data as it becomes available;
Determination of sensitivity to data quality before an assessment is made on the need to improve the data;
Third party validation of data before existing data is certified as meeting the requirements as an input into the Calculator – may include an element of revision of data.

page 77 of 152
Rank Approx.
range in data
Comment
A ± 5% Excellent: Emission Factor (EF) or model based on sound, independent, detailed, and verified data. Underlying LCA thorough and independent. Data sourced from or validated on a range of randomly selected companies. Sourcing, sampling and model testing is adequate to minimise variability and uncertainty to very low levels.
B ± 20% Very Good: EF or model based on sound, independent, detailed and verified data. Underlying LCA thorough and independent. Underlying LCA can be streamlined, but accounts for adequate detail. Data sourced from and validated on a “reasonable” range of companies. Sourcing, sampling and model testing is adequate to minimise variability to low levels.
C ± 50% Good: (Minimum acceptable level in the long-term) EF or model based on “reasonable” and third party independently verified/certified data. Underlying LCA can be a streamlined LCA, but is independently reviewed. Sourcing, sampling and model testing is adequate to minimise variability to moderate levels.
D ± 100% Poor: EF or model based on internal company data. LCA incomplete. Data not third party verified or fails third party verification. Model testing incomplete.
E ± 200% Emission uncertain: LCA data available but basis not available, and/or potentially biased. Existing data/LCA suggest too great a range and a new model for calculation needs to be determined. No independent or third party reviewed data available. Existing data suggests a wide range of uncertainty. Data based on approximations from experts.
F ± > 200% Emission very uncertain: No LCA data available to determine emission factor, or LCA data provides too great a range requiring a model to replace the EF. Data based on potentially biased source and not externally reviewed. Very limited data sources.
X Unknown Cannot be incorporated in model: Science uncertain, placeholder values used in model. No data available. Will benefit significantly from further investigation, analysis or review. Additional investigation required to rank effectively. Data available but from a single or potentially biased source – could be improved if third party reviewed and accredited.
Table 31: Emission Factor ranking used in the IWCC

page 78 of 152
7.3 Ranking of Existing Models and Emission Factors
Component EF or model Rank
Approx. data range
Commentary
Mobile Equipment – Fuel Quantity Based Scope 1
Gasoline / petrol A ± 5% IPCC values, based on fundamental calorific value of fuel. There will be some variation due to regional differences in fuel calorific values.
Kerosene A ± 5% As above.
Diesel A ± 5% As above.
LPG A ± 5% As above.
Bituminous coal A ± 5% As above.
Butane A ± 5% As above.
Propane A ± 5% As above.
Wood, wood waste C ± 50% IPCC values, based on fundamental calorific value of fuel. Wood considered highly variable due to impact of species, burn management and moisture content variability on efficiency as a fuel.
Natural gas A ± 5% As per Gasoline/petrol. Table 32: Fuel Quantity Uncertainty Assessment

page 79 of 152
Mobile Equipment – Distance Based
Small Gasoline Automobile
C ± 50% Typical data for specific range of vehicles from US EPA values. As it uses averaged data over a number of vehicles, the data quality is degraded for simplicity. Service history of vehicles is considered an unaccounted for variable.
Medium Gasoline Automobile
C ± 50% As above.
Large Gasoline Automobile
C ± 50% As above.
LPG Automobile C ± 50% As above.
Mini Van Gasoline C ± 50% As above.
Large Van Gasoline C ± 50% As above.
Light Truck Gasoline C ± 50% As above.
Light Truck Diesel C ± 50% As above.
Heavy Truck Gasoline C ± 50% As above.
Heavy Truck Diesel C ± 50% As above.
Bus Diesel C ± 50% As above.
Motor Cycle Gasoline C ± 50% As above.
Specific Vehicles by model
B ±20% Based on third party US EPA values. Vehicle to vehicle variation and service history reduce the reliability of the data.
Table 33: Distance Based Uncertainty Assessment

page 80 of 152
Stationary combustion – Fuel Quantity based
Gasoline / petrol B ± 20% Stationary combustion values have an inherent error as they are based on Australian Greenhouse Office values for stationary engines using commercial/industrial boiler values. Additional uncertainty to the emission factor is added by the uncertainty on where the equipment is operating on its load curve. These errors are expected to still leave the values at close to ±20% at this stage.
Kerosene B ± 20% As above.
LPG B ± 20% As above.
Natural gas B ± 20% As above.
Diesel B ± 20% As above.
Aviation gasoline B ± 20% As above.
Butane B ± 20% As above.
Propane B ± 20% As above.
Distillate fuel oil B ± 20% As above.
Residual Fuel oil#4 C ± 50% Limited as discussed above, with added uncertainty from the quality variability of the fuel.
Residual Fuel oil#5 C ± 50% As above.
Residual Fuel oil#6 C ± 50% As above.
Lubricants C ± 50% As above.
Anthracite C ± 50% As above.
Bituminous coal C ± 50% As above.
Wood, wood waste D ± 100% Wood considered highly variable due to impact of species, burn management and moisture content variability. The wood data is not considered worth improving due to the CO2 emissions being part of the short-term carbon cycle and the impact being from CH4 and N2O
Table 34: Stationary Combustion Uncertainty Assessment

page 81 of 152
Fugitive Emissions – Halogenated Fluro Carbon Refrigeration Systems
HFC 23 A ± 5% Internationally validated data, low variability in application or calculation method. Based purely on recharge rate, so all error is in activity measures.
HFC 32 A ± 5% As above.
HFC 41 A ± 5% As above.
HFC-43-10mee A ± 5% As above.
HFC-125 A ± 5% As above.
HFC -134a A ± 5% As above.
HFC- 134 A ± 5% As above.
HFC -152a A ± 5% As above.
HFC-143 A ± 5% As above.
HFC-143a A ± 5% As above.
HFC-227ea A ± 5% As above.
HFC-236fa A ± 5% As above.
HFC-245ca A ± 5% As above.
Methane loss from stationary combustion
C/D ± 100% Strongly affected by combustion efficiency and service history. Base data not considered strong.
Refrigeration C ± 50% Default loss based calculations from the Australian Greenhouse Office. There is uncertainty about the rigour of the data and an impact of service history, so this data is slightly down-rated.
Table 35: Fugitive Emissions Uncertainty Assessment

page 82 of 152
Winemaking Practices Calculations *Not Reported*
CO2 used in processing A ± 5% Directly measured input, so error is solely from measurement of activity.
Total CO2 emissions EF A ± 5% Based on a chemical model of fermentation.
Ignores dissolved CO2 in wine. Ignores deviations from ideal fermentation.
Table 36: Wine Making Practices Uncertainty Assessment

page 83 of 152
Vineyard Vine Biomass Photosynthesis
CO2 Sequestered in Sugar Production
E/X ± 200% Based on estimates by a reliable expert. No validation available. Further investigation necessary
CO2 Consumed in Carbohydrate reserves (starch) production
E/X ± 200% As above.
CO2 Sequestered in Permanent structures
E/X ± 200% As above.
CO2 Consumed in Current season's shoots
E/X ± 200% As above.
CO2 Sequestered in Biomass in clusters
E/X ± 200% As above.
Respiration E/X ± 200% As above.
CO2 Consumed in Above Ground Biomass
E/X ± 200% As above.
CO2 Sequestered in Roots
F/X ± >200% Based on informed guess.
Prunings: CO2 Sequestered into Ground
X N/A Requires research – place holders used in model.
Pruning Decomposition CO2 Emitted
X N/A Requires research – place holders used in model.
Table 37: Biomass Photosynthesis Uncertainty Assessment

page 84 of 152
Vineyard Practices
Fertiliser Addition Emissions
F/X ± >200% Based on IPCC calculations. Have reviewed with experts and the current model is poor and needs to be changed. Requires research.
Soil Emission X N/A Wide range in reported data. Current model very difficult to apply. Requires research.
Row Cropping / soil Sequestration
X N/A No model that can be adequately applied. Requires Research. Requires a framework for monitoring soil C changes, impact and continuity of practices if benefit can be effectively modelled.
Table 38: Vineyard Practices Uncertainty Assessment

page 85 of 152
Scope 1 and Scope 3 Waste
Paper and Paper Board C ± 50% AGO Data – source of data uncertain.
Grape Marc, Pommace, grape stalks and stems
E/X ± 200% AGO values for Garden and Park waste used. Inadequate data, if significant following sensitivity analysis additional research will be required.
Vineyard Leafy Waste C ± 50% AGO Data for garden and park waste used, considered an adequate approximation.
Lees F/X > ±200% Approximated as food waste using AGO data. Considered inadequate. Further investigation necessary.
Co-mingled C/X ± 50% AGO data used. Expected to be around ±50%, however it would be useful to understand what is used in this category by users and may require additional work – only if significant following sensitivity analysis.
Vineyard Woody Pruning's
C ± 50% AGO Data for garden and park waste used, considered an adequate approximation.
Metals, Plastics and Glass A ± 5% AGO Data. Has no impact on GHG emissions so error boundaries for GHG emissions are tight.
Wastewater C/X ± 50% Generalised average system based on AGO model. Potentially over-averaged. Based on COD so expected to meet the ±50% level. May be an area for additional on-site monitoring to validate the model.
Recoverable Methane A ± 5% Directly measured. All error will be a result of activity measure error.
Table 39: Scope 1 and 3 Waste Uncertainty Assessment

page 86 of 152
Scope 2 Purchased Electricity & Scope 3 Transmission Losses
Electrical Grid Factors B ±10-20% Based on international data from Peacher and Associates/WRI.
Transmission Losses D/X ± 100% Based on AGO data. Data heavily averaged. As improved data becomes available this needs to be incorporated in the model and an evolutionary process of adopting improved publicly available data will improve the Calculator.
Table 40: Purchased Power Uncertainty Assessment

page 87 of 152
Scope 3 Packaging Emissions
Glass F/X > ± 200%
Considerable data are available for glass, however:
the basis of calculations differ in the detail;
the impact of manufacturing technology on GHG is significant;
the impact of location is significant as some sites may have glass produced on-site and glass purchased on the international market and transported to site;
some newly developed product lines will have lower GHG impact so plant averages will be irrelevant; and
production run length has a significant impact on GHG, so customers can have an impact by increasing order size and utilising generic shapes.
Further work is needed to develop a model for glass. The model basis could include:
plant design basis;
plant design & product weight basis;
individual product run from an individual production facility based model;
transport factors for resold glass; and/or
individual plant average data.
PET E/X ± 200% Some data are available for PET, however:
data lacks independent verification;
sources of data are limited; and
methods of analysis provide too great a range of values. We currently believe that a model may be required for PET based on manufacturing method or individual production facilities based on a verified LCA.
Tetra Brik (1ltr) F/X ± >200% Inadequate data sources. Potential for existing data to be third party validated.
Tetra Prisma (1ltr) F/X ± >200% As above.
Aluminium Cans X N/A Values used in model as placeholders only. Placemarker values based on a generalised Aluminium production model with no can production

page 88 of 152
data available.
Wine bags/ “bag-in-box”, all components
F/X ± >200% Inadequate data sources. Potential for existing data to be third party validated.
Aluminium Screw Cap (35% recycled)
F/X ± >200% Single source of data. Potential for existing data to be third party validated.
Natural Cork & PVC Capsule
F/X ± >200% Scope of LCA data used is currently uncertain and shows significant range depending on the base assumptions of the LCA. New LCA analysis for corks will be becoming available which may change the basis of cork calculations. Potential for existing data to be third party validated. Data used here as initial values assume that the GHG impact starts at bark harvest.
Agglomerate Cork & PVC Capsule
F/X ± >200% As above.
Agglomerate Cork & Aluminium Capsule
F/X ± >200% As above.
Glass Stoppers X There is no model for glass stoppers – model required.
Synthetic Cork X No data available.
ZORK X No data available.
Pallet Pads / Layer Boards
F ± >200% Based on a single company LCA data. Potential for existing data to be third party validated.
6 Pack Cartons F ± >200% As above.
12 Pack Cartons F ± >200% As above.
6 Pack Dividers F ± >200% As above.
12 Pack Dividers F ± >200% As above.
Pallets, non-returnable F/X ± >200% Based on dimensional lumber – need a better model if justified by sensitivity analysis.
Pallets, returnable F/X ± >200% Based on dimensional lumber – need a better model if justified by sensitivity analysis. Assumes infinite recycling in current approach.
Table 41: Scope 3 Packaging Uncertainty Assessment

page 89 of 152
Contract Equipment
Small Helicopter D ± 100% Based on averages from a single type of helicopter from one source. Not currently considered worth improving unless sensitivity analysis shows this to be significantly important.
Medium Helicopter D ± 100% As above.
Large Helicopter D ± 100% As above.
Extra Large Helicopter D ± 100% As above.
Small Tractor – gas/petrol
D ± 100% Based on John Deere equation for conversion of bhp to fuel consumption. Will depend on service history. Will be affected by type variation. Not currently considered worth improving unless sensitivity analysis shows this to be significantly important.
Small Tractor – diesel D ± 100% As above.
Large Tractor – gas/petrol
D ± 100% As above.
Large Tractor – diesel D ± 100% As above. Table 42: Contract Machinery Uncertainty Assessment

page 90 of 152
Scope 3 - Transport
Small Gasoline Automobile
C ± 50% Typical data for specific range of vehicles from US EPA values. As it uses averaged data over a number of vehicles, the data quality is degraded for the sake of simplicity. Would be ranked B, except that service history of vehicles is considered an unaccounted for variable.
Medium Gas Automobile C ± 50% As above.
Large Gasoline Automobile
C ± 50% As above.
LPG Automobile C ± 50% As above.
Mini Van Gasoline C ± 50% As above.
Large Van Gasoline C ± 50% As above.
Light Truck Gasoline C ± 50% As above.
Light Truck Diesel C ± 50% As above.
Heavy Truck Gasoline C ± 50% As above.
Heavy Truck Diesel C ± 50% As above.
Bus Diesel C ± 50% As above.
Motor Cycle Gasoline C ± 50% As above.
Light Commercial Vehicle
C ± 50% Based on LCA work, but data quality degraded due to variation within categories.
Medium Weight Rigid Truck
C ± 50% As above.
Heavy Weight Articulated Truck
C ± 50% As above.
Individual locomotives C ± 50% Based on AGO data. Error bands reflect author uncertainty regarding the impact of load variations on locomotives. Service history considered to be an additional source of variation.
Average locomotive D ± 100% Based on AGO data. High error reflects the 20% variation in data from individual locomotives which are aggregated into the average locomotive.

page 91 of 152
Container ship D ± 100% Shipping values are based on a good database, however published data indicate a high dependence on ship design, condition, service history, age, route management, hull and propeller fouling, ship management, utilisation of cargo space, number of voyages in ballast, speed, weather and currents.
Refrigerated cargo ship D ± 100% As above.
Bulk Dry D ± 100% As above.
RoRo Cargo D ± 100% As above.
Air Freight - Long Haul E ± 200% Model doesn‟t consider the number of take-off and landings. Not currently considered worth improving due to the high level of documentation required to improve the reliability of the number.
Air Freight - Short Haul E ± 200% As above.
Purchased Wine Related Products
Purchase Juice X Currently unknown due to lack of test runs of Calculator model. Model runs in January will develop the data required to conduct sensitivity analysis on these elements of the GHG calculation.
Purchased Wine X As above.
Purchased Spirit X As above.
Bentonite X No data currently available. LCA information needed.
Tartaric Acid X No data currently available. LCA information needed.
Barrels F/X ± 200% No data currently available. LCA information needed. Values for dimensional lumber currently used.
Table 43: Purchased Wine Products Uncertainty Assessment

page 92 of 152
8 User Guidelines
This chapter outlines the necessary information needed for a user to operate version 1.2 of the Calculator. This chapter is not intended to completely detail all calculation methods and sources used in the development of this Calculator. Users should refer to the appropriate section within this report for more detail. The Calculator has been developed to incorporate all aspects of Greenhouse Gas emissions from the wine industry as identified by the Wine Industry Protocol. The Calculator and Protocol are still considered to be in the „development phase‟ and should be treated as an early version requiring future refinement. Specifically, place holder values have been used in areas where further research and understanding is needed. Separate calculation pages have been included in version 1.2 for users to understand their AB32 emissions. These pages have been labelled with an „R‟ prefix.
8.1 General Instructions to the Calculator
Cells shaded green are user entry cells. Users are able to enter numerical values or comments into these cells. Cells shaded with a pale pink are user choice cells. Users are requested to click on the cell and then select a choice from the drop down list. Within the calculation sheet all cells that are not user entry cells or user choice cells are protected to ensure that formulas and values are not accidentally changed or modified. Users who wish to understand the calculation methodology or emission factors are encouraged to consult the appropriate sections of this report. The Excel tabs have been colour coded. Yellow indicates the tabs are introduction and summary in nature, blue indicates that the calculations are part of Scope 1; red indicates the calculations are part of Scope 2 and Green indicates calculations are part of Scope 3. It is intended that this version of the Calculator will stimulate discussion in the following areas:
Ease of use;
Level of detail;
Calculation complexity; and
Inclusion / Exclusion of items; All Calculator pages have red movement buttons in the top right hand corner of the page. The buttons can be used to move „forward‟ or „backward‟. Users are encouraged to use these „forward‟ and „backward‟ buttons to move through the Calculator.
8.2 Calculation Requirements and Outcomes
The required outcomes of the Calculator will be dependent upon the needs of the user. Generally, it is expected that three separate outcomes are likely to be sought via the use of this Calculator. They are:
Understanding carbon footprinting based on the WRI‟s Scope 1 and 2;
Understanding embodied carbon based on PAS 2050; and
Understanding emissions based on the requirements of AB32.

page 93 of 152
It is expected that the Californian users will be particularly interested in understanding emissions based on the requirements of AB32, while Australian, New Zealand and South African users will be interested in carbon footprinting in line with WRI‟s scope 1 and 2. The following flow charts are intended to guide users through the tool based upon their reporting (compulsory or voluntary) requirements.

page 94 of 152
8.3 Flow Chart AB32 Approach
Figure 10: AB32 Flow Chart
Preparatory Work Data Collection Calculation
Collate stationary
combustion fuel
consumed data,
electrical power
consumed data and mobile
equipment fuel data
Categorise Data
according to type and
facility
Complete Sheet R1 AB32
Stationary
Combustion
Refer to the AB32 Summation Sheet
Reporting is compulsory only if
Cell E6 exceeds 25,000. Row 14 will
alert the user to report if necessary.
Can be reported voluntarily
C o m p l e t e A B 3 2 S p e c i f i c P a g e s O n l y
Using the Calculator select the Introduction
sheet: Click on California
Sheet R3 Distance
Based AB32 may be
completed on a voluntary
basis All reportable
information for AB32 is displayed Summation page
Reporting
Sheet R2 Quantity
Based AB32: may be
completed on a voluntary
basis
Complete Sheet 9:
Power Use
Identify Sinks and Sources
Set facility boundary
Identify the facility you wish to analyse
Identify company requirements

page 95 of 152
8.4 Flow Chart Embodied Carbon – PAS 2050 Approach
Figure 11: Embodied Carbon Flow Chart
8.5
Using the International Wine Industry Protocol Identify
boundary locations specific to the company requirements
Preparatory Work Data Collection Calculation Reporting
Identify company requirements
Collate data by
type
Categorise data
according to the
International Wine
Industry
Protocol by Scope
Complete Sheet 1: Mobile
equipment
Use the sum of Scope 1, Scope 2 and Scope 3
Emissions on the General Summation
Sheet
Using the International Wine Industry Protocol identify
carbon equivalent Sinks and Sources
Complete Sheet 2: Mobile
Equipment
Complete Sheet 3:
Stationary Combustion
Complete Sheet 4: Fugitive
Emissions
Complete Sheet 5:
Wine Making
Complete Sheet 6: Biomass
Photosynthesis
Complete Sheet 7: Vineyard Practices
Complete Sheet 8: Waste treatment
Complete Sheet 10: Packaging
Use additional product partitioning practices to determine specific product embodied
carbon
C o m p l e t e a l l S c o p e 1 , S c o p e 2 a n d S c o p e 3 C a l c u l a t i o n P a g e s
Complete Sheet 11: Contract Machinery
Complete Sheet 12: Transport
Complete Sheet 13: Purchased Wine Products
Complete Sheet 14: Scope 3
Waste Treatment
Complete Sheet 9:
Power Use

page 96 of 152
Flow Chart WRI Scope 1 and 2 Approach
Figure 12: WRI Scope 1 & 2 Flow Chart
Preparatory Work Data Collection Calculation Reporting
Collate sources and sinks by type
Categorise by Scope using
the International
Wine Industry Protocol for guidelines
Complete Sheet 1: Mobile equipment
Identify Scope 1 and Scope 2 Emissions
on the General Summation Sheet
Using the International Wine Industry Protocol identify
Sinks and Sources
Complete Sheet 3: Mobile
Equipment
Complete Sheet 5:
Stationary Combustion
Complete Sheet 7: Fugitive
Emissions
Complete Sheet 8: Wine
Making
Complete Sheet 9: Biomass
Photosynthesis
Complete Sheet 10: Vineyard Practices
Complete Sheet 11: Waste treatment
Complete Sheet 12: Power Use
Report Scope 1 and Scope 2 Emissions
Separately
C o m p l e t e a l l S c o p e 1 a n d S c o p e 2 C a l c u l a t i o n P a g e s
Identify company requirements
Identify the facility or enterprise you wish to analyse
Using the International Wine Industry Protocol set
operational and organisational boundaries
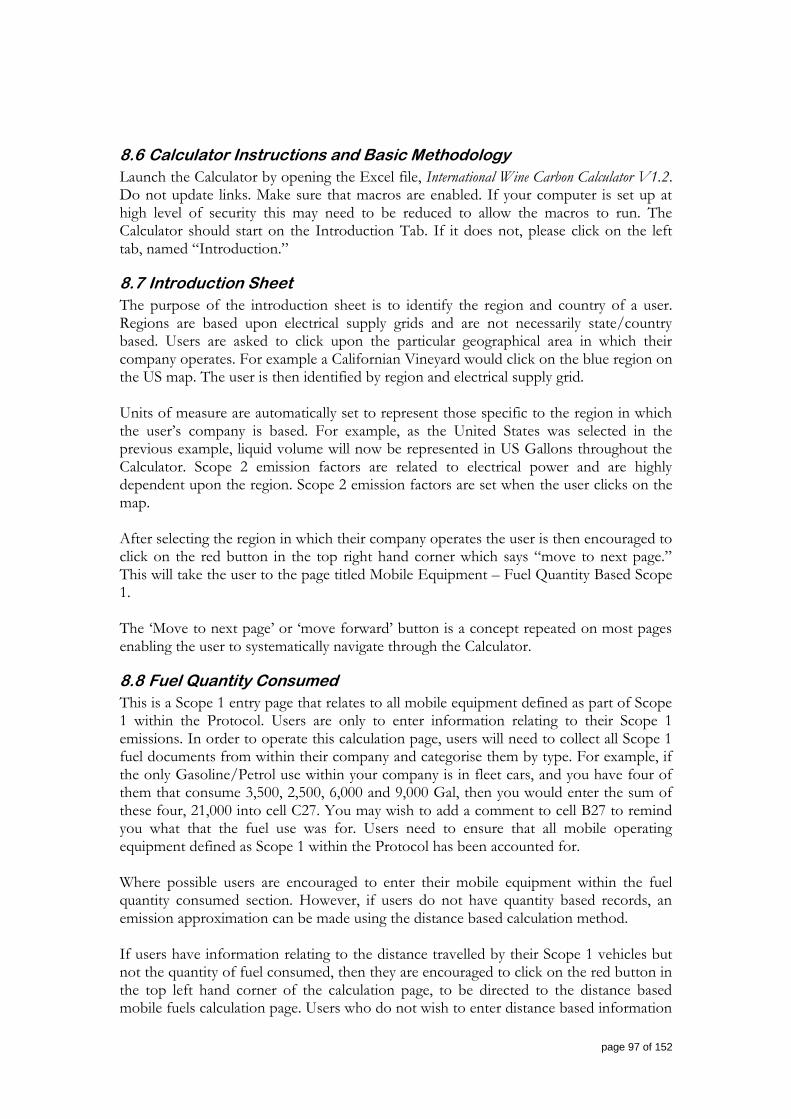
page 97 of 152
8.6 Calculator Instructions and Basic Methodology
Launch the Calculator by opening the Excel file, International Wine Carbon Calculator V1.2. Do not update links. Make sure that macros are enabled. If your computer is set up at high level of security this may need to be reduced to allow the macros to run. The Calculator should start on the Introduction Tab. If it does not, please click on the left tab, named “Introduction.”
8.7 Introduction Sheet
The purpose of the introduction sheet is to identify the region and country of a user. Regions are based upon electrical supply grids and are not necessarily state/country based. Users are asked to click upon the particular geographical area in which their company operates. For example a Californian Vineyard would click on the blue region on the US map. The user is then identified by region and electrical supply grid. Units of measure are automatically set to represent those specific to the region in which the user‟s company is based. For example, as the United States was selected in the previous example, liquid volume will now be represented in US Gallons throughout the Calculator. Scope 2 emission factors are related to electrical power and are highly dependent upon the region. Scope 2 emission factors are set when the user clicks on the map. After selecting the region in which their company operates the user is then encouraged to click on the red button in the top right hand corner which says “move to next page.” This will take the user to the page titled Mobile Equipment – Fuel Quantity Based Scope 1. The „Move to next page‟ or „move forward‟ button is a concept repeated on most pages enabling the user to systematically navigate through the Calculator.
8.8 Fuel Quantity Consumed
This is a Scope 1 entry page that relates to all mobile equipment defined as part of Scope 1 within the Protocol. Users are only to enter information relating to their Scope 1 emissions. In order to operate this calculation page, users will need to collect all Scope 1 fuel documents from within their company and categorise them by type. For example, if the only Gasoline/Petrol use within your company is in fleet cars, and you have four of them that consume 3,500, 2,500, 6,000 and 9,000 Gal, then you would enter the sum of these four, 21,000 into cell C27. You may wish to add a comment to cell B27 to remind you what that the fuel use was for. Users need to ensure that all mobile operating equipment defined as Scope 1 within the Protocol has been accounted for. Where possible users are encouraged to enter their mobile equipment within the fuel quantity consumed section. However, if users do not have quantity based records, an emission approximation can be made using the distance based calculation method. If users have information relating to the distance travelled by their Scope 1 vehicles but not the quantity of fuel consumed, then they are encouraged to click on the red button in the top left hand corner of the calculation page, to be directed to the distance based mobile fuels calculation page. Users who do not wish to enter distance based information

page 98 of 152
can move directly to the Stationary Combustion page by clicking on the appropriate red button in the top right hand corner.
8.9 Distance Travelled
Occasionally organisations may not have complete records kept to indicate the volume of fuel consumed in their Scope 1 mobile operating equipment. In some cases it may be possible to gain some information by understanding the distance travelled. This might come in the form of odometer readings or log book records. It is critical to ensure that companies, who adopt this method and the quantity based method at the same time, do not double count emissions sources. There must be a clear accounting principle to differentiate between the quantity based method and the distance travelled method. In order to use this section of the Calculator, users need to ensure that there are on the Mobile Equipment – Distance Based Page. It is thought that this method will generally be used for cars, rather than plant related equipment such as forklifts and tractors. The pink cells are user choice cells. The user can select the type of car used by clicking on the drop down button. The units should be correct and familiar to the user as they were selected at the introduction page. In Column D users are encouraged to enter the distance travelled against an appropriate description of the vehicle on question. Next, the type of travel is selected, either city or highway, this can be done by using the drop down buttons in Column E. In most cases highway and city travel will have to be partitioned individually for each car. A list of cars is contained within the pink cells, C21:C26, users should be able to find their exact car or a very close approximation to their car.
8.10 Stationary Combustion
Stationary combustion, as defined in the Protocol, is all combustion related activities that occur in fixed items, examples include hot water heaters, boilers and generators. Users are encouraged to collect all fuel receipts and dockets that relate to stationary combustion equipment. The fuel use needs to be categorised and summed by type. Users enter the quantity of fuel used in the combustion device in Column C against the appropriate fuel type. For example, if your operation has 1 boiler and 1 generator that both consume 15,000 Gal (US) of diesel per annum, then you would enter 30,000 into cell C31. You might like to add a comment into cell B31 along the lines of “Boiler and Generator.” All fuels used within stationary combustion devices must be accounted for within this section of the model.
8.11 Fugitive Emissions
Fugitive Emissions are defined as emissions of Greenhouse Gases that arise from leaks or spills. In the case of the wine industry, sources such as refrigeration equipment and gas insulated electrical switchboards are included. Natural gas combustion devices are generally known to emit fugitive emissions from poor pipe work connections. Fugitive emissions from natural gas are calculated automatically based on the amount of natural gas consumed within stationary combustion devices.

page 99 of 152
Two methods are available for users to calculate their fugitive emissions. In both cases users will need to identify the type of gas used within their equipment.
8.11.1 Recharge Weight
Emissions can be quantified by using the annual recharge weight (from service documents) of refrigeration gases. If annual service documents can be traced that show the recharge weight of gas, then users are encouraged to adopt this value rather than the default loss method. The pink cells in Column B are user choice cells; users can select the type of gas within their equipment. Column C is a green user input Column; users are encouraged to enter the annual recharge weight of gas from service documents into this Column.
8.11.2 Default Fugitive Losses
If service documents are not available or do not show the annual recharge weight, then the default loss rate method should be adopted. Users will need to know the total gas weight within their device. This information should be available in the equipment specification documents. Fugitive emissions from natural gas are based on a default emission factors. The amount of gas consumed is imported from the stationary combustion page. Users do not need to enter any values into this section of the Calculator.
8.12 Winemaking Practices
Although part of the short-term carbon cycle, understanding the CO2 produced in the winemaking process is an important part of this Calculator. Users are required to enter:
Volume of fruit;
Typical Press extraction;
Extra juice added to the ferment;
Average Baume;
Residual sugar in the finished wine;
Amount of Malic Acid converted to Lactic Acid; and
Amount of Carbon Dioxide used in the winemaking process. The process has been divided into white, red, sparkling and fortified product. All user entry cells have been coloured green. There is space to make comment in Column H. All that users need to do is enter these data. The carbon dioxide generated from wine making will then be automatically calculated.
8.13 Biomass Photosynthesis
Biomass photosynthesis is also considered part of the short-term carbon cycle but is included within the Calculator to give a better understanding of emission and sink sources within the industry. Users are asked to enter the harvest size of their red, white, sparkling and fortified dedicated fruit. An average Baume of this fruit is also requested in order to calculate the total sugar content. Comments can be made in Column I.
page 100 of 152
8.14 Vineyard Practices
The vineyard practices page has three areas that require user information. The first section is concerned with fertiliser or nitrogen addition. Users are requested to enter the amount of fertiliser into Column B and the nitrogen content of that fertiliser in Column F. Comments can be added to Column A. The second section of this calculation page is concerned with emissions that result from soil cultivation. Users are requested to enter the vineyard area that is cultivated. Land areas are entered into Column B. The third section of this page is concerned with vineyard permanent row cropping. Users are requested to enter the land area of their vineyard that is under permanent row cropping. Land areas are entered into Column B.
8.15 Scope 1 Waste Disposal
Waste disposal is only categorised as part of Scope 1 if it done within your operating boundary. This calculation page has been developed for both solid and liquid waste. Initially users are prompted to enter their solid waste disposal requirements. Users are requested to select the type of waste from the drop down list in Column B. The weight of waste is then to be entered into Column C. A comment can be added to Column A. Users have space to account for various types of solid wastes, each row is to be used for a different type or category of waste. After completing the solid waste section, users complete the waste water section. Users need to understand the following factors involved in their waste water streams:
Volume of waste water;
Source of waste water;
COD (mg/L) of their waste water; and
How much, if any, methane is recovered within the treatment of that waste water (please note that if methane is flared within the waste treatment site, this is comparable with recovery from a Greenhouse Gas perspective).
8.16 Scope 2 Purchased Power
Scope 2 purchased power is clearly defined within the Protocol. It relates to all purchased electricity. As a minimum, users need to enter their annual power consumption into Column D. More than one row has been provided for users to separate their power consumption as most appropriate. Comments and facility or source information can be added to Columns C and A respectively.
8.17 Scope 3 Packaging
Packaging is a complex area to model. There are many subtleties that influence the overall accuracy of the calculations The use of this calculation page is relatively straight forward. Users are required to enter the number of units used in Column D and the average weight of those units into Column E. Comments can be made in Column C.

page 101 of 152
In some cases users may have to calculate their individual unit requirements from bulk information on packaging products. Information has been displayed on a unit basis to allow for easy comparison between different packaging options.
8.18 Scope 3 Contract Machinery
This page is designed to calculate emissions that arise from the use of contract machinery. Two broad categories have been considered, helicopters for frost fighting and tractor or tractor like vineyard equipment including harvesters. In order to estimate the emissions from the use of helicopters, users are prompted for the helicopter size; this can be changed by using the drop down list, in Column C. Users are then asked for the number of hours the helicopter was used for. This information is entered into Column D. Tractor emissions can be calculated in two ways. Users can select either, a large or small tractor, from the user choice cells C20 and C21, or enter the PTO horsepower rating of the equipment. The number of hours the tractors operate is entered into Column D. The fuel type is then selected from Column E.
8.19 Scope 3 Transport
The Scope 3 transport calculation page is the most involved and complex page of this version of the Calculator. The level of complexity reflects the significance of Scope 3 transport in evaluating a carbon footprint. When adopting the freight method of calculation, users will need to know the total freight distance and also the total freight weight. Users are requested to begin with their road based transporting requirements. Please note that it is important to remember that this page is dedicated to Scope 3 only. Users enter the distance travelled into Column C. Users are then requested to choose the type of travel either City travel or Highway travel. This can be done using the choices offered in Column D. In addition, if the transport is road freight related users can adopt this section of the Calculator. Users are required to break down their freighting requirements into type (road, air, rail, and ship), distance and weight. For rail and shipping freight, users have the option to select the specific type of freight train or ship, by using the user choice cells in Column B. For rail freight the “Average Locomotive” setting should be selected when users are uncertain as to the type of locomotive used.
8.20 Scope 3 Purchased Wine Products
This page is designed to estimate the Greenhouse Gas impact of items commonly used in the production of wine. Users can select the purchased product from the drop down lists in Column B. The quantity of product is then entered into Column C. Lastly a description can be added to Column A.

page 102 of 152
8.21 Scope 3 Waste Disposal
Waste disposal is only categorised as part of Scope 3 if the disposal occurs on premises not under the user‟s control. Examples include government controlled landfill sites and municipal waste water treatments sites. User comment cells are shaded green, user choice cells are shaded pink. Initially users are prompted to enter their solid waste disposal requirements. Users are requested to select the type of waste from the drop down list in Column B. The weight of waste is then to be entered into Column C. A comment can be added to Column A. Users have space to account for various types of solid wastes, each row is to be used for a different type or category of waste. After completing the solid waste section users are required to complete the waste water section. Users need to understand the following factors involved in their waste water streams:
Volume of waste water;
Source of waste water;
COD (mg/L) of their waste water; and
How much, if any, methane is recovered within the treatment of that waste water (please note that if methane is flared within the waste treatment site, this is comparable with recovery).
page 103 of 152
9 Bibliography
Department of the Environment and Heritage, Australian Greenhouse Office. AGO Factors and Methods Workbook. Canberra: Australian Greenhouse Office, 2006. Apelbaum Consulting. “Australian Transport Facts.” 2003. Avaiation Management. AIRCRAFT RENTAL AGREEMENT. Agreement, Alaska: US Department of Interior, 2006. British Standards PAS 2050:2008. PAS 2050 - Specification for the measurement of the embodied greenhouse gas emissions in products and services (Draft). London: British Standards Institution, 2007. California Environmental Protection Agency. “Mandatory Reporting of Greenhouse Gas Emissions.” Staff Report: Initial Statement of Reasons for Rulemaking. El Monte: Air Resource Board, 19 October 2007. Camilleri, Cecil. Life Cycle Assesment of Wine and Grape Growing. Angaston, South Australia: Yalumba Wine Company, 2006. CE Delft. Greenhouse Gas Emissions for Shipping and Implementaion Guidance for the Marine Fuel Sulphur Directive. The Netherlands: CE Delft, 2006. Centre for Design. “EcoRecycle Waste Management.” 2004. Centre for Design RMIT University. Life Cycle Assessment Australian Data Inventory Project Summary Report. Melbourne: RMIT University, 1999. Collings, Bill. The British Cikumbia Amateur Winemakers Association (BCAWA). http://www.bcawa.ca/winemaking/ml.htm (accessed December 24, 2007). DEFRA. Guidelines for Companies Reporting on Greenhouse Gas Emissions . London: Department for Environment Food and Rural Affairs, 2005. Department of Climate Change. National Greenhouse Accounts (NGA) Factors. 2008 Edwards, William. Machinery Management, Deere and Company, Moline Illinois. 2006. http://extension.iastate.edu/agdm/crops/html/a32-29.html. Energy Information Administration. Officical Energy Statistics from the US Government. http://eia.doe.gov/ (accessed November 2007). Environment Protection and Heritage Council. The National Packaging Covenant. Environment Protection and Heritage Council, 2005. Fabian Nunez, Fran Pavley. Global Warming Solutions Act. Assembly Bill, California Legislative Council's Digest, 2006. Florence, Daviet. The Greenhouse Gas Protocol Designing a Customized Greenhouse Gas Calculation Tool. Washington, DC: Hopkins Fulfillment Service, 2006.
page 104 of 152
Franklin Associates. Life Cylce Inventory of Container Systems for Wine. Franklin Associates, 2006. Gillenwater, Michael. Calculation Tool for Direct Emissions from Stationary Combustion. Washington DC: World Resources Trust, 2005. Intergovernmental Panel on Climate Change. 2006 IPCC Guidelines for National Greenhouse Gas Inventories. Hayama, Japan: Institute for Global Environmental Stratiges, 2006. Intergovernmental Panel on Climate Change. General Guidance and Reporting. Hayama, Japan: Institute for Global Environmental Strategies , 2006. International Standards ISO 14064:2006. Greenhouse Gases . Switzerland: ISO, 2006. Marthinus Van Schalkwyk, MP. “Notice to establish the national framework in terms of the national environmental management air quality act, 2004.” Government Gazettes. 11 9 2007. http://www.info.gov.za/gazette/notices/2007/30284.pdf (accessed 12 17, 2007). NASA. Teachers' domain. 2007. http://www.teachersdomain.org/resources/tdc02/sci/ess/earthsys/ccycle/index.html (accessed Dec 2007). Parker, Hon. David. “Climate change legislation introduced.” Beehive. 4 12 2007. http://www.beehive.gov.nz/Print/PrintDocument.aspx?DocumentID=31525 (accessed 12 20, 2007). Parker, Hon David. “Policies and initiatives: Principles for action on climate change.” Ministry for the environment. 2007. http://www.mfe.govt.nz/issues/climate/policies-initiatives/principles-action.html (accessed 12 17, 2007). Parliament, Australian. “National Greenhouse and Energy Reporting Act 2007.” 28 9 2007: 64. Pechan, E.H & Associates. Emissions and Generated Resource Integrated Database. US EPA Office of Atmospheric Programs, 2003. Perry. “Perry's Chemical Engineers' Handbook (7th Edition).” By R.H Perry. McGraw-Hill, 1997. RETEC Group. CO2 Emissions from Mobile Sources Version 1.2 WRI-WBCSD GHG Protocol Initiative. June 2003. Schalkwyk, Marthinus van. www.info.gov.za. 22nd November 2007. http://www.info.gov.za/speeches/2007/07112312451002.htm (accessed December 17th, 2007). US EPA . Inventory of US Greenhouse Gas Emissions and Sinks. Washington, DC: US Environmental Protection Agency, 2000.

page 105 of 152
Williams, Larry. “Are Vineyards Environmentally Friendly?” American Vineyard Viticulture and Enology Lab, 1995: 1. World Resources Institue . The Greenhouse Gas Accounting Protocol. Washington, DC: World Business Council For Sustainable Development, 2004.

page 106 of 152
10 Appendices
10.1 Appendix A: Fuel Emission Factors
Type of Fuel kg CO2 per GJ Fuel
Gasoline / petrol 69.25
Kerosene 71.45
Jet Fuel 70.72
Aviation gasoline 69.11
Diesel 74.01
Distillate fuel oil No.1 74.01
Distillate fuel oil No.2 74.01
Residual Fuel oil#4 74.01
Residual Fuel oil#5 77.30
Residual Fuel oil#6 77.30
LPG 63.20
Lubricants 73.28
Anthracite 98.30
Bituminous coal 94.53
Butane 33.12
Propane 62.99
Wood, wood waste 1.73 kg CO2 / kg fuel
Natural gas 56.06 Table 44: Fuel Emission Factors (RETEC Group 2003)

page 107 of 152
10.2 Appendix B: Vehicle Efficiency
Vehicle Type mpg City mpg Hwy
Small Gasoline Automobile 26.00 32.00
Medium Gasoline Automobile 22.00 30.00
Large Gasoline Automobile 18.00 25.00
LPG Automobile 60.00 60.00
Mini Van Gasoline 18.00 24.00
Large Van Gasoline 14.00 18.00
Light Truck Gasoline 14.00 14.00
Light Truck Diesel 15.00 15.00
Heavy Truck Gasoline 6.00 6.00
Heavy Truck Diesel 7.00 7.00
Bus Diesel 6.70 6.70
Motor Cycle Gasoline 60.00 60.00 Table 45: Vehicle Mileage Efficiency (RETEC Group 2003)

page 108 of 152
Model Disp. City MPG Hwy MPG
ACURA MDX 3.7 15 20
ACURA RDX 2.3 17 22
ACURA RL 3.5 16 24
ACURA TL 3.2 18 26
ACURA TSX 2.4 19 28
ASTON MARTIN DB9 5.9 10 16
ASTON MARTIN DB9 Auto 5.9 11 18
ASTON MARTIN DB9 Volante 5.9 10 16
ASTON MARTIN DB9 Volante Auto 5.9 11 17
ASTON MARTIN V8 Vantage 4.3 12 19
ASTON MARTIN V8 Vantage Auto 4.3 13 20
AUDI A3 2 22 29
AUDI A3 3.2 18 25
AUDI A4 2 21 30
AUDI A4 Avant 3.1 17 25
AUDI A4 Cabriolet 3.1 17 25
AUDI A6 3.1 18 27
AUDI A6 Avant 3.1 17 25
AUDI A8 4.2 16 23
AUDI A8 L 4.2 16 23
AUDI A8 L 6 13 19
AUDI Q7 3.6 14 20
AUDI Q7 4.2 12 17
AUDI R8 4.2 13 19
AUDI RS4 4.2 13 20
AUDI RS4 Cabriolet 4.2 12 19
AUDI S4 4.2 14 21
AUDI S4 Avant 4.2 14 21
AUDI S4 Cabriolet 4.2 14 21
AUDI S5 4.2 14 21
AUDI S6 5.2 14 19
AUDI S8 5.2 13 19
AUDI TT Coupe 2 23 31
AUDI TT Roadster 3.2 17 24
BENTLEY Arnage 6.7 9 15
BENTLEY Azure 6.7 9 15
BENTLEY Continental Flying Spur 6 10 17
BENTLEY Continental GT 6 10 17
BENTLEY Continental GTC 6 10 17
BMW 328ci 3 23 31
BMW 328ci Convertible 3 20 30

page 109 of 152
Model Disp. City MPG Hwy MPG
BMW 328i 3 23 31
BMW 328i Sport Wagon 3 19 29
BMW 328xi 3 20 27
BMW 328xi Sport Wagon 3 20 27
BMW 335ci 3 20 28
BMW 335ci Convertible 3 20 28
BMW 335cxi 3 19 27
BMW 335i 3 20 28
BMW 335xi 3 18 27
BMW 528i 3 20 30
BMW 528xi 3 20 27
BMW 535i 3 20 28
BMW 535xi 3 19 27
BMW 535xi Sport Wagon 3 17 25
BMW 550i 4.8 17 25
BMW 650ci 4.8 17 25
BMW 650ci Convertible 4.8 17 25
BMW 750i 4.8 17 25
BMW Alpina B7 4.4 15 23
BMW M5 5 12 18
BMW M6 5 12 18
BMW M6 Convertible 5 12 19
BMW X3 3 19 26
BMW X5 3 17 23
BMW X5 4.8 15 21
BMW Z4 3 23 31
BMW Z4 Coupe 3 20 30
BUGATTI Veyron 8 8 14
BUICK Allure 5.3 16 25
BUICK Enclave 3.6 16 24
BUICK LaCrosse 5.3 16 25
BUICK Lucerne 4.6 15 22
BUICK Terraza 3.9 16 23
CADILLAC CTS 3.6 17 25
CADILLAC DTS 4.6 15 22
CADILLAC Escalade 6.2 12 19
CADILLAC Limousine 4.6 13 18
CADILLAC SRX 3.6 15 22
CADILLAC SRX 4.6 13 20
CADILLAC STS 3.6 17 26
CADILLAC STS 4.4 13 19
CADILLAC STS 4.6 14 21
CADILLAC XLR 4.4 14 21

page 110 of 152
Model Disp. City MPG Hwy MPG
CADILLAC XLR 4.6 15 24
CHEVROLET Avalanche 1500 5.3 14 20
CHEVROLET Avalanche 1500 6 12 17
CHEVROLET Aveo 1.6 24 34
CHEVROLET Aveo 5 1.6 23 32
CHEVROLET Classic 2.2 21 31
CHEVROLET Classic 3.5 18 28
CHEVROLET Cobalt 2.2 24 33
CHEVROLET Cobalt 2.4 22 31
CHEVROLET Colorado 2.9 17 22
CHEVROLET Colorado 3.7 16 22
CHEVROLET Corvette 6.2 16 26
CHEVROLET Corvette 7 15 24
CHEVROLET Equinox 3.4 17 24
CHEVROLET Equinox 3.6 16 24
CHEVROLET Express 2500 5.3 12 16
CHEVROLET Express 3500 4.8 N/A N/A
CHEVROLET Express 3500 6 N/A N/A
CHEVROLET Express 3500 6.2 N/A N/A
CHEVROLET HHR 2.2 20 30
CHEVROLET HHR 2.4 22 28
CHEVROLET Impala 3.5 18 29
CHEVROLET Impala 3.9 13/18 20/28
CHEVROLET Impala 5.3 16 25
CHEVROLET Malibu 2.4 22 30
CHEVROLET Malibu 3.5 18 29
CHEVROLET Malibu 3.6 17 26
CHEVROLET Malibu Hybrid 2.4 24 32
CHEVROLET Silverado 15 4.3 15 20
CHEVROLET Silverado 15 4.8 14 19
CHEVROLET Silverado 15 5.3 15 20
CHEVROLET Silverado 15 6 13 18
CHEVROLET Silverado 25 4.8 N/A N/A
CHEVROLET Silverado 25 6 N/A N/A
CHEVROLET Silverado 35 4.8 N/A N/A
CHEVROLET Silverado 35 6 N/A N/A
CHEVROLET Suburban 1500 5.3 14 20
CHEVROLET Suburban 2500 6 N/A N/A
CHEVROLET Suburban 2500 6.2 N/A N/A
CHEVROLET Tahoe 1500 4.8 14 19
CHEVROLET Tahoe 1500 5.3 11/14 15/20
CHEVROLET Tahoe 1500 6.2 12 19
CHEVROLET Trailblazer 4.2 14 20

page 111 of 152
Model Disp. City MPG Hwy MPG
CHEVROLET Trailblazer 5.3 14 20
CHEVROLET Trailblazer 6 12 16
CHEVROLET Uplander 3.9 12/16 17/23
CHEVROLET Van 1500 4.3 15 20
CHEVROLET Van 1500 5.3 12 16
CHEVROLET Van 2500 4.3 15 20
CHEVROLET Van 2500 5.3 10/13 12/17
CHRYSLER 300 2.7 18 26
CHRYSLER 300 3.5 15 22
CHRYSLER 300 5.7 15 22
CHRYSLER 300 6.1 13 18
CHRYSLER Aspen 4.7 9/14 12/19
CHRYSLER Aspen 5.7 13 19
CHRYSLER Crossfire 3.2 15 23
CHRYSLER Pacifica 3.8 15 22
CHRYSLER Pacifica 4 15 23
CHRYSLER PT Cruiser Convertible 2.4 20 25
CHRYSLER Sebring 2.4 21 30
CHRYSLER Sebring 2.7 13/19 20/27
CHRYSLER Sebring 3.5 15 24
CHRYSLER Sebring Convertible 2.4 20 29
CHRYSLER Sebring Convertible 2.7 13/18 19/26
CHRYSLER Sebring Convertible 3.5 16 26
CHRYSLER SRT-8 2.7 18 26
CHRYSLER SRT-8 3.5 17 24
CHRYSLER SRT-8 5.7 15 23
CHRYSLER SRT-8 6.1 13 18
CHRYSLER Town & Country 3.3 11 17
CHRYSLER Town & Country 3.8 16 23
CHRYSLER Town & Country 4 16 23
DODGE 3500 3.5 N/A N/A
DODGE Avenger 2.4 21 30
DODGE Avenger 2.7 13/19 20/27
DODGE Avenger 3.5 15 24
DODGE Caliber 2 23 27
DODGE Caliber 2.4 21 24
DODGE Caravan 3.3 11/17 17/24
DODGE Caravan 3.8 16 23
DODGE Caravan 4 16 23
DODGE Challenger 6.1 13 18
DODGE Charger 2.7 18 26
DODGE Charger 3.5 17 24
DODGE Charger 5.7 15 22

page 112 of 152
Model Disp. City MPG Hwy MPG
DODGE Charger 6.1 13 18
DODGE Dakota 3.7 15 20
DODGE Dakota 4.7 9/14 12/19
DODGE Durango 3.7 14 19
DODGE Durango 4.7 9/14 12/19
DODGE Durango 5.7 13 19
DODGE Magnum 2.7 18 26
DODGE Magnum 3.5 17 24
DODGE Magnum 5.7 15 23
DODGE Magnum 6.1 13 18
DODGE Nitro 3.7 16 22
DODGE Nitro 4 16 21
DODGE RAM 1500 3.7 14 19
DODGE RAM 1500 4.7 9/13 12/18
DODGE RAM 1500 5.7 N/A N/A
DODGE RAM 2500 5.7 N/A N/A
DODGE RAM 2500 6.7 N/A N/A
DODGE RAM 3500 5.7 N/A N/A
DODGE RAM 3500 6.7 N/A N/A
DODGE Sprinter 2500 3.5 N/A N/A
DODGE Viper 8.4 13 22
DODGE Viper Convertible 8.4 13 22
FERRARI 599 GTB Fiorano 5.9 11 15
FERRARI 612 Scaglietti 5.7 9 16
FORD Crown Victoria FFV 4.6 11/15 16/23
FORD E150 4.6 N/A N/A
FORD E150 5.4 N/A N/A
FORD E250 4.6 N/A N/A
FORD E250 5.4 N/A N/A
FORD E350 5.4 N/A N/A
FORD E350 6.8 N/A N/A
FORD Edge 3.5 16 24
FORD Escape 2.3 20 26
FORD Escape 3 18 24
FORD Escape Hybrid 2.3 34 30
FORD Expedition 5.4 N/A N/A
FORD Explorer 4 14 20
FORD Explorer 4.6 13 20
FORD Explorer Sport Trac 4 14 20
FORD Explorer Sport Trac 4.6 13 20
FORD F150 4.2 14 19
FORD F150 4.6 14 19
FORD F150 5.4 13 17

page 113 of 152
Model Disp. City MPG Hwy MPG
FORD F150 FFV 5.4 9/13 12/17
FORD F150 STX SE 5.4 14 19
FORD F150 STX SE FFV 5.4 10/14 14/19
FORD F150 Supercharged 5.4 12 15
FORD F250 5.4 N/A N/A
FORD F250 6.8 N/A N/A
FORD F350 5.4 N/A N/A
FORD F350 6.8 N/A N/A
FORD Focus 2 24 33
FORD Fusion 2.3 20 28
FORD Fusion 3 17 25
FORD Mustang 4 16 24
FORD Mustang 4.6 15 22
FORD Mustang 5.4 14 20
FORD Ranger 2.3 19 24
FORD Ranger 3 15 20
FORD Ranger 4 15 20
FORD Taurus 3.5 17 24
FORD Taurus X 3.5 16 24
FREIGHTLINER 2500 3.5 N/A N/A
FREIGHTLINER 3500 3.5 N/A N/A
GMC Acadia 3.6 16 24
GMC Canyon 2.9 18 24
GMC Canyon 3.7 16 22
GMC Envoy 4.2 14 20
GMC Envoy 5.3 14 20
GMC Savana 1500 4.3 15 20
GMC Savana 1500 5.3 9/12 12/16
GMC Savana 2500 4.3 15 20
GMC Savana 2500 5.3 10/13 12/17
GMC Savana 3500 4.8 N/A N/A
GMC Savana 3500 6 N/A N/A
GMC Savana 3500 6.2 N/A N/A
GMC Sierra 15 4.3 15 20
GMC Sierra 15 4.8 14 19
GMC Sierra 15 5.3 11/15 15/20
GMC Sierra 15 6 13 18
GMC Sierra 15 6.2 12 19
GMC Sierra 25 4.8 N/A N/A
GMC Sierra 25 6 N/A N/A
GMC Sierra 35 4.8 N/A N/A
GMC Sierra 35 6 N/A N/A
GMC Yukon 1500 4.8 14 19

page 114 of 152
Model Disp. City MPG Hwy MPG
GMC Yukon 1500 5.3 11/14 15/20
GMC Yukon 1500 6 12 17
GMC Yukon 1500 6.2 12 19
GMC Yukon 2500 6 N/A N/A
GMC Yukon 2500 6.2 N/A N/A
HONDA Accord 2.4 21 31
HONDA Accord 3.5 19 29
HONDA Civic 1.8 24 36
HONDA Civic 2 21 29
HONDA Civic Hybrid 1.3 40 45
HONDA CR-V 2.4 20 27
HONDA Element 2.4 20 25
HONDA Fit 1.5 27 34
HONDA Pilot 3.5 16 22
HONDA Ridgeline 3.5 15 20
HONDA S2000 2.2 18 25
HUMMER H2 6 N/A N/A
HUMMER H2 6.2 N/A N/A
HUMMER H3 3.7 14 18
HUMMER H3 5.3 13 16
HYUNDAI Accent 1.6 24 33
HYUNDAI Azera 3.3 18 26
HYUNDAI Azera 3.8 17 26
HYUNDAI Elantra 2 25 33
HYUNDAI Entourage 3.8 16 23
HYUNDAI Santa Fe 2.7 18 24
HYUNDAI Santa Fe 3.3 17 24
HYUNDAI Sonata 2.4 21 30
HYUNDAI Sonata 3.3 19 28
HYUNDAI Tiburon 2 20 27
HYUNDAI Tiburon 2.7 17 24
HYUNDAI Tucson 2 19 25
HYUNDAI Tucson 2.7 18 24
HYUNDAI Veracruz 3.8 16 23
INFINITI FX35 3.5 15 22
INFINITI FX45 4.5 13 17
INFINITI G35 3.5 17 24
INFINITI G35X 3.5 17 23
INFINITI G37 3.7 18 24
INFINITI QX56 5.6 12 18
ISUZU Ascender 4.2 14 20
ISUZU I-290 2.9 18 24
ISUZU I-370 3.7 16 22

page 115 of 152
Model Disp. City MPG Hwy MPG
JEEP Commander 3.7 14 19
JEEP Commander 4.7 9/14 13/19
JEEP Commander 5.7 13 19
JEEP Compass 2 23 27
JEEP Compass 2.4 21 24
JEEP Grand Cherokee 3 18 23
JEEP Grand Cherokee 3.7 15 20
JEEP Grand Cherokee 4.7 9/14 13/19
JEEP Grand Cherokee 5.7 13 19
JEEP Grand Cherokee 6.1 11 14
JEEP Liberty 3.7 16 22
JEEP Patriot 2 23 27
JEEP Patriot 2.4 20 22
JEEP Wrangler 3.8 15 20
KIA Amanti 3.8 17 24
KIA Optima 2.4 21 31
KIA Rio 1.6 25 35
KIA Rondo 2.4 19 26
KIA Rondo 2.7 18 26
KIA Sedona 3.8 16 23
KIA Sorento 3.8 15 21
KIA Spectra 2 24 32
KIA Sportage 2 19 25
KIA Sportage 2.7 17 23
LAMBORGHINI Gallardo Coupe 5 11 17
LAMBORGHINI Gallardo Spyder 5 10 16
LAMBORGHINI Murcielago 6.5 9 14
LAMBORGHINI Murcielago Roadster 6.5 9 14
LAND ROVER LR2 3.2 16 23
LAND ROVER LR3 4.4 12 17
LAND ROVER Range Rover 4.2 12 18
LAND ROVER Range Rover 4.4 12 18
LAND ROVER Range Rover Sport 4.2 12 18
LAND ROVER Range Rover Sport 4.4 12 18
LEXUS ES 350 3.5 19 27
LEXUS GS 460 4.6 17 24
LEXUS GX 470 4.7 14 18
LEXUS IS 250 2.5 20 26
LEXUS IS 350 3.5 18 25
LEXUS LS 460 4.6 16 24
LEXUS LS 460 L 4.6 16 24
LEXUS LS 600HL 5 20 22
LEXUS LX 570 5.7 12 18

page 116 of 152
Model Disp. City MPG Hwy MPG
LEXUS RX 350 3.5 18 23
LEXUS RX 400H 3.3 27 24
LEXUS SC 430 4.3 16 23
LINCOLN Mark LT 5.4 12 16
LINCOLN MKX 3.5 16 24
LINCOLN MKZ 3.5 17 24
LINCOLN Navigator 5.4 N/A N/A
LOTUS Elise 1.8 20 26
LOTUS Exige 1.8 20 26
MASERATI Granturismo 4.2 14 21
MASERATI Quattroporte 4.2 13 19
MAZDA 3 2 23 31
MAZDA 3 2.3 22 29
MAZDA 5 2.3 21 27
MAZDA 6 2.3 21 28
MAZDA 6 3 18 25
MAZDA B2300 2.3 19 24
MAZDA B3000 3 15 20
MAZDA B4000 4 15 20
MAZDA CX-7 2.3 17 23
MAZDA CX-9 3.7 16 22
MAZDA MX-5 2 20 27
MAZDA RX-8 1.3 16 23
MAZDA Tribute 2.3 20 26
MAZDA Tribute 3 18 24
MAZDA Tribute Hybrid 2.3 34 30
MERCEDES-BENZ C300 3 13/18 19/25
MERCEDES-BENZ C350 3.5 17 25
MERCEDES-BENZ CL550 5.5 14 21
MERCEDES-BENZ CL600 5.5 11 17
MERCEDES-BENZ CL63 AMG 6.2 11 18
MERCEDES-BENZ CL65 AMG 5.5 11 17
MERCEDES-BENZ CLK350 3.5 17 25
MERCEDES-BENZ CLK350 Cabriolet 3.5 17 25
MERCEDES-BENZ CLK550 5.5 15 22
MERCEDES-BENZ CLK550 Cabriolet 5.5 15 21
MERCEDES-BENZ CLK63 AMG 6.2 12 19
MERCEDES-BENZ CLK63 AMG Cabriolet 6.2 12 18
MERCEDES-BENZ CLS550 5.5 14 21
MERCEDES-BENZ CLS63 AMG 6.2 12 18
MERCEDES-BENZ E320 Bluetec 3 23 32
MERCEDES-BENZ E350 3.5 17 24

page 117 of 152
Model Disp. City MPG Hwy MPG
MERCEDES-BENZ E550 4Matic 5.5 13 19
MERCEDES-BENZ E550 5.5 15 22
MERCEDES-BENZ E63 AMG 6.2 12 19
MERCEDES-BENZ E63 AMG Wagon 6.2 12 18
MERCEDES-BENZ G500 5 12 15
MERCEDES-BENZ G55 AMG 5.4 11 13
MERCEDES-BENZ GL320 CDI 4Matic 3 18 24
MERCEDES-BENZ GL450 4Matic 4.6 13 18
MERCEDES-BENZ GL550 4Matic 5.5 13 17
MERCEDES-BENZ Maybach 57 5.5 10 16
MERCEDES-BENZ Maybach 57S 6 10 16
MERCEDES-BENZ Maybach 62 5.5 10 16
MERCEDES-BENZ Maybach 62S 6 10 16
MERCEDES-BENZ ML320 CDI 4Matic 3 18 24
MERCEDES-BENZ ML350 4Matic 3.5 15 20
MERCEDES-BENZ ML550 4Matic 5.5 13 18
MERCEDES-BENZ R320 CDI 4Matic 3 18 24
MERCEDES-BENZ R350 3.5 15 20
MERCEDES-BENZ R350 4Matic 3.5 15 19
MERCEDES-BENZ S550 4Matic 5.5 14 20
MERCEDES-BENZ S550 5.5 14 21
MERCEDES-BENZ S600 5.5 11 17
MERCEDES-BENZ S63 AMG 6.2 11 17
MERCEDES-BENZ S65 AMG 6 11 17
MERCEDES-BENZ SL55 AMG 5.4 12 17
MERCEDES-BENZ SL550 5.5 14 21
MERCEDES-BENZ SL600 5.5 11 18
MERCEDES-BENZ SL65 AMG 6 11 18
MERCEDES-BENZ SLK280 3 18 24
MERCEDES-BENZ SLK350 3.5 17 23
MERCEDES-BENZ SLK55 AMG 5.4 14 20
MERCEDES-BENZ SLR 5.4 12 16
MERCURY Grand Marquis FFV 4.6 11/15 16/23
MERCURY Mariner 2.3 20 26
MERCURY Mariner 3 18 24
MERCURY Mariner Hybrid 2.3 34 30
MERCURY Milan 2.3 20 28
MERCURY Milan 3 17 25
MERCURY Mountaineer 4 14 20
MERCURY Mountaineer 4.6 13 20
MERCURY Sable 3.5 17 24
MINI Mini Cooper Convertible 1.6 25 33
MINI Mini Cooper S Convertible 1.6 22 31

page 118 of 152
Model Disp. City MPG Hwy MPG
MITSUBISHI Eclipse 2.4 20 26
MITSUBISHI Eclipse 3.8 17 25
MITSUBISHI Eclipse Spyder 2.4 19 26
MITSUBISHI Eclipse Spyder 3.8 16 24
MITSUBISHI Endeavor 3.8 15 22
MITSUBISHI Galant 2.4 20 27
MITSUBISHI Galant 3.8 17 25
MITSUBISHI Lancer 2 22 29
MITSUBISHI Outlander 3 17 25
MITSUBISHI Raider 3.7 15 20
MITSUBISHI Raider 4.7 9/14 12/19
NISSAN 350Z 3.5 17 24
NISSAN 350Z Roadster 3.5 17 23
NISSAN Altima 2.5 23 31
NISSAN Altima 3.5 19 26
NISSAN Altima Hybrid 2.5 35 33
NISSAN Armada 5.6 9/12 13/18
NISSAN Frontier 2.5 17 22
NISSAN Frontier 4 15 20
NISSAN Maxima 3.5 19 25
NISSAN Pathfinder 4 15 22
NISSAN Pathfinder 5.6 13 18
NISSAN Quest 3.5 16 24
NISSAN Rogue 2.5 22 27
NISSAN Sentra 2 25 33
NISSAN Sentra 2.5 24 30
NISSAN Titan 5.6 9/12 13/17
NISSAN Versa 1.8 27 33
NISSAN Xterra 4 15 20
PONTIAC G5 2.2 22 31
PONTIAC G5 2.4 22 31
PONTIAC G6 2.4 22 30
PONTIAC G6 3.5 18 29
PONTIAC G6 3.6 17 26
PONTIAC G6 3.9 15 22
PONTIAC Grand Prix 3.8 18 28
PONTIAC Grand Prix 5.3 16 25
PONTIAC Pursuit 2.2 22 31
PONTIAC Pursuit 2.4 22 31
PONTIAC Solstice 2 19 26
PONTIAC Solstice 2.4 19 24
PONTIAC Torrent 3.4 17 24
PONTIAC Torrent 3.6 16 24

page 119 of 152
Model Disp. City MPG Hwy MPG
PONTIAC Vibe 1.8 25 31
PORSCHE 911 GT3 3.6 15 22
PORSCHE 911 GT3 RS 3.6 15 22
PORSCHE 911 Turbo 3.6 15 23
PORSCHE 911 Turbo Cabriolet 3.6 15 23
PORSCHE Boxster 2.7 19 26
PORSCHE Boxster S 3.4 18 25
PORSCHE Carrera Cabriolet 3.6 17 24
PORSCHE Carrera Coupe 3.6 17 24
PORSCHE Carrera Targa 3.6 17 24
PORSCHE Cayenne 3.6 14 20
PORSCHE Cayenne S 4.8 13 19
PORSCHE Cayenne Turbo 4.8 12 19
PORSCHE Cayman 2.7 19 26
PORSCHE Cayman S 3.4 18 25
ROLLS-ROYCE Phantom 6.7 13 19
ROUSH Stage 3 F150 5.4 11 15
ROUSH Stage 3 Mustang 4.6 15 20
SAAB 9-3 Convertible 2 18 24
SAAB 9-3 Convertible 2.8 15 24
SAAB 9-3 Sport Sedan 2 19 26
SAAB 9-3 Sport Sedan 2.8 15 24
SAAB 9-3 Sportcombi 2 18 24
SAAB 9-3 Sportcombi 2.8 15 24
SAAB 9-5 2.3 17 26
SAAB 9-5 Sportcombi 2.3 17 26
SAAB 9-7X 4.2 14 20
SAAB 9-7X 5.3 13 19
SAAB 9-7X 6 12 16
SATURN Aura 2.4 22 30
SATURN Aura 3.5 18 29
SATURN Aura 3.6 17 26
SATURN Aura Hybrid 2.4 24 32
SATURN Outlook 3.6 16 24
SATURN Sky 2 19 26
SATURN Sky 2.4 19 24
SATURN Vue 2.4 19 26
SATURN Vue 3.5 15 22
SATURN Vue 3.6 16 23
SHELBY Mustang GT 4.6 15 22
SUBARU Forester 2.5 20 26
SUBARU Impreza 2.5 20 25
SUBARU Impreza Wagon 2.5 20 25

page 120 of 152
Model Disp. City MPG Hwy MPG
SUBARU Legacy 2.5 20 27
SUBARU Legacy 3 17 24
SUBARU Outback Sport 2.5 20 25
SUBARU Outback Wagon 2.5 20 26
SUBARU Outback Wagon 3 17 24
SUBARU Tribeca 3.6 16 21
SUZUKI Forenza 2 19 28
SUZUKI Forenza Wagon 2 19 27
SUZUKI Grand Vitara 2.7 17 22
SUZUKI Reno 2 19 28
SUZUKI SX4 2 23 31
SUZUKI XL7 3.6 16 22
TOYOTA 4Runner 4 16 21
TOYOTA 4Runner 4.7 15 19
TOYOTA Avalon 3.5 19 28
TOYOTA Camry 2.4 21 31
TOYOTA Camry 3.5 19 28
TOYOTA Camry Hybrid 2.4 33 34
TOYOTA Corolla 1.8 26 35
TOYOTA FJ Cruiser 4 16 20
TOYOTA Highlander 3.5 18 24
TOYOTA Highlander Hybrid 3.3 27 25
TOYOTA Land Cruiser 5.7 13 18
TOYOTA Matrix 1.8 25 31
TOYOTA Prius 1.5 48 45
TOYOTA RAV4 2.4 21 27
TOYOTA RAV4 3.5 19 27
TOYOTA Scion TC 2.4 21 29
TOYOTA Scion XB 2.4 22 28
TOYOTA Scion XD 1.8 26 32
TOYOTA Sequoia 4.7 14 17
TOYOTA Sequoia 5.7 14 19
TOYOTA Sienna 3.5 17 23
TOYOTA Solara 2.4 22 31
TOYOTA Solara 3.3 18 27
TOYOTA Solara Convertible 3.3 18 26
TOYOTA Tacoma 2.7 19 25
TOYOTA Tacoma 4 16 20
TOYOTA Tundra 4 15 19
TOYOTA Tundra 4.7 14 17
TOYOTA Tundra 5.7 14 18
TOYOTA Yaris 1.5 29 35
VOLKSWAGEN Eos 2 21 30

page 121 of 152
Model Disp. City MPG Hwy MPG
VOLKSWAGEN Eos 3.2 19 26
VOLKSWAGEN GTI 2 22 29
VOLKSWAGEN Jetta 2 22 29
VOLKSWAGEN Jetta 2.5 21 29
VOLKSWAGEN Jetta Wagon 2.5 21 29
VOLKSWAGEN New Beetle 2.5 20 29
VOLKSWAGEN New Beetle Convertible 2.5 20 28
VOLKSWAGEN Passat 2 19 28
VOLKSWAGEN Passat 3.6 16 24
VOLKSWAGEN Passat Wagon 2 20 28
VOLKSWAGEN Passat Wagon 3.6 16 24
VOLKSWAGEN R32 3.2 18 23
VOLKSWAGEN Rabbit 2.5 21 29
VOLKSWAGEN Touareg 3.6 14 20
VOLKSWAGEN Touareg 4.2 12 17
VOLKSWAGEN Touareg 5 15 20
VOLVO C30 2.4 20 28
VOLVO C30 2.5 19 27
VOLVO C70 Convertible 2.5 18 26
VOLVO S40 2.4 20 28
VOLVO S40 2.5 18 26
VOLVO S60 2.4 18 26
VOLVO S60 2.5 17 26
VOLVO S80 3 15 23
VOLVO S80 3.2 16 24
VOLVO S80 4.4 15 23
VOLVO V50 2.4 20 28
VOLVO V50 2.5 18 26
VOLVO V70 3.2 16 24
VOLVO XC 70 3.2 15 22
VOLVO XC 90 3.2 14 20
VOLVO XC 90 4.4 13 19
Table 46: Various Passenger Vehicles and Fuel Efficiencies (US EPA 2000)
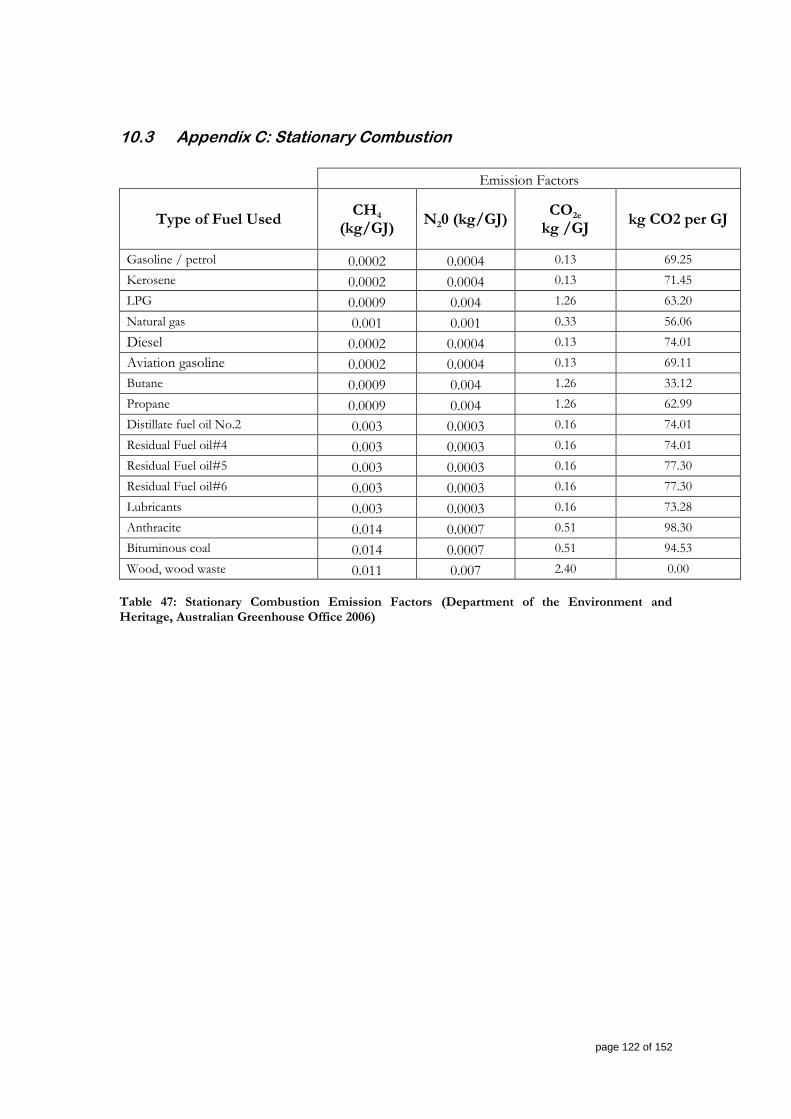
page 122 of 152
10.3 Appendix C: Stationary Combustion
Emission Factors
Type of Fuel Used CH4
(kg/GJ) N20 (kg/GJ)
CO2e kg /GJ
kg CO2 per GJ
Gasoline / petrol 0.0002 0.0004 0.13 69.25
Kerosene 0.0002 0.0004 0.13 71.45
LPG 0.0009 0.004 1.26 63.20
Natural gas 0.001 0.001 0.33 56.06
Diesel 0.0002 0.0004 0.13 74.01
Aviation gasoline 0.0002 0.0004 0.13 69.11
Butane 0.0009 0.004 1.26 33.12
Propane 0.0009 0.004 1.26 62.99
Distillate fuel oil No.2 0.003 0.0003 0.16 74.01
Residual Fuel oil#4 0.003 0.0003 0.16 74.01
Residual Fuel oil#5 0.003 0.0003 0.16 77.30
Residual Fuel oil#6 0.003 0.0003 0.16 77.30
Lubricants 0.003 0.0003 0.16 73.28
Anthracite 0.014 0.0007 0.51 98.30
Bituminous coal 0.014 0.0007 0.51 94.53
Wood, wood waste 0.011 0.007 2.40 0.00
Table 47: Stationary Combustion Emission Factors (Department of the Environment and Heritage, Australian Greenhouse Office 2006)

page 123 of 152
10.4 Appendix D: Fugitive Emissions
Species Chemical Formula 100 years
CO2 CO2 1
Methane CH4 21
Nitrous Oxide N2O 310
HFC-23 CHF3 11700
HFC 32 CH2F2 650
HFC 41 CH3F 150
HFC-43-10mee C5H2F10 1300
HFC-125 C2HF5 2800
HFC- 134 C2H2F4 1000
HFC -134a CH2FCF3 1300
HFC -152a C2H4F2 140
HFC -143 C2H3F3 300
HFC-143a C2H3F3 3800
HFC-227ea C3HF7 2900
HFC-236fa C3H2F6 6300
HFC-245ca C3H3F5 560
Sulphur hexafluoride SF6 23900
Perfluoromethane CF4 6500
Perfluoroethane C2F6 9200
Perfluoropropane C3F8 7000
Perfluorobutant C4F10 7000
Perfluorocyclobutane c-C4F8 8700
Perfluoropentane C5F12 7500
Perfluorohexane C6F14 7400 Table 48: Gas Species Global Warming Potential (Department of the Environment and Heritage, Australian Greenhouse Office 2006)

page 124 of 152
10.5 Appendix E: Electrical Generation Emission Factors
State
Emissions Factor (grams of CO2/ kWh)
Scope 2 Generation
Scope 3 Transmission
and Distribution
South Australia 840 140
Western Australia 870 100
Northern Territory 690 110
Queensland 910 130
New South Wales and ACT 890 170
Victoria 1220 80
Tasmania 120 10 Table 49: Australian grid electrical power Emission Factors (Department of Climate Change, 2008)
Area Emissions Factor (grams of CO2/
kWh)
United States Scope 2
ASCC
ASCC Alaska Grid 635.0164128
ASCC Miscellaneous 343.7444304
ECAR
ECAR Michigan 740.3006016
ECAR Ohio Valley 892.0166472
ERCOT All 638.7921792
FRCC All 630.522144
HICC
HICC Miscellaneous 772.4472336
HICC Oahu 780.9599448
MAAC All 497.850948
MAIN
MAIN North 798.830424
MAIN South 561.2338368
MAPP All 834.09102
Off-Grid 774.1654704
NPCC
NPCC Long Island 752.8689504
NPCC New England 406.9277352
NPCC NYC/Westchester 494.4847824
NPCC Upstate NY 382.4024904
SERC
SERC Mississippi Valley 603.893556
SERC South 708.298668

page 125 of 152
SERC Tennessee Valley 622.6558128
SERC Virginia/Carolina 528.0779448
SPP
SPP North 912.2562792
SPP South 878.4658008
WECC
WECC California 364.9407048
WECC Great Basin 386.6091768
WECC Pacific Northwest 304.3855584
WECC Rockies 849.3696288
WECC Southwest 645.9046272
Australia
South Australia 865
Western Australia 840
Northern Territory 682
Queensland 903
New South Wales 893
Victoria 1239
Tasmania 50
New Zealand
North Island 595*
South Island 595*
Africa
South Africa 1200
Rest of Africa 1800 Table 50: Other Electrical Power Emission Factors (Pechan, E.H & Associate 2003)
10
10 ** Source: U.S. Department of Energy, Energy Information Administration Form EIA – 1605 (2007)

page 126 of 152
10.6 Appendix F: Packaging Emission Factors
Packaging Materials
NET Global Warming Potential T CO2-e (GHG)
Glass 2.2
PET 3.223776224
Tetra Brik (1ltr) 2.255172414
Tetra Prisma (1ltr) 2.310559006
Aluminum Cans PH
Aluminum component 15.04
Plastic component 1.235
Paper - cartons 1.792
S-cap (35% recycled) 10.633
Natural Cork & PVC Capsule 2.49
Agglomerate Cork & PVC Capsule 4.253
Agglomerate Cork & Aluminum Capsule 4.863
Glass Stoppers PH
Synthetic Cork PH
ZORK PH
Pallet Pads / Layer Boards 1.792
6 Pack Cartons 1.792
12 Pack Cartons 1.792
6 Pack Dividers 1.792
12 Pack Dividers 1.792
pallets, non-returnable 0.679340407
pallets, returnable 0.0 Table 51: Packaging Emission Factors

page 127 of 152
10.7 Appendix G: Transport Emission Factors
Vehicle Type EF (Kg CO2/ L)
Small Gasoline Automobile 2.3822
Medium Gasoline Automobile 2.3822
Large Gasoline Automobile 2.3822
LPG Automobile 1.57368
Mini Van Gasoline 2.3822
Large Van Gasoline 2.3822
Light Truck Gasoline 2.3822
Light Truck Diesel 2.745771
Heavy Truck Gasoline 2.3822
Heavy Truck Diesel 2.745771
Bus Diesel 2.745771
Motor Cycle Gasoline 2.3822
Table 52: Road Based Transport Emission Factors (RETEC Group 2003) New transport emission factors are missing
Ship Type kg CO2 Tonne Km
LNG Tanker 0.039629
Tanker (chemical) 0.014004
Tanker (crude) 0.004767
Bulk Dry 0.004529
Container 0.01454
Refrigerated Cargo 0.074073
RoRo Cargo (Small) 0.056553
RoRo Cargo (Large) 0.02
Tanker (small) 0.04 Table 53: Ship Based Transport Emission Factors (CE Delft 2006)
Train Model EF( kgCO2 / Tonne
km)
EMD SD-40 0.029578
EMD SD-60 0.026284
EMD SD-70 0.025544
EMD - SD75 0.024671
GE Dash 8 0.026284
GE Dash 9 0.025746
2TE116 0.025679
2TE10M 0.027091
TEII60 0.028301
TEII70 0.025343
Average Locomotive 0.026452
Table 54: Rail Based Emission Factors (Department of the Environment and Heritage, Australian Greenhouse Office 2006)

page 128 of 152
10.8 Appendix H: Full Size Diagrams Supply Chains
Figure 13: Vineyard Supply Chain - Full Size

page 129 of 152
Figure 14: Industry Supply Chain - Full Size

page 130 of 152
Figure 15: Vineyard Scope Boundaries - Full Size

page 131 of 152
Figure 16: Winery Scope Boundaries - Full Size

page 132 of 152
Figure 17: Packaging Centre Scope Boundaries - Full Size

page 133 of 152
Figure 18: Vineyard and Winery Scope Boundaries - Full Size

page 134 of 152
Figure 19: Vineyard, Winery and Packaging Centre Scope Boundaries - Full Size

page 135 of 152
10.9 Appendix I: Excel Calculator

page 136 of 152
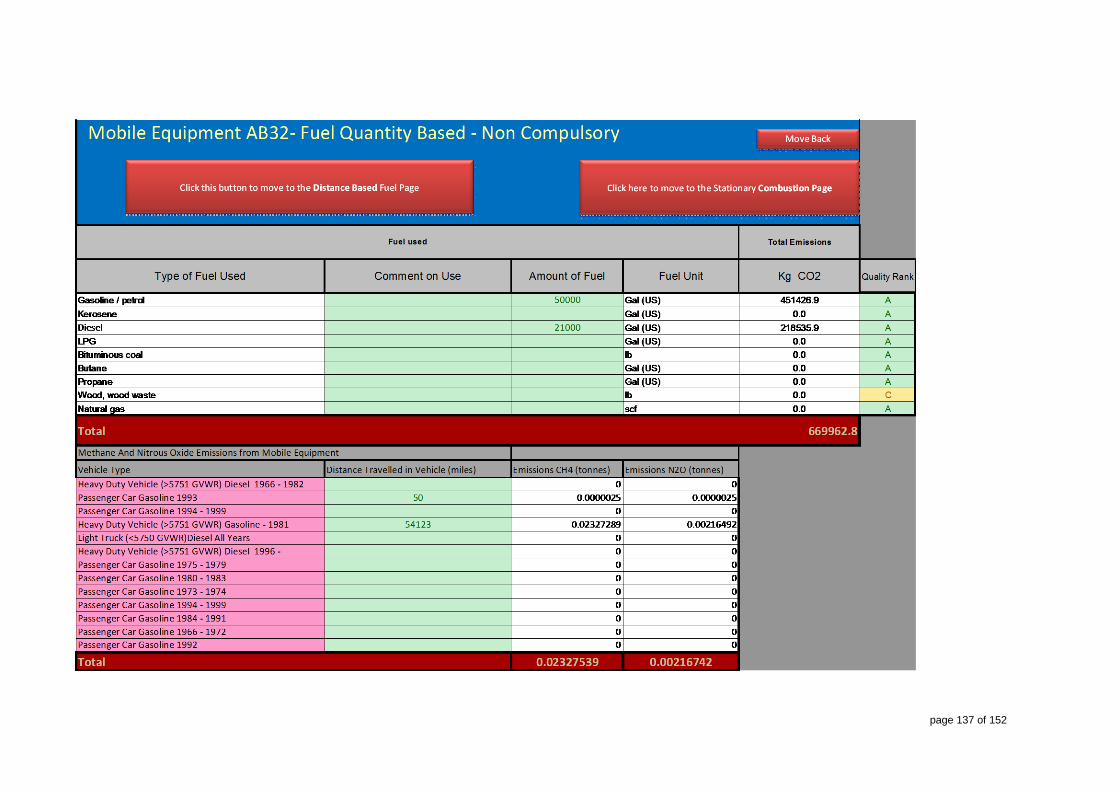
page 137 of 152

page 138 of 152

page 139 of 152

page 140 of 152

page 141 of 152

page 142 of 152

page 143 of 152
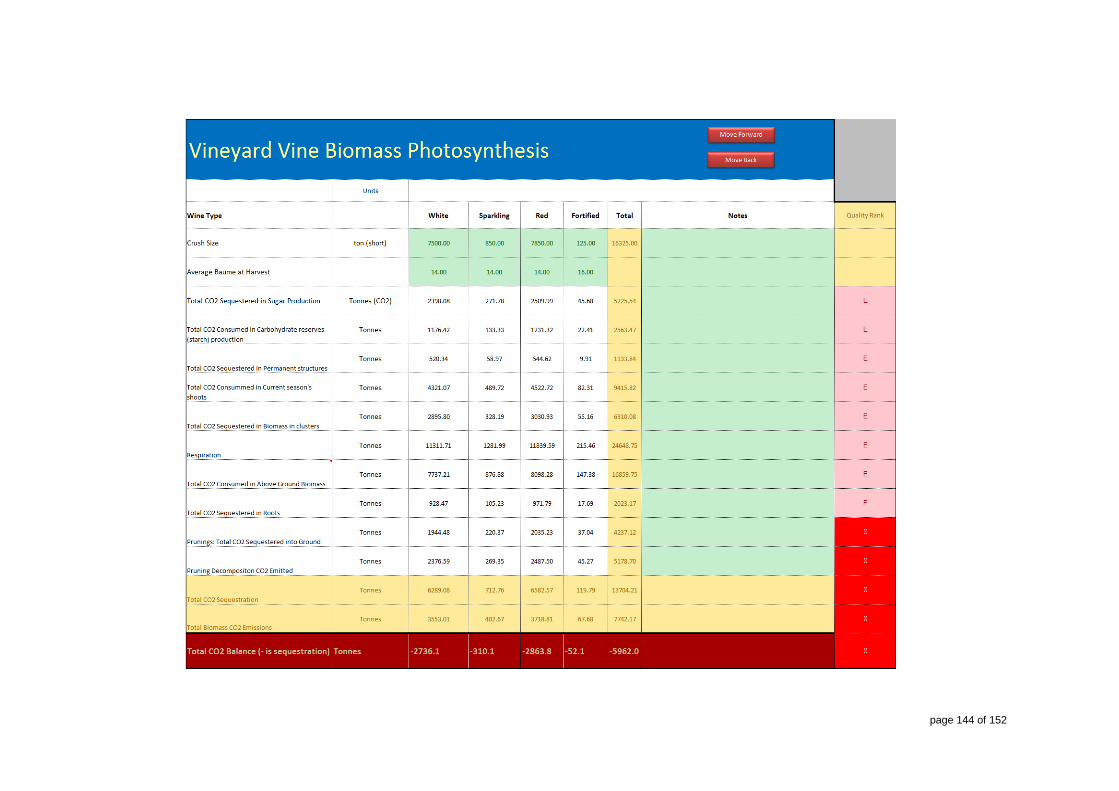
page 144 of 152

page 145 of 152
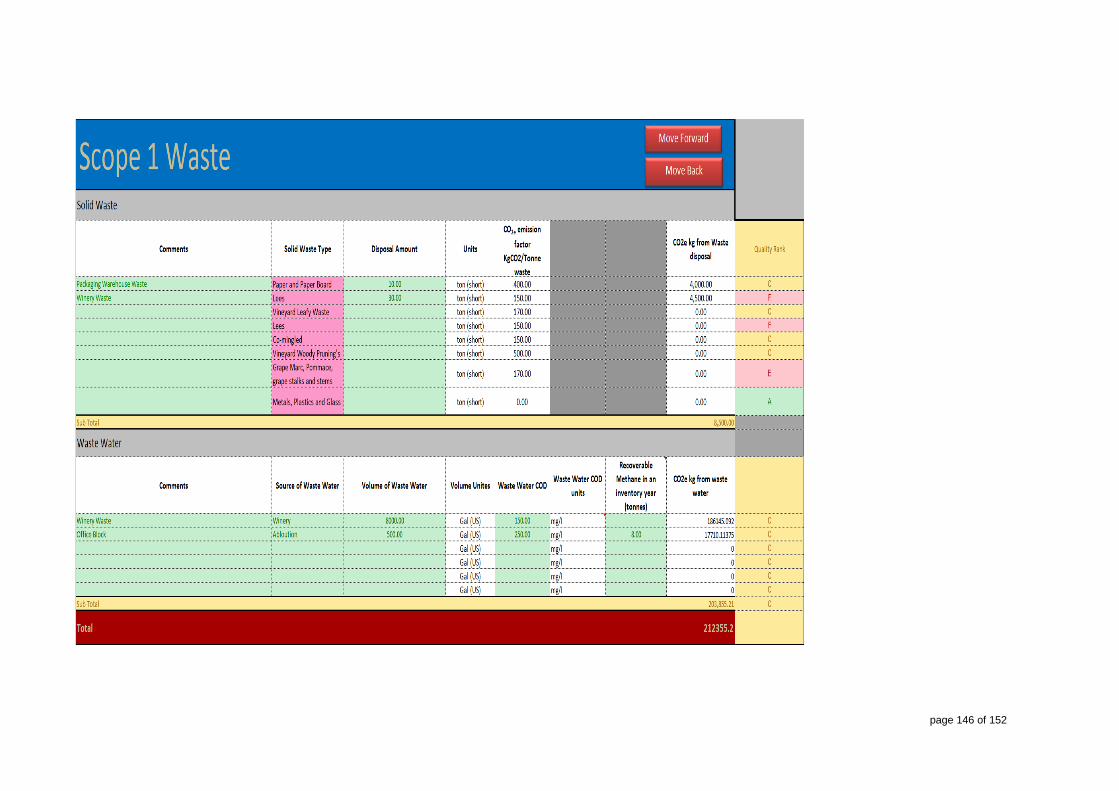
page 146 of 152

page 147 of 152

page 148 of 152

page 149 of 152

page 150 of 152
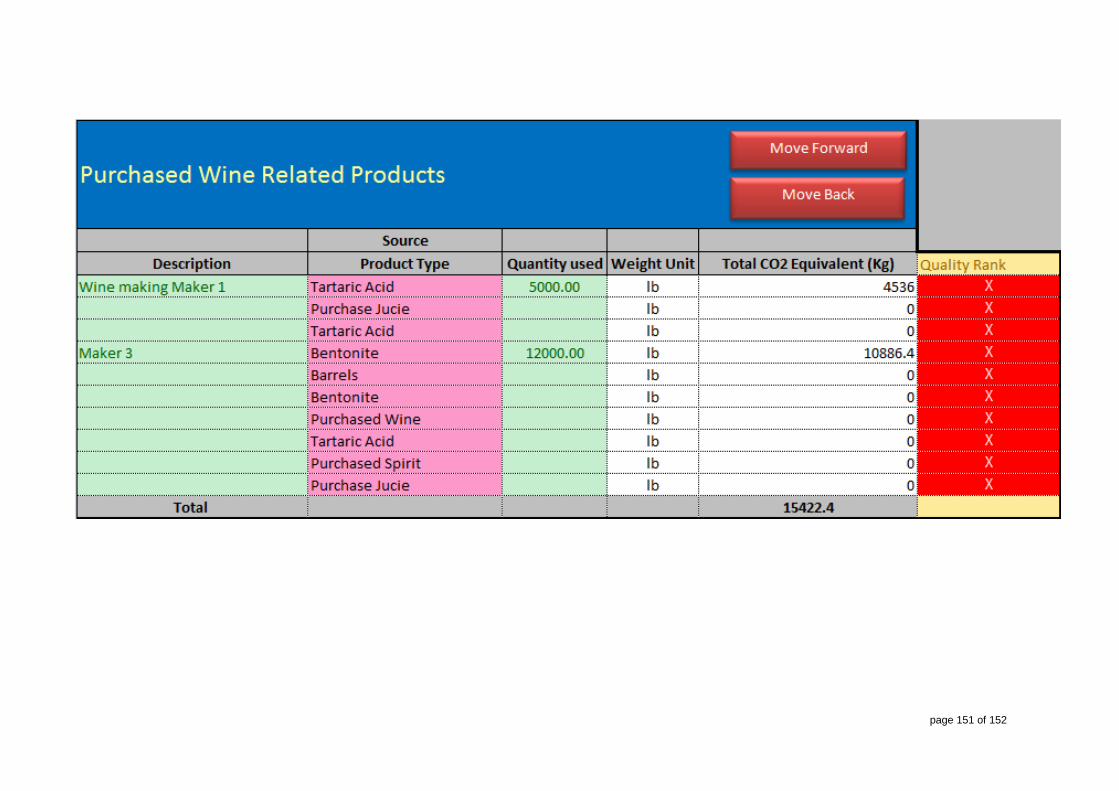
page 151 of 152

page 152 of 152


